45
VEGETATION RESPONSE TO SLASHBURNING: PROGRESS REPORT A 3-YEAR 634.909 7ll KMF RES IWIFR 39 c.2 1 cooperative project between the Ministry of Environment and the Ministry of Forests
| Date post: | 09-Jul-2018 |
| Category: |
Documents |
| Upload: | trinhkhuong |
| View: | 219 times |
| Download: | 0 times |

VEGETATION RESPONSE TO SLASHBURNING:
PROGRESS REPORT A 3-YEAR
634.909 7ll
KMF RES IWIFR 39 c.2
1 cooperative project between the Ministry of Environment and the Ministry of Forests

VEGETATION RESPONSE TO SLASHBURNING: A 3-YEAR PROGRESS REPORT
by
Leslie D. Peterson
B.C. Ministry of Forests Research Branch
31 Bastion Square Victoria, B.C.
V8W 3E7
June 1989

This publication is IWIFR-39
B.C. Ministry of Forests, Research Branch
B.C. Ministry of Environment, Wildlife Bulletin 8-62
This project is jointly funded and direct by the B.C. Ministries of Environment and Forests
Copies of this report may be obtained, depending upon supply, from:
Research Branch B.C. Ministry of Forests 31 Bastion Square Victoria, B.C. vaw 3 ~ 7
or
Wildlife Branch B.C. Ministry of Environment 780 Blanshard Street Victoria, B.C. vav 1x5
The contents of this report may not be cited in whole or in part without the approval of the Director of Research, B.C. Ministry of Forests, Victoria.
Citation:
Peterson, L.D. 1989. Vegetation response to slashburning: a3-year progress report. Research, B.C. Ministry of Environment and B.C. Ministry of Forests. IWIFR-39. Victoria, B.C.
This report documents initial findings on the response of vegetation to different intensities of slashburning on fire-sensitive sites. The study sites were 3-year-old clearcuts at mid-elevation on Vancouver Island, British Columbia. Two fire intensities plus an unburned comparison were replicated in a balanced, incomplete block design. Ocular estimates of percent cover of all ground forage were conducted prior to treatment and 1 and 2 years after burning.
The unburned treatment showed increases in virtually all species over the three sampling periods. Most species that survived the burn also increased in ground coverage by the 2nd year after burning. Post-burn abundance of shrubs and conifer seedlings was significantly lower than before the burn, although mean treatment differences were significant only for red huckleberry (Vaccinium Darvifolium). Both burn intensities, however, eliminated all amabilis fir and western hemlock seedlings. Post-burn shrub cover values were consistently higher on a light impact burn than on a heavy impact burn. Evergreen shrub coverage (mainly salal (Gaultheria shallon) and dull Oregon-grape (Mahonia nervosa)) reached pre-burn levels in the 2nd year after treatment on a light impact burn, while attaining only 16% of pre-burn abundance on a high impact burn. In contrast, burning appeared to have little effect on herb abundance. Herb cover increased each year, but only one species (Mvcelis muralis) showed significant treatment differences. Fireweed (Epilobium aneustifolium) was the most abundant herb, with significant annual increases in ground coverage, but other species were also invading the sites.
Ill ...

ACKNOWLEDGEMENTS
I wish to thank W. Beese, silviculturist, MacMillan Bloedel Ltd., for providing the opportunity for this project and for supplying additional information on the study sites and treatments. I am also grateful for the valuable advice on analysis procedures provided by W. Bergerud, Ministry of Forests statistician.
iv
TABLE OF CONTENTS
... ABSTRACT . . . . . . . . . . . . . . . . . . . . . . . . . . m ACKNOWLEDGEMENTS . . . . . . . . . . . . . . . . . . . . . iv
1 INTRODUCTION . . . . . . . . . . . . . . . . . . . . . . 1
1.1 Objective and Study Area . . . . . . . . . . . . . . . . . . 1
1.2 Study Design . . . . . . . . . . . . . . . . . . . . . . . 2
1.3 Techniques . . . . . . . . . . . . . . . . . . . . . . . 2
1.4 Analysis . . . . . . . . . . . . . . . . . . . . . . . . 5
2 RESULTS . . . . . . . . . . . . . . . . . . . . . . . . . 9
2.1 Slashburn Intensity . . . . . . . . . . . . . . . . . . . . . 9
2.2 Species Number . . . . . . . . . . . . . . . . . . . . . . 12
2.3 Species Abundance . . . . . . . . . . . . . . . . . . . . . 13
2.3.1 Conifers . . . . . . . . . . . . . . . . . . . . . . 13
2.3.2 Deciduous shrubs . . . . . . . . . . . . . . . . . . . 14
2.3.3 Evergreen shrubs . . . . . . . . . . . . . . . . . . . 17
2.3.4 Herbs . . . . . . . . . . . . . . . . . . . . . . . 19
2.3.5 Other species groups . . . . . . . . . . . . . . . . . . 20
3 DISCUSSION . . . . . . . . . . . . . . . . . . . . . . . . 22
4 REFERENCES . . . . . . . . . . . . . . . . . . . . . . . 23
APPENDICES
1 Vegetation sampling notes . . . . . . . . . . . . . . . . . . . . 24
3 Percent cover means for Sproat Lake plots . . . . . . . . . . . . . . 27 2 List of species code and scientific and common names used in this report . . . . 26
V

TABLES
1 Calendar of events for the Sproat Lake slashburn study . . . . . . . . . . 4
2 Post-treatment plot distribution in the Sproat Lake slashburn study . . . . . . 4
3 Sources of variation and error terms incorporated in the analysis of variance . . . 8
4 Mean percent consumption of woody fuel and duff . . . . . . . . . . . 9
5 Probability values for components of variance in ranked data for selected species and species groups . . . . . . . . . . . . . . . . . . . . 11
FIGURES
4
5
6
7
8
9
10
11
Location of the Sproat Lake study sites . . . . . . . . . . . . . . . 3
Plot diagram and distribution of subplots (quadrats) . . . . . . . . . . . 6
Percent cover of woody material during the first 3 years of sampling on the four treatments . . . . . . . . . . . . . . . . . . . . . . . 10
Percent cover of rock and exposed mineral soil during the first 3 years of sampling on the four treatments . . . . . . . . . . . . . . . . . . 10
Species number in each of the four treatments during the first 3 years of sampling . . . . . . . . . . . . . . . . . . . . . . . . . . 12
Percent cover of small conifers during the first 3 years of sampling on the four treatments . . . . . . . . . . . . . . . . . . . . . . . 15
Percent cover of red huckleberry (Vaccinium Darvifolium) during the first 3 years of sampling on the four treatments . . . . . . . . . . . . . . 15
Mean stem counts per square metre for selected shrub species . . . . . . . . 16
Percent cover of salal (Gaultheria shallon) during the first 3 years of sampling on the four treatments . . . . . . . . . . . . . . . . . . . . . 18
Percent cover of fireweed (Bilobium angustifolium) during the first 3 years of sampling on the four treatments . . . . . . . . . . . . . . . . . 18
Percent cover of selected herb species. by year . . . . . . . . . . . . . 21
vi

1 INTRODUCI'ION
In an overview of forest succession research, Franklin (1982) identified manipulative experiments and models of early successional stages as being two key needs in future research. The same needs are pertinent to black-tailed deer (Odocoileus hemionus columbianus) habitat management. Since large-scale logging began in the forests of Vancouver Island, British Columbia, black-tailed deer have been using clearcuts as spring and summer foraging areas. In fact, Cowan (1945) postulated that logging enabled deer numbers to increase far beyond the level present in unlogged forests. During spring, Gates (1968) found that deer preferred seral stages with the greatest variety and quantity of herbaceous food, namely early regenerating clearcuts. He also hypothesized that sustained deer populations could only be achieved if the area of land under early successional development was maintained. At present, many Vancouver Island watersheds are covered in even-aged young-growth forest and the scarcity of spring foraging areas is becoming a management concern.
Slashburning on coastal British Columbia clearcuts is often an integral part of the process of establishing a new forest. Whether it is used to reduce slash loading, create plantable sites, or control competing vegetation, the prescribed fire has immediate impacts on site vegetation. However, the extent of this impact on the long-term spring forage potential of a site is unclear.
In 1984, MacMillan Bloedel (MB) and the Canadian Forestry Service (CFS) began a co- operative project designed to measure both short-term and long-term effects of fire on tree growth and site productivity. By invitation, the Integrated Wildlife-Intensive Forestry Research program (IWIFR) also became involved in the study, since it gave IWIFR staff a chance to examine fire-induced changes to vegetation production under fairly controlled conditions. A forage sampling scheme was subsequently designed and implemented. Changes in abundance and diversity of the clearcut vegetation in response to slashburning intensity and time are presently being monitored.
This report describes the findings of the first 3 years of the project, including pre-burning values and the results of the 1st- and 2nd-year post-treatment vegetation sampling. Impacts of slashburning on blacktailed deer spring forage are not addressed here.
1.1 Objective and Study Area The objective of the study is to describe vegetation response to different intensities of
slashburn during the first 10 years after burning, and to evaluate the impact of this on the abundance of black-tailed deer spring forage.

2
The study is located west of Port Alberni, B.C., within MacMillan Bloedel's Sproat Lake Woodlands Division. Three clearcuts were selected (Figure 1) on comparable sites within the wetter maritime subzone of the Coastal Western Hemlock biogeoclimatic zone (CWHb). Time since logging varied from 2 to 3$ years between areas. Plots were located between 455
and 600 m elevation, on moderately steep, southerly aspects. A more detailed description of site variables (soils, edatope, and topography) is provided in Beese (1986).'
12 study Design The trial was initiated as a balanced incomplete block design in which different pairs of
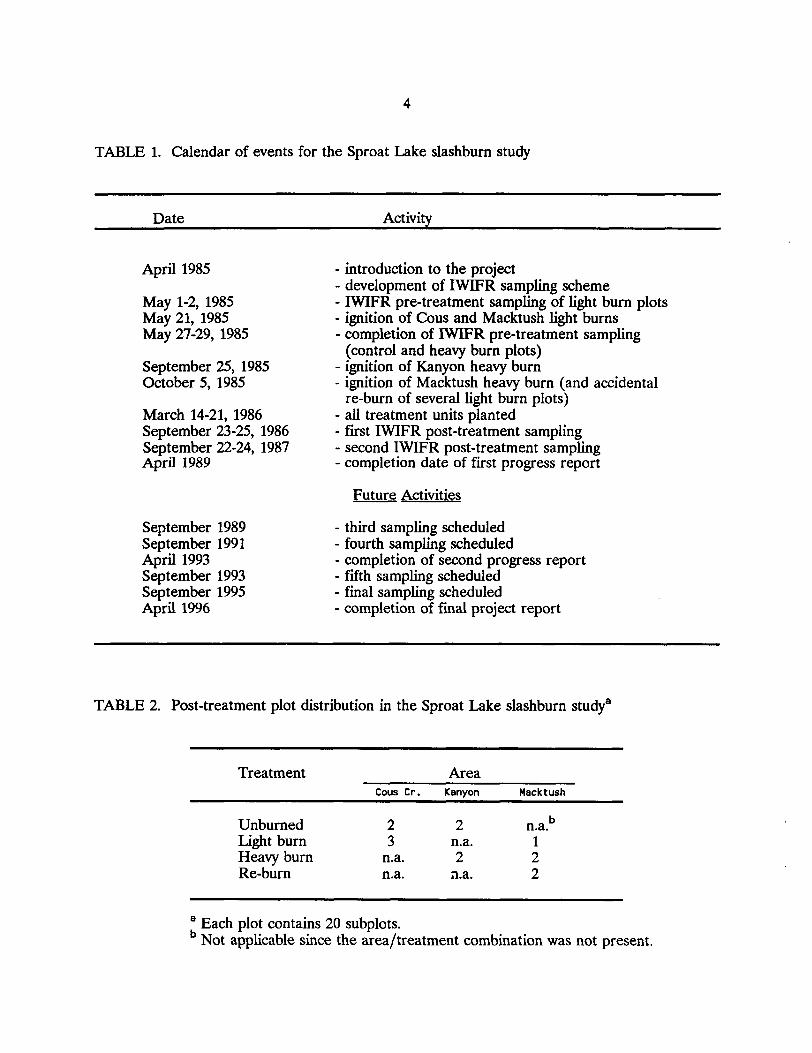
treatments were randomly allocated to the three blocks (sites). The three treatments include a light impact burn, a heavy impact burn, and an unburned control.2 The light burns were targeted to remove less than 50% of the organic matter on site; the heavy burns were designed to remove over 50% of the organic matter. To achieve the desired fire intensities, the light bum treatments were conducted in the spring and the heavy burn treatments in the fall. Table 1 provides a list of treatment dates and a calendar of completed sampling activities and proposed activities.
Before burning, five plots were established within each treatment unit by MB project staff. For simplicity, JWIFR sampling was limited to only a few of these plots. To avoid interference with other sampling efforts, measurement was not possible in certain plots and was restricted in others. Because of time restraints, IWIFR staff sampled four plots on each of the control and heavy bum treatments, and six on the light bum treatment. Table 2 shows the resultant post-treatment distribution of samples.
13 Techniques The plots are equilateral triangles with sides 30 m long (actual distance, uncorrected for
slope). The triangular shape was used to limit the problem of plot sides coinciding with the orientation of logging debris or with disturbance patterns resulting from logging activities. A
single cornerpost was located and the bearing to the second corner was determined with a random number table. The plot was subsequently established with the lowermost corner labelled "A", the next comer counter-clockwise labelled "B", and the third corner labelled "C".
' Beese, W.J. 1986. Effects of prescribed burning on forest productivity of some coastal B.C. sites. MacMillan Bloedel Ltd.,Nanaimo, B.C. Unpublished report. Beese (1986) used the terms "low intensity" and "high intensity" to describe the two burns.

3
L
w
Macktush 453
I I 1 I 1 L 0 1 2 4 6 8 10 km 1 FIGURE 1. Location of the Sproat Lake study sites.
4
TABLE 1. Calendar of events for the Sproat Lake slashburn study
Date Activity
April 1985
May 1-2, 1985 May 21, 1985 May 27-29, 1985
September 25, 1985 October 5, 1985
March 14-21, 1986 September 23-25, 1986 September 22-24, 1987 April 1989
September 1989 September 1991 April 1993 September 1993 September 1995 April 1996
- introduction to the project - development of IWIFR sampling scheme - IWIFR pre-treatment sampling of light burn plots - ignition of Cous and Macktush light burns - completion of IWIFR pre-treatment sampling
(control and heavy burn plots) - ignition of Kanyon heavy burn - ignition of Macktush heavy burn (and accidental
re-burn of several light burn plots) - all treatment units planted - first IWIFR post-treatment sampling - second IWIFR post-treatment sampling - completion date of first progress report
Future Activities
- third sampling scheduled - fourth sampling scheduled - completion of second progress report - fifth sampling scheduled - final sampling scheduled - completion of final project report
TABLE 2. Post-treatment plot distribution in the Sproat Lake slashburn studya
Treatment Area Cous Cr. Kanvon Macktush
Unburned 2 2 n.a. Light burn 3 n.a. 1 Heavy burn n.a. 2 2 Re-burn n.a. 3.a. 2
b
a Each plot contains 20 subplots. Not applicable since the area/treatment combination was not present.

5
At each of the three areas, five triangular plots were established in each treatment unit. They were systematically numbered from 1 (lowermost) to 5 (uppermost plot on the slope).
The plots were subsampled with a 0.25 m2 frame (quadrat). Quadrat position was systematically determined within the triangular plots (Figure 2). Five sampling lines were established at 5-m intervals along the A-B boundary of the triangular plot, paralleling the A-C boundary. On each line, points were located 3 m from the A-B boundary and at 3-m intervals across the plot. This resulted in 20 subplots per triangular plot. If a sampling point was to fall on an erosion-assessment station: it was shifted to the nearest unoccupied metre position further along the sampling line. The locations were marked using 5-inch (12.5 cm) steel spikes. Fluorescent pink flagging tape was attached to the spikes to make relocation easier. Appendix 1 lists the modifications made to sample location and data collection procedures. The abundance of clearcut vegetation was assessed through ocular estimates of percent cover within the quadrats (subplots). Cover estimates were in multiples of five, except at the low end of the scale (< 10%) where estimates were made to the nearest percent.
Estimates of woody fuel abundance and ground coverage of rock were also recorded according to percent cover estimates. Although collected to provide an indication of available rooting space, these two measures also became indices of fire intensity on the burns. Detailed observations on pre- and post-burn fuel abundance, weather conditions, and other important fire-related variables were collected by other researcher^.^
In addition to cover estimates, shrub abundance was also evaluated through stem counts (for Mahonia nervosa), stem length (for evergreen ferns and Vaccinium spp.), and basal stem
diameters (for all woody species except Mahonia nervosa). Dial calipers were used to measure basal stem diameters, with measurements recorded to the nearest 0.1 mm. Stem lengths were recorded to the nearest 5 cm.
1.4 Analysis
Examination of the design implemented in the study (as modified by IWIFR sampling) indicated that only treatment, year, and treatment-by-year effects were readily testable.
See Beese, 1986. Details are provided in Beese, 1986.

6
B (farthest uphill)
C A
FIGURE 2. Plot diagram and distribution of subplots (quadrats).

7
Although plot and plot-within-year variance could be tested, limitations in computer memory prevented evaluation of their significance.
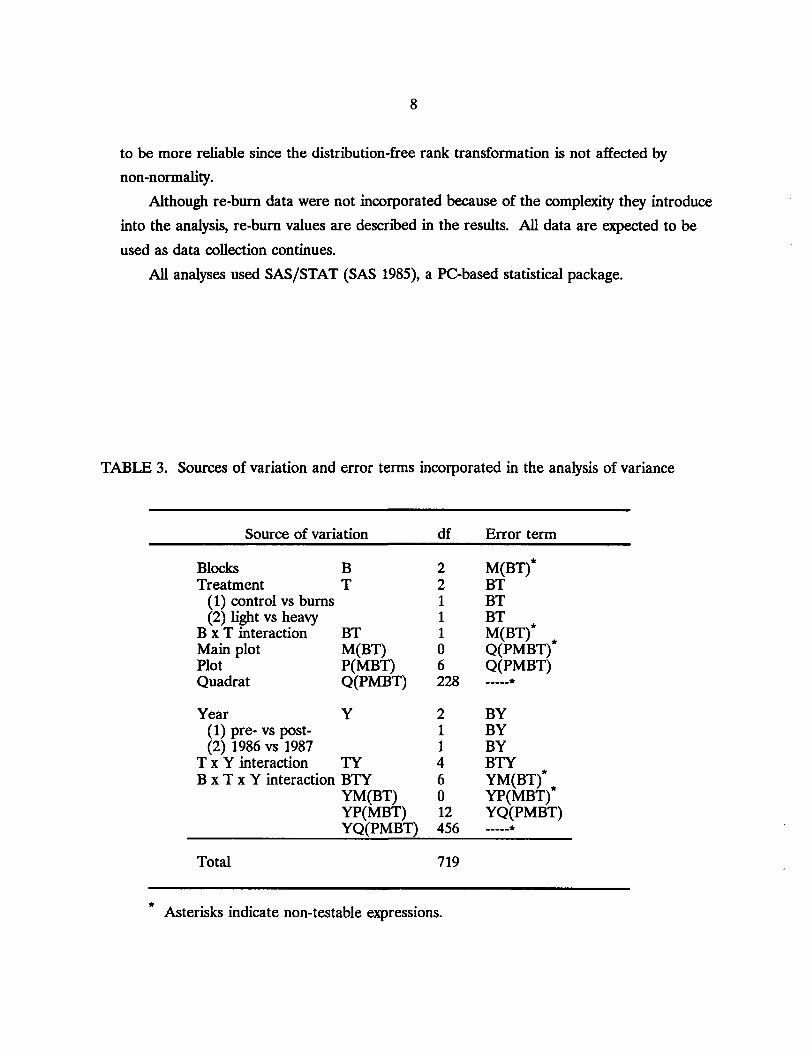
The experimental design was converted into an unbalanced incomplete block design (Hicks 1973) because of the accidental creation of an additional burn treatment (the re-burn) and the corresponding loss of light burn samples. The analysis was complicated by the resultant unequal distribution of light burn plots between the two replicates. The procedures required to analyze this design properly were considered to be too complicated for this preliminary report, so the re-burn data were ignored and analysis was conducted on the original treatment data only, following procedures outlined by Milliken and Johnson (1984). The three different years of measurement were considered to be split plots of the main plots (burns), with plots nested within the burns and quadrats nested within the plots. A breakdown of sources of variation and error terms used in the analysis of variance is provided in Table 3.
Normality testing indicated that the raw data were non-normally distributed for all species examined. An arcsine transformation was unable to provide significant improvement. This is not surprising, given the large number of zeros in the data. Species with low frequency of occurrence were almost always normally distributed when only non-zero data values were used.
Examination of the data also indicated that the variances of percent cover values for many species were proportional to the mean (the data were heteroscedastic). A logarithmic transformation (log[x+ 11) was implemented to solve this, but it failed to correct the problem of non-normality.
To avoid the problems of heteroscedasticity and non-normality, tests for significant effects in the analysis of variance were performed on ranked data values as well as on raw data. Iman (1982) concluded that the use of ranks was a sound alternative when various basic assumptions could not be guaranteed. Orthogonal contrasts were used to evaluate treatment and year effects. Effects were judged to be significant if the Type I error was 0.1 or less (aS.10). The treatment-by-year interaction has not been fully evaluated; full analysis will be presented in future reports. However, the post-treatment component of the interaction was examined. Where this component was not significant and the overall interaction was, a significant response to the burns can be assumed. Where differences existed between ANOVA's on the raw and ranked data, the ranked results were considered
8
to be more reliable since the distribution-free rank transformation is not affected by non-normality.
Although re-bum data were not incorporated because of the complexity they introduce into the analysis, re-bum values are described in the results. All data are expected to be used as data collection continues.
AU analyses used SAS/STAT (SAS 1985), a PC-based statistical package.
TABLE 3. Sources of variation and error terms incorporated in the analysis of variance
Source of variation df Error term
Blocks B Treatment T
(1) control vs bums (2) light vs heavy
B x T interaction BT Main plot M(BT)
Quadrat Q(PMBT)
Year Y
Plot P( MBT)
(1) pre- vs post- (2) 1986 vs 1987
T x Y interaction TY B x T x Y interaction BTY
YM(BT)
2 2 1 1 1 0 6 228
2 1 1 4 6 0 12
M(BT)* BT BT BT M(BT)* Q(PMBT)* Q(PMBT) ,""*
BY BY BY BTY YM(BT)" YP(MBT)* YQ(PMBT) ","*
Total 719
* Asterisks indicate non-testable expressions.

9
2 RESULTS
2.1 Slashburn Intensity The fire impact objectives of the study were to obtain less than 50% duff consumption
on the light impact burn and to obtain more than 50% consumption on the heavy impact burn. These objectives were met.’ For the subsample of plots used in the forage study, the specified burning levels were also achieved (Table 4), although one heavy impact burn plot had only 45.2% duff consumption. The combined coverage of fresh woody debris and old decaying wood was examined in this vegetation study to provide one index of burn impact. As a second measure of fire intensity, the amount of surface rock and exposed mineral soil was also recorded.
As expected, the amount of woody material remaining after treatment was greatest in the unburned plots and least in the re-burn plots (Figure 3); and the proportion of woody debris burned corresponded to treatment intensity for the two planned burns. Debris reduction on the light and heavy burns averaged 37 and 57%, respectively. However, the re-burn plots averaged 31% woody material before burning and 17% during the first post- treatment sampling, a reduction of only 46%. Over this same period, a 13% decrease was recorded on the unburned plots. Analysis of variance in the data indicated a significant year
TABLE 4. Mean percent consumption of woody fuel and duffe
Treatment % Woody fuel % Duff consumed consumed
Unburned - - Light burn 41 35.5 Heavy burn 50 72.4 Re-burn 76 86b
a W. Beese (pers. comm.). An average of three plots, not two.
’ Beese, 1986.

10
8 II/ 60
Pre-treatment 1 -year post- 2-years post-
FIGURE 3. Percent cover of woody material during the first 3 years of sampling on the four treatments.
100
80
1 60 [ 40 n
20
0 Pre-treatment 1 -year post- 2-years post-
FIGURE 4. Percent cover of rock and exposed mineral soil during the fist 3 years of sampling on the four treatments.

11
TABLE 5. Probability values for components of variance in ranked data for selected species and species groupsa
Species code Treatmentb YearC Interaction C vs L+H L vs H Pre- vs Post- 1986 vs 1987 All years Post only
woody material .3743 .9266 .0001 .0567 .0193 .6825
Exposed soil and rock .0294 .0332 .ooo 1 .1138 .0006 A016
Conifers .3732 .9543 .049 1 .6749 .1604 .9602 ABIEAMA .3790 .9480 .0137 .7923 .2084 .929 1
Deciduous shrubs .0336 .2232 .0884 .4873 .0634 .970 1 VACCALA .2296 S462 .0616 .7806 .6211 .9765 VACCPAR .0403 .1779 .0993 .3384 .0295 .782 1
Evergreen shrubs .6905 .4435 .0327 .0603 .0036 .8623 GAULSHA .9177 .4 180 .0010 .06 1 1 .0007 .6691 MAHONER .9905 .5499 .0938 .0978 .0443 S484
Herbs .2895 .7307 .0003 .0390 SO42 .9157 ANAPMAR S542 .4489 .2608 .3023 S646 S308 EPILANG .28 18 .4794 .0012 .3282 .8128 3752 HYPORAD .6870 .3985 .0457 .0860 SO50 .9687 MYCEMUR .0479 .0463 .0718 .0180 .6418 .4362 S E N E W L .402 1 .2630 .0319 .1342 ,1091 .2955
a Re-burn data were excluded from the analysis of variance. C = control; L = light burn; H = heavy burn. Pre- = 1985; Post- = 1986 + 1987. C

12
effect and treatment-by-year interaction (P < .lo). In addition to the pre- and post-burn difference, there was also a significant difference between mean cover estimates for the two post-bum years (Table 5).
Measurements of the amount of exposed mineral soil and rock suggest that treatment intensity was as intended (Figure 4). From pre-treatment values of less than 4% cover (exposed rock), the light, heavy, and re-bum treatments removed 15, 51, and 76% of all duff cover, respectively. These values are not directly comparable to those in Table 4, since they approximate the proportion of surface area with complete duff combustion rather than being a measure (with depth-of-bum pins) of the proportion of duff remaining. Nevertheless, they do show a corresponding pattern. Results of a ranked ANOVA show significant effects for treatment, year, and the treatment-by-year interaction (Table 5).
22 SpeciesNumber Twenty-four different plant species were observed during pre-treatment sampling. Of
these, four were observed only once. By 1987, an additional eight species had been recorded, including two that were observed on only one occasion. The 32 species included 5 conifers, 6
deciduous shrubs, 3 evergreen shrubs, 3 ferns, 14 non-graminoid herbs, and 1 grass. Total
1 . . . . . .
. . .
n
(Other species I I
" Unburned Light burn Heavy burn Re-burn
FIGURE 5. Species number in each of the four treatments during the first 3 years of sampling.
13
number of plant species present varied with treatment as well as time, as shown in Figure 5.
A list of species recorded on the study plots is presented in Appendix 2. During pre-treatment sampling, 18 different species were recorded in the control plots,
compared to 11, 13, and 12 in the future light impact, heavy impact, and re-burn plots, respectively. The following year, total numbers stayed constant in the control, increased in the light burn, and declined in the heavy and re-burn plots. In 1987, total species numbers exceeded pre-treatment levels in all treatments except the re-bum. The greatest changes in numbers occurred in the herb component.
2.3 Species Abundance Species abundance was examined in a number of ways. Initially, species were grouped
into one of several lifeform categories and ANOVA’s were performed on these groups. Subsequent analyses dealt with individual species. Because many species were present only in minute quantities on a low number of subplots, ANOVA’s were conducted only on species present on at least 10% of all subplots. Analysis of variance results are presented in Table 5. Although frequency of occurrence is described for selected species, no specific tests were conducted on those data. The same applies to stem count information from several of the shrub species. Mean cover values and frequency of occurrence data for all species, organized by treatment and year, are listed in Appendix 3.
23.1 Conifers In pre-treatment sampling, amabilis fir (Abies amabilis) and western hemlock (Tsuga
heteroDhvlla) were most abundant. Western redcedar (Thuja plicata) and Douglas-fir (Pseudotsupa menziesii) were also recorded on pre-burn plots, although the latter species was only observed once. Burning removed all amabilis fir and hemlock. Abundance of western redcedar and Douglas-fir increased following slashbuming, primarily as a result of planting efforts. Yellow-cedar (Chamaecyparis nootkatensis) was also planted in the plots during the spring following burning, and was first recorded during the first post- treatment sampling.
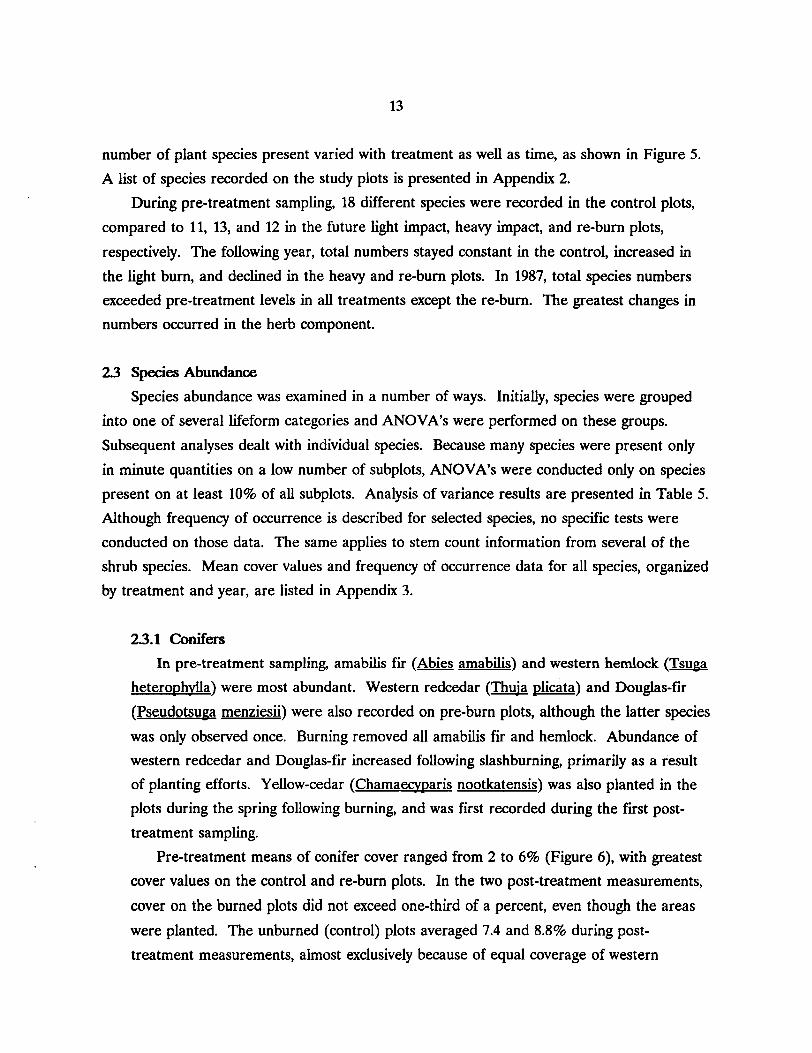
Pre-treatment means of conifer cover ranged from 2 to 6% (Figure 6), with greatest cover values on the control and re-burn plots. In the two post-treatment measurements,
cover on the burned plots did not exceed one-third of a percent, even though the areas were planted. The unburned (control) plots averaged 7.4 and 8.8% during post- treatment measurements, almost exclusively because of equal coverage of western
14
hemlock and amabilis fir. In the analysis of variance, there was a significant difference (P= .049) between pre-treatment and post-treatment conifer abundance.
232 Deciduous shrubs Only three of the six deciduous shrubs observed were recorded during pre-treatment
sampling; the others were first observed the year after treatment. The principal shrubs were red huckleberry (Vaccinium Darvifolium), Alaskan blueberry (x alaskaense), and trailing blackberry (Rubus ursinus). Baldhip rose (Rosa gymnocarpa), black raspberry (Rubus leucodermis), and thimbleberry (E parviflorus) establishment occurred after treatment.
Deciduous shrub coverage ranged from 2.8 to 8.3% before treatment, with cover greatest on the control plot. Abundance on the unburned plots doubled in the next 2 years. Burning reduced shrub abundance to very low levels, but the shrubs had increased in abundance in the second post-treatment sampling. Analysis of variance procedures show significant differences between the unburned and burned treatments, and between pre- and post-treatment data, and also indicate a significant interaction effect (see Table 5).
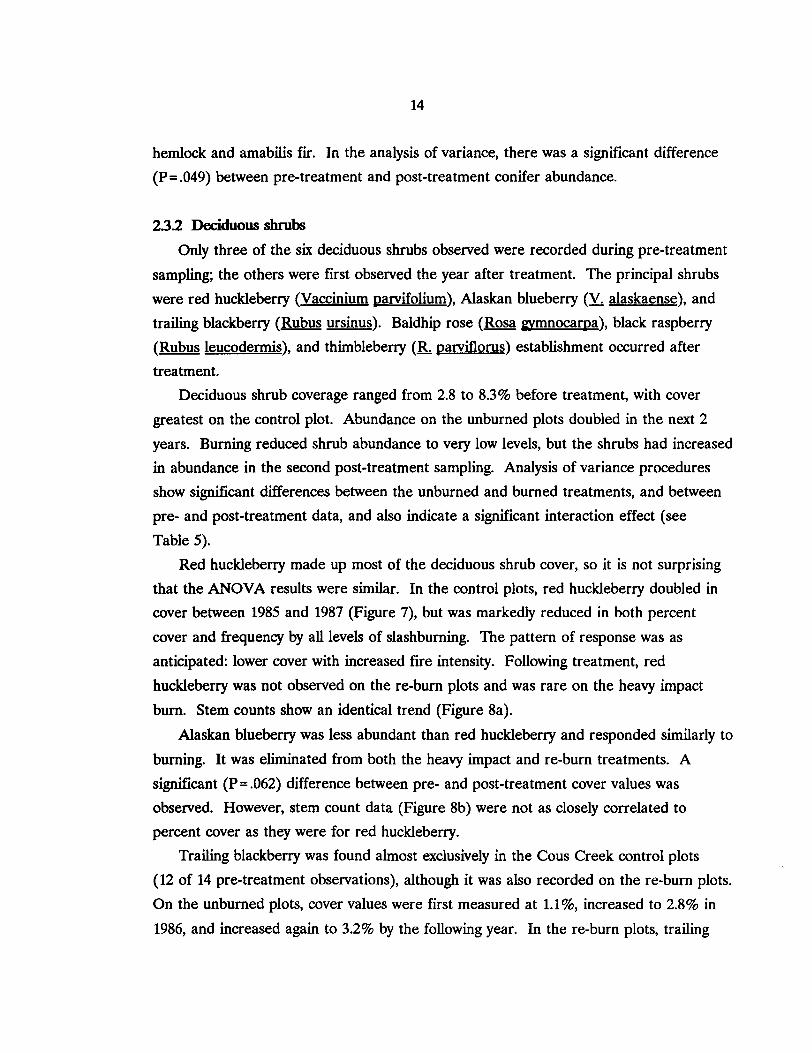
Red huckleberry made up most of the deciduous shrub cover, so it is not surprising that the ANOVA results were similar. In the control plots, red huckleberry doubled in cover between 1985 and 1987 (Figure 7), but was markedly reduced in both percent cover and frequency by all levels of slashburning. The pattern of response was as anticipated: lower cover with increased fire intensity. Following treatment, red huckleberry was not observed on the re-bum plots and was rare on the heavy impact bum. Stem counts show an identical trend (Figure sa).
Alaskan blueberry was less abundant than red huckleberry and responded similarly to burning. It was eliminated from both the heavy impact and re-burn treatments. A significant (P=.O62) difference between pre- and post-treatment cover values was observed. However, stem count data (Figure 8b) were not as closely correlated to percent cover as they were for red huckleberry.
Trailing blackberry was found almost exclusively in the Cous Creek control plots (12 of 14 pre-treatment observations), although it was also recorded on the re-burn plots. On the unburned plots, cover values were first measured at 1.1%, increased to 2.8% in 1986, and increased again to 3.2% by the following year. In the re-burn plots, trailing
15
I
Pre-treatment 1 -year post- 2-years post-
FIGURE 6. Percent cover of small conifers during the first 3 years of sampling on the four treatments.
-1 +' \
0 ~~ ~ ~~
Pre-treatment 1 -year post- 2-years post- ~~ ~
FIGURE 7. Percent cover of red huckleberry (Vaccinium Darvifolium) during the first 3 years of sampling on the four treatments.

16
$ ” I Q)
. . . . . . . . . . . . . . . . . . . . . . . . . . . . . . . . . . . . . . . . . . . . . . . . . . . . a
’IF ... . . . . . . . .
L
. . . . . . . . . . . . . . . . . . . . . . . a
$$@$ 5 .:.:.:., <<.:>.
...................... ...................... ...................... Q)
4 a2
‘$ %
A 2 % G a E 3 2
....... ...... ....... ......
e - v)
8 5 E 8 $ E 2 2 * : v )
2 c
. . . .
00 a
2 3 0 E
17
blackberry cover declined following treatment (from 0.08 to 0.02%), but subsequently increased (to 0.5%) by 1987.
Of the other three deciduous shrubs, black raspberry showed the largest change in abundance. Absent on all areas before treatment, it was established on all treatments by 1987, having achieved cover values of 1.2 and 2.5% on the unburned and re-burned treatments, respectively.
233 Evergreen shrubs
Three evergreen shrubs were tallied during the 3 years of sampling. Salal (Gaultheria shallon) was the most abundant of these, followed by dull Oregon-grape (Mahonia nervosa) and twinflower (Linnaea borealis). Pre-burn values were highest and 1st-year post-burn values were lowest, as expected. There was wide variation in pre- treatment abundance, with cover ranging from 7.8 to 24.4% before burning. Analysis of variance on the data showed significant differences between pre- and post-treatment means (P= .033) and also between the two post-burn means (P= .060). There was also a significant interaction between year and treatment (Table 5).
The reduction in evergreen shrub cover increased with greater fire impact. Burning eliminated most of the cover on the heavy impact and re-burn treatments, but both treatments showed increasing cover in 1987. The light impact burn showed less change. Shrub cover declined to 10% in 1986 from 16.1% in 1985 following the light burn. In 1987, cover values had reached 16.7%, just exceeding the pre-treatment mean. On the unburned area, evergreen shrub cover increased from 10.3 to 21 between 1985 and 1987.
Because most of the evergreen shrub cover was salal, both year and interaction effects were also significant in the salal ANOVA. The interaction is easily seen in Figure 9. In the re-burn, only one subplot contained salal the year after treatment, but the year after that no salal was recorded. Stem counts yield a slightly different picture (Figure 8c) of overall salal response. The light burn had nearly twice as many stems in 1987 than in 1985, but only marginally greater ground cover. Burning apparently removed most of the larger salal plants, and the new growth that was present during post-treatment sampling had much smaller stem size, but was more numerous.
Percent cover of dull Oregon-grape showed significant year and interaction effects (Table 5) , although the former were marginal. Oregon-grape coverage on the unburned

18
25
20
15 8
8 10 E
U C
5
0
heavy burn
I
Pre-treatment 1 -year post- 2-years post-
FIGURE 9. Percent cover of salal (Gaultheria shallon) during the first 3 years of sampling on the four treatments.
Pre-treatment 1 -year post- 2-years post-
FIGURE 10. Percent cover of fireweed (Edobium angustifolium) during the first 3 years of sampling on the four treatments.

19
plots increased from 1.8 to 3.8% between 1985 and 1987. The light bum showed a similar trend, increasing from 1.0 to 4.8% cover during the same period. Although the heavy impact burn showed an overall increase to 1.8%, the first post-burn assessment was 0.3% lower than the pre-burn value of 1.1%. In the re-bum treatment, the trend in cover showed a drop from 1.2 to 0.3% before increasing to 0.9% cover in 1987. Stem density values were remarkably similar to percent cover values, and exhibited a nearly identical trend (Figure 8d).
The third evergreen herb observed during the first 3 years of this study was twinflower. Although observed on both Cous Creek and Kanyon study sites, it was only present on the unburned control plots. Twinflower showed a steady increase in ground coverage from 1985 to 1987, with means of 2.3, 4.1, and 6.0% for the 3 years.
23.4 Herbs Herb cover on the various treatments increased substantially after burning. Average
cover increased from 1% in 1985 to 9.8% the following year and 12.9% the year after that. Analysis of variance showed significant differences between pre- and post- treatment means and between the means of the two post-treatment data sets (Table 5).
Treatment and interaction effects were not significant (P>.lO). Although 14 non- graminoid herbs were recorded on the study sites, very few of them contributed much to the cover total.
The most abundant herb was fireweed (Euilobium aneustifolium), an early-succession perennial. It accounted for one-half of pre-burn herb cover and even more after treatment. Cover values differed significantly (P=.OO12) between the pre- and post-burn data. Except for the re-burn, which was excluded from the ANOVA, there was little difference between treatments (Figure 10). The re-burn showed greater percent cover during the first 2 years of sampling, but decreased markedly in 1987. In pre-burn assessments, fireweed was most frequent on the re-burn plots at Macktush, accounting for 26 of 36 observations of the species on the 280 subplots sampled. Surprisingly, fireweed occurrence at that site was constant during all 3 years, while increasing substantially on the other treatments.
Other herbs that responded appreciably, if not significantly, were pearly everlasting (Anaphalis marearitacea), hairy cat’s-ear (Hypochaeris radiata), wall lettuce

20
(Mycelis muralis), and common groundsel (Senecio vulgaris). Their changes in abundance are illustrated in Figure 11. Although absent or nearly so during pre-burn assessments, all four species showed a trend towards increasing cover on all treatments. Analysis of variance results on ranked data (Table 5) indicate a significant year effect for all but pearly everlasting. The cat’s-ear and wall lettuce had significant differences between pre- and post-treatment means. The two post-treatment years were also significantly different. For wall lettuce, the unburned treatment differed from the burned ones (P= .047), and the light impact bum differed from the heavy impact burn (P= .046).
235 Other species groups
Specific responses of the moss, grass, and fern groups are not discussed in detail here. Data collection on moss cover was spotty, as mosses were noted only as indicators, unless one or more moss species contributed an appreciable amount to the total vegetative cover of a quadrat. Grasses, undifferentiated by species, were very rare, being observed on two subplots only in the re-bum treatment. Fern coverage was also very limited. Sword fern (Polvstichum munitum) and deer fern (Blechnum spicant) were found on four and two subplots, respectively, while licorice fern (PolvDodium glvqrrhiza) was recorded just once.

21
B 6 f cu
................ 4: ................ ................ :::::::::::::::_ ................ g F
......................................... ........................................ ......................................... ........................................ .........................................
P
....... I" ..... . . . . . . . . . .
E a
d %
?I D
E
E 3 .r( 5 ...... ......
3 E -2 a
3
22
3 DIS(-JUSSION
Examination of cover data collected before treatment and during the first 2 years after burning indicated notable changes in species abundance. Differences between unburned and burned treatments were seldom significant, probably due to both high variance in the pre-burn data and severe effects of even the light impact burn. Yearly cover values were significantly different, however, for most species. AU species groups showed annual increases in cover on unburned plots, while only the herb group demonstrated a corresponding trend on the burned plots. As expected, fire impact was least on the light impact burn, and more species survived the light impact fire than survived on either the heavy impact or re-burn treatments. Although not included in the statistical analysis, the re-burn data were consistent with the response expected from a more severe burn.
Huckleberries were greatly reduced by all burn treatments, essentially surviving only on the light burns. Evergreen shrubs were also significantly influenced by burning. Unlike the deciduous shrubs, however, they showed a stronger rate of recovery. Rapid re-growth of both salal and dull Oregon-grape is probably a function of greater survival of below-ground portions of the plants and, in the case of salal, greater pre-burn abundance.
Treatment differences were minimal for most herbs, but differences between years were significant and consistent with a hypothesis of invasion. Lack of a fire-induced reduction in cover during the first post-treatment sampling is most likely a result of rapid colonization and not of tolerance to fire. Annual increases in cover were greatest for fireweed. However, fireweed was the only common species that showed an appreciable decline in cover in any treatment during the second post-burn (1987) sampling. Greater desiccation on the re-burn plots, resulting from a combination of warmer aspect and higher site moisture loss, is one possible explanation for the lower cover values. Future measurements may help to confirm this.

23
4 REFERENCES
Cowan, I. McT. 1945. The ecological relationships of the food of the Columbian black-tailed deer (Odocoileus hemionus columbianus Richardson) in the coast forest region of Southern Vancouver Island, British Columbia. Ecol. Monogr. lS(2): 110-139.
Franklin, J.F. 1982. Forest succession research in the Pacific Northwest: an overview. In Proc. Symp. on Forest Succession and Stand Development Research in the Northwest. Corvallis, Oreg. J. E. Means (editor). March 26, 1981
Gates, B.R. 1968. Deer food production in certain seral stages of the coast forest. M.Sc. thesis. Univ. B.C., Vancouver, B.C. 101 p.
Hicks, C.R. 1973. Fundamental concepts in the design of experiments. 2nd ed. Holt, Rinehart and Winston, New York, N.Y. 349 p.
Iman, R.L. 1982. Some aspects of the rank transform in analysis of variance problems. In Proc. 7th Annual SAS Users Group International Conf., San Francisco.
Milliken, G.A. and D.E. Johnson. 1984. Analysis of messy data. Vol. 1: designed experiments. Lifetime Learning Publications, Belmont, California. 473 p.
SAS Institute Inc. 1985. SAS/STAT guide for personal computers, Version 6 ed. SAS Institute Inc., Cary, N.C. 378 p.
24
APPENDIX 1. Vegetation sampling notes
a) Data collection notes : Subplot (quadrat) position was designed to be the same for all plots. However, four
subplot locations were changed to avoid MacMillan Bloedel’s erosion-assessment stations. Changes were as follows:
CLA-06 (Cous Light bum Plot 4 Quadrat 6) was positioned at 19 m instead of 18 m. CLA-18 (Cous Light bum Plot 4 Quadrat 18) was positioned at 4 m instead of 3 m. KH5-18 (Kanyon Heavy burn Plot 5 Quadrat 18) was positioned at 4 m instead of 3 m. MR3-02 (Macktush Re-burn Plot 3 Quadrat 2) was positioned at 5 m instead of 6 m.
- During the 1986 field season, fern frond length measurements were not taken. - In 1986, it was decided that huckleberry stem measurements would only be taken on
stems greater than 2 mm in diameter. - In 1987, it was decided that counts of Oregon-grape would replace basal stem
diameters.

25
APPENDIX 1. (Continued)
b) Data coding sheet information
1. Percent Cover
Column 1 2 3 5-6 7 9 10-1 1 12- 17 18-24 25-26 27-35 36-44 45-53 54-62 63-71
Area (Cous, Kanyon, Macktush) Treatment (Control, Light, Heavy, Re-bum) Plot number (MB numbers 1-5) Quadrat (subplot) number (1-20) An asterisk (*) denotes a position change Line number (1-5) from the plot diagram Quadrat location, in metres, on the line Date (yy/mrn/dd) Species code Percent cover: + 1 (trace), 1-99 as for columns 18-26 as for columns 18-26 as for columns 18-26 as for columns 18-26 as for columns 18-26
2. Measurements (for woody shrubs and evergreen ferns only)
Column 1 2 3 5-6 7- 12 13
14-20 21-23 24-80
Area (Cous, Kanyon, Macktush) Treatment (Control, Light, Heavy, Re-burn) Plot number (MB numbers 1-5) Quadrat (subplot) number (1-20)
Measurement type (1 = basal diameter in 0.1 mm, 2 = length in cm, 3 = stem count) Species codea Measurement # 1 Measurement #2 - #20
Date (YY/=/W
a Stem counts are used for Mahonia nervosa and lengths are taken for evergreen ferns. Basal diameters are used for all conifers and shrubs. For Vaccinium species, both basal stem diameters and lengths are taken. The measurements are paired.

26
APPENDIX 2. List of species code and scientific and common names of species used in this report
Species codea Scientific name Common nameb Lifeform'
ABIEAMA ACHLTRI ANAPMAR BLECSPI CHAMNOO CIRS W L CORNCAN EPILANG GAULSHA GOODOBL GRASS HYF'ORAD LINNBOR LISTCOR MAHONER MYCEMUR POLYGLY POLYMUN PSEUMEN ROSAGYM RUBULEU RUBUPAR RUBUURS SENEWL TARAOFF THUJPLI TIARLAC TIARTRI TRIELAT TSUGHET VACCALA VACCPAR
WOOD MINSOIL
Abies amabilis amabilis fir Achlvs triphvlla vanilla-leaf Anaphalis margaritacea pearly everlasting Blechnum spicant deer fern Chamaecvparis nootkatensis yellow-cedar Cirsium vulgare bull thistle Cornus canadensis bunchberry EDilobium aneustifolium fireweed Gaultheria shallon salal Goodvera oblongifolia rattlesnake-plantain
Hwochaeris radicata hairy cat's-ear Linnaea borealis twinflower Listera cordata heart-leaved twayblade Mahonia nervosa dull Oregon-grape Mvcelis muralis wall-lettuce Polwodium glyyrrhiza licorice fern Polvstichum munitum sword fern Pseudotsuea menziesii Douglas-fir
Rubus leucodermis black raspberry Rubus pawiflorus thimbleberry " Rubus ursinus trailing blackberry Senecio vulgaris common groundsel Taraxacum officinale common dandelion Thuia Dlicata western redcedar Tiarella laciniata cut-leaved foamflower Tiarella trifoliata three-leaved foamflower Trientalis latifolia broad-leaved starflower Tsuga heteroDhvlla western hemlock Vaccinium alaskaense Alaskan blueberry Vaccinium Darvifolium red huckleberry
assorted grasses
" Rosa p n o c a m a baldhip rose
woody material mineral soil and rock
CNTR HERB HERB FERN CNTR HERB HERB HERB EVSH HERB GRAM HERB EVSH HERB EVSH HERB FERN FERN CNTR DCSH DCSH DCSH DCSH HERB HERB CNTR HERB HERB HERB CNTR DCSH DCSH
SUBS SUBS
B.C. Ministry of Forests. 1980. Ministry of Forests vegetation coding list. Unpublished list compiled by B. D. Titus. Meidinger, D. V. 1988. Recommended vernacular names for common plants of British Columbia. B.C. Ministry of Forests. Internal report. CNTR = coniferous tree DCSH = deciduous shrub EVSH = evergreen shrub FERN = fern or fern-ally GRAM = graminoid HERB = non-graminoid herb SUBS = surface substrate

27
APPENDIX 3. Percent cover means for Sproat Lake plots
a) Unburned (control) plots in 1985
Species Code Mean Std Error N N>O
ABIEAMA ACHLTRI ANAPMAR BLECSPI CHAMNO0 C I R S W L CORNCAN EPILANG GAULSHA GOODOBL GRASS HY PORAD LINNBOR LISTCOR MAHONER MYCEMUR POLYGLY POLYMUN PSEUMEN ROSAGYM RUBULEU RUBUPAR RUBUURS S E N E W L TARAOFF THUJPLI TIARLAC TIARTRI TRIELAT TSUGHET VACCALA VACCPAR
3.2762 1.1 0. 0.0138 0. 0. 0. 0.15 6.225 0.0012 0. 0. 2.2637 0. 1.825 0.1262 0. 0.1875 0.0012 0. 0. 0. 1.1 0.0012 0. 0.1262 0. 0.0012 0. 2.525 1.9875 5.2625
1.41429 0.58774
0.01255 - - - 0.09088 1.35537 0.00125
- 0.85583
0.6172 0.05728
0.13204 0.00125 - - 0.42082 0.00125
0.12499
0.00125
1.10579 0.74364 1.48854
- - -
CONIFERS D. SHRUBS E . SHRUBS FERNS HERBS MOSSES
MINSOIL WOOD
5.9827 8.35 10.3138 0.2013 1.38 0.
4.125 52.2625
2.07959 1.75285 1.75556 0.13239 0.59116 - 1.72879 3.51064
80 80 80 80 80 80 80 80 80 80 80 80 80 80 80 80 80 80 80 80 80 80 80 80 80 80 80 80 80 80 80 80
80 80 80 80 80 80
80 80
8 6 0 2 0 0 0 3 31 1 0 0 14 0 16 6 0 3 1 0 0 0 12 1 0 2 0 1 0 12 16 28
19 46 45 5 16 0
7 80

28
APPENDIX 3. (Continued)
b) Unburned (control) plots in 1986
Species Code Mean Std Error N N>O
ABIEAMA ACHLTRI ANAPMAR BLECSPI CHAMNOO C I R S W L CORNCAN EPILANG GAULSHA GOODOBL GRASS HYPORAD LINNBOR LISTCOR MAHONER MYCEMUR POLYGLY POLYMUN PSEUMEN ROSAGYM RUBULEU RUBUPAR RUBUURS S E N E W L TARAOFF THUJPLI TIARLAC TIARTRI TRIELAT TSUGHET VACCALA VACCPAR
CONIFERS D . SHRUBS E . SHRUBS FERNS HERBS MOSSES
MINSOIL WOOD
3.3263 0.1875 0. 0.025 0.5125 0. 0. 7.7012 9.3625 0. 0. 0.05 4.075 0. 3.5375 0.5388 0. 0.3625 0. 0. 0.475 0. 2.825 0.0625 0. 0.325 0. 0. 0. 3.2638 2.6887 6.1625
7.4275 12.1513 16.975 0.3875 8.54 0.025
4.25 45.625
1.38658 0.10234
0.025 0.43972
-
- - 1.93875 1.72713 - - 0.03938 1.50934
1.07281 0.22353
0.19262
-
- - - 0.37986
0.85662 0.0625
0.21404
-
- - - 1.47451 0.97878 1.3827
2.06403 1.97373 2.45639 0.19364 2.02119 0.025
1.65234 3.60574
80 80 80 80 80 80 80 80 80 80 80 80 80 80 80 80 80 80 80 80 80 80 80 80 80 80 80 80 80 80 80 80
80 80 80 80 80 80
80 80
10 4 0 1 3 0 0
22
0 0 2 16 0 17 7 0 4 0 0 4 0 13 1 0 3 0 0 0 11 16 38
38
22 56 53 5
29 1
10 76
29
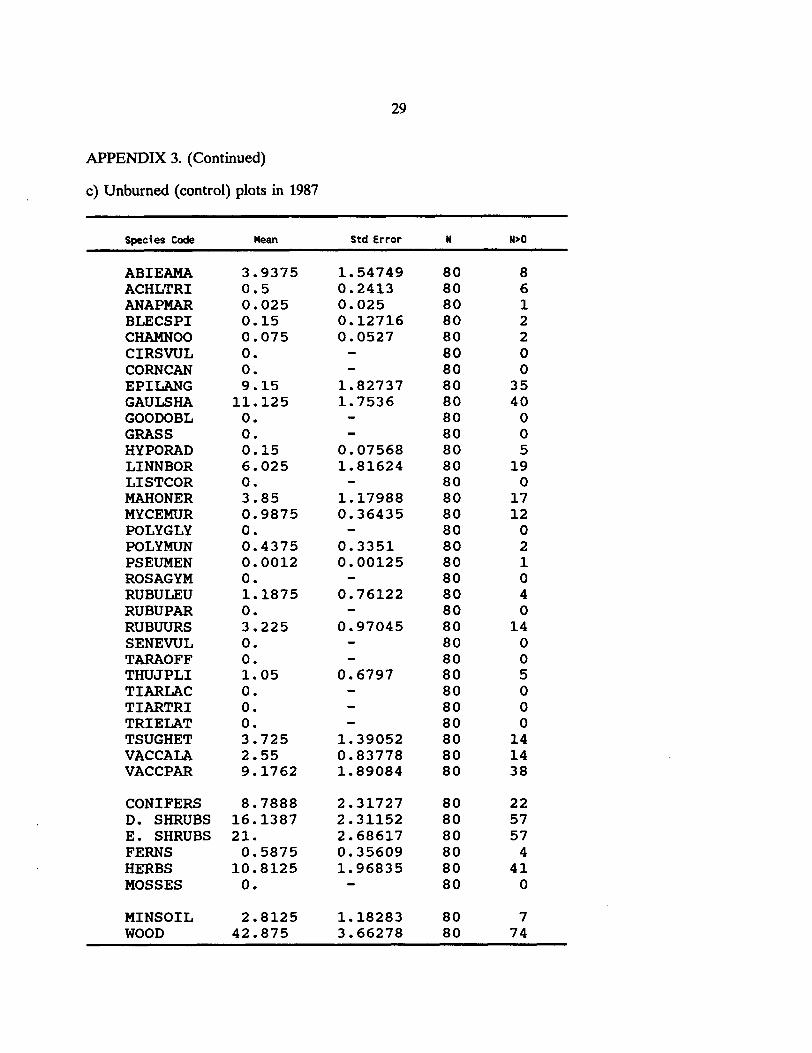
APPENDIX 3. (Continued)
c) Unburned (control) plots in 1987
Species Code Mean Std Error N N>O
ABIEAMA ACHLTRI ANAPMAR BLECSPI CHAMNO0 C I R S W L CORNCAN EPILANG GAULSHA GOODOBL GRASS HY PORAD LINNBOR LISTCOR MAHONER MYCEMUR POLYGLY POLYMUN PSEUMEN ROSAGYM RUBULEU RUBUPAR RUBUURS S E N E W L TARAOFF THUJPLI TIARLAC TIARTRI TRIELAT TSUGHET VACCALA VACCPAR
CONIFERS D. SHRUBS E . SHRUBS FERNS HERBS MOSSES
MINSOIL WOOD
3.9375 0.5 0.025 0.15 0.075 0. 0. 9.15 11.125 0. 0. 0.15 6.025 0. 3.85 0.9875 0. 0.4375 0.0012 0. 1.1875 0. 3.225 0. 0. 1.05 0. 0. 0. 3.725 2.55 9.1762
8.7888 16.1387 21. 0.5875 10.8125 0.
2.8125 42.875
1.54749 0.2413 0.025 0.12716 0.0527 - - 1.82737 1.7536 - - 0.07568 1.81624
1.17988 0.36435
0.3351 0.00125
0.76122
0.97045
-
-
- - - - 0.6797 - - 1.39052 0.83778 1.89084
2.31727 2.31152 2.68617 0.35609 1.96835
1.18283 3.66278
80 80 80 80 80 80 80 80 80 80 80 80 80 80 80 80 80 80 80 80 80 80 80 80 80 80 80 80 80 80 80 80
80 80 80 80 80 80
80 80
8 6 1 2 2 0 0 35 40 0 0 5 19 0 17 12 0 2 1 0 4 0 14 0 0 5 0 0 0 14 14 38
22 57 57 4 41 0
7 74

30
APPENDIX 3. (Continued)
d) Light bum plots in 1985
Species Code Mean Std Error N N>O
ABIEAMA ACHLTRI ANAPMAR BLECSPI CHAMNOO C I R S W L CORNCAN EPILANG GAULSHA GOODOBL GRASS HYPORAD LINNBOR LISTCOR MAHONER MYCEMUR POLYGLY POLYMUN PSEUMEN ROSAGYM RUBULEU RUBUPAR RUBUURS S E N E W L TARAOFF THUJPLI TIARLAC TIARTRI TRIELAT TSUGHET VACCALA VACCPAR
CONIFERS D. SHRUBS E . SHRUBS FERNS HERBS MOSSES
WOOD MINSOIL
1.825 0. 0. 0. 0. 0. 0. 0.0375
0. 0 . 0. 0. 0. 1.0387 0.0012 0. 0.3125 0. 0. 0. 0 . 0. 0. 0.1 0.35 0. 0. 0. 0.275 1.4625 2.4637
2.45 3.9263
16.1038 0.3125 0.1387 1.2
49.05
15.065
2.225
0.70302 - - - - - - 0.0375 2.13473
0 - - 0 - 0.5949 0.00125
0.3125 - - - - - - - 0.1 0.26808 - - - 0.2503 0.40758 0.86469
0.7819 1.05683 2.13447 0.3125 0.10634 0.44058
3.4875 1.01679
80 80 80 80 80 80 80 80 80 80 80 80 80 80 80 80 80 80 80 80 80 80 80 80 80 80 80 80 80 80 80 80
80 80 80 80 80 80
80 80
11 0 0 0 0 0 0 1
50 0 0 0 0 0 14 1 0 1 0 0 0 0 0 0 1 2 0 0 0 3 14 19
14 28 56 1 3
16
77 7

31
APPENDIX 3. (Continued)
e) Light burn plots in 1986
Species Code Mean Std Error N N>O
ABIEAMA ACHLTRI ANAPMAR BLECSPI CHAMNOO C I R S W L CORNCAN EPILANG GAULSHA GOODOBL GRASS HYPORAD LINNBOR LISTCOR MAHONER MYCEMUR POLYGLY POLYMUN PSEUMEN ROSAGYM RUBULEU RUBUPAR RUBWRS S E N E W L TARAOFF THUJPLI TIARLAC TIARTRI TRIELAT TSUGHET VACCALA VACCPAR
CONIFERS D. SHRUBS E . SHRUBS FERNS HERBS MOSSES
WOOD
0. 0. 0.0012 0. 0.025 0.025 0. 7.2938 6.5375 0. 0. 0.55 0. 0. 3.4513 0.0025 0. 0.3125 0. 0. 0.025 0. 0. 2.825 0. 0.125 0. 0. 0. 0. 0.1387 0.3375
0.15 0.5012 9.9887 0.3125 10.6975 0.
30.75 MINSOIL 14.6875
- - 0.00125
0.025 0.025
1.54342 1.03742
-
-
- - 0.28899 - - 0.9814 0.00176
0.3125 - - - 0.025 - - 0.7849 0. 0.08783 - - - - 0.07277 0.15906
0.09088 0.19156 1.32413 0.3125 1.88346 - 3.82064 2.78352
80 80 80 80 80 80 80 80 80 80 80 80 80 80 80 80 80 80 80 80 80 80 80 80 80 80 80 80 80 80 80 80
80 80 80 80 80 80
80 80
0 0 1 0 1 1 0
44 45 0 0 6 0 0
22 2 0 1 0 0 1 0 0 18 0 2 0 0 0 0 6 8
3 13 57 1
50 0
58 36

32
APPENDIX 3. (Continued)
f ) Light bum plots in 1987
Species Code Mean Std Error N N>O
ABIEAMA ACHLTRI ANAPMAR BLECSPI CHAMNOO C I R S W L CORNCAN EPILANG GAULSHA GOODOBL GRASS HYPORAD LINNBOR LISTCOR MAHONER MYCEMUR POLYGLY POLYMUN PSEUMEN ROSAGYM RUBULEXJ RUBUPAR RUBWRS S E N E W L TARAOFF THUJPLI TIARLAC TIARTRI TRIELAT TSUGHET VACCALA VACCPAR
CONIFERS D. SHRUBS E . SHRUBS FERNS HERBS MOSSES
WOOD MINSOIL
0. 0. 0.05 0. 0.025 0. 0. 8.6013 11.9625 0. 0. 1.0513 0. 0. 4.7663 1.4888 0. 0.5625 0.0625 0. 0.0375 0. 0. 4.475 0. 0.1875 0. 0. 0. 0. 0.25 1.0775
0.275 1.365 16.7288 0.5625 15.6663 0.
21.375 10.8125
- - 0.03029
0.025 - - - 1.5752 1.72458 - - 0.48841 - - 1.3955 0.43605
0.5625 0.0625
0.0375
-
- - - 0.96783
0.13904 - - - - - 0.14507 0.50522
0.153 0.5292 2.06689 0.5625 1.90448 - 3.07601 2.52432
80 80 80 80 80 80 80 80 80 80 80 80 80 80 80 80 80 80 80 80 80 80 80 80 80 80 80 80 80 80 80 80
80 80 80 80 80 80
80 80
0 0 3 0 1 0 0
46 50 0 0 11 0 0
27 17 0 1 1 0 1 0 0
37 0 2 0 0 0 0 4 14
4 17 63 1
65 0
51 24

33
APPENDIX 3. (Continued)
g) Heavy burn plots in 1985
Species Code Uean Std Error N N>O
ABIEAMA ACHLTRI ANAPMAR BLECSPI CHAMNOO C I R S W L CORNCAN EPILANG GAULSHA GOODOBL GRASS HYPORAD LINNBOR LISTCOR MAHONER MYCEMUR POLYGLY POLYMUN PSEUMEN ROSAGYM RUBULEU RUBUPAR RUBWRS S E N E W L TARAOFF THUJPLI TIARLAC TIARTRI TRIELAT TSUGHET VACCALA VACCPAR
CONIFERS D. SHRUBS E . SHRUBS FERNS HERBS MOSSES
WOOD
1.6 0.19 0. 0. 0. 0. 0. 0.5722 23.2637 0. 0. 0.05 0. 0.0038 1.125 0. 0. 0. 0 . 0 . 0 . 0 . 0. 0. 0. 0.4375 0.125 0.0025 0. 0.1875 1.5625 1.2625
2.225 2.825 24.3887 0. 0.9363 0.4375
53.725 MINSOIL 1.125
0.66718 0.12959 - - - - - 0.5072 3.01486 - - 0.03938
0.00214 0.30882
-
- - - - - - - - - - 0.4375 0.07626 0.00176
0.11813 0.5905 0.38801
0.79096 0.67218 3.08565
0.53338 0.3351
3.81988 1.125
-
-
80 80 80 80 80 80 80 79 80 80 80 80 80 80 80 80 80 80 80 80 80 80 80 80 80 80 80 80 80 80 80 80
80 80 80 80 80 80
80 80
10 6 0 0 0 0 0 6 52 0 0 2 0 3 19 0 0 0 0 0 0 0 0 0 0 1 3 2 0 4 13 17
14 29 54 0 19 2
80 1
34
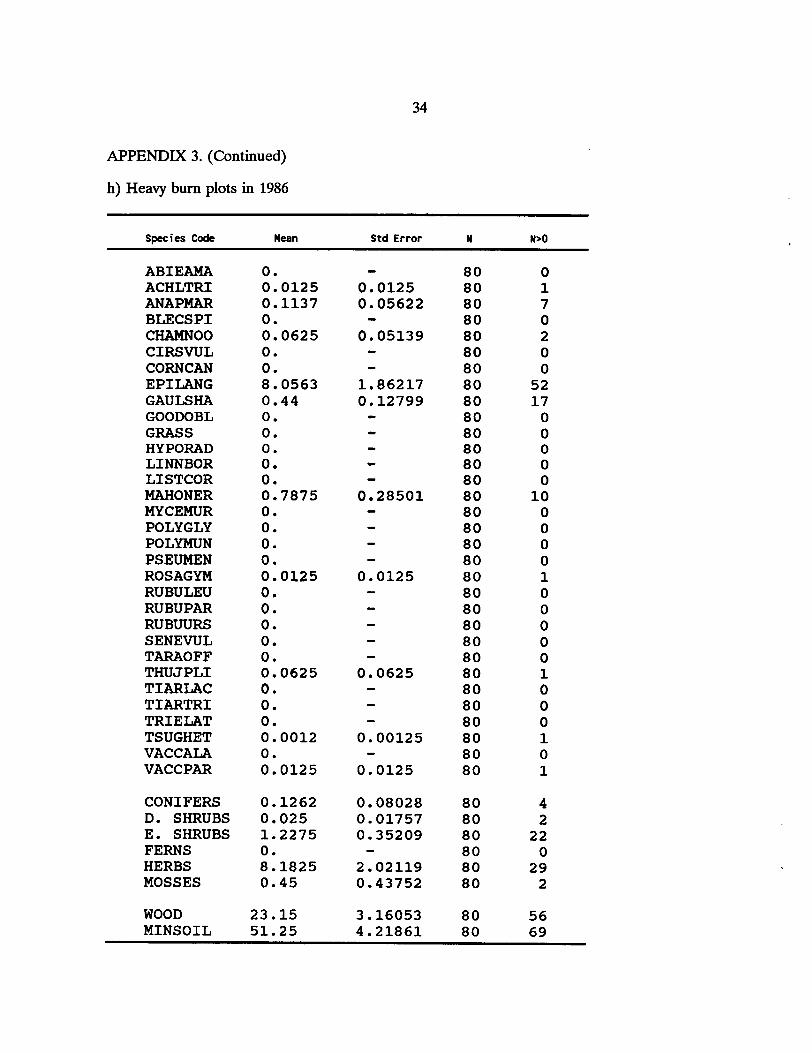
APPENDIX 3. (Continued)
h) Heavy bum plots in 1986
Species Code Mean Std Error N N>O
ABIEAMA ACHLTRI ANAPMAR BLECSPI CHAMNOO C I R S W L CORNCAN EPILANG GAULSHA GOODOBL GRASS HYPORAD LINNBOR LISTCOR MAHONER MYCEMUR POLYGLY POLYMUN PSEUMEN ROSAGYM RUBULEU RUBUPAR RUBUURS S E N E W L TARAOFF THUJPLI TIARLAC TIARTRI TRIELAT TSUGHET VACCALA VACCPAR
CONIFERS D. SHRUBS E . SHRUBS FERNS HERBS MOSSES
WOOD
0. 0.0125 0.1137 0. 0.0625 0. 0. 8.0563 0.44 0. 0. 0. 0. 0. 0.7875 0. 0. 0. 0. 0.0125 0. 0. 0. 0. 0. 0.0625 0. 0. 0. 0.0012 0. 0.0125
0.1262 0.025 1.2275 0. 8.1825 0.45
23.15 MINSOIL 51.25
- 0.0125 0.05622
0.05139 - - - 1.86217 0.12799 - - - - - 0.28501 - - - - 0.0125 - - - - - 0.0625 - - - 0.00125
0.0125
0.08028 0.01757 0.35209
2.02119 0.43752
3.16053 4.21861
-
-
80 80 80 80 80 80 80 80 80 80 80 80 80 80 80 80 80 80 80 80 80 80 80 80 80 80 80 80 80 80 80 80
80 80 80 80 80 80
80 80
0 1 7 0 2 0 0
52 17 0 0 0 0 0 10 0 0 0 0 1 0 0 0 0 0 1 0 0 0 1 0 1
4 2 22 0
29 2
56 69
35
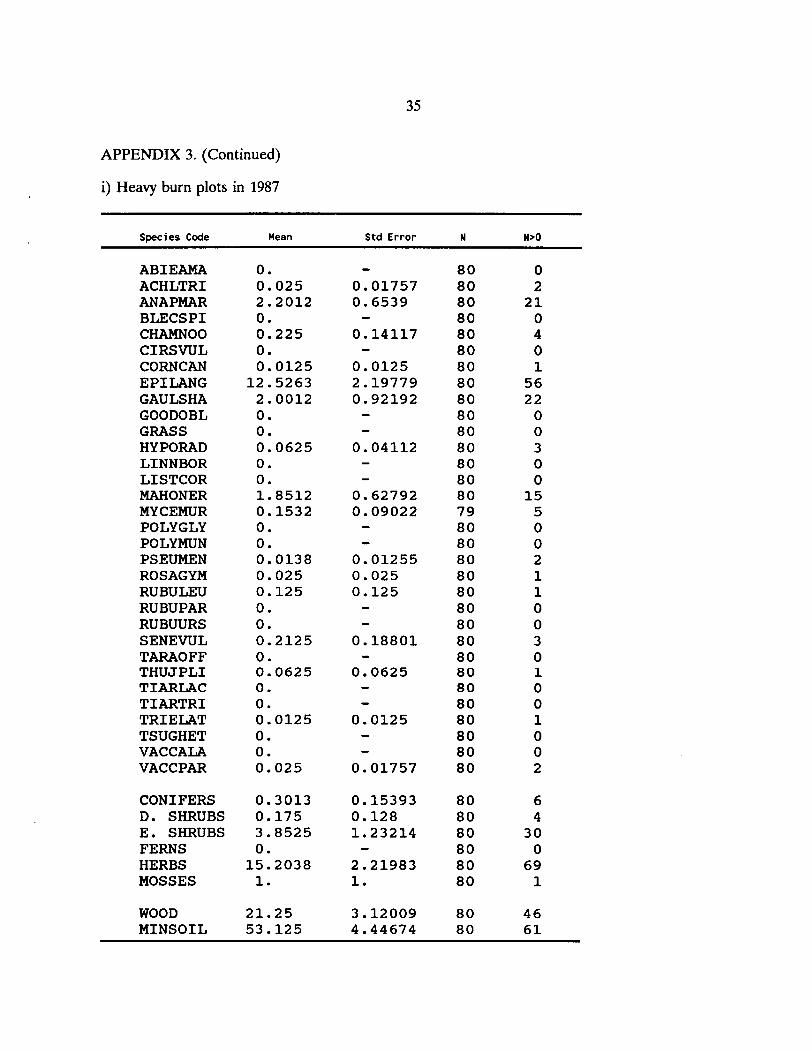
APPENDIX 3. (Continued)
i) Heavy burn plots in 1987
Species Code Mean Std Error N N>O
ABIEAMA ACHLTRI ANAPMAR BLECSPI CHAMNOO C I R S W L CORNCAN EPILANG GAULSHA GOODOBL GRASS HYPORAD LINNBOR LISTCOR MAHONER MYCEMUR POLYGLY POLYMUN PSEUMEN ROSAGYM RUBULEU RUBUPAR RUBUURS S E N E W L TARAOFF THUJPLI TIARLAC TIARTRI TRIELAT TSUGHET VACCALA VACCPAR
CONIFERS D. SHRUBS E . SHRUBS FERNS HERBS MOSSES
WOOD MINSOIL
0. 0.025 2.2012 0. 0.225 0. 0.0125 12.5263 2.0012 0. 0. 0.0625 0. 0. 1.8512 0.1532 0. 0. 0.0138 0.025 0.125 0. 0. 0.2125 0. 0.0625 0. 0. 0.0125 0. 0. 0.025
0.3013 0.175 3.8525 0. 15.2038 1.
21.25 53.125
- 0.01757 0.6539
0.14117
0.0125 2.19779 0.92192
- -
- - 0.04112 - - 0.62792 0.09022 - - 0.01255 0.025 0.125 - - 0.18801
0.0625 - - - 0.0125 - - 0.01757
0.15393 0.128 1.23214
2.21983 1.
3.12009 4.44674
-
80 80 80 80 80 80 80 80 80 80 80 80 80 80 80 79 80 80 80 80 80 80 80 80 80 80 80 80 80 80 80 80
80 80 80 80 80 80
80 80
0 2 21 0 4 0 1
56 22 0 0 3 0 0 15 5 0 0 2 1 1 0 0 3 0 1 0 0 1 0 0 2
6 4 30 0 69 1
46 61

36
APPENDIX 3. (Continued)
j) Re-bum plots in 1985
Swcies Code Mean Std Error N N>O
ABIEAMA ACHLTRI ANAPMAR BLECSPI CHAMNOO C I R S W L CORNCAN EPILANG GAULSHA GOODOBL GRASS HYPORAD LINNBOR LISTCOR MAHONER MYCEMUR POLYGLY POLYMUN PSEUMEN ROSAGYM RUBULEU RUBUPAR RUBUURS S E N E W L TARAOFF THUJPLI TIARLAC TIARTRI TRIELAT TSUGHET VACCALA VACCPAR
CONIFERS D. SHRUBS E . SHRUBS FERNS HERBS MOSSES
WOOD MINSOIL
0.625 0. 0. 0. 0. 0. 0. 1.9025 6.675 0. 0.075 0. 0. 0. 1.175 0.0775 0.025 0. 0. 0. 0. 0. 0.0775 0. 0. 0.175 0. 0. 0. 4.025 0.225 3.9525
4.825 4.255 7.85 0.025 1.98 3.475
31.45 3.25
0.39821 - - - - - - 0.34458 2.38139
0.05533 - - - - 0.72048 0.05529 0.025 - - - - - 0.07498 - - 0.175 - - - 2.25789 0.20092 1.6593
2.35908 1.66175 2.53047 0.025 0.34973 1.60408
3.92754 2.54164
40 40 40 40 40 40 40 40 40 40 40 40 40 40 40 40 40 40 40 40 40 40 40 40 40 40 40 40 40 40 40 40
40 40 40 40 40 40
40 40
4 0 0 0 0 0 0
26 12 0 2 0 0 0 6 3 1 0 0 0 0 0 2 0 0 1 0 0 0 4 2
22
8 24 16 1
26 11
39 3

37
APPENDIX 3. (Continued)
k) Re-burn plots in 1986
Species Code Mean Std Error N N>O
ABIEAMA ACHLTRI ANAPMAR BLECSPI CHAMNOO C I R S W L CORNCAN EPILANG GAULSHA GOODOBL GRASS HYPORAD LINNBOR LISTCOR MAHONER MYCEMUR POLYGLY POLYMUN PSEUMEN ROSAGYM RUBULEU RUBUPAR RUBUURS S E N E W L TARAOFF THUJPLI TIARLAC TIARTRI TRIELAT TSUGHET VACCALA VACCPAR
CONIFERS D. SHRUBS E . SHRUBS FERNS HERBS MOSSES
WOOD MINSOIL
0. 0. 0.0025 0. 0. 0. 0 .
0.0025 0. 0. 0. 0. 0. 0.35 0. 0. 0. 0.025 0. 0.75 0.0025 0.025 0. 0. 0. 0 . 0 . 0 . 0 . 0 . 0 .
0.025 0.7775 0.3525 0. 13.8275 0.125
16.875 75.625
13.825
- - 0.0025 - - - - 2.77047 0.0025 - - - - - 0.19791 - - - 0.025
0.63423 0.0025 0.025
-
- - - - - - - - - 0.025 0.63641 0.19781
2.77015 0.125
4.20122 5.0006
-
40 40 40 40 40 40 40 40 40 40 40 40 40 40 40 40 40 40 40 40 40 40 40 40 40 40 40 40 40 40 40 40
40 40 40 40 40 40
40 40
0 0 1 0 0 0 0
26 1 0 0 0 0 0 3 0 0 0 1 0 2 1 1 0 0 0 0 0 0 0 0 0
1 3 4 0 27 1
19 37

38
APPENDIX 3. (Concluded)
1) Re-bum plots in 1987
Species Code Mean Std Error N N>O
ABIEAMA ACHLTRI ANAPMAR BLECSPI CHAMNOO C I R S W L CORNCAN EPILANG GAULSHA GOODOBL GRASS HYPORAD LINNBOR LISTCOR MAHONER MYCEMUR POLYGLY POLYMUN PSEUMEN ROSAGYM RUBULEU RUBUPAR RUBUURS S E N E W L TARAOFF THUJPLI TIARLAC TIARTRI TRIELAT TSUGHET VACCALA VACCPAR
CONIFERS D. SHRUBS E . SHRUBS FERNS HERBS MOSSES
WOOD MINSOIL
0. 0. 0 .05 0. 0. 1 .85 0. 4.1575 0. 0. 0 .075 0 .525 0. 0. 0 .9 0.055 0. 0. 0. 0. 2 .5 0 . 0 .5 0. 0. 0 .225 0. 0. 0. 0 . 0 . 0 .
0.225 3. 0 .9 0. 6.6375 0.
15.625 73.
- - 0.05 - - 1.33328
0.99184 - - -
0.075 0.29955 - - 0.46105 0.04999 - - - - 2.25747
0.39223 - - -
0 .14091 - - - - - - 0.14091 2.40059 0.46105
1.65347 - -
4.07536 5.71996
40 40 40 40 40 40 40 40 40 40 40 40 40 40 40 40 40 4 0 40 40 40 40 40 40 40 4 0 40 40 40 40 40 40
40 40 40 40 40 40
40 40
0 0 1 0 0 4 0
29 0 0 1 4 0 0 6 3 0 0 0 0 2 0 2 0 0 3 0 0 0 0 0 0
3 3 6 0
35 0
18 35


