56
Vehicle mass data for pavement design and asset management Weigh-In-Motion Forum, September 2017 Dr Michael Moffatt
Vehicle mass data for pavement design
and asset managementWeigh-In-Motion Forum, September 2017
Dr Michael Moffatt
2
• Pavement design
– Rigid pavements
– Flexible pavements
• Asset management
• Looking forwards
Overview
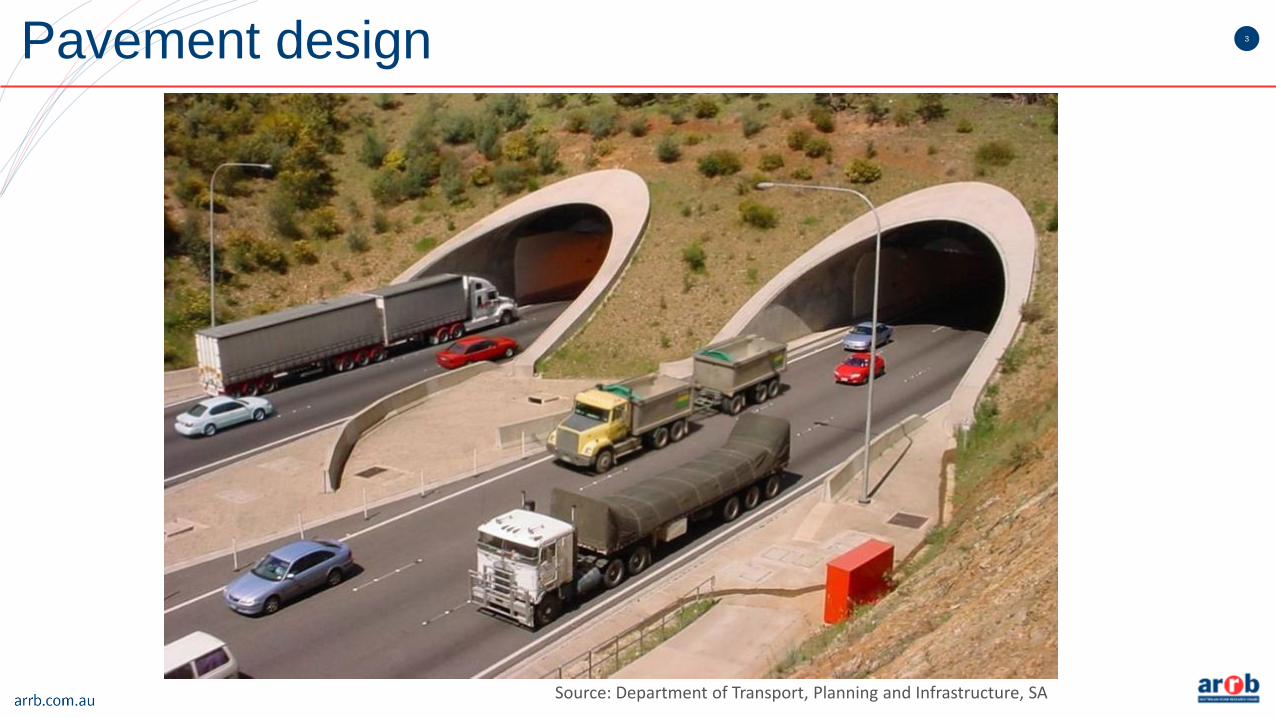
3Pavement design
Source: Department of Transport, Planning and Infrastructure, SA

4
1979 1987 1992 2004 20082010
2012
5
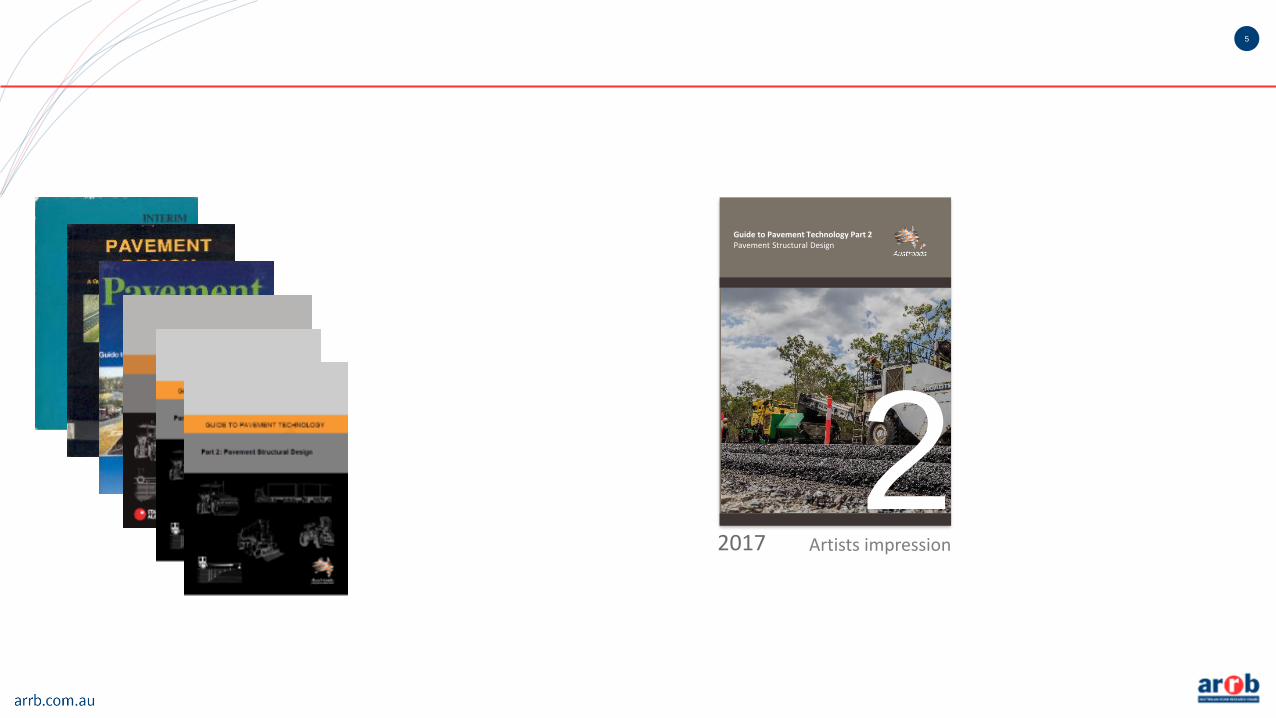
Guide to Pavement Technology Part 2Pavement Structural Design
2Artists impression2017
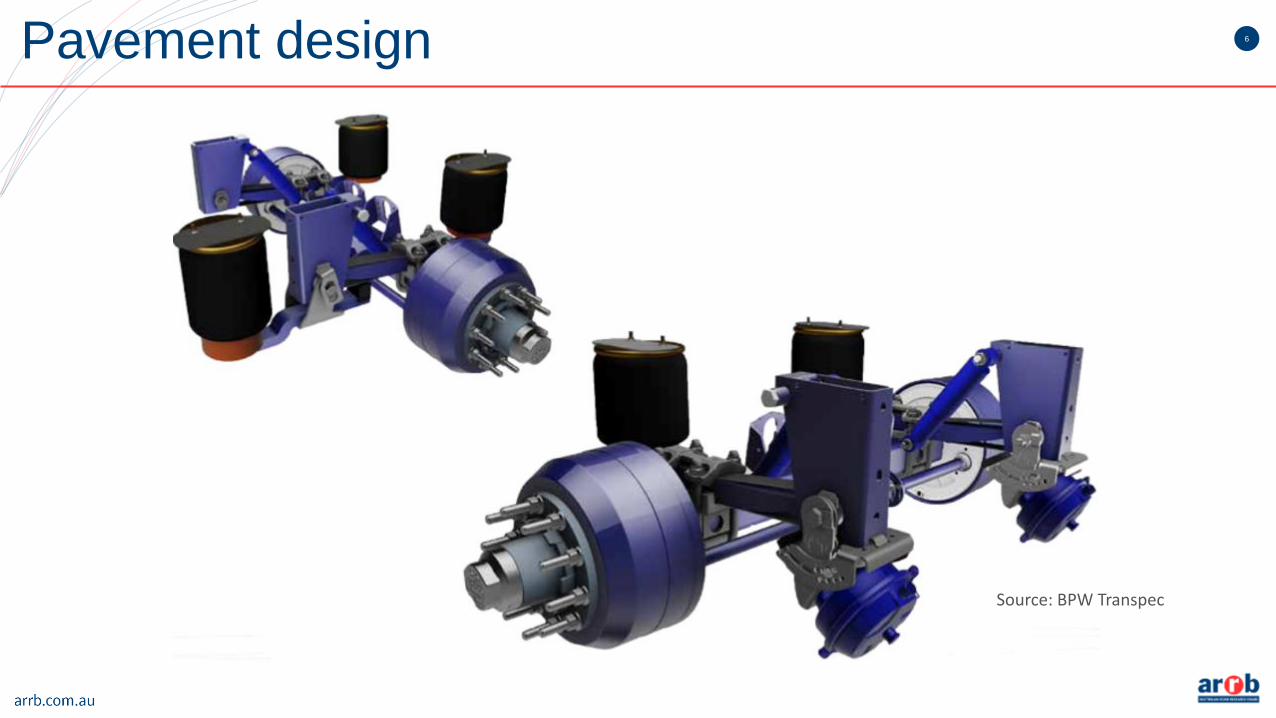
6Pavement design
Source: BPW Transpec

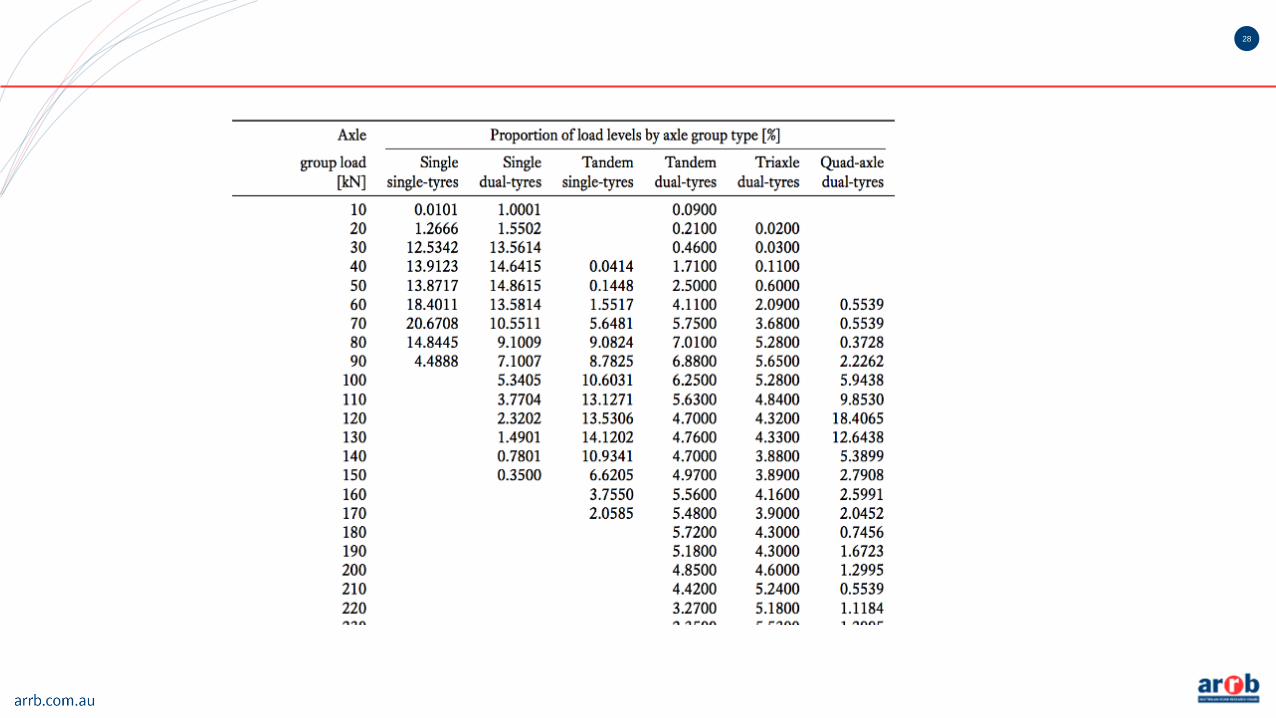
7Traffic load distribution
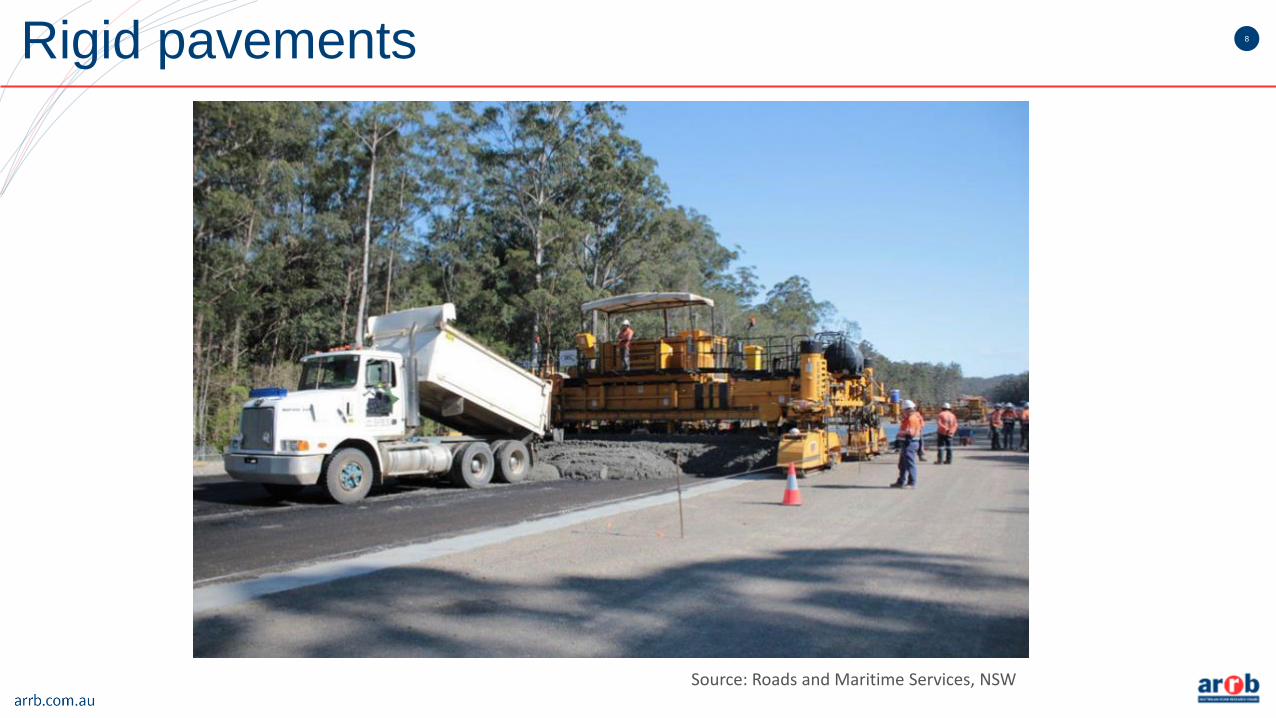
8Rigid pavements
Source: Roads and Maritime Services, NSW
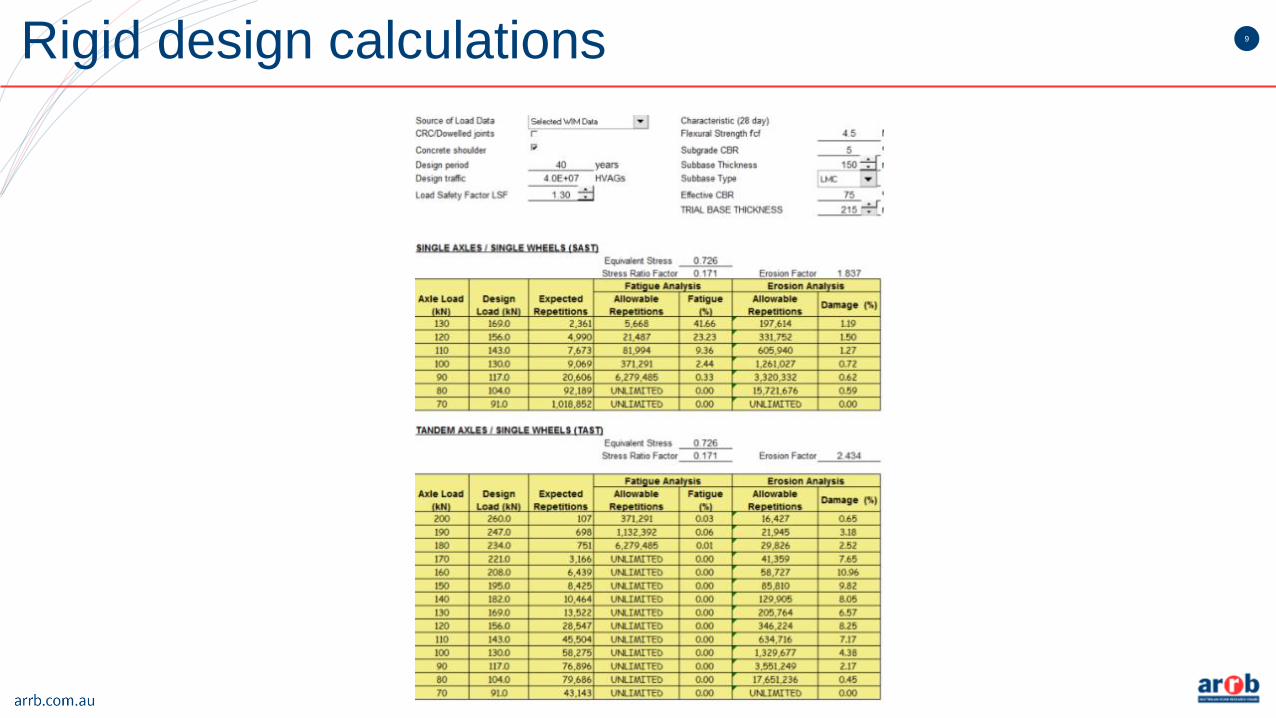
9Rigid design calculations
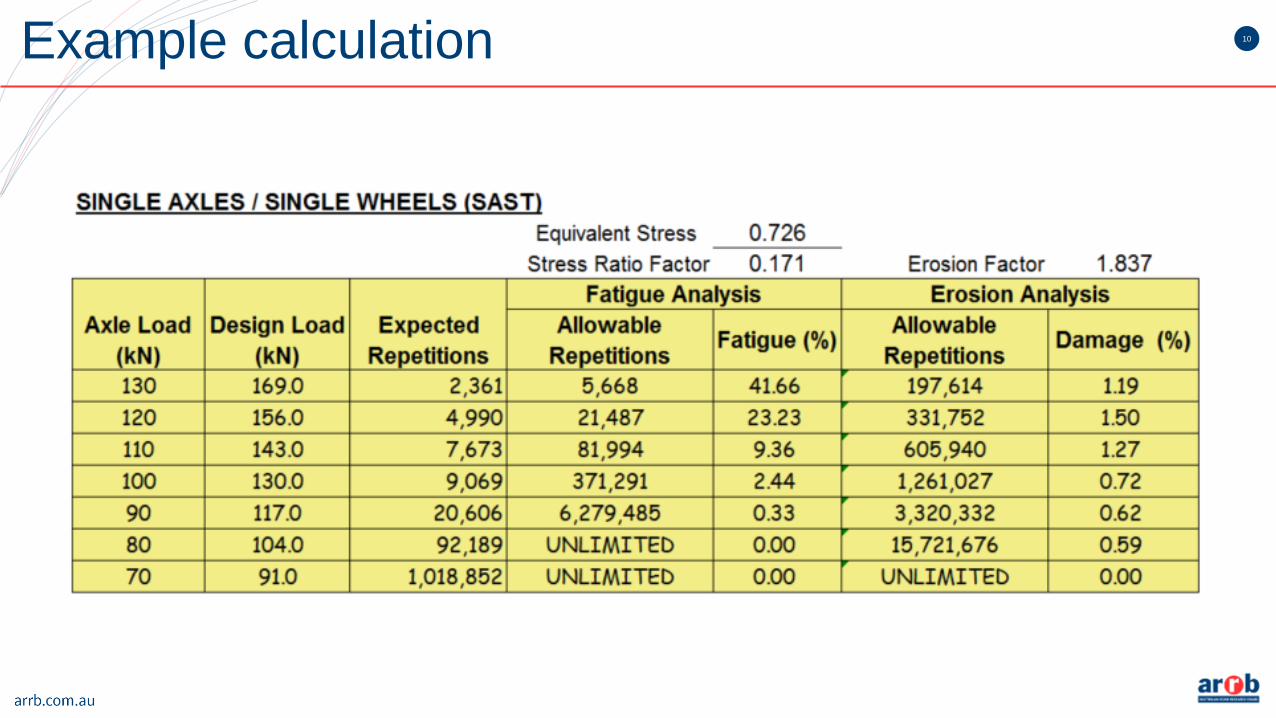
10Example calculation
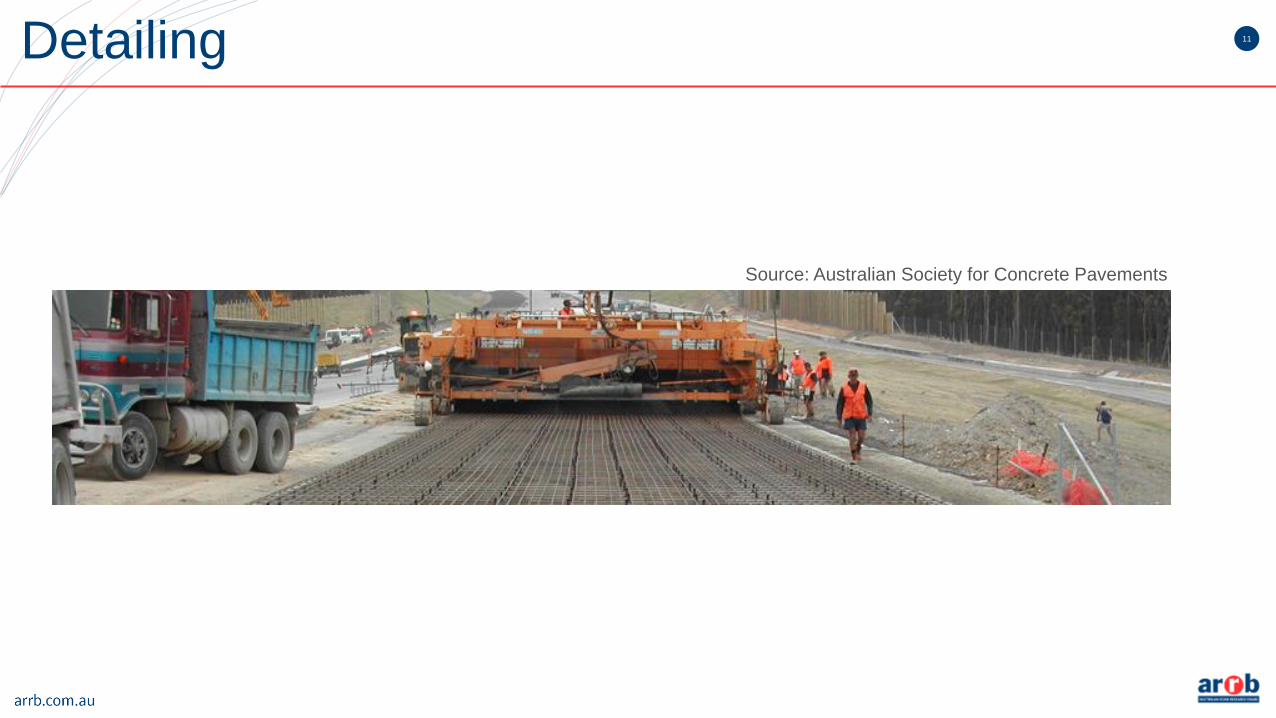
11Detailing
Source: Australian Society for Concrete Pavements
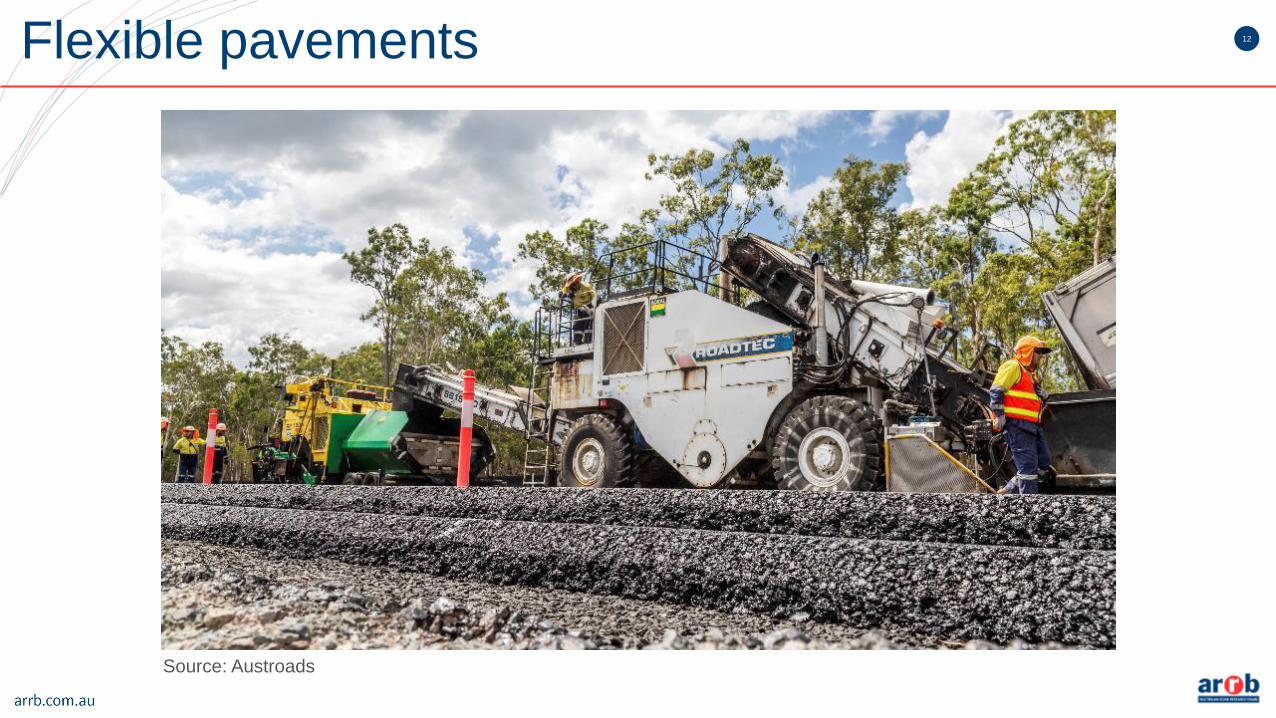
12Flexible pavements
Source: Austroads

13
AASHO Road TestAASHO Road Test
Source: AASHO
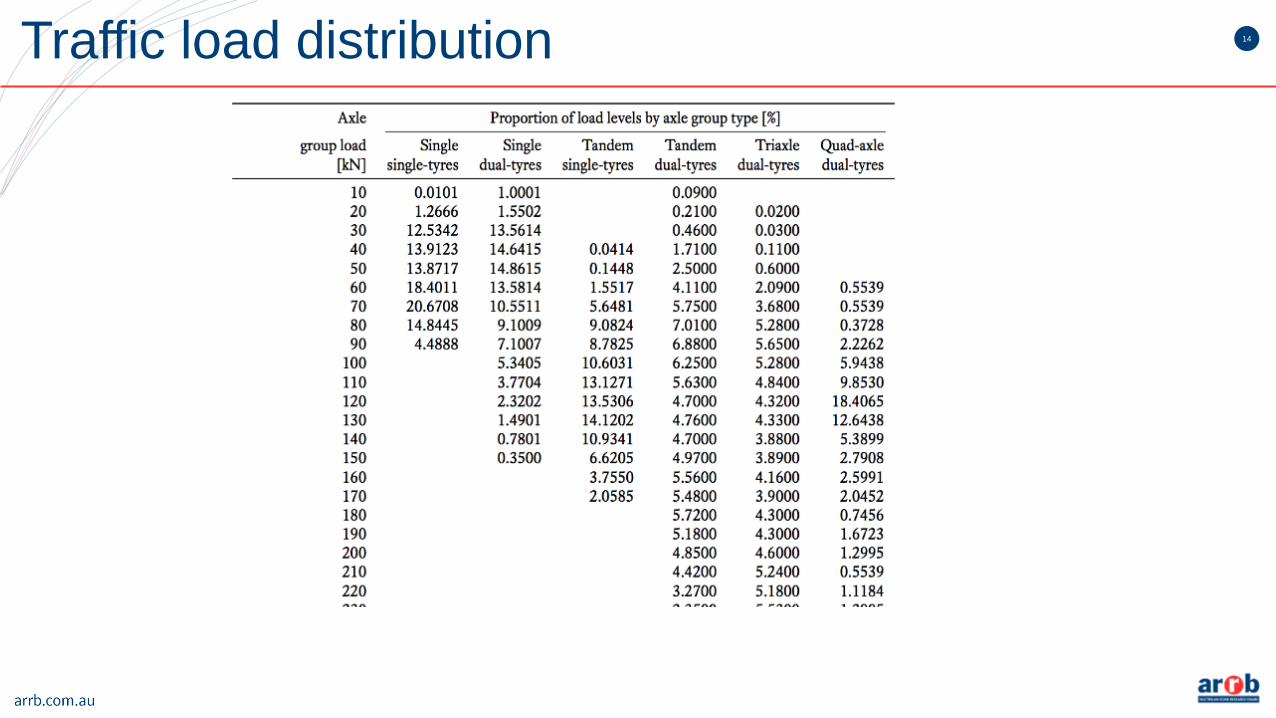
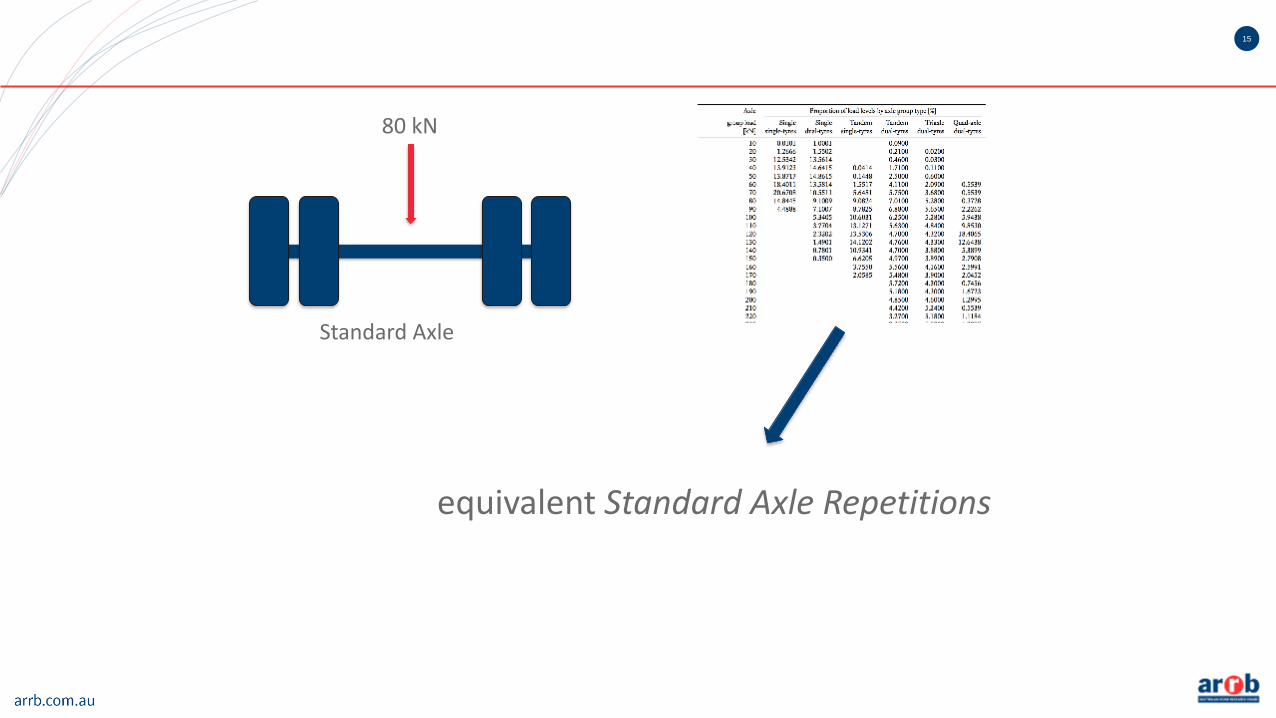
14Traffic load distribution
15
80 kN
Standard Axle
equivalent Standard Axle Repetitions
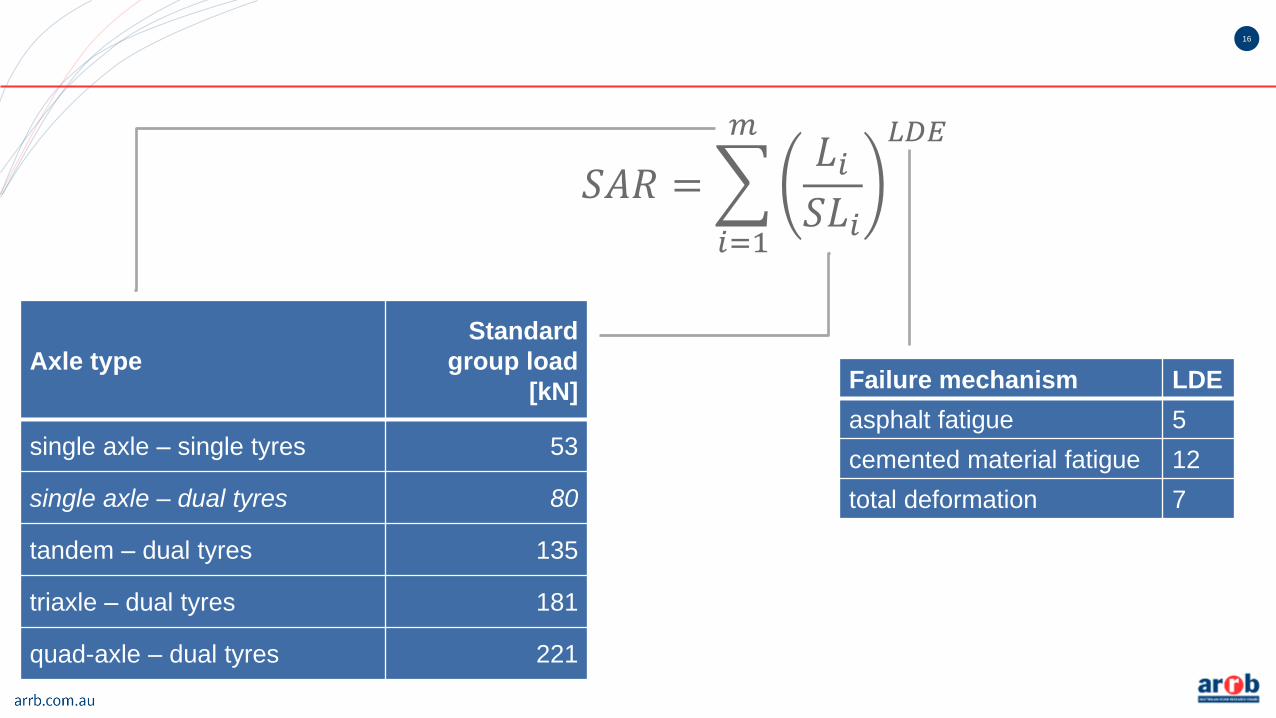
16
Axle type
Standard
group load
[kN]
single axle – single tyres 53
single axle – dual tyres 80
tandem – dual tyres 135
triaxle – dual tyres 181
quad-axle – dual tyres 221
Failure mechanism LDE
asphalt fatigue 5
cemented material fatigue 12
total deformation 7
𝑆𝐴𝑅 =
𝑖=1
𝑚𝐿𝑖𝑆𝐿𝑖
𝐿𝐷𝐸

17
𝑆𝐴𝑅 =
𝑖=1
𝑚𝐿𝑖𝑆𝐿𝑖
𝐿𝐷𝐸
𝐸𝑆𝐴 =
𝑖=1
𝑚𝐿𝑖𝑆𝐿𝑖
4Equivalent
Standard
Axles

18
Axle type
Standard
group load
[kN]
single axle – single tyres 53
single axle – dual tyres 80
tandem – dual tyres 135
triaxle – dual tyres 181
quad-axle – dual tyres 221
Failure mechanism LDE
asphalt fatigue 5
cemented material fatigue 12
total deformation 7
𝑆𝐴𝑅 =
𝑖=1
𝑚𝐿𝑖𝑆𝐿𝑖
𝐿𝐷𝐸
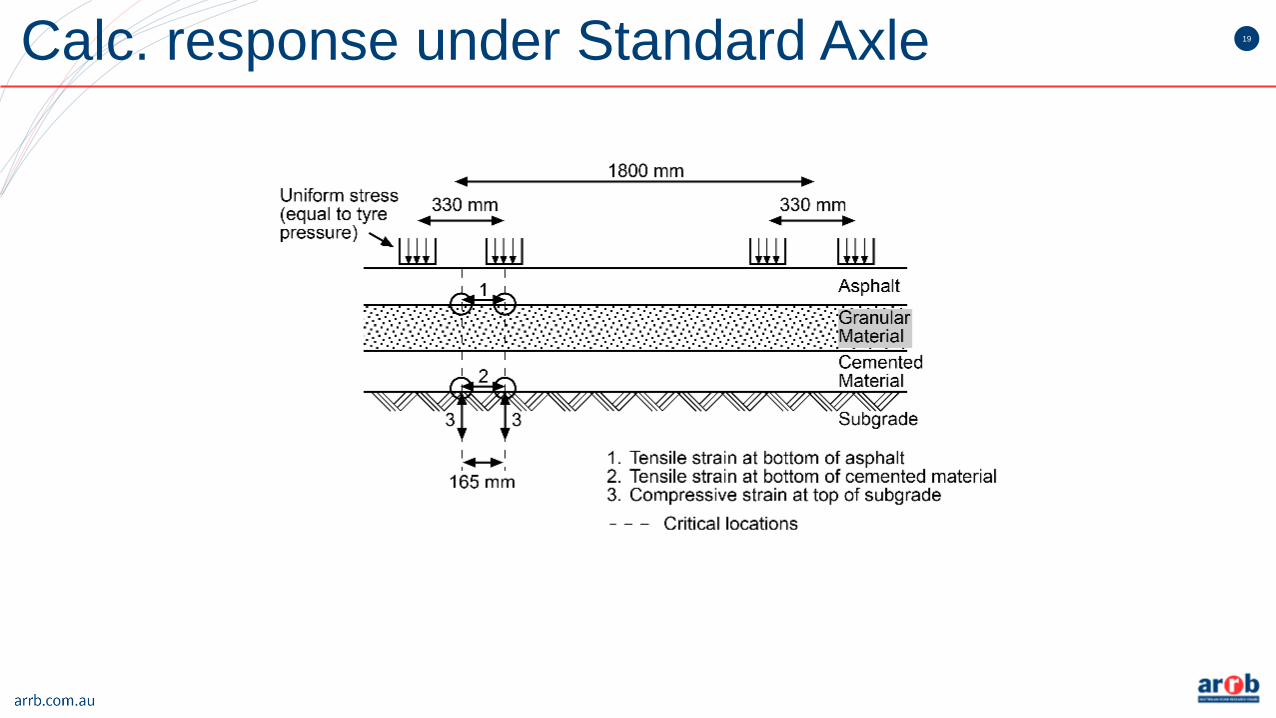
19Calc. response under Standard Axle

20Design process
Austroads
traffic load distribution +
HVAG count
SAR5 (SAR7, SAR12)
Model candidate structure
with Standard Axle
Allowable loading cf. SAR5
2012
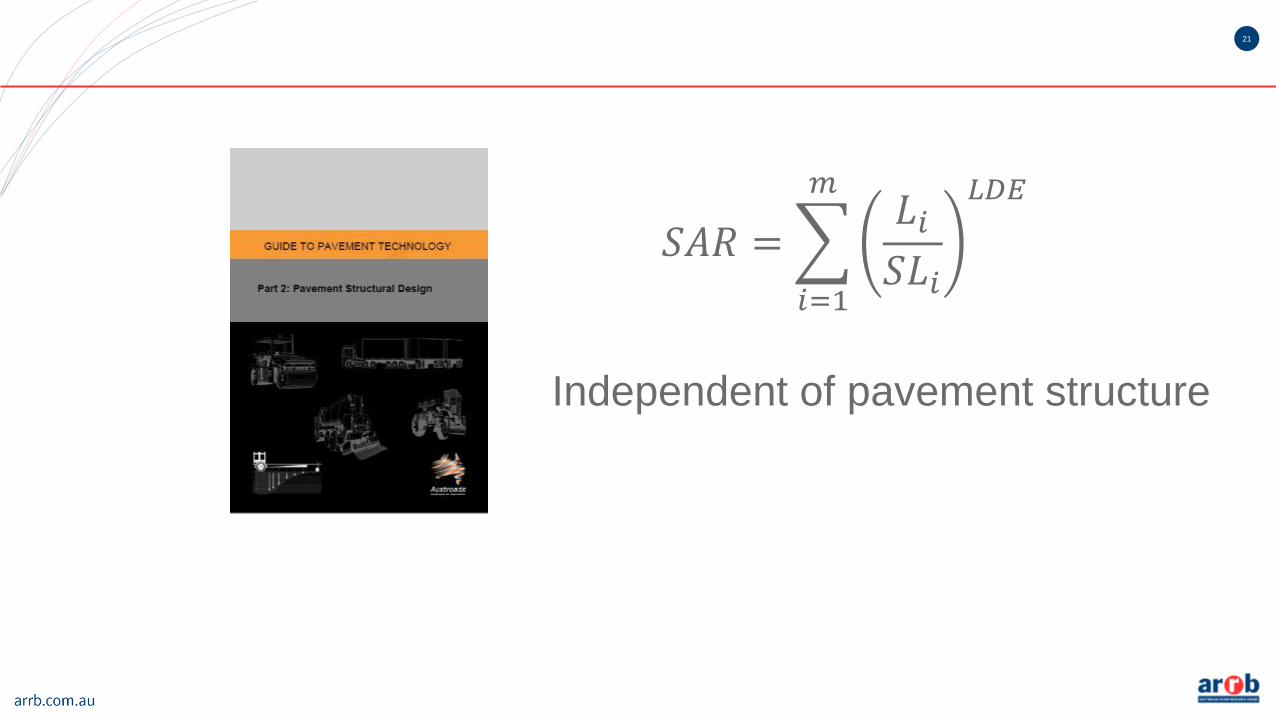
21
𝑆𝐴𝑅 =
𝑖=1
𝑚𝐿𝑖𝑆𝐿𝑖
𝐿𝐷𝐸
Independent of pavement structure
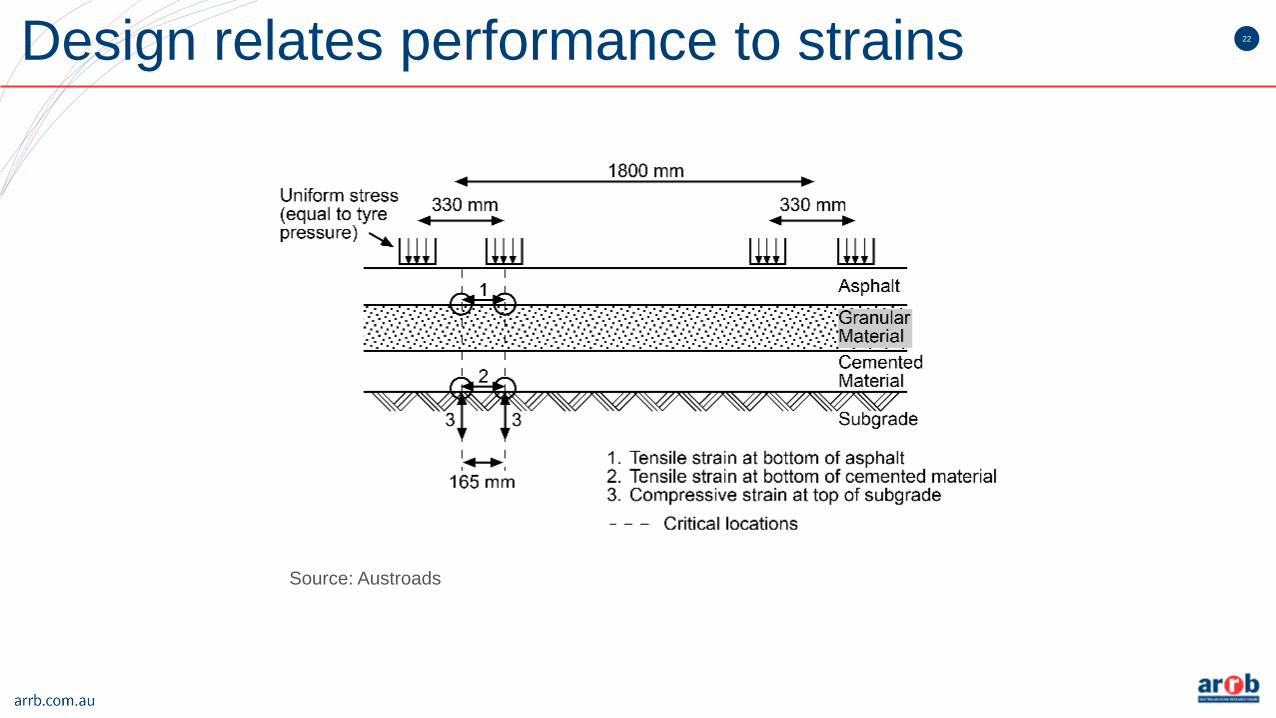
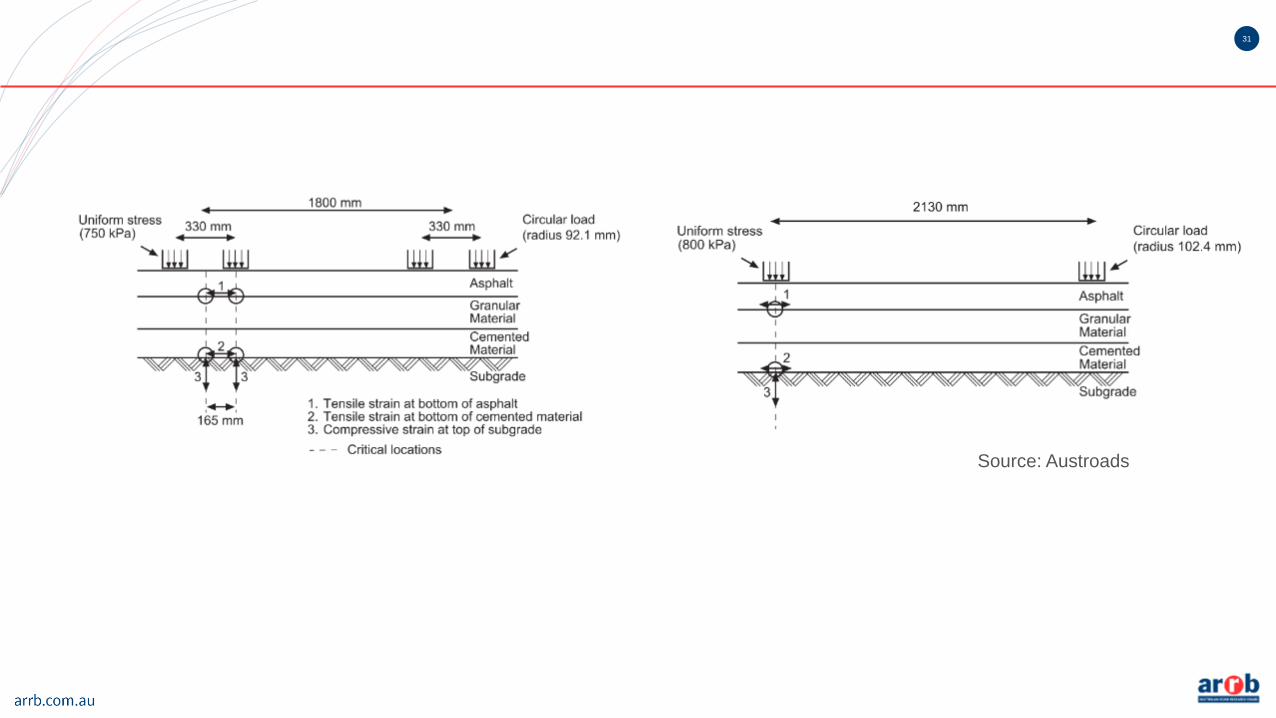
22Design relates performance to strains
Source: Austroads
23
Guide to Pavement Technology Part 2Pavement Structural Design
2Artists impression
(ESAs not dead yet)
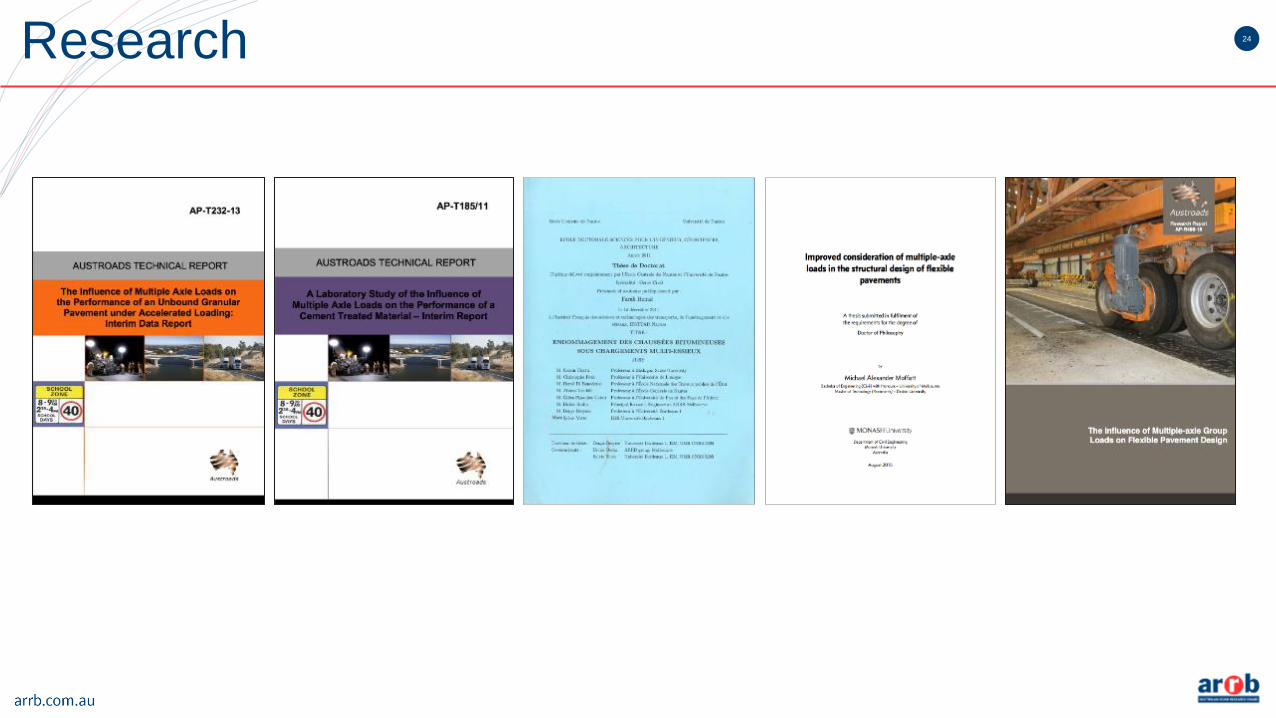
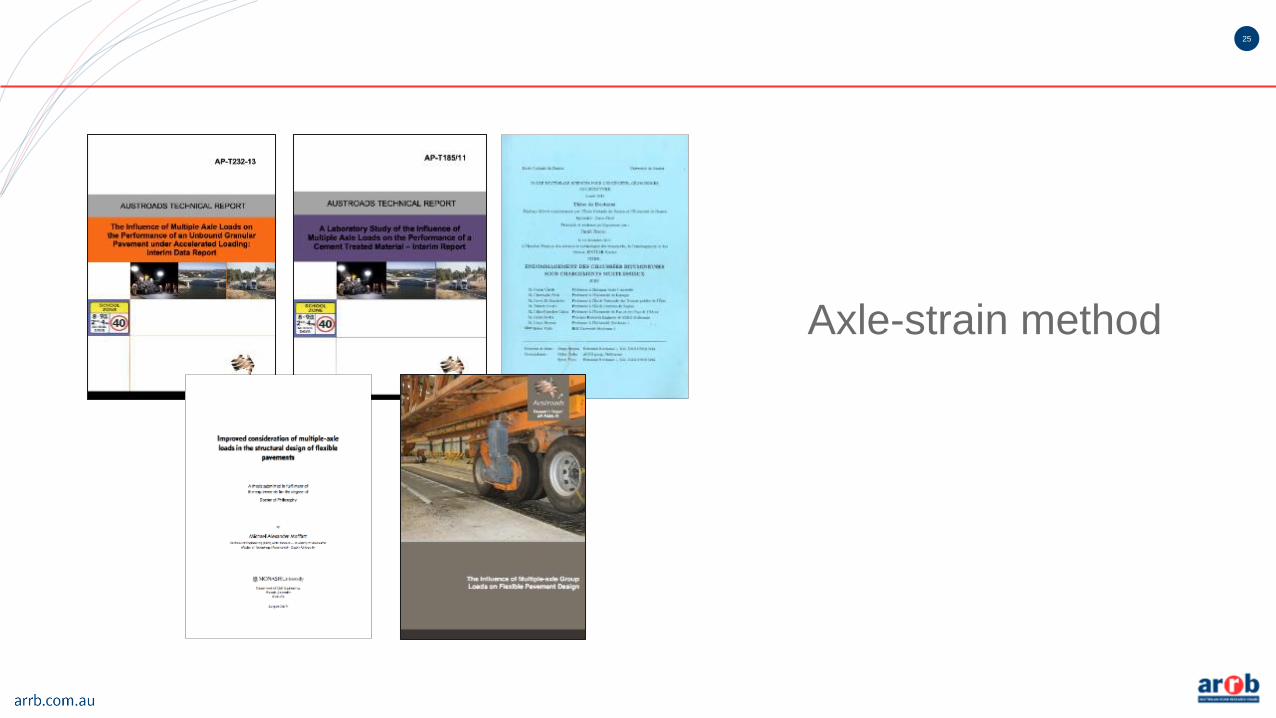
24Research
25
Axle-strain method
26
Guide to Pavement Technology Part 2Pavement Structural Design
2Artists impression
2017 axle strain method
Removes SARs
Calculates damage – from strains –
caused by each axle in TLD
Approach aligns with that for rigid
pavements

27Design process
Austroads
traffic load distribution +
HVAG count
SAR5
Model candidate structure
with Standard Axle
Allowable loading cf. SAR5
aaaaa
traffic load distribution +
HVAG count
Model candidate structure
with axle types/loads in TDL
Sum damage (want ≤ 100 %)
2012 2017
28

29
Axle group
load (kN)
Expected group
repetitions
Axles in
group
Critical strain
(𝝁𝒎/𝒎)
Allowable
group repetitions
Damage
10 3 740 2 9.6 6.31 x 10¹² 5.92 x 10⁻¹⁰
20 14 905 2 19.3 1.92 x 10¹¹ 7.75 x 10⁻⁸
30 16 167 2 28.9 2.55 x 10¹⁰ 6.33 x 10⁻⁷
40 51 204 2 38.5 6.09 x 10⁹ 8.41 x 10⁻⁶
50 168 246 2 48.1 2.00 x 10⁹ 8.42 x 10⁻⁵
60 246 335 2 57.8 7.98 x 10⁸ 3.09 x 10⁻⁴
70 283 346 2 67.4 3.70 x 10⁸ 7.66 x 10⁻⁴
Tandem group example
30
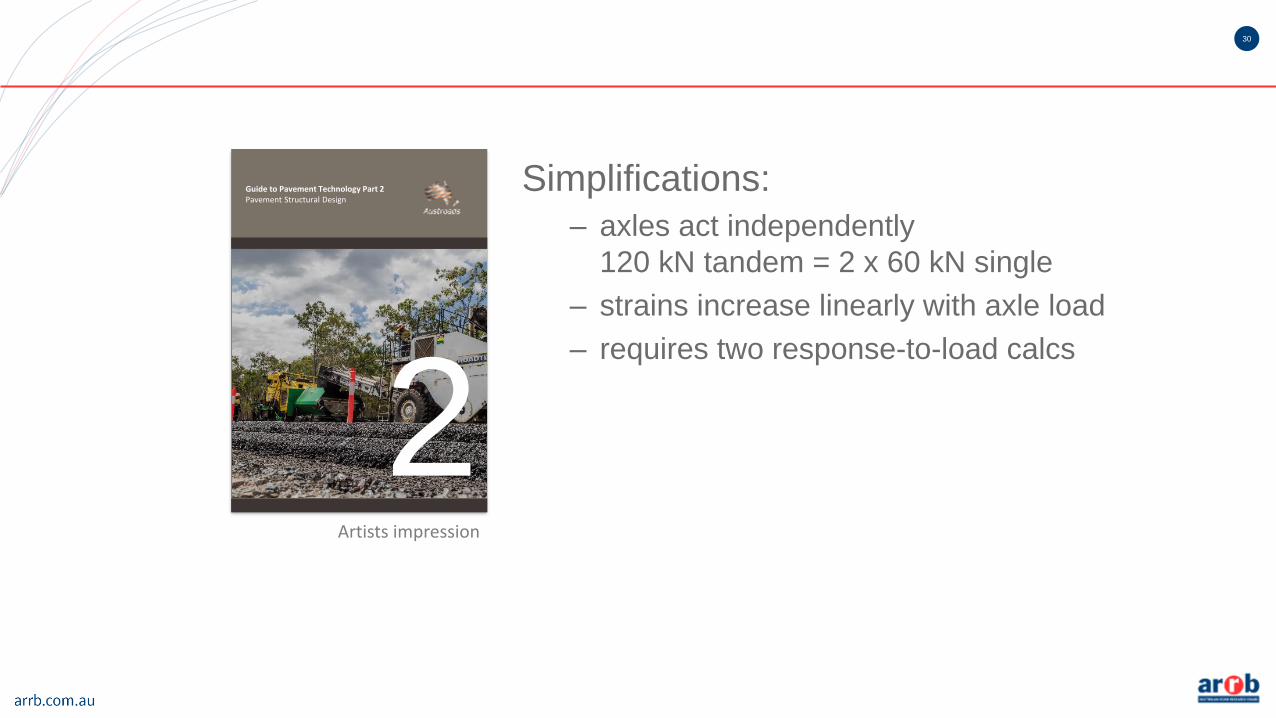
Guide to Pavement Technology Part 2Pavement Structural Design
2Artists impression
Simplifications:
– axles act independently
120 kN tandem = 2 x 60 kN single
– strains increase linearly with axle load
– requires two response-to-load calcs
31
Source: Austroads

32
Guide to Pavement Technology Part 2Pavement Structural Design
2Artists impression
Effect of 2007 changes for bound materials
Cemented materials: Similar thickness
Lean-mix concrete: Similar thickness
Asphalt: Reduced thickness
for heavy-duty
structures
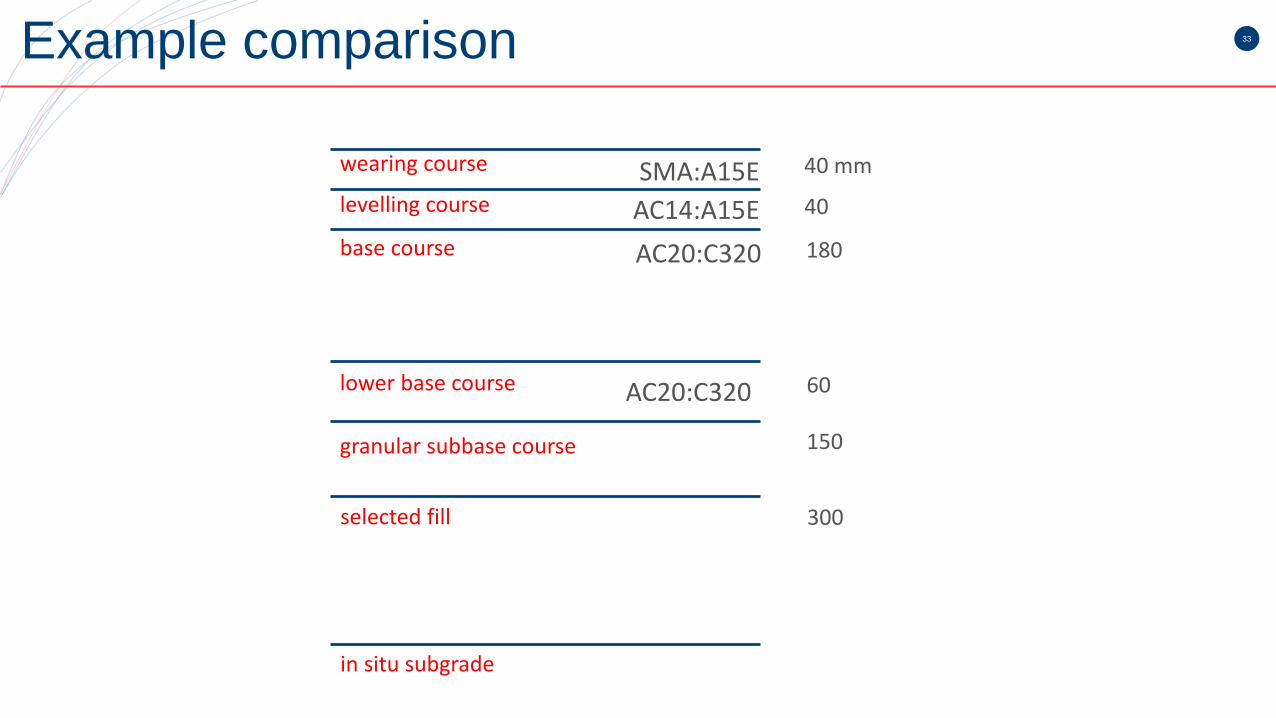
33Example comparison
wearing course
levelling course
base course
lower base course
granular subbase course
selected fill
in situ subgrade
SMA:A15E
AC14:A15E
AC20:C320
AC20:C320
40 mm
40
180
60
150
300
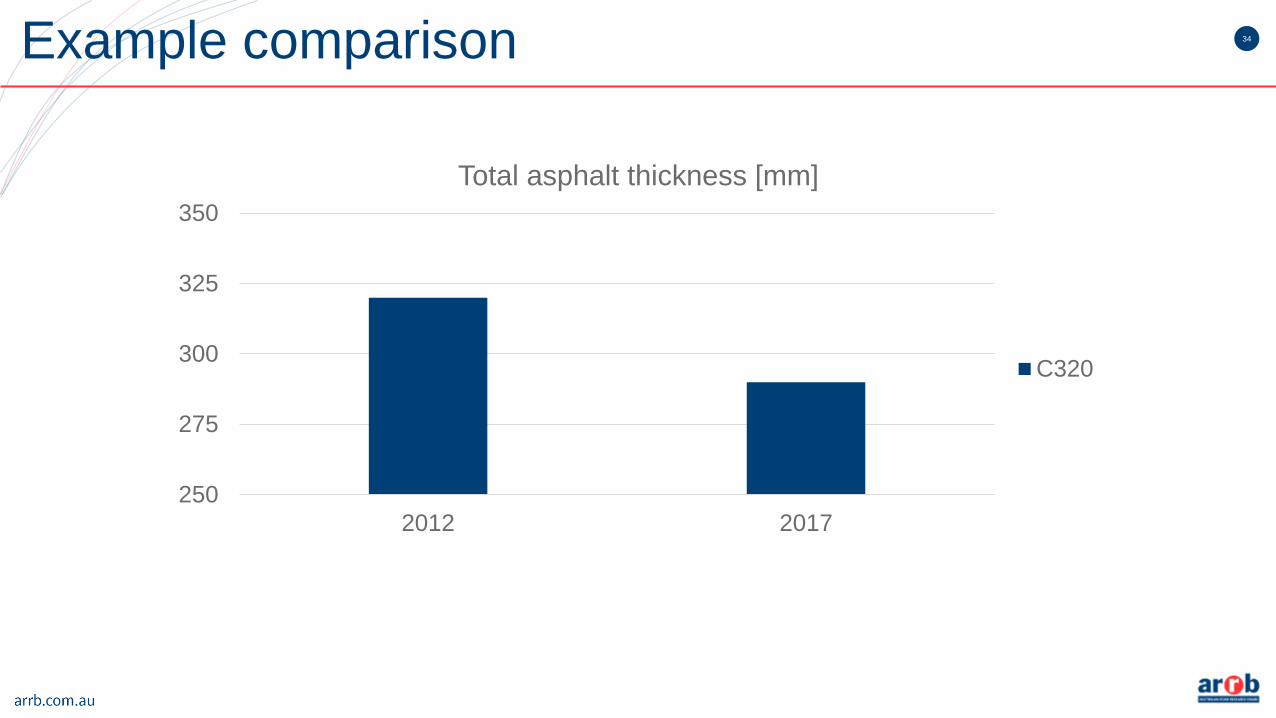
34Example comparison
250
275
300
325
350
2012 2017
Total asphalt thickness [mm]
C320

35Policy & asset management
36Network-level life-cycle costing example
• Freight Axle Mass Limits Investigation Tool (FAMLIT)
– marginal cost of road wear from heavy vehicles
• informs road asset managers of expected maintenance
and rehabilitation costs resulting from a change in traffic
loading
– maintenance standards
– traffic volumes
– construction standards
– climate/location, etc.
36
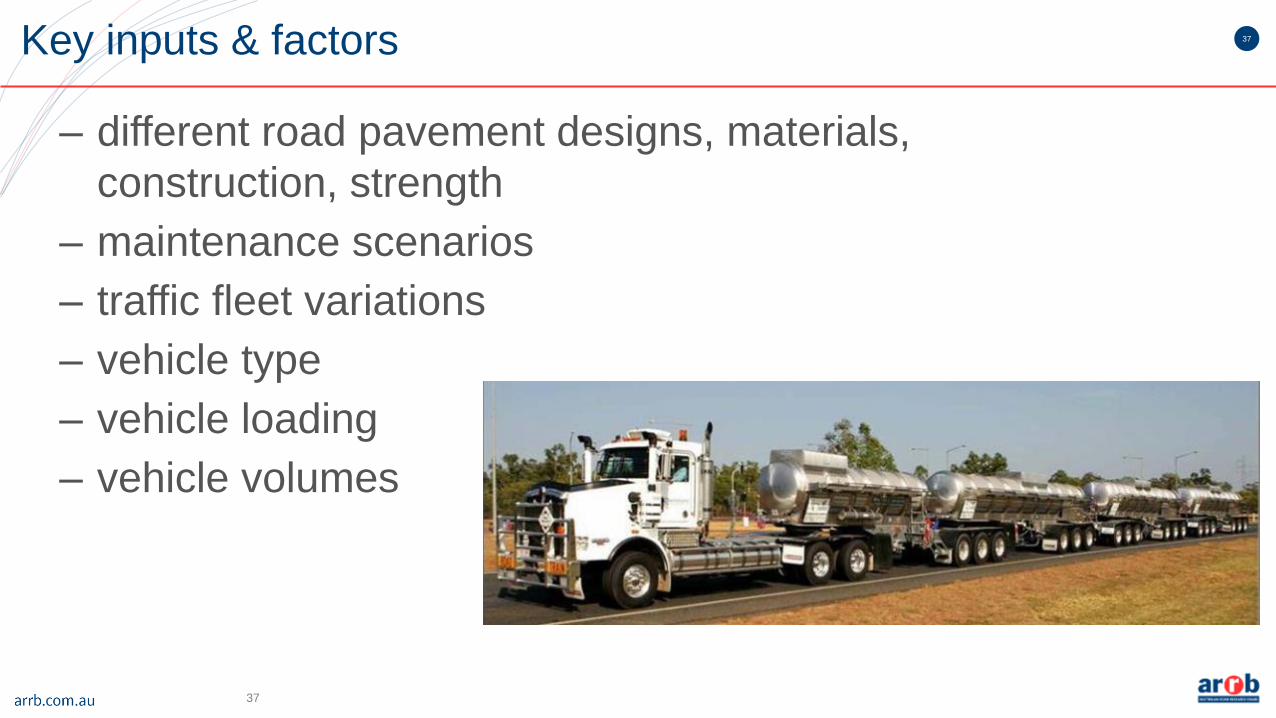
37Key inputs & factors
– different road pavement designs, materials,
construction, strength
– maintenance scenarios
– traffic fleet variations
– vehicle type
– vehicle loading
– vehicle volumes
37
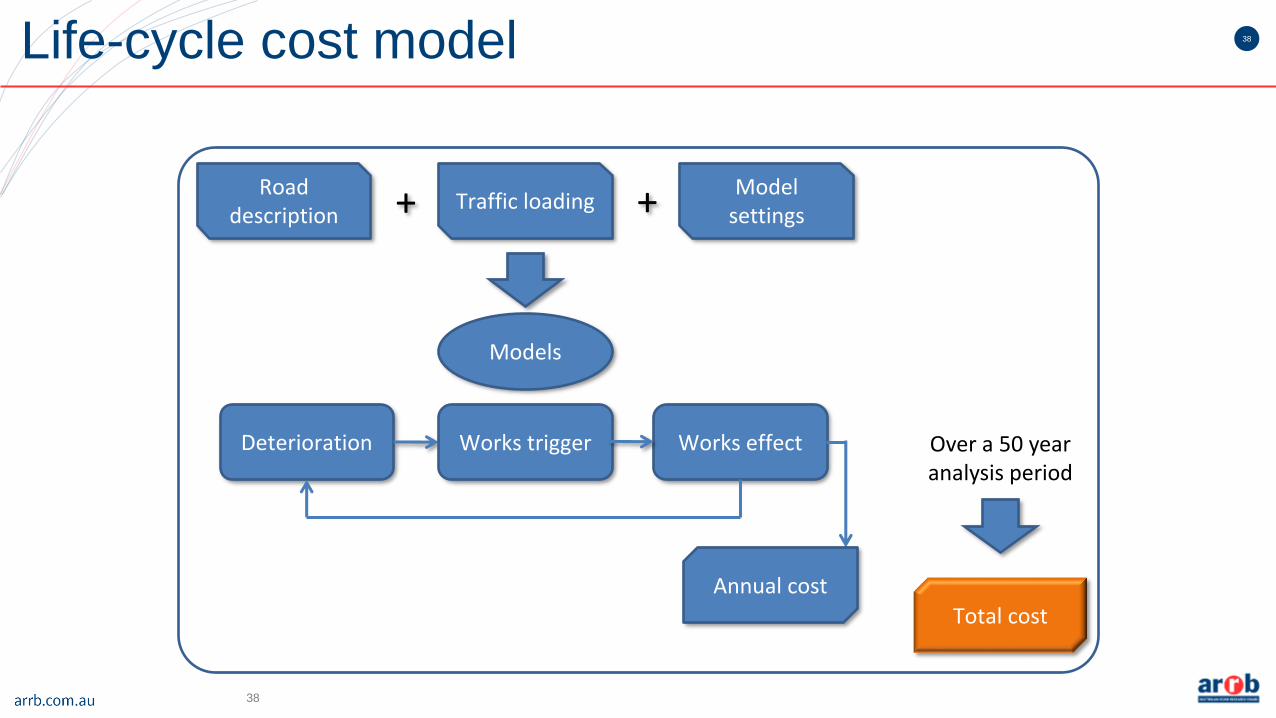
38Life-cycle cost model
38
Road description
Traffic loading
Models
Deterioration Works effect
+ Model settings+
Annual cost
Works trigger
Total cost
Over a 50 year analysis period
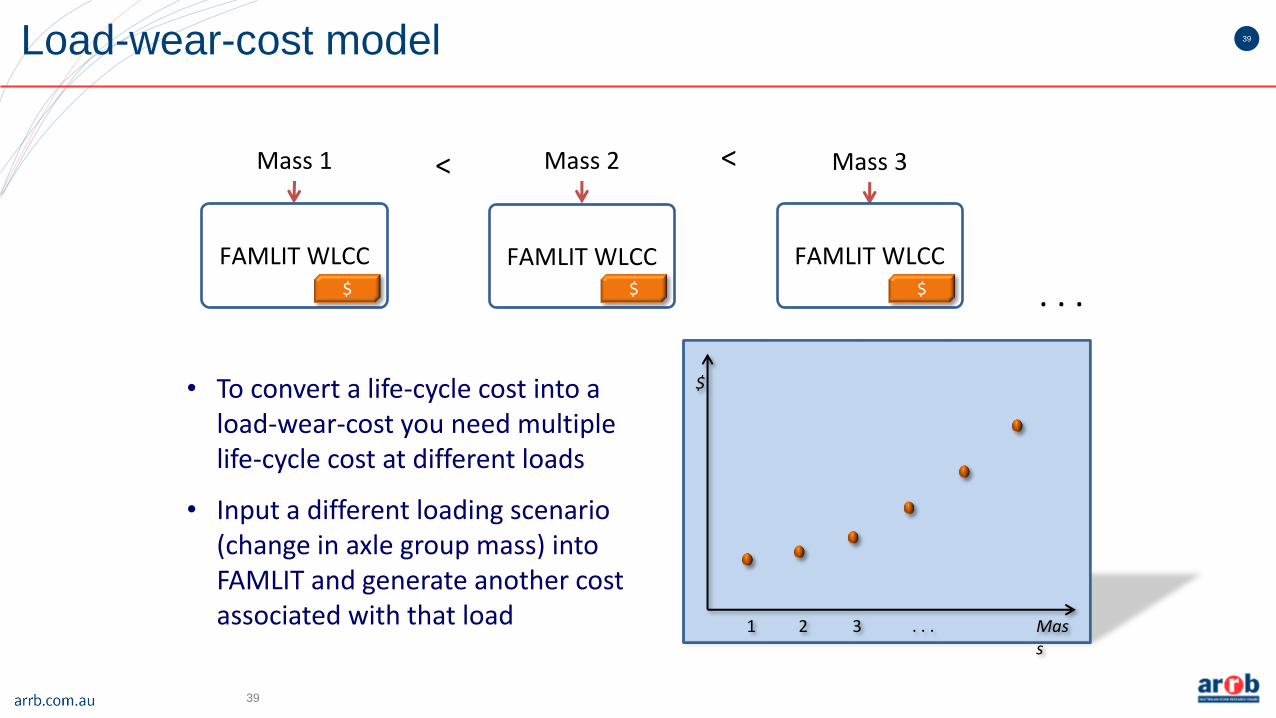
39Load-wear-cost model
39
. . .
Mass 1 Mass 2 Mass 3
1 2 3 . . . Mass
$
< <
FAMLIT WLCC FAMLIT WLCC FAMLIT WLCC$ $ $
• To convert a life-cycle cost into a load-wear-cost you need multiple life-cycle cost at different loads
• Input a different loading scenario (change in axle group mass) into FAMLIT and generate another cost associated with that load

40

Looking forwards
42
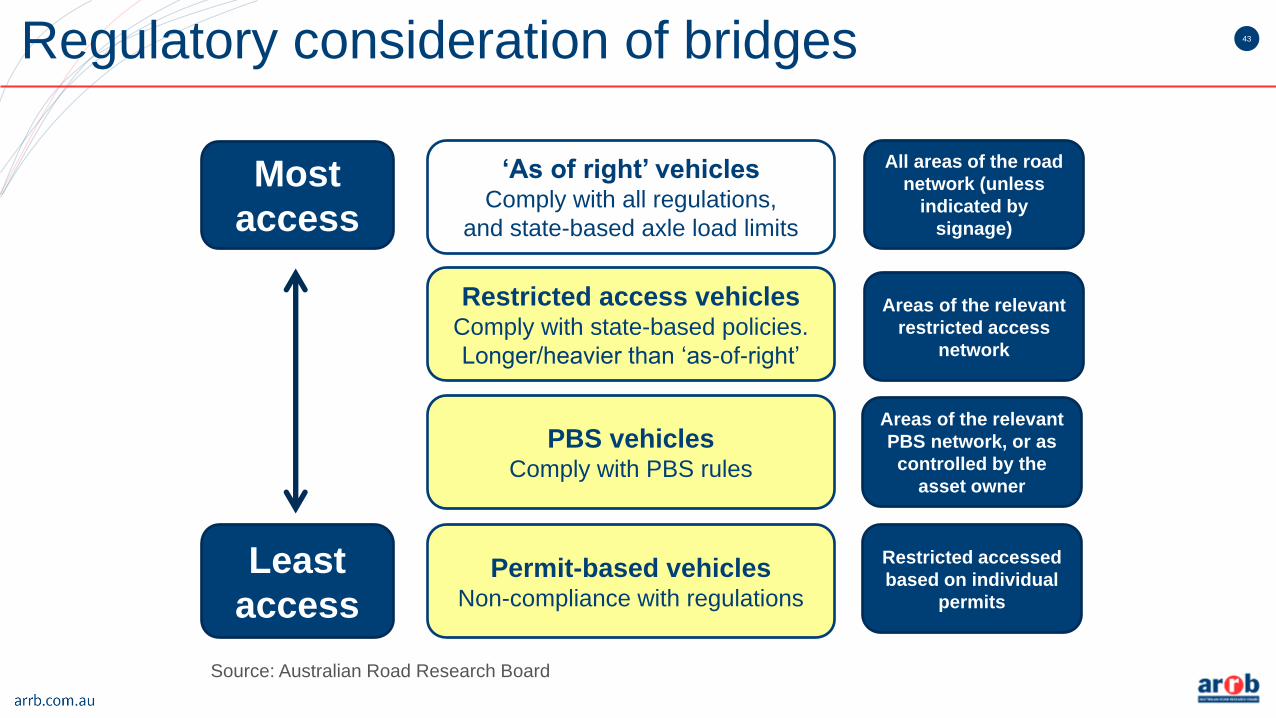
43Regulatory consideration of bridges
Most
access
Least
access
‘As of right’ vehiclesComply with all regulations,
and state-based axle load limits
All areas of the road
network (unless
indicated by
signage)
PBS vehiclesComply with PBS rules
Areas of the relevant
PBS network, or as
controlled by the
asset owner
Restricted access vehiclesComply with state-based policies.
Longer/heavier than ‘as-of-right’
Areas of the relevant
restricted access
network
Permit-based vehiclesNon-compliance with regulations
Restricted accessed
based on individual
permits
Source: Australian Road Research Board
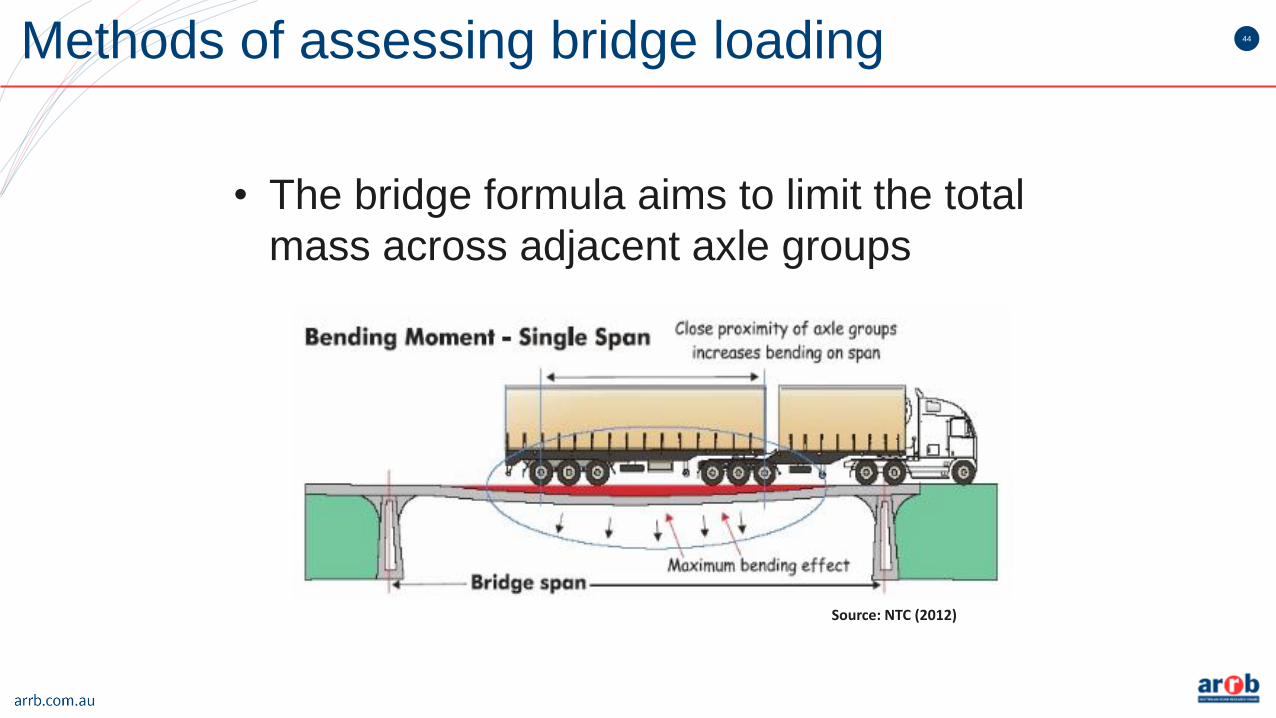
44Methods of assessing bridge loading
• The bridge formula aims to limit the total
mass across adjacent axle groups
Source: NTC (2012)
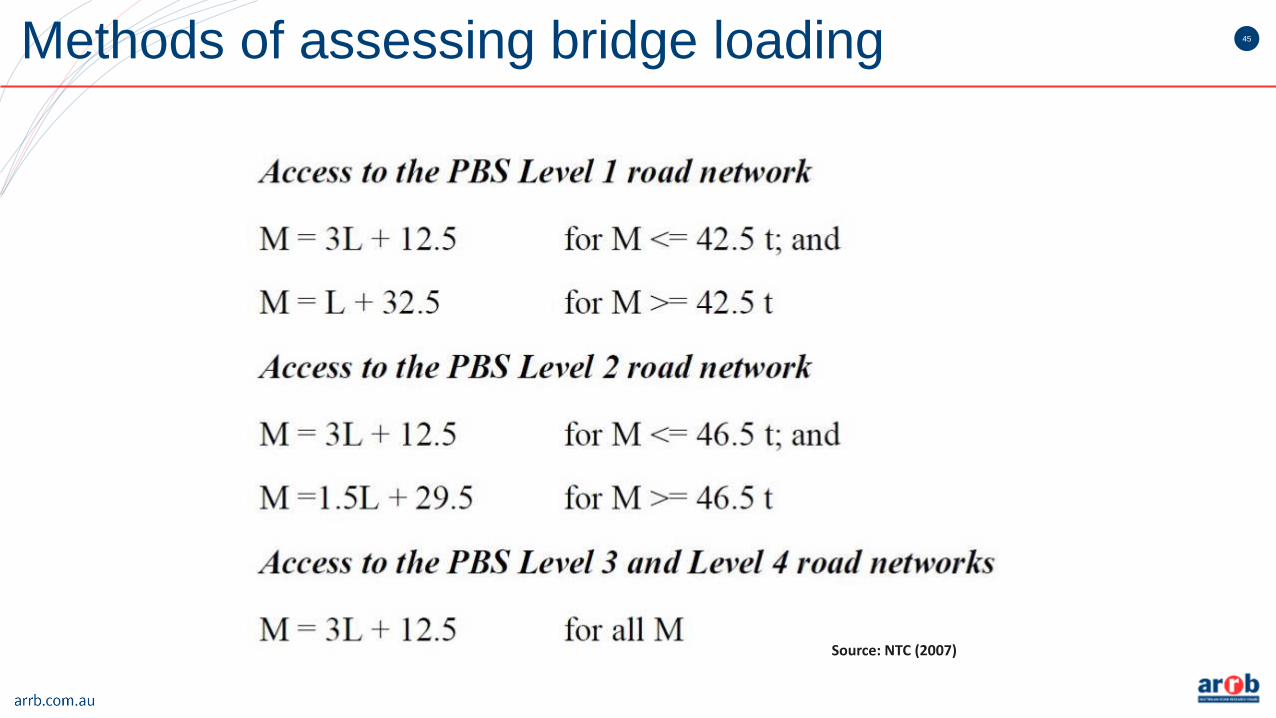
45Methods of assessing bridge loading
Source: NTC (2007)

46

47On-board mass measurement & reporting
Source: Australian Road Research Board
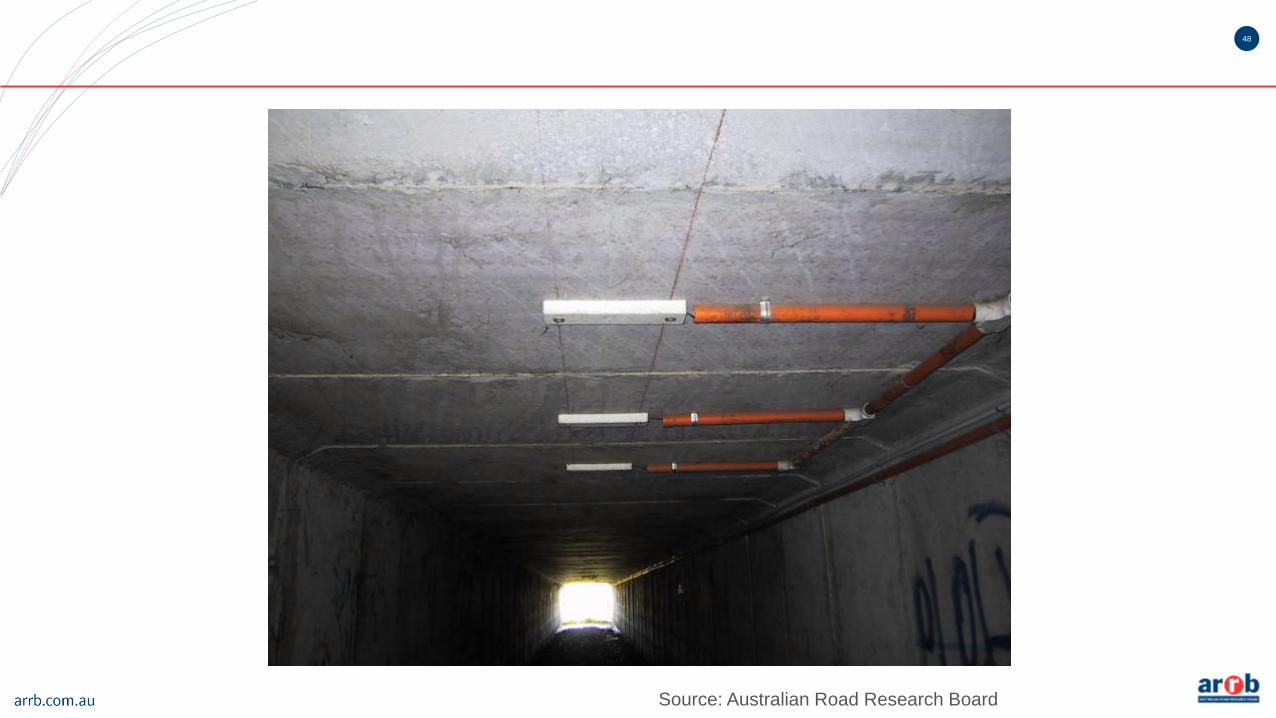
48
Source: Australian Road Research Board

49
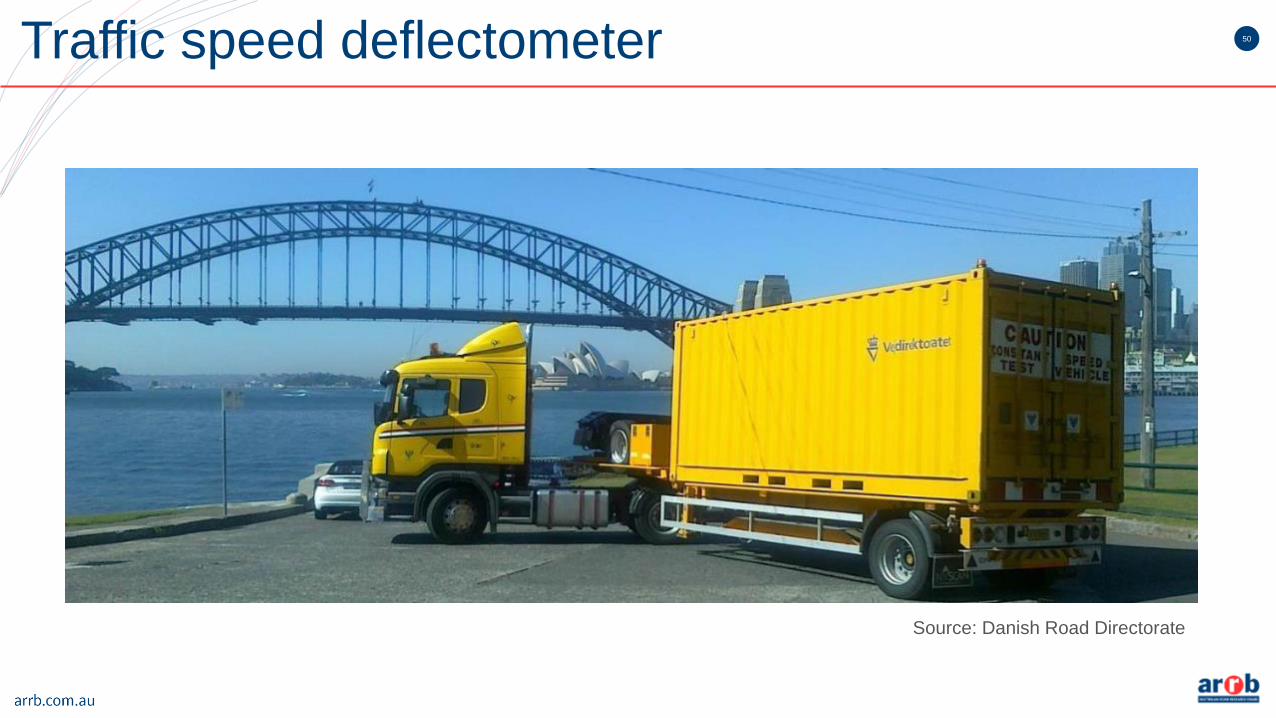
50Traffic speed deflectometer
Source: Danish Road Directorate

51iPAVe
Intelligent Pavement Assessment Vehicle
Source: Australian Road Research Board

52
53
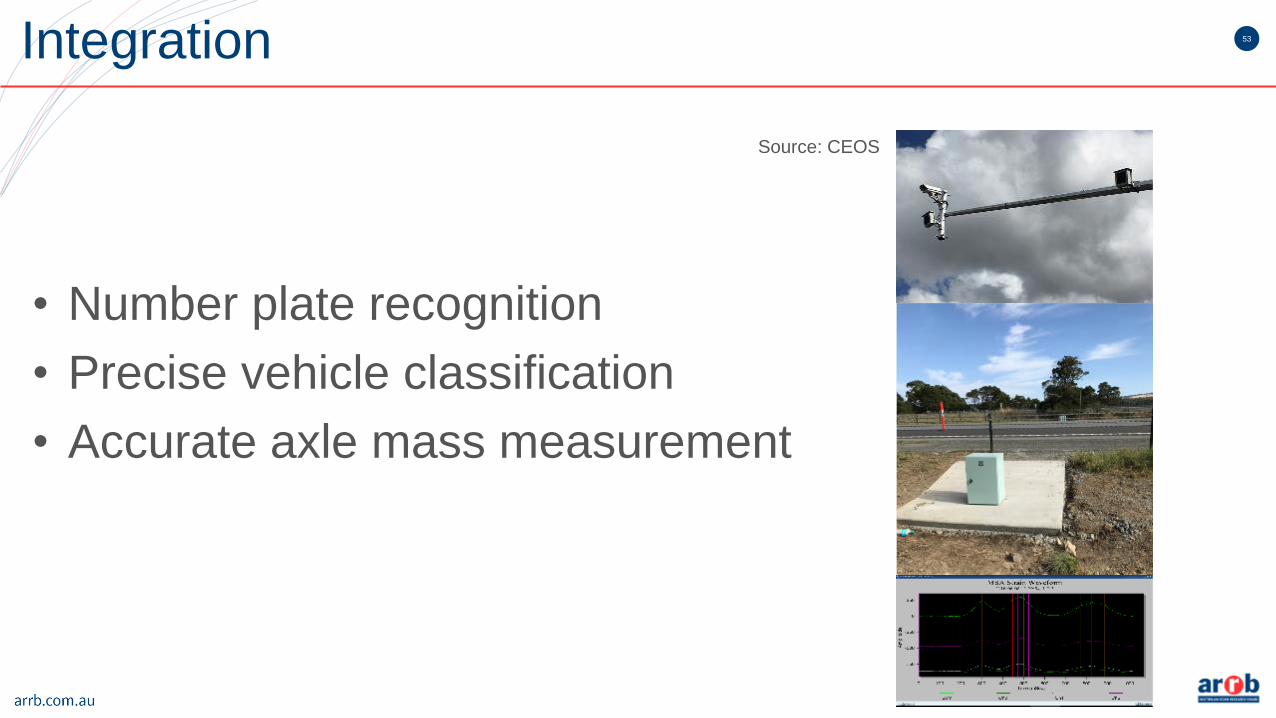
• Number plate recognition
• Precise vehicle classification
• Accurate axle mass measurement
Integration
Source: CEOS
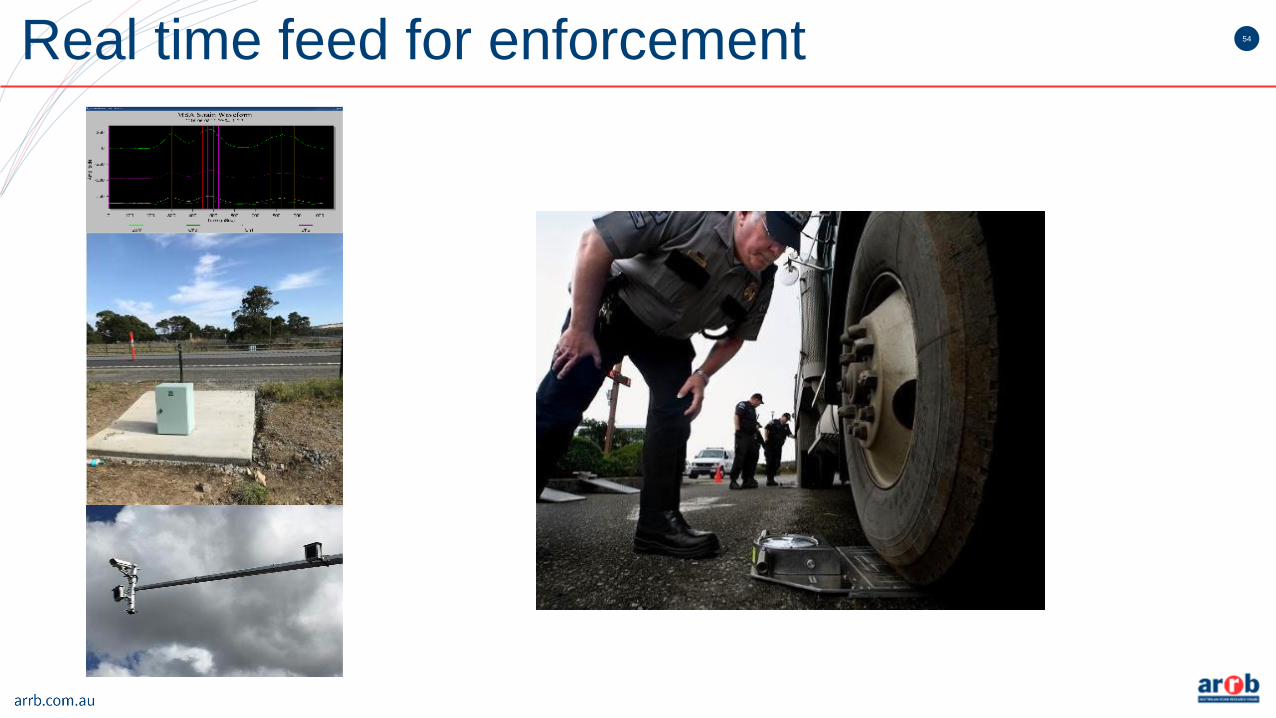
54Real time feed for enforcement
55
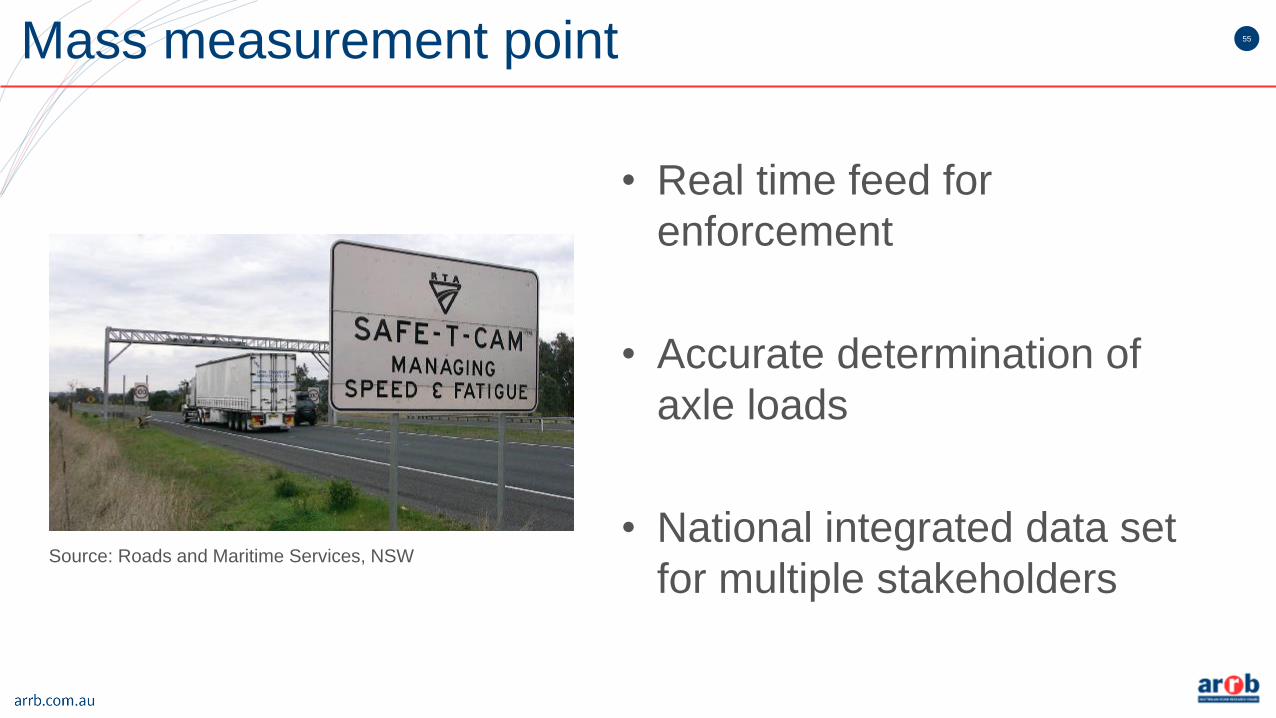
• Real time feed for
enforcement
• Accurate determination of
axle loads
• National integrated data set
for multiple stakeholders
Mass measurement point
Source: Roads and Maritime Services, NSW


