102
DOT HS 811 492A September 2011 Vehicle Safety Communications – Applications (VSC-A) Final Report

DOT HS 811 492A September 2011
Vehicle Safety Communications –Applications (VSC-A)
Final Report


Technical Report Documentation Page 1. Report No.
DOT HS 811 492A 2. Government Accession No. 3. Recipient's Catalog No.
4. Title and Subtitle Vehicle Safety Communications – Applications (VSC-A) Final Report
5. Report Date
September 2011
6. Performing Organization Code
7. Authors Ahmed-Zaid, F., Bai, F., Bai, S., Basnayake, C., Bellur, B., Brovold, S., Brown, G., Caminiti, L., Cunningham, D., Elzein, H., Hong, K., Ivan, J., Jiang, D., Kenney, J., Krishnan, H., Lovell, J., Maile, M., Masselink, D., McGlohon, E., Mudalige, P., Popovic, Z., Rai, V., Stinnett, J., Tellis, L., Tirey, K., VanSickle, S.
8. Performing Organization Report No.
9. Performing Organization Name and Address
Crash Avoidance Metrics Partnership on behalf of the Vehicle Safety Communications 2 Consortium 27220 Haggerty Road, Suite D-1 Farmington Hills, MI 48331
10. Work Unit No. (TRAIS)
11. Contract or Grant No. DTNH22-05-H-01277
12. Sponsoring Agency Name and Address NHTSA Headquarters
1200 New Jersey Avenue, SE West Building
Washington, DC 20590
Research and Innovative Technology Administration U.S. Department of Transportation
1200 New Jersey Avenue, SE East Building
Washington, DC 20590
13. Type of Report and Period Covered
Final Report Dec. 8, 2006, through Dec. 7, 2009
14. Sponsoring Agency Code
15. Supplementary Notes
16. Abstract
The Vehicle Safety Communications – Applications (VSC-A) Project was a three-year project (December 2006 - December 2009) to develop and test communications-based vehicle-to-vehicle (V2V) safety systems to determine if Dedicated Short Range Communications (DSRC) at 5.9 GHz, in combination with vehicle positioning, can improve upon autonomous vehicle-based safety systems and/or enable new communications-based safety applications. The VSC-A Project was conducted by the Vehicle Safety Communications 2 Consortium (VSC2). Members of VSC2 are Ford Motor Company, General Motors Corporation, Honda R & D Americas, Inc., Mercedes-Benz Research and Development North America, Inc., and Toyota Motor Engineering & Manufacturing North America, Inc. This document presents the final report of the VSC-A Project.
17. Key Word 18. Distribution Statement
Document is available to the public from the National Technical Information Service www.ntis.gov
19. Security Classif. (of this report)
Unclassified 20. Security Classif. (of this page)
Unclassified 21. No. of Pages
102 22. Price
Form DOT F 1700.7 (8-72) Reproduction of completed page authorize
i

List of Acronyms
ABS Anti-Lock Braking System
API Application Programming Interface
BSW Blind Spot Warning
BSM Basic Safety Message
CA Certif icate Authority
CAMP Crash Avoidance Metrics Partnership
CAN Controller Area Network
CCH Control Channel
CCI Cross Channel Interference
CICAS-V Cooperative Intersection Collision Avoidance System-Violation
CLW Control Loss Warning
COTS Commercial Off the Shelf
CPH Concise Path History
CRL Certificate Revocation List
DL Data Logger
DGPS Differential Global Positioning System
DMU Dynamics Measurement Unit
DNPW Do Not Pass Warning
DSRC Dedicated Short Range Communications
DVI Driver-Vehicle Interface
DVIN Driver-Vehicle Interface Notifier
ECDSA Elliptic Curve Digital Signature Algorithm
EEBL Emergency Electronic Brake Lights
ECU Electronic Control Unit
EGUI Engineering Graphical User Interface
ENET Ethernet
FCC Federal Communications Commission
FCW Forward Collision Warning
FHWA Federal Highway Administration
FLR Forward-Looking Radar
ii
FOT Field Operational Test
FoV Field of View
GES General Estimates System
GNSS Global Navigation Satellite System
GPS Global Positioning System
HVPP Host Vehicle Path Prediction
HW Hardware
I-V or I2V Infrastructure-to-Vehicle
ID Identification
IMA Intersection Movement Assist
INS Inertial Navigation System
IPG Inter-Packet Gap
IPv6 Internet Protocol Version 6
ITS Intelligent Transportation Systems
JPO Joint Program Office
LCW Lane Change Warning
MAC Medium Access Control Layer
NASS National Automotive Sampling System
NHTSA National Highway Traffic Safety Administration
NMEA National Marine Electronics Association
OBE On-Board Equipment
OCB Outside the Context of a Basic service set
OEM Original Equipment Manufacturers
OFDM Orthogonal Frequency-Division Multiplexing
OTA Over the Air
OTP Objective Test Procedure
PC Personal Computer
PER Packet Error Rate
PH Path History
PHY Physical (Layer)
PKI Public Key Infrastructure
PPS Pulse Per Second
iii

PSID Provider Service Identifier
RITA Research and Innovative Technology Administration
RS Radio Services
RSE Road-Side Equipment
RSS Received Signal Strength
RTCM Radio Technical Commission for Maritime Services
RTK Real-Time Kinematic
RV Remote Vehicle
SDH Sensor Data Handler
SDO Standards Development Organizations
SM Security Module
SP Single Point
SR Scenario Replicator
SW Software
TA Threat Arbitration
TADS TESLA and Digital Signature
TC Target Classification
TC Technical Committee
TCP Transmission Control Protocol
TESLA Timed Efficient Stream Loss-tolerant Authentication
TPS Time/Position Services
TRC Transportation Research Center
UDP User Datagram Protocol
USB Universal Serial Bus
USDOT United States Department of Transportation
UTC Coordinated Universal Time
V2V or V-V Vehicle-to-Vehicle
VER Verification Error Rate
VGA Video Graphics Array
VIS Vehicle Interface Services
VoD Verify on Demand
VRTC Vehicle Research & Test Center
iv

VSC2 Vehicle Safety Communications 2 (Consortium)
VSC-A Vehicle Safety Communications–Applications
VSCC Vehicle Safety Communications Consortium
WAAS Wide Area Augmentation System
WAVE Wireless Access in Vehicular Environments
WG Working Group
WLAN Wireless Local Area Network
WMH Wireless Message Handler
WSM WAVE Short Message
WSMP-S WAVE Short Message Protocol Safety Supplement
WSU Wireless Safety Unit
v
VSC-A Final Report
Table of Contents
List of Acronyms.................................................................................................ii
Executive Summary ...........................................................................................xi
1 Introduction ..................................................................................................1 1.1 Project Background ............................................................................................ 1
1.2 Objectives ........................................................................................................... 1
1.3 Report Organization ........................................................................................... 2
2 Crash Scenarios and Safety Applications Selection ................................4 2.1 Overview ............................................................................................................ 4
2.2 Crash Scenarios Selection .................................................................................. 4
2.3 Safety Applications Selection ............................................................................ 6
3 DSRC+Positioning and Autonomous Sensing Safety System Analysis . 7 3.1 Autonomous Safety System Limitations ............................................................ 8
3.2 DSRC and Autonomous Sensing Safety System Analysis Setup ...................... 9
3.3 DSRC and Autonomous Sensing Safety System Analysis Testing ................. 10
3.4 Summary .......................................................................................................... 12
4 DSRC+Positioning-Only Test Bed System Development .......................13 4.1 Overview .......................................................................................................... 13
4.2 Test Bed System Design ................................................................................... 13
4.3 Test Bed Implementation ................................................................................. 14
4.3.1 System SW Architecture ..................................................................... 14
4.3.2 Engineering Development Tools......................................................... 17
4.3.3 Software Implementation and Release ................................................ 22
4.4 Test Bed In-Vehicle Hardware Integration ...................................................... 23
5 Objective Test Procedures........................................................................24 5.1 Overview .......................................................................................................... 24
5.2 System Configuration ....................................................................................... 25
5.3 Data Recording ................................................................................................. 25
5.4 Objective Test Results...................................................................................... 26
6 Communications and Standards ..............................................................30 6.1 Overview .......................................................................................................... 30
6.2 Message Composition ...................................................................................... 31
vi

VSC-A Final Report
6.3 Standards Coordination and Validation ........................................................... 33
6.3.1 Multi-Channel Operation and IEEE 1609.3 and 1609.4 ..................... 34
6.3.2 Synchronized Collision Issue with IEEE 1609.4 Channel Switching. 35
6.3.3 Message Signature Key Length and IEEE 1609.2 .............................. 36
6.3.4 Validation of IEEE 802.11p MAC ...................................................... 36
6.3.5 Validation of IEEE 802.11p PHY ....................................................... 37
7 Relative Vehicle Positioning .....................................................................38 7.1 Overview .......................................................................................................... 38
7.2 Test Bed Positioning Development .................................................................. 39
7.2.1 Implementation ................................................................................... 39
7.2.2 OTA Support ....................................................................................... 40
7.2.3 VSC-A Positioning Sub-System Performance .................................... 40
7.2.4 Reference System ................................................................................ 43
7.3 GPS Availability Study .................................................................................... 48
7.3.1 Field Data Collection .......................................................................... 48
7.3.2 Data Analysis and Reports .................................................................. 49
7.3.3 Study Results ....................................................................................... 49
7.3.4 Relative Positioning Conclusions ....................................................... 50
8 Security ......................................................................................................51 8.1 Overview .......................................................................................................... 51
8.2 Security Protocols and Implementation Results ............................................... 52
8.2.1 Overview............................................................................................. 52
8.2.2 Implementation and Results ................................................................ 53
8.3 Network Security Protocol Simulations ........................................................... 56
8.3.1 Overview............................................................................................. 56
8.3.2 Analysis and Results ........................................................................... 56
8.4 Security Conclusions ........................................................................................ 57
8.5 Certificate Management Workshop .................................................................. 58
8.5.1 Overview............................................................................................. 58
8.5.2 Communication Channel Options ....................................................... 59
9 Multiple-OBE Scalability Testing ..............................................................61 9.1 DSRC Pod Development .................................................................................. 61
9.2 Test Command, Control, and Confirmation ..................................................... 63
vii
VSC-A Final Report
9.2.1 Wireless Network ................................................................................ 63
9.2.2 Script Development ............................................................................. 63
9.2.3 Test Number Identification ................................................................. 63
9.3 Channel and Test and OBE Deployment Configurations ................................ 63
9.3.1 Channel Configurations ...................................................................... 64
9.3.2 Test Configurations ............................................................................. 64
9.3.3 OBE Static Deployment...................................................................... 66
9.4 Sample Scalability Test Results ....................................................................... 67
9.4.1 Packet Error Rate ................................................................................ 67
9.4.2 Inter-Packet Gap.................................................................................. 67
9.4.3 Other Tests .......................................................................................... 67
9.5 Multiple-OBE Result Summary and Next Steps.............................................. 71
10 Main Project Accomplishments and Remaining Needs .........................71 10.1 Summary of Project Accomplishments ............................................................ 71
10.2 Remaining Needs ............................................................................................. 72
10.2.1 Technical Work Items ......................................................................... 72
10.2.2 Work Items Needed for Expanded Safety Functionality .................... 74
10.2.3 Policy and Institutional Issues Identified by VSC2 ............................ 74
11 Publicly Available Project Documentation ..............................................75
12 References .................................................................................................78
13 VSC-A Final Report Appendices ..............................................................79
viii

VSC-A Final Report
List of Figures
Figure 1: DSRC and Autonomous Sensing Safety System Analysis Setup ....................... 9 Figure 2: CANape Measurement and Data Acquisition Experimental Layout ................ 10 Figure 3: Cut-out of Lead Vehicle Reveals Stopped Vehicle In-lane .............................. 11 Figure 4: Sensor Performance during Vehicle Cut-Outs .................................................. 12 Figure 5: VSC-A System Block Diagram ......................................................................... 14 Figure 6: VSC-A Level I OBE SW Architecture .............................................................. 15 Figure 7: Scenario Record Mode ..................................................................................... 18 Figure 8: Scenario Playback Mode ................................................................................... 19 Figure 9: DVIN Stages: (left right, top bottom) No Threat, Threat Detected, Inform Driver, Warn Driver .............................................................................. 20 Figure 10: DNPW EGUI Screen ....................................................................................... 21 Figure 11: WMH – RV Screen Shot ................................................................................. 22 Figure 12: VSC-A System Test Bed HW Layout............................................................. 24 Figure 13: Example Layout Screen for OTP Testing ....................................................... 26 Figure 14: DSRC Standards Landscape ............................................................................ 30 Figure 15: SAE J2735 Rev 35 Basic Safety Message Format .......................................... 33 Figure 16: WAVE Safety Message Supplement between BSM and WSMP ................... 35 Figure 17: VSC-A CCI Test Results Presented to IEEE 802.11 Task Group P ............... 38 Figure 18: VSC-A Test Bed Relative Positioning System Core Modules........................ 40 Figure 19: Comparison of Between-Vehicle across Distance .......................................... 41 Figure 20: Formation of Host Vehicle and Target Vehicles ............................................. 42 Figure 21: Between-Vehicle Across Distances in Multiple Vehicle Test Run (Solid Line: RTK Method Other: Single Point Method) ................................ 42 Figure 22: Between-Vehicle along Distances in Multiple Vehicle Test Run (Solid Line: RTK Method Other: Single Point Method) ................................. 43 Figure 23: Reference Positioning System Analysis Equipment Set-up............................ 44 Figure 24: Scenario 1 Reference Test Diagram ................................................................ 45 Figure 25: Scenario 1 OTP Reference Test Results .......................................................... 45 Figure 26: Scenario 1 Post-OTP Reference Test Results ................................................. 46 Figure 27: Scenario 2 Reference Test Diagram ................................................................ 46 Figure 28: Scenario 2 OTP Reference Test Results .......................................................... 47 Figure 29: Scenario 2 Post-OTP Reference Test Results ................................................. 47 Figure 30: DSRC Pod Internal Structure Diagram ........................................................... 62 Figure 31: DSRC Pod Base Plate Diagram ....................................................................... 62 Figure 32: Vehicle and Pod Deployment Configuration .................................................. 66 Figure 33: PER for Channel Config. 1, 4, & 2 for 24, 48, & 60 Transmitting Radios ..... 69 Figure 34: IPG Avg. for Channel Config. 1, 4, & 2 for 24, 48, & 60 Transmitting Radios .................................................................................... 70
ix

VSC-A Final Report
List of Tables
Table 1: VSC-A Selected Crash Imminent Scenarios ........................................................ 5 Table 2: Crash Imminent Scenario to VSC-A Program Application Mapping .................. 7 Table 3: Minimum Performance of Forward-Looking Radar Sensor ............................... 10 Table 4: VSC-A Test Bed Hardware List ......................................................................... 23 Table 5: Objective Test Scenarios and Results ................................................................. 27 Table 6: BSM Part I Fields Impacted by VSC-A Proposal .............................................. 31 Table 7: VSC-A Safety Application Minimum Relative Positioning Requirements ....... 39 Table 8: Security Protocol Performance ........................................................................... 53 Table 9: Recommended Validity Periods for High Security Applications ....................... 56 Table 10: Channel Configurations for Scalability Testing ............................................... 64 Table 11: Test Configurations for Scalability Testing ...................................................... 65 Table 12: VSC-A Publicly Available Documentation ...................................................... 75
x

VSC-A Final Report
Executive Summary
The United States Department of Transportation (USDOT) has conducted extensive research on the effectiveness of vehicle-based collision countermeasures for rear-end, road departure and lane change crashes. Field Operational Tests (FOT) of rear-end and road departure collision warning systems have shown measurable benefits in reduction of crashes. However, Vehicle-to-vehicle (V2V) wireless communications and vehicle positioning may enable improved safety system effectiveness by complementing or, in some instances, providing alternative approaches to the traditional active safety equipment based on autonomous sensing, such as radar, lidar, or vision.
The USDOT and the Crash Avoidance Metrics Partnership–Vehicle Safety Communications 2 (CAMP-VSC2) Consortium (Ford Motor Company, General Motors Corporation, Honda R&D Americas, Inc., Mercedes-Benz Research and Development North America, Inc., and Toyota Motor Engineering & Manufacturing North America, Inc.) initiated, in December 2006, a three-year collaborative effort in the area of wireless-based safety applications under the Vehicle Safety Communications–Applications (VSC-A) Project. The goal of the VSC-A Project was to develop and test communications-based vehicle safety systems to determine if Dedicated Short Range Communications (DSRC) at 5.9 GHz, in combination with vehicle positioning, can improve upon autonomous vehicle-based safety systems and/or enable new communications-based safety applications.
To address the goal of the VSC-A Project as stated above, the program had the following list of objectives:
Assess how previously identified crash-imminent safety scenarios in autonomous systems could be addressed and improved by DSRC+Positioning systems
Define a set of DSRC+Positioning based vehicle safety applications and application specifications including minimum system performance requirements
Develop scalable, common vehicle safety communication architecture, protocols, and messaging framework (interfaces) necessary to achieve interoperability and cohesiveness among different vehicle manufacturers. Standardize this messaging framework and the communication protocols (including message sets) to facilitate future deployment.
Develop requirements for accurate and affordable vehicle positioning technology needed, in conjunction with the 5.9 GHz DSRC, to support most of the safety applications with high-potential benefits
Develop and verify a set of Objective Test Procedures (OTP) for the vehicle safety communications applications
Over the course of the project, the VSC-A Team was successful in addressing all the above objectives. The following is a summary of all the project activities and accomplishments:
xi

VSC-A Final Report
Crash Scenarios Identification and Application Selection
In order to provide a foundation for the VSC-A Program and efficiently guide the rest of the activities, the USDOT evaluated pre-crash scenarios [1] based on the 2004 National Automotive Sampling System (NASS) General Estimates System (GES) crash database. This list served as a starting point and reference for the selection of the safety applications to be studied under the VSC-A Project. Each crash scenario was assigned a composite crash ranking determined by taking the average of the crash rankings by frequency, cost, and functional years lost for each scenario. The crash scenarios were then sorted based on the composite ranking and were analyzed to evaluate whether autonomous safety systems and/or vehicle safety communications would offer the best opportunity to adequately address the scenarios.
From the USDOT composite ranking list of crash scenarios (based on crash frequency, crash cost and functional years lost) the top seven (7) crash scenarios that could be addressed by VSC-A were selected. The selected crash-imminent scenarios were analyzed and potential, DSRC-based, safety application concepts meant to address them were developed. The list of safety applications selected to be part of the VSC-A safety system included: Emergency Electronic Brake Lights (EEBL), Forward Collision Warning (FCW), Blind Spot Warning+Lane Change Warning (BSW+LCW), Do Not Pass Warning (DNPW), Intersection Movement Assist (IMA), and Control Loss Warning (CLW).
DSRC+Positioning and Autonomous Sensing Safety System Analysis
A primary objective of the VSC-A Project was to determine if vehicle safety applications that utilize DSRC-based vehicle safety communications can help overcome some of the limitations of autonomous systems and enhance the overall safety system performance. A sub-set of the crash scenarios, ones that are addressed by existing autonomous safety systems, were identified along with the various limitations autonomous safety systems have shown in addressing these crash-imminent scenarios.
In an effort to study the benefits of DSRC+Positioning in overcoming some of the limitations of autonomous safety systems, it was necessary to evaluate the performance of DSRC+Positioning alongside a traditional autonomous sensor in driving environments that highlight the aforementioned limitations. Six tests were identified and executed to assess the ability of a Forward-Looking-Radar autonomous sensor and the DSRC+Positioning safety system to independently detect and track one or more remote vehicles (RV) in a variety of driving conditions. The results of the testing showed that DSRC+Positioning can address several known limitations with autonomous sensing safety systems.
xii
VSC-A Final Report
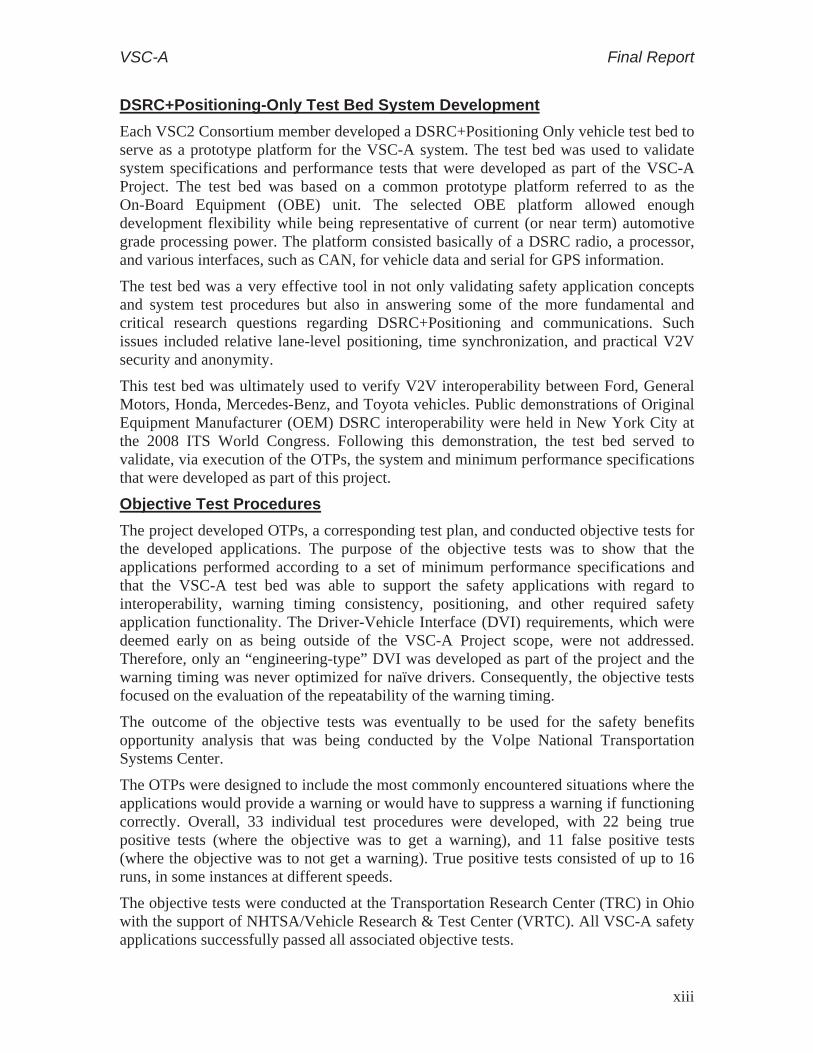
DSRC+Positioning-Only Test Bed System Development
Each VSC2 Consortium member developed a DSRC+Positioning Only vehicle test bed to serve as a prototype platform for the VSC-A system. The test bed was used to validate system specifications and performance tests that were developed as part of the VSC-A Project. The test bed was based on a common prototype platform referred to as the On-Board Equipment (OBE) unit. The selected OBE platform allowed enough development flexibility while being representative of current (or near term) automotive grade processing power. The platform consisted basically of a DSRC radio, a processor, and various interfaces, such as CAN, for vehicle data and serial for GPS information.
The test bed was a very effective tool in not only validating safety application concepts and system test procedures but also in answering some of the more fundamental and critical research questions regarding DSRC+Positioning and communications. Such issues included relative lane-level positioning, time synchronization, and practical V2V security and anonymity.
This test bed was ultimately used to verify V2V interoperability between Ford, General Motors, Honda, Mercedes-Benz, and Toyota vehicles. Public demonstrations of Original Equipment Manufacturer (OEM) DSRC interoperability were held in New York City at the 2008 ITS World Congress. Following this demonstration, the test bed served to validate, via execution of the OTPs, the system and minimum performance specifications that were developed as part of this project.
Objective Test Procedures
The project developed OTPs, a corresponding test plan, and conducted objective tests for the developed applications. The purpose of the objective tests was to show that the applications performed according to a set of minimum performance specifications and that the VSC-A test bed was able to support the safety applications with regard to interoperability, warning timing consistency, positioning, and other required safety application functionality. The Driver-Vehicle Interface (DVI) requirements, which were deemed early on as being outside of the VSC-A Project scope, were not addressed. Therefore, only an “engineering-type” DVI was developed as part of the project and the warning timing was never optimized for naïve drivers. Consequently, the objective tests focused on the evaluation of the repeatability of the warning timing.
The outcome of the objective tests was eventually to be used for the safety benefits opportunity analysis that was being conducted by the Volpe National Transportation Systems Center.
The OTPs were designed to include the most commonly encountered situations where the applications would provide a warning or would have to suppress a warning if functioning correctly. Overall, 33 individual test procedures were developed, with 22 being true positive tests (where the objective was to get a warning), and 11 false positive tests (where the objective was to not get a warning). True positive tests consisted of up to 16 runs, in some instances at different speeds.
The objective tests were conducted at the Transportation Research Center (TRC) in Ohio with the support of NHTSA/Vehicle Research & Test Center (VRTC). All VSC-A safety applications successfully passed all associated objective tests.
xiii
VSC-A Final Report
Communications and Standards
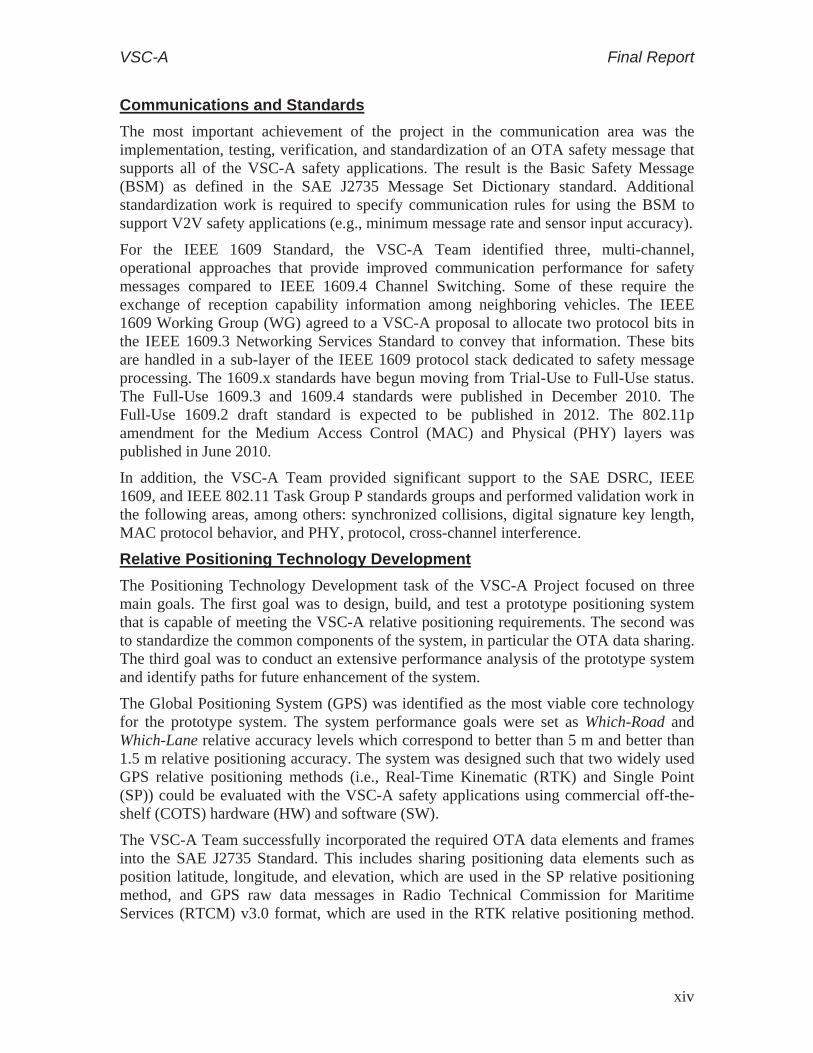
The most important achievement of the project in the communication area was the implementation, testing, verification, and standardization of an OTA safety message that supports all of the VSC-A safety applications. The result is the Basic Safety Message (BSM) as defined in the SAE J2735 Message Set Dictionary standard. Additional standardization work is required to specify communication rules for using the BSM to support V2V safety applications (e.g., minimum message rate and sensor input accuracy).
For the IEEE 1609 Standard, the VSC-A Team identified three, multi-channel, operational approaches that provide improved communication performance for safety messages compared to IEEE 1609.4 Channel Switching. Some of these require the exchange of reception capability information among neighboring vehicles. The IEEE 1609 Working Group (WG) agreed to a VSC-A proposal to allocate two protocol bits in the IEEE 1609.3 Networking Services Standard to convey that information. These bits are handled in a sub-layer of the IEEE 1609 protocol stack dedicated to safety message processing. The 1609.x standards have begun moving from Trial-Use to Full-Use status. The Full-Use 1609.3 and 1609.4 standards were published in December 2010. The Full-Use 1609.2 draft standard is expected to be published in 2012. The 802.11p amendment for the Medium Access Control (MAC) and Physical (PHY) layers was published in June 2010.
In addition, the VSC-A Team provided significant support to the SAE DSRC, IEEE 1609, and IEEE 802.11 Task Group P standards groups and performed validation work in the following areas, among others: synchronized collisions, digital signature key length, MAC protocol behavior, and PHY, protocol, cross-channel interference.
Relative Positioning Technology Development
The Positioning Technology Development task of the VSC-A Project focused on three main goals. The first goal was to design, build, and test a prototype positioning system that is capable of meeting the VSC-A relative positioning requirements. The second was to standardize the common components of the system, in particular the OTA data sharing. The third goal was to conduct an extensive performance analysis of the prototype system and identify paths for future enhancement of the system.
The Global Positioning System (GPS) was identified as the most viable core technology for the prototype system. The system performance goals were set as Which-Road and Which-Lane relative accuracy levels which correspond to better than 5 m and better than 1.5 m relative positioning accuracy. The system was designed such that two widely used GPS relative positioning methods (i.e., Real-Time Kinematic (RTK) and Single Point (SP)) could be evaluated with the VSC-A safety applications using commercial off-the-shelf (COTS) hardware (HW) and software (SW).
The VSC-A Team successfully incorporated the required OTA data elements and frames into the SAE J2735 Standard. This includes sharing positioning data elements such as position latitude, longitude, and elevation, which are used in the SP relative positioning method, and GPS raw data messages in Radio Technical Commission for Maritime Services (RTCM) v3.0 format, which are used in the RTK relative positioning method.
xiv

VSC-A Final Report
As is, this revision of SAE J2735 fully supports the OTA needs of both positioning methods implemented in the VSC-A system test bed.
Positioning system performance evaluation was done through field tests by the VSC-A-Team and a GPS Service Availability Study. This study included a literature review and a 2-phased field study that gathered 50 hours of field data from two-instrumented vehicles. The VSC-A Team characterized the impact of operating environment (e. g., sky visibility), availability of GPS augmentations, OTA support, and a host of other factors on the performance of the VSC-A positioning system through the findings of this study.
The study concluded that, in general, the GPS coverage required to achieve the VSC-A V2V relative positioning requirements is adequate in most environments. Most of the GPS outages occurred in the deep urban environments and the majority of the data gaps in this study were less than 15 s in length. GPS outages of this duration can be addressed with dead-reckoning techniques based on vehicle signals such as speed and yaw rate enabling continued BSM transmissions and safety application operation during this time.
The study also concluded that the SP method (exchanging Latitude and Longitude between vehicles and differencing their position), when used in conjunction with same type receivers in both vehicles, provided adequate performance. In a few reported instances, where the SP method was being used in the mixed-mode configuration (different receiver types), some relative positional biases in the order of 3 to 4 meters were observed. In order to achieve a low-cost solution for the V2V positioning problem, these mixed-mode anomalies need to be further investigated and understood to determine whether this is truly a SP method limitation or a GPS receiver brand-specific limitation. A solution to this issue needs to be developed and it may include specification of minimum V2V relative positioning performance requirements for full system and inter-OEM interoperability. Finally, in terms of pure accuracy, the RTK approach provides a better approach to the V2V relative positioning problem than the SP method that is also GPS-unit independent. However, this approach comes at a higher cost both from the implementation and processing viewpoint (RTK engine for a large number of vehicles) but also from the channel bandwidth perspective (larger OTA messages required to exchanged raw GPS observations).
Security
This project focused on security for V2V safety messages with a main focus on efficient broadcast authentication of safety messages. Message authentication is defined in the IEEE 1609.2 Standard. However, the VSC-2 Participants expressed concerns regarding the 1609.2 authentication scheme mainly in terms of its high computational complexity that might hinder the deployment of V2V safety systems and, in turn, market penetration. Therefore, alternative authentication schemes were identified, designed, and evaluated in both the system test-bed implementation and a V2V-network simulation. All protocols were implemented to run on board the OBE, which housed a 400 MHz processor. The VSC2 Team concluded that for the VSC-A safety applications, 1609.2 Elliptic Curve Digital Signature Algorithm (ECDSA) with Verification-on-Demand (VoD) (i.e., verification of prioritized, application-filtered threats) achieved the desired
xv

VSC-A Final Report
performance. This is the protocol that was used, therefore, for the system objective testing later on in the project.
In addition, a generalized certificate distribution scheme was presented, and a simple prototype privacy mechanism was also successfully implemented. The mechanism is based on changing or randomizing all identifiers between two, successive, safety message transmissions and at a randomly selectable time interval.
Beyond message authentication and in the area of security certificate management, the VSC-A Project studied viable communication channel options for data transfer between vehicles and the Certificate Authority (CA). The VSC-A Team initiated the mapping of communication channel capabilities in terms of penetration and cost versus security and privacy performance. These options, along with policy considerations, are necessary for the selection of the appropriate communication channel(s) option for potential future deployment. Finally, the most pressing issues were highlighted; namely, refining the attacker model to reflect V2V driver assistance systems, designing misbehavior detection schemes (algorithms running in vehicles and the CA identifies/confirms misbehavior), and Public Key Infrastructure (PKI) operations including privacy mechanisms.
Multiple-OBE Scalability Testing
Understanding how DSRC will perform as larger numbers of DSRC radios are added to the system (i.e., system scalability) is crucial for deployment of DSRC-based V2V safety systems. Following the successful completion of the VSC-A objective testing activities, a preliminary, multiple-OBE, scalability-testing effort was undertaken utilizing up to 60 DSRC radios.
The primary objectives of the testing were to:
1) Gather the necessary data in order to analyze how well the communication channel operates, primarily in terms of Packet Error Rate (PER) and the Inter-Packet Gap (IPG) distribution, in a variety of channel configurations and transmit characteristics
2) Gain experience in the set-up and execution of a large-scale, DSRC, test effort and in the areas of tools development, software tools, efficient logistics, setup, procedures, and analysis to ensure the end results are correct and repeatable
A number of steps were taken to ensure the testing was a success. Primarily, the OBE implementation was enhanced to enable the emulation of two RVs via dual-radio functionality. Self-contained DSRC enclosures (pods) were developed as a cost-effective approach for increasing the number of radios in the scalability test to the maximum achievable level of 60 units. In addition, to aid in ensuring testing was efficient, repeatable, and correct, a wireless mesh network, which enabled communication with each of the OBEs from a single point, along with scripts for command and control of the OBEs, were developed. Finally, the OTA data was supplemented with a few data elements to ensure, in real-time, the ability to verify that the proper configuration was being used by all the radios during each test run.
Four channel configurations were defined for this testing. Three channel configurations were defined utilizing IEEE 1609.4 channel switching and two of its variants. The fourth
xvi

VSC-A Final Report
one was defined as to not employ channel switching but rather provide full-time access to Channel 172, the safety channel. The multiple OBE scalability testing results clearly demonstrated that using a dedicated, full-time, safety channel to transmit V2V safety messages provides superior performance over any of the other channel configuration methods employing IEEE 1609.4 channel switching when considering the PER and IPG metrics.
Major Project Accomplishments
The following list captures the main VSC-A Project accomplishments:
Defined a set of high-priority crash scenarios that could be addressed by V2V DSRC+Positioning. These scenarios are representative of the major crash categories: same direction, lane change, intersecting and oncoming.
Selected and developed a set of V2V safety applications to address above set of crash scenarios
Defined efficient system architecture for V2V safety system where all VSC-A safety applications are enabled at the same time
Successfully implemented a test bed with all the safety applications on a platform running an automotive grade processor (400 MHz)
Successfully incorporated and evaluated in the test bed two relative positioning approaches, RTK and SP
Successfully incorporated in the test bed the necessary OTA communication protocol (SAE J2735) and security protocol (IEEE 1609.2 ECDSA VoD)
Defined OTPs for all the VSC-A safety applications, including false positive test
Successfully executed and passed all objective tests for all the VSC-A safety applications
Refined, with field data, the required OTA message set for V2V safety (BSM within SAE J2735) which led to the recently published version of this standard
Conducted a GPS study to quantify availability and accuracy of V2V, GPS-based, relative positioning by using RTK and SP methods
Confirmed that ECDSA VoD functioned properly under all test conditions for the VSC-A safety applications
Performed and analyzed initial scalability with up to 60 radios to characterize channel behavior under IEEE 1609.4 and under dedicated full time use of channel 172
xvii

VSC-A Final Report
Next Steps
In the technical area, answers to the following items remain key to any successful deployment:
1. Large-scale performance assessments
2. Security-certificate management and privacy
3. Interoperability and data integrity
4. Standards/Protocols
5. Technical options to accelerate penetration
6. Enhanced safety application and system design
7. Enhanced relative vehicle positioning
In the non-technical or policy area, the following remaining issues have been identified by the VSC2 Participants:
1. Governance and enforcement
2. Certificate authority/security certificate management
3. V2V interoperability certification process, organization and ownership
4. Business and deployment models
5. Priority – Some authority must be established to perform and enforce the assignment of priorities to applications or specific messages in accordance with agreed rules that optimize the probability that urgent safety messages are successfully delivered
Note that most of these items are being addressed under the current USDOT V2V safety roadmap which outlines the next set of activities needed to support a NHTSA recommendation or regulation regarding V2V safety in 2013.
xviii

VSC-A Final Report
1 Introduction
1.1 Project Background
Over the last two decades, the United States Department of Transportation (USDOT) has conducted extensive research on the effectiveness of vehicle-based collision countermeasures for rear-end, road departure, and lane change crashes. Field Operational Tests (FOTs) of rear-end and road departure collision warning systems have shown measurable benefits in reduction of crashes. However, V2V wireless communications and vehicle positioning may enable improved safety system effectiveness by complementing or, in some instances, providing alternative approaches to the traditional, autonomous-sensing-based, safety equipment.
The USDOT and the Crash Avoidance Metrics Partnership–Vehicle Safety Communications 2 (CAMP—VSC2) Consortium (Ford Motor Company, General Motors Corporation, Honda R&D Americas, Inc., Mercedes-Benz Research and Development North America, Inc., and Toyota Motor Engineering & Manufacturing North America, Inc.) initiated, in December 2006, a 3-year collaborative effort in the area of wireless-based safety applications under the VSC-A Project. The goal of the project was to develop and test communications-based vehicle safety systems to determine if Dedicated Short Range Communications (DSRC) at 5.9 GHz, in combination with vehicle positioning, can improve upon autonomous vehicle-based safety systems and/or enable new communications-based safety applications.
1.2 Objectives
To address the goal of the VSC-A Program as stated above, the program had the following list of objectives:
Assess how previously identified crash imminent safety scenarios in autonomous systems could be addressed and improved by DSRC+Positioning systems
Define a set of DSRC+Positioning-based vehicle safety applications and application specifications including minimum system performance requirements
Develop scalable, common vehicle safety communication architecture, protocols and messaging framework (interfaces) necessary to achieve interoperability and cohesiveness among different vehicle manufacturers. Standardize this messaging framework and the communication protocols (including message sets) to facilitate future deployment.
Develop accurate and affordable vehicle positioning technology needed, in conjunction with the 5.9 GHz DSRC, to support most of the safety applications with high-potential benefits
Develop and verify a set of Objective Test Procedures (OTP) for the vehicle safety communications applications
This final project report reflects the activities and accomplishments that have been made under the VSC-A Program.
1

VSC-A Final Report
1.3 Report Organization
This VSC-A Final Report is divided into two main sections. The first one consists of the main body of the report which summarizes at a high level the activities, results, and recommendations in each technical area studied under the project. The second part of this report consists of a collection of appendices, which are referenced within the main body of the report, and contains technical details in various areas such as system design, positioning, communication, and security.
This main body of the report consists of this introduction and the following sections:
Section 2, Crash Scenarios and Safety Applications Selection This section lists the crash imminent scenarios addressed by the VSC-A Project and the safety applications selected to potentially address them using vehicle safety communications and positioning. This section also provides the mapping between the crash imminent scenarios identified and the safety applications selected to be developed and built under the VSC-A Program.
Section 3, DSRC+Positioning and Autonomous Sensing Safety System AnalysisThis section discusses limitations of traditional active safety systems that utilize autonomous, on-board sensors, such as radar or vision. It also illustrates the potential improvement provided by way of DSRC+Postioning and added system benefits either through improved functionality or support of new safety features.
Section 4, DSRC+Positioning Only Test Bed System Development This section highlights the system design activities under the project. These focused on core, positioning, security, and safety applications module groupings. It also presents the VSC-A On-Board Equipment (OBE) software (SW) architecture diagram which incorporates the module grouping, the corresponding SW implementation and release, and the SW development tools used to assist in the development, testing, and analysis of the prototyped safety applications. Finally, the section provides a list of the equipment used for the VSC-A test bed.
Section 5, Objective Test Procedures This section provides an overview of the objective testing, executed in June 2009 at the Transportation Research Center (TRC) in East Liberty, Ohio, along with the description of the test configuration settings for communication, positioning, and security. It also provides a discussion of the data logging and visualization tool used to collect the test data. Finally, the section summarizes the performed test scenarios (test descriptions, speeds, number of runs for each test, type of test, etc.) and the corresponding results.
2

VSC-A Final Report
Section 6, Communications and Standards This section discusses the message composition activities that included the definition, implementation, and testing of the Over the Air (OTA) message in the test bed, which led to the standardization of the SAE J2735 Basic Safety Message (BSM). It also includes a summary of the coordination and validation activities for the IEEE 1609.x standards related to multi-channel operation, synchronized collisions, message signature key lengths, and the validation activities related to the 802.11p Medium Access Control (MAC) and Physical (PHY) layers.
Section 7, Positioning This section discusses the implementation and integration of the Real-Time Kinematic (RTK) and Single Point (SP) relative positioning methods in the system test bed and includes an evaluation of the performance of each method in a variety of operating conditions and Global Positioning System (GPS) modes. It also provides a brief summary of the results from GPS reference testing conducted to measure the relative positioning accuracy of the OBE system. Furthermore, the section provides the high-level results and conclusions of a GPS service availability study undertaken to investigate the performance dependencies of the VSC-A positioning system based on operating environment (i.e., sky visibility), availability of GPS augmentations, OTA support, and other factors that can influence the performance of the VSC-A positioning system.
Section 8, Security This section introduces the three potential security protocols studied under the project for V2V safety communication. It summarizes the implementation and evaluation of the protocols (and their variants) in the test bed. This section also discusses the security network simulations performed to assist in the evaluation of the security protocols. It also includes the conclusions drawn from evaluating the results from both the network simulations and the security implementation. Finally, the section covers the security workshop that was held to investigate the certificate management approaches and the communication channel requirements and properties (e.g., misbehavior detection, vehicle revocation, privacy, certificate, and key distribution) necessary for security along with some of the metrics necessary to qualify and quantify security and privacy.
Section 9, Multiple-OBE Scalability Testing This section describes the multiple-OBE scalability testing activities. It describes steps taken to increase, cost effectively, the number of available DSRC radios for use in the testing as well as the steps taken to ensure the testing was correct, repeatable, and efficient. The section also lists the various tests that were performed as well as the different configurations and the results of the packet error rate and inter-packet gap data analysis. The section finishes with conclusions and recommended next steps.
3

VSC-A Final Report
Section 10, Conclusions This section provides a summary of the accomplishments of the project and describes the remaining vehicle safety communications needs for potential deployment. The section also identifies potential next steps and recommendations based on the technical results and engineering experience gained throughout the execution of the VSC-A Project.
Section 11, Publicly Available Project Documentation Contains a table of some of the reports, papers, and presentations that were either published or made publicly available during this project.
Section 12, References Contains a list of documents referenced throughout the report.
2 Crash Scenarios and Safety Applications Selection
2.1 Overview
Early in the project, the USDOT provided the VSC-A Team with a crash test scenarios document to serve as a starting point for analysis and a reference for the selection of the final set of safety applications to be studied under the VSC-A Project. Following the selection of the safety applications, two safety system structures were defined; one based on DSRC+Positioning-only, and the second one based on a hybrid version comprised of DSRC+Positioning and autonomous sensing (e.g., radar).
2.2 Crash Scenarios Selection
The USDOT evaluated pre-crash scenarios based on the 2004 National Automotive Sampling System (NASS) General Estimates System (GES) crash database in order to provide a list of potential crash imminent safety scenarios. The list included crash imminent safety scenarios based on the following USDOT rankings:
Crash rankings by frequency
Crash rankings by cost
Crash rankings by functional years lost
Composite crash rankings
The composite crash rankings were determined by taking the average of the crash rankings by frequency, cost, and functional years lost for each scenario. The crash scenarios were then sorted based on the composite ranking and were analyzed to evaluate whether autonomous safety systems and/or vehicle safety communications would offer the best opportunity to adequately address the scenarios.
From the composite ranking list of crash scenarios, the top five (5) scenarios for the crash frequency, crash cost, and functional years lost crash categories that could be addressed by VSC-A were selected. Across these three crash categories, this resulted in seven (7) crash scenarios being identified that could be addressed by VSC-A. This was done in order to focus on the highest priority crashes, while keeping the program scope to a
4

VSC-A Final Report
manageable level. Table 1 contains the final set of crash imminent scenarios, as agreed between the VSC-A Team and the USDOT, to be addressed under the VSC-A Project. For a description of these scenarios, please refer to [1].
Table 1: VSC-A Selected Crash Imminent Scenarios
Crash Imminent Scenario Crash Category
HighFrequency
HighCost
HighYears
1 Lead Vehicle Stopped
2 Control Loss without Prior Vehicle Action
3 Vehicle(s) Turning at Non-Signalized Junctions
4 Straight Crossing Paths at Non-Signalized Junctions
5 Lead Vehicle Decelerating
6 Vehicle(s) Changing Lanes – Same Direction
7 Vehicle(s) Making a Maneuver – Opposite Direction
Denotes Top Five Ranking for the Crash Category
Note: One of the goals of the VSC-A Program was to develop a basic safety message (BSM) for V2V communications that would address potential crashes 360 degrees around the host vehicle from potential threat vehicles moving in the same, intersecting, and on-coming directions. The ‘Vehicle(s) Not Making a Maneuver – Opposite Direction’ crash scenario is a top five scenario that addresses the on-coming direction. However, it is a challenging scenario that would require advanced vehicle dynamics estimation techniques to be developed which was outside the scope of the VSC-A Project. Since testing the on-coming direction was considered critical in order to develop the path prediction component of the BSM, which is one of the necessary components for potential on-coming crashes, another on-coming scenario that could be addressed by V2V communications was selected, namely ‘Vehicle(s) Making a Maneuver – Opposite Direction’.
Note: Table 1 does not include all top five ranking crash scenarios for high cost and high functional years lost crash categories. This is due to:
1. One of the top five ranking scenarios for both of these categories being ‘Road Edge Departure without Prior Vehicle Maneuver’ which was not deemed as a viable scenario to be addressed by V2V communications. Thus this scenario is not included in Table 1.
2. One of the top five ranking scenarios for the high functional years crash category being ‘Vehicle(s) Not Making a Maneuver – Opposite Direction’ which as discussed above was outside the scope of the VSC-A Project to address.
5

VSC-A Final Report
2.3 Safety Applications Selection
The VSC-A Team and USDOT analyzed the crash imminent scenarios in Table 1 and developed concepts for safety applications that could potentially address them using vehicle safety communications. This analysis resulted in the identification and selection of the following safety applications developed as part of the VSC-A system:
Emergency Electronic Brake Lights (EEBL), defined as follows: The EEBL application enables a host vehicle (HV) to broadcast a self-generated emergency brake event to surrounding remote vehicle (RVs). Upon receiving such event information, the RV determines the relevance of the event and provides a warning to the driver, if appropriate. This application is particularly useful when the driver’s line of sight is obstructed by other vehicles or bad weather conditions (e.g., fog, heavy rain).
Forward Collision Warning (FCW), defined as follows: The FCW application is intended to warn the driver of the HV in case of an impending rear-end collision with a RV ahead in traffic in the same lane and direction of travel. FCW is intended to help drivers in avoiding or mitigating rear-end vehicle collisions in the forward path of travel.
Blind Spot Warning+Lane Change Warning (BSW+LCW), defined as follows: The BSW+LCW application is intended to warn the driver of the HV during a lane change attempt if the blind-spot zone into which the HV intends to switch is, or will soon be, occupied by another vehicle traveling in the same direction. Moreover, the application provides advisory information that is intended to inform the driver of the HV that a vehicle in an adjacent lane is positioned in a blind-spot zone of the HV when a lane change is not being attempted.
Do Not Pass Warning (DNPW), defined as follows: The DNPW application is intended to warn the driver of the HV during a passing maneuver attempt when a slower moving vehicle, ahead and in the same lane, cannot be safely passed using a passing zone which is occupied by vehicles with the opposite direction of travel. In addition, the application provides advisory information that is intended to inform the driver of the HV that the passing zone is occupied when a vehicle is ahead and in the same lane and a passing maneuver is not being attempted.
Intersection Movement Assist (IMA), defined as follows: The IMA application is intended to warn the driver of a HV when it is not safe to enter an intersection due to high collision probability with other RVs. Initially, IMA is intended to help drivers avoid or mitigate vehicle collisions at stop sign-controlled and uncontrolled intersections.
Control Loss Warning (CLW), defined as follows: The CLW application enables a HV to broadcast a self-generated, control, loss event to surrounding RVs. Upon receiving such event information, the RV determines the relevance of the event and provides a warning to the driver, if appropriate.
6

VSC-A Final Report
Table 2 below illustrates the mapping between the crash imminent scenarios identified in Table 1 and the list of safety applications selected to be developed and implemented under the VSC-A Program.
Table 2: Crash Imminent Scenario to VSC-A Program Application Mapping
Safety Applications Crash Scenarios EEBL FCW BSW LCW DNPW IMA CLW
1 Lead Vehicle Stopped
2 Control Loss without Prior Vehicle Action
3 Vehicle(s) Turning at Non-Signalized Junctions
4 Straight Crossing Paths at Non-Signalized Junctions
5 Lead Vehicle Decelerating
6 Vehicle(s) Changing Lanes– Same Direction
7
Vehicle(s) Making a Maneuver – Opposite Direction
Following the identification of the crash scenarios that could be addressed by the VSC-A system and the corresponding applications, two safety system structures were defined to guide the rest of the project efforts:
1. A DSRC+Positioning and autonomous sensing vehicle communication safety system structure
2. A DSRC+Positioning only vehicle communication safety system structure
The first system framework, or structure, focused on the potential integration of technology enablers, such as improved path prediction using DSRC+Positioning, with existing autonomous sensing system approaches to attempt to solve some of the limitations of autonomous vehicle-based safety systems. This framework is discussed in Section 3.
The second system framework integrated the set of safety applications identified above as part of a comprehensive DSRC+Positioning-based safety system. This second framework was used as the foundation for the test bed system development and subsequent objective test and other project activities. This framework is discussed in Section 4.
3 DSRC+Positioning and Autonomous Sensing Safety System Analysis
A primary objective of the VSC-A Project was to determine if vehicle safety applications that utilize DSRC-based vehicle safety communications can help overcome some of the limitations of autonomous systems and enhance the overall safety system performance. A
7

VSC-A Final Report
potential advantage of DSRC-based vehicle safety communications is that cooperative communications may provide significant, additional information about the driving situation that goes well beyond the capabilities of object sensing used in autonomous safety systems.
The following sections provide a summary of the activities that took place as part of the DSRC+Positioning and autonomous sensing safety system analysis. Further discussion of these and other activities which took place as part of this analysis is referenced in Appendix A.
3.1 Autonomous Safety System Limitations
Of the crash scenarios listed in Table 1, only the following three scenarios are addressed by existing autonomous safety systems:
Lead Vehicle Stopped
Lead Vehicle Decelerating
Vehicle(s) Changing Lanes–Same Direction
The VSC-A Team identified the various limitations that autonomous safety systems have shown in addressing these crash imminent scenarios as well as the root causes behind these limitations. The intent was to evaluate whether these limitations can be addressed with DSRC-based vehicle safety communications.
These limitations were classified within the following sub-groups:
Late confirmation of a stopped lead vehicle as an in-path stationary target
Occasional incorrect, out-of-path target detection and rejection
Late alerts for a decelerating lead vehicle
Late alerts for vehicle cut-ins
False alerts for a lead vehicle turning/changing lanes
False alerts for a lead vehicle braking to turn/change lanes
Occasional false alerts for vehicle cut-outs
Occasional, missed detection of adjacent lane vehicles With DSRC allowing for a 360–degree, virtual, field of view (FoV) and not requiring full line of sight for neighboring vehicles for most driving conditions, some of the potential DSRC+Positioning technical approaches that could be used to address the technical root causes of these limitations include:
Transmission of vehicle status information to include: brake status, speed, deceleration value, etc.
Transmission of vehicle position
Calculation and transmission of vehicle path history
Calculation and transmission of vehicle path prediction
8
VSC-A Final Report
See Appendix A for a complete description of the limitations of autonomous safety systems in addressing the three scenarios identified above, the root causes of these limitations, and how DSRC+Positioning may address these root causes.
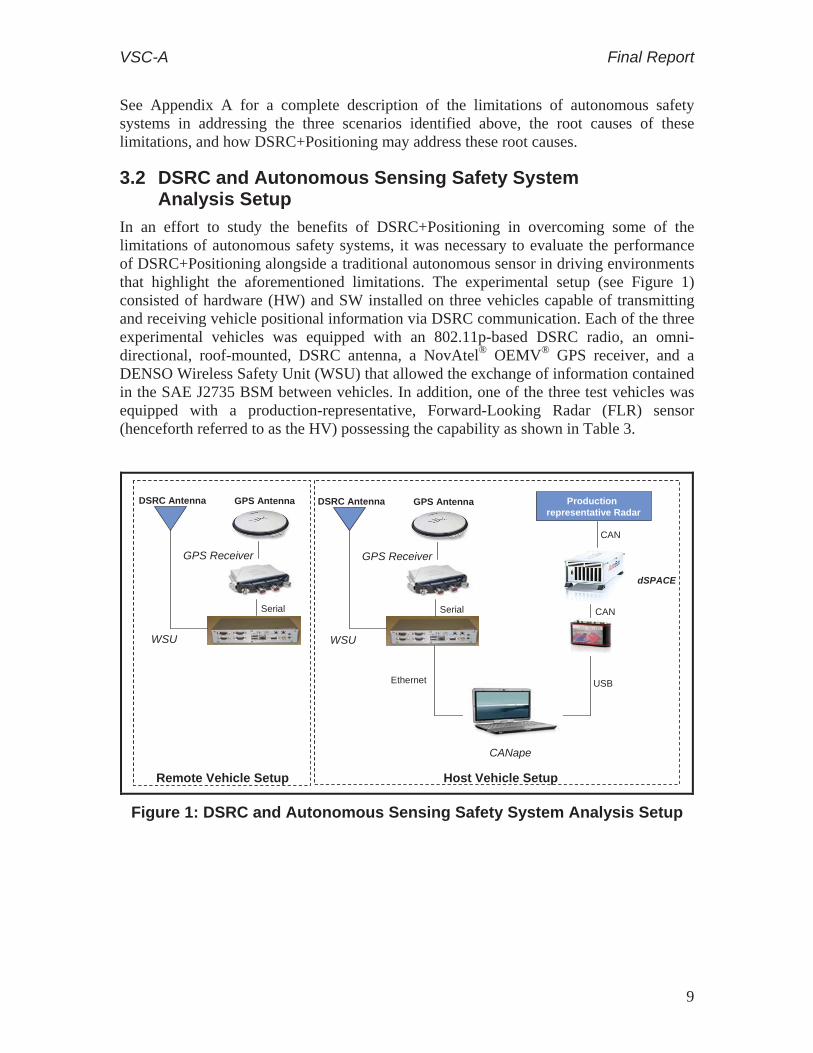
3.2 DSRC and Autonomous Sensing Safety System Analysis Setup
In an effort to study the benefits of DSRC+Positioning in overcoming some of the limitations of autonomous safety systems, it was necessary to evaluate the performance of DSRC+Positioning alongside a traditional autonomous sensor in driving environments that highlight the aforementioned limitations. The experimental setup (see Figure 1) consisted of hardware (HW) and SW installed on three vehicles capable of transmitting and receiving vehicle positional information via DSRC communication. Each of the three experimental vehicles was equipped with an 802.11p-based DSRC radio, an omni-directional, roof-mounted, DSRC antenna, a NovAtel® OEMV® GPS receiver, and a DENSO Wireless Safety Unit (WSU) that allowed the exchange of information contained in the SAE J2735 BSM between vehicles. In addition, one of the three test vehicles was equipped with a production-representative, Forward-Looking Radar (FLR) sensor (henceforth referred to as the HV) possessing the capability as shown in Table 3.
GPS Receiver
WSU
GPS Antenna DSRC Antenna
Serial
Remote Vehicle Setup
GPS Receiver
WSU
Ethernet
GPS Antenna DSRC Antenna Production representative Radar
dSPACE
USB
CAN
CAN
Serial
CANape
Host Vehicle Setup
Figure 1: DSRC and Autonomous Sensing Safety System Analysis Setup
9

VSC-A Final Report
Table 3: Minimum Performance of Forward-Looking Radar Sensor
Category Specification Operational Frequency 76 Ghz Range 3 to 150 m (10m2 RCS) Range Rate -64 to +33 m/s Azimuth Angular FoV +/- 7.5 deg Update Rate 10 Hz
The DSRC+Positioning and FLR-equipped vehicle was also equipped with a wide FoV (60+ degrees) forward-looking camera for capturing video of the road ahead. In order to capture data from both the FLR and the DSRC+Positioning systems (in addition to the video data), a measurement and data acquisition tool with the ability to provide synchronized data and video acquisition of both the FLR and DSRC+Positioning system was utilized (see Figure 2 below).
Figure 2: Measurement and Data Acquisition Tool Experimental Layout
3.3 DSRC and Autonomous Sensing Safety System Analysis Testing
With the autonomous safety system limitations identified in 3.1 as a guide, six tests were selected and executed in order to assess the ability of the FLR autonomous sensor and the DSRC+Positioning system to independently detect and track one or more RV in a variety of driving conditions. These tests are as follows:
10

VSC-A Final Report
1. Detecting a Vehicle as an In-Path Stationary Target
2. Detecting a Stationary Vehicle in a Curve
3. Straight-Curve and Curve-Straight Road Transitions
4. Late Cut-in of Vehicle into the HV Path
5. Cut-out of Lead Vehicle Reveals Stopped Vehicle in Lane
6. Tracking Intersecting Vehicles
The results of the testing show that DSRC+Positioning can address the limitations identified with autonomous sensing safety systems. For the complete analysis and results obtained from evaluating the two sensing methods for all six tests, please refer to Appendix A.
As an illustration of the analysis and results, Test #5 is selected in the following to show the side-by-side performance of the FLR-autonomous sensor and the DSRC+Positioning system during a sudden cut-out of a previously tracked vehicle to reveal a stationary vehicle within the lane of travel (Figure 3).
Figure 3: Cut-out of Lead Vehicle Reveals Stopped Vehicle In-lane
As can be seen in Figure 4, the in-path target confirmation was only possible with the FLR after the stopped vehicle is within the radar FoV. When the initial primary target vehicle (RV1) cuts-out of the HV lane of travel, revealing the stationary vehicle (RV2), it takes approximately 5 seconds before RV2 is acquired by the FLR sensor. In contrast, the DSRC+Positioning system on the HV received positional information from RV2 several hundred meters away. After the RV1 cut-out, it can be seen that the DSRC+Positioning system provides continuous ranging information to the stationary vehicle, thereby, greatly enhancing the ability for a Collision Avoidance System (e.g., FCW) to provide an alert to the driver of the HV, if deemed necessary.
11

VSC-A Final Report
Figure 4: Sensor Performance during Vehicle Cut-Outs
3.4 Summary
In-vehicle testing shows that DSRC+Positioning can address several known limitations with autonomous sensing safety systems. Thus, the operational envelope for autonomous systems could be extended by associating targets identified with autonomous sensors with targets identified via DSRC+Positioning. For situations where no autonomous sensor target exists, which can be associated with a corresponding DSRC+Positioning target, standard autonomous applications are still possible using the information received from a DSRC+Positioning only system. Likewise, for situations where no DSRC+Positioning target is possible (e.g., fixed targets, people, animals, etc.), autonomous sensors are necessary. What is likely is a “mixed-environment” with vehicles being equipped with an autonomous sensing and a DSRC+Positioning sensing safety system.
12

VSC-A Final Report
4 DSRC+Positioning-Only Test Bed System Development
4.1 Overview
Under the project, each VSC2 Consortium Participant developed a DSRC+Positioning-only vehicle test bed (this will now be referred to as the test bed in the remaining text of this document) to serve as a prototype platform for the VSC-A system. The test bed was used to validate system specifications and performance tests that were developed as part of the VSC-A Project. The test bed also served as a flexible platform for testing various positioning, communication, and security solutions in a real-world setting and in safe and staged crash-scenario configurations to ensure the effectiveness of the applications. The following sections summarize the test bed design and implementation. For a more detailed description, please refer to Appendix B-1.
4.2 Test Bed System Design
In order to support the functionality of the safety applications listed in Section 2.3 and their development, the VSC-A Team initially focused on the development of an initial system architecture based on various modules that could be upgraded independently if necessary. This approach allowed for fast and efficient prototyping throughout the development phase of the project. This architecture was used during the test bed design stage for the definition of the HW and SW architectures and required interfaces. The various modules forming the system Test Bed were categorized into the following major groups: Interface, Positioning and Security, Core, Safety Applications, Threat Process and Reporting, and Data Analysis. The System Block Diagram (Figure 5) below diagrams the breakdown of the individual modules that make up each of the major module groupings. This System Block Diagram provided the framework for a comprehensive DSRC+Positioning-based safety system.
13

VSC-A Final Report
Color Legend
Vehicle Sensors (Non Production)
DVI Notifier
Engineering DVI
Vehicle CAN Bus Vehicle Signals (Production)
OBE Basic Threat Arbitration
Vehicle CAN to OBE Interface
DSRC Dual Radios
Target Classification
Sensor Data Handler
Wireless Message Handler
Host Vehicle Path Prediction
Path History
I-V V-V Safety Applications
EEBL BSW+LCW DNPW IMA FCW CLW
Security
B
B
CAN CAN
Data Logger & Visualization Tools
Cameras / Audio in
Display
Data Logger
[From other Modules]
Eng. GUI
GPS unit
Serial
ENET
VGA
ENET
Relative Positioning
Platform
CICAS V
OTA Messages
Interface Modules
Core Modules
Positioning & Security
Safety Applications
Threat Process & Report
OEM Specific Modules
Security Verification
Request
A
A
Data Analysis
Forward Looking Camera
CAN
Is a trigger to request verification of the security credentials, from the security module, of the selected threat(s)
Is a trigger to the Engineering DVI to notify the driver of a potential threat
A
B
Figure 5: VSC-A System Block Diagram
The system design activities focused on the core, positioning, security, and safety applications module groupings and were based on preliminary requirements specifications developed for each of the modules within these groups. Throughout the project, based on field test data, updates were made to the relevant applications and core modules designs for incorporation into the final test bed implementation. Given that one of the objectives of the project was to develop a prototype test bed of a set of representative, communication-based, safety applications, it should be noted that the diagram shown above is a reference design that contains the essential elements of the test bed necessary to support this objective. For this reason, only the high-level details of the design and its’ corresponding implementation will be discussed in this report.
4.3 Test Bed Implementation
The test bed system design activities undertaken by the VSC-A Team, and highlighted in the previous section, were followed by the system software design, implementation, release, and testing of the OBE.
4.3.1 System SW Architecture
Figure 6 below, represents the current VSC-A OBE SW architecture diagram that was developed and refined as part of the system specification and design activities discussed above. It details the interaction and high-level data flow between the safety application modules, system framework modules, the DENSO WSU SW services, and external interface devices.
14

VSC-A Final Report
Figure 6: VSC-A Level I OBE SW Architecture
The VSC-A software modules (above the dotted line) are specific to the VSC-A Project. The WSU software services modules (below the dotted line) are generic modules supplied with the WSU that provide services and an Application Programming Interface (API) to enable applications to interface to the CAN buses, GPS receiver, and the DSRC radio(s). The arrows and text between the modules show the primary data flows and their content.
4.3.1.1 WSU Software Services The WSU software services provides an API to enable applications to obtain data from the GPS receiver or the CAN Bus. The API also enables the application to configure the DSRC radio parameters and to transmit and receive OTA data.
The Time/Position Services (TPS) interfaces to the GPS unit to obtain time and position updates and/or Radio Technical Commission for Maritime Services (RTCM) messages and provides this data to requesting applications. The TPS also accepts data for output to the GPS through the serial port.
Similarly, the Vehicle Interface Services (VIS) interfaces to the CAN bus to obtain vehicle status updates and provide this data to requesting applications. The VIS also
15

VSC-A Final Report
accepts data from applications for output to the CAN buses. Applications may access other WSU HW interfaces by using the corresponding device drivers provided by Linux.
Finally the Radio Services (RS) supports up to two radios and may be configured to operate each radio in either Wireless Access in Vehicular Environments (WAVE) mode or Raw mode. WAVE mode allows the radio to operate in IEEE P1609.4 channel switching mode. Raw mode allows the radio to use a single fixed channel to send and receive WAVE Short Messages (WSMs) without having the extra overhead imposed by IEEE P1609.4 channel switching.
4.3.1.2 VSC-A Software Modules The VSC-A SW modules are composed of support and application functions. The support functions interface to external equipment and calculate data to support the VSC-A application modules and engineering Driver-Vehicle Interface (DVIs). The primary ones are as follows:
Threat Arbitration (TA)
Driver Vehicle Interface Notifier (DVIN)
Target Classification (TC)
Host Vehicle Path Prediction (HVPP)
Path History (PH)
Data Logger (DL)
Engineering Graphical User Interface (EGUI)
Sensor Data Handler (SDH)
Wireless Message Handler (WMH)
The application modules evaluate potential categorized safety threats based on the data and inputs from the support modules. These are the warning algorithms used for the six VSC-A safety applications: EEBL, FCW, IMA, BSW+LCW, DNPW, and CLW.
The SDH and WMH are basic, functional blocks necessary for parsing inputs from and appropriately formatting and submitting data to the WSU SW Services and those in use by the other support and application elements.
The SDH interfaces to the Vehicle CAN Gateway device (through the WSU SW Services) to transmit and receive CAN messages and detect communication errors. It also connects to the GPS receiver through WSU SW services to obtain National Marine Electronics Association (NMEA) data including Coordinated Universal Time (UTC) time, position, speed, and heading, as well as RTCM data. The SDH also interfaces to the external computing platform that executes the RTK SW to obtain accurate relative positions of the neighboring vehicles.
The WMH interfaces to the DSRC radio through WSU SW Services and to the Security Module SW. It transmits and receives WSMs using the Security Module to generate and verify message signatures.
16

VSC-A Final Report
4.3.1.3 Shared Memory Interface for Data Access The VSC-A Team decided to use the shared memory interface concept. This allows for data in memory to be accessed by multiple routines for inter-process communication without unnecessary duplication. The need for such a capability may be justified by the following:
As may be apparent from the SW architecture diagram, there are many cases of one module supplying data to many other functional blocks. For example, consecutive host and remote GPS time and position data points may be used by HVPP, PH, TC, and the warning algorithms at the same time.
For effective interface to the data logging and visualization tool, the architecture needs to be able to provide inter-process data to a consistent location for external retrieval
The shared memory scheme used in the architecture fulfills the requirements for support of the VSC-A functionality while allowing for extensibility of the architecture.
4.3.2 Engineering Development Tools
A number of SW tools were developed to assist in the development, testing, analysis, etc., of the SW implementation of the core and system framework modules. Each of these tools was essential in their own right to the final test bed implementation. The primary SW development tools (e.g., scenario replicator and EGUI) are discussed below. A Data Logging and Visualization tool was also developed as part of the SW development activities. This tool was the primary tool used to log and analyze data collected as part of the OTP testing efforts and is discussed in that section of the report (see Section 5.3).
4.3.2.1 Scenario Replicator Tool The VSC-A Team realized that exact replication of specific V2V test scenarios multiple times involving multiple vehicles for application debug would be problematic, from both a repeatability and logistic standpoint. To help alleviate this problem, the VSC-A Team implemented one very important and useful tool referred to as the Scenario Replicator (SR). The SR provided the ability to record inputs from the WSU SW services to applications into a log file. These inputs could then be played back at a later time, in a bench set-up, to aid in application debugging, enhancement, and regression testing.
The WSU supports the ability to have the Radio Services, Time/Position Services, Vehicle Interface Services, and RTK Positioning SW Interface record the data they send to applications into a single file in a time-stamped format. This allowed for different complex scenarios to be executed in the field and to be captured into one or more SR files (see Figure 7 for an illustration).
When desired, these scenarios could be played back on the WSU. During playback mode, the applications receive the identical data that was received at the time the scenario was recorded. In addition, the WSU system time is also set to the time the scenario was recorded (see Figure 8 for an illustration). This capability provided a reliable way to compare and enhance application performance against a complex yet static set of external inputs.
17

VSC-A Final Report
Figure 7: Scenario Record Mode
18
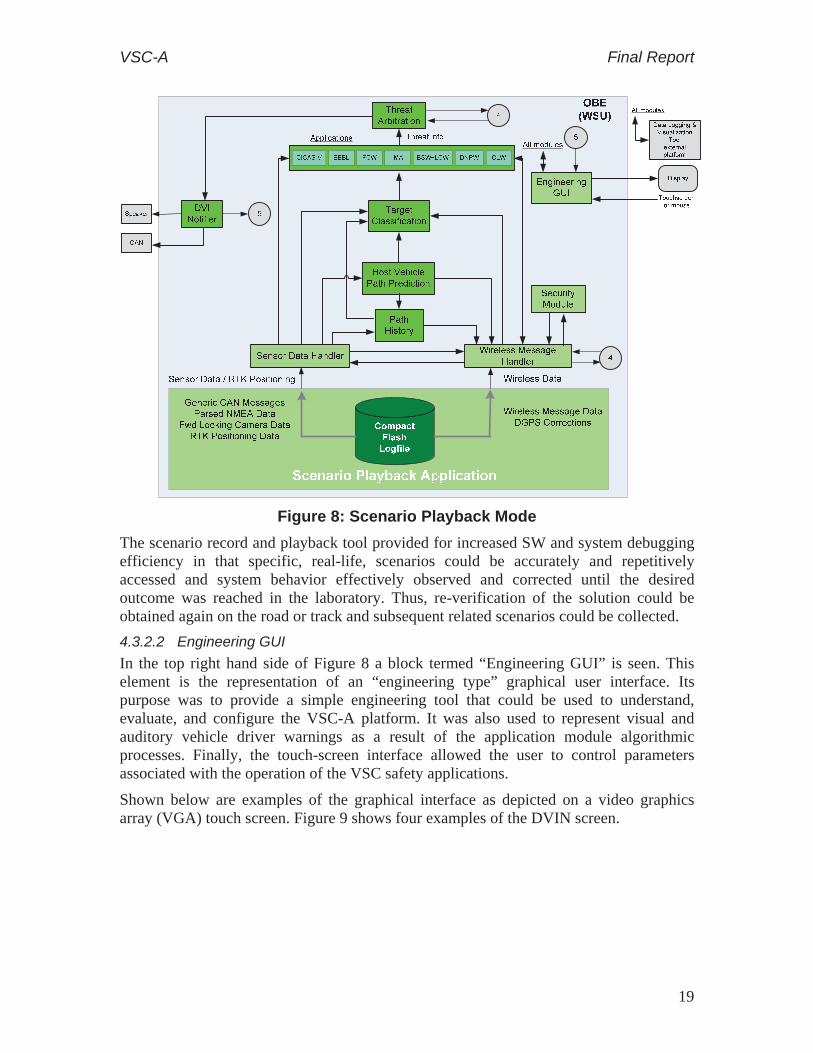
VSC-A Final Report
Figure 8: Scenario Playback Mode
The scenario record and playback tool provided for increased SW and system debugging efficiency in that specific, real-life, scenarios could be accurately and repetitively accessed and system behavior effectively observed and corrected until the desired outcome was reached in the laboratory. Thus, re-verification of the solution could be obtained again on the road or track and subsequent related scenarios could be collected.
4.3.2.2 Engineering GUI In the top right hand side of Figure 8 a block termed “Engineering GUI” is seen. This element is the representation of an “engineering type” graphical user interface. Its purpose was to provide a simple engineering tool that could be used to understand, evaluate, and configure the VSC-A platform. It was also used to represent visual and auditory vehicle driver warnings as a result of the application module algorithmic processes. Finally, the touch-screen interface allowed the user to control parameters associated with the operation of the VSC safety applications.
Shown below are examples of the graphical interface as depicted on a video graphics array (VGA) touch screen. Figure 9 shows four examples of the DVIN screen.
19

VSC-A Final Report
Figure 9: DVIN Stages: (left right, top bottom) No Threat, Threat Detected, Inform Driver, Warn Driver
This allowed the EGUI to display the warning states of a particular threat and, in this case, the DNPW is displayed. To conserve computing power, only one of the warning screens is visible at any particular time. In order to ensure the most important warning was shown on the DVI screen (and, if appropriate, auditory response) the TA used threat level, relative speed, and location of the threat from each of the application modules to assess the severity and determine the highest priority request to be used by DVIN.
The EGUI could also show the particular operating scenario for an individual warning application. For the DNPW example used above, Figure 10 shows the screen shot information available in the EGUI. Data such as lateral and longitudinal offsets and relative speed were important to monitor as the effectiveness of the warning algorithm was evaluated. The green/yellow colored graphics provided a quick view of the position and status of potential threat vehicles, relative to the HV. The other five VSC-A safety applications had similar type data screens available for debug and evaluation.
20

VSC-A Final Report
Figure 10: DNPW EGUI Screen
Finally, an example of a support block data presentation is shown in Figure 11. Here, the example of the detailed WMH data for remote (neighboring) vehicle ID #1 is provided. The data presented was gathered from the OTA safety message. Therefore, information such as RV heading, brake status, lat/long location, yaw rate, etc., is shown on the screen. Such information was extremely valuable in assessing the capability of the support module and determining, along with other data, whether or not the threat detecting applications were correctly processing the sensor information.
21

VSC-A Final Report
Figure 11: WMH – RV Screen Shot
4.3.3 Software Implementation and Release
The SW implementation for the core and application modules was accomplished in several stages where increased functionality was added and tested at each stage. Prior to final integration into the WSU, the SW implementation for each of the modules was provided to the VSC-A Team for review. The following SW release types were developed during the program:
Interface – Supported the external interface requirements to the WSU. This release of the SW allowed issues with the interfaces to be worked out prior to receiving application-level software.
Alpha – Supported the primary functionality of the core and safety application modules. Multiple Alpha releases were received with the content of the releases prioritized to aid in the testing/debugging activities. As much as possible, required changes identified in an Alpha release were incorporated into subsequent Alpha releases rather than waiting until the Baseline release (discussed below) to incorporate the changes.
Baseline – Supported the full functionality of the core and safety application modules and is referred to as the Level I test bed. This release of the SW incorporated the remaining items that were not present in the final Alpha release
22

VSC-A Final Report
as well as the required remaining changes identified through the Alpha release testing efforts.
Final – The final release of the VSC-A SW implementation.
Each of the release types identified above, other than the Final, had multiple release packages with each package containing a WSU SW Services release and a VSC-A SW application release. Along with each SW release, the engineering debugging utilities (Scenario Record and Playback) and enhanced engineering monitoring tools (EGUI and Data Logging) were developed to accelerate the iteration cycle between design refinement, testing, and verification.
4.4 Test Bed In-Vehicle Hardware Integration
The in-vehicle HW integration activities involved the identification, acquisition, installation, and integration of all the HW and SW required for completion of the test bed. The CAMP—VSC2 Consortium Participants purchased the following vehicles during the first year of the project to be used in the VSC-A system test bed. They are listed here in order to provide a complete list of the equipment used for the VSC-A test bed.
Ford: 2007 Volvo S80
General Motors: 2007 Cadillac STS Sedan
Honda: 2006 Honda Acura RL
Mercedes-Benz: 2007 Mercedes ML 350
Toyota: 2006 Toyota Prius
Table 4 identifies the model and manufacturer of the equipment installed on the VSC-A test vehicles comprising the default configuration of the system test bed. Figure 12 follows and illustrates the HW layout of the system test bed.
Table 4: VSC-A Test Bed Hardware List
Item Description Manufacturer Model
GPS Receiver NovAtel® OEMV® Flexpak V1-RT20A
GPS Antenna NovAtel® GPS-701-GG LCD VGA Monitor Xenarc 700TSV-B USB CCD Monochrome Camera
The Imaging Source DMK 21BU04
Car PC Logic Supply Voom PC-2 Inertial Measurement Unit Silicon Sensing DMU OBE Vehicle CAN interface Smart Engineering Tools Netway 6 DSRC Antenna Nippon Antenna DEN-HA001-001 Ethernet Switch Netgear GS105
23

VSC-A Final Report
VGA monitor GPS Antenna & Receiver (for EGUI)
Serial
VGA
Camera for Data Collection
Car PC – Relative Positioning OBE (WSU)
USB
CANCAN
ENET
ENET
ENET
Serial
Laptop for Data Logging and Visualization
Ethernet Switch DMU Vehicle CAN OBE Interface DSRC Antenna
Figure 12: VSC-A System Test Bed HW Layout
5 Objective Test Procedures
5.1 Overview
The objective testing activity within the VSC-A Project included the developing the OTPs and objective test plan, conducting the objective tests, and the analysis of the test results. The purpose of the objective testing was to ascertain that:
The performance of the VSC-A system test bed was sufficient to enable the safety applications developed in the project
The applications satisfied the minimum performance requirements (see Appendix C-1)
The OTPs for the applications were developed by the respective application owners and were designed to include the most common scenarios that the application would encounter. The procedures included:
True positive tests, where the objective is to get a warning
False positive tests, where the objective is to suppress a warning, because it is not needed
The outcome of the objective tests was used by the Volpe National Transportation Systems Center (Volpe) to estimate the Safety Benefits Opportunity for V2V Communications based safety applications. For the estimate, only true positive tests were evaluated and only those tests had successful/unsuccessful criteria associated with them.
24

VSC-A Final Report
Overall, 33 test procedures were developed, of which 22 were true positive tests and 11 were false positive tests. The objective tests were discussed with National Highway Traffic Safety Administration (NHTSA) and Volpe and agreed upon by all participants. The development of the test plan followed the completion of the design of the test procedures. The test plan included the number of runs for each test, test speeds, validation criteria for each procedure (allowable speed ranges, etc.), and detailed setup procedures to make the procedures as repeatable as possible. The test plan was agreed upon by Volpe and NHTSA prior to conducting the objective testing. The OTPs and the test plan are included in Appendix C-2.
The objective testing took place from June 1, 2009 to June 3, 2009 at TRC in East Liberty, Ohio. The description of the test facilities can also be found in Appendix C-3.
5.2 System Configuration
All the configuration information for the applications in the objective testing was stored in a configuration file. The configuration file contained information about speed and distance thresholds, positioning, communications, security, and other parameters necessary for the functioning of the system. The important settings for communication, positioning, and security used in the objective testing default configuration were:
Communications Configuration
All V2V applications were enabled
1609.4 channel switching was enabled with a 10 Hz message rate, 6 Mbps data rate, and 20 dBm transmission power
Security Configuration
Security was enabled and configured for ECDSA with Verify on Demand (VoD)
Privacy was enabled with full identification randomization including the sender identification (ID)
Certificates were attached with each message and certifications changed randomly every 5 to 10 minutes
Positioning
Single-Point relative positioning was enabled
Position coasting was enabled to handle short GPS and communication outages
5.3 Data Recording
The data that was collected during the OTP testing was recorded both in a data logging and visualization tool and as a scenario recording in the WSU. Figure 13 shows an example of the primary screen of the data logging and visualization tool that was used for the objective testing. The screen is divided into four quadrants:
Quadrant 1: Contains a birds-eye view which is a graphical representation of the location of the HV, centered at (0,0) and the RVs that the HV is in
25

VSC-A Final Report
communication with. In addition to plotting the HV and RV(s) locations, the ability to plot their path history points and predicted paths is also supported.
Quadrant 2: Contains the camera data which will consist of a single image, as shown below, or up to four images multiplexed together. The applicable RV track number(s) will be overlaid onto the displayed image when the single image mode is selected.
Quadrant 3: Contains the HV’s vehicle sensor data, Dynamics Measurement Unit (DMU) data, and GPS data.
Quadrant 4: Contains the RV track data as determined by the Target Classification (TC) core module.
Figure 13: Example Layout Screen for OTP Testing
More information about the tool and the use for the data recording and analysis can be found in Appendix C-3.
5.4 Objective Test Results
The complete list of tests, the speeds for the runs, and the number of runs for each test is shown in Table 5. The number of runs per test varied. In general, true positive tests had eight (8) or ten (10) runs, whereas false positive tests had two (2) runs. If multiple speed combinations were tested in one scenario, the number of runs was adjusted to keep the overall number of runs manageable.
The evaluation of the test runs was conducted by each Original Equipment Manufacturer (OEM) responsible for the application. In general, the purpose of the test
26

VSC-A Final Report
was to measure the consistency of the warning, rather than the absolute warning timing. The reasons for this methodology are:
This demonstrates the ability of the system to support any warning timing that is chosen
The absence of a production-level DVI so only the time where the DVIN sends a threat information signal to the vehicle CAN bus can be used as an objective measure
The applications were developed to demonstrate the capabilities of the system with an emphasis on interoperability and repeatability, so the warning timings were not optimized
True positive tests that passed at least six (6) out of eight (8) or eight (8) out of ten (10) runs were classified as successful, otherwise they were deemed unsuccessful. As can be seen from Table 5, all the true positive tests were successful. The false positive tests were not evaluated for success or failure, but all the false positive tests were successful in the sense that no warning was issued.
To confirm the validity of the relative positioning data used by the core and application modules during the testing, GPS reference testing was conducted to measure the relative positioning accuracy of the OBE system when compared to the reference system. Please refer to Section 7.2.4 for the results of this testing.
Table 5: Objective Test Scenarios and Results
TestScenario Description Speeds Number
of Runs Type
of Test Result
EEBL-T1 HV at constant speed
with decelerating RV in same lane
50 8 True
Positive Successful
EEBL-T2 HV at constant speed
with decelerating RV in left lane on curve
50 8 True
Positive Successful
EEBL-T3
HV at constant speed with decelerating RV in
same lane and obstructing vehicle in
between
50 8 True
Positive Successful
EEBL-T4 HV at constant speed
with mild-decelerating RV in same lane
50 2 False
Positive N/A
EEBL-T5 HV at constant speed
with decelerating RV in 2nd right lane
50 2 False
Positive N/A
FCW-T1 HV travel at a constant
speed\RV stopped 50 10
True Positive
Successful
27

VSC-A Final Report
TestScenario Description Speeds Number
of Runs Type
of Test Result
FCW-T2 HV travel behind
RV1\RV1 travel behind RV2\RV2 stopped
50 10 True
Positive Successful
FCW-T3 HV drive on a curve\RV
stopped at the curve 50 8
True Positive
Successful
FCW-T4 HV tailgate RV 50 2 False
Positive N/A
FCW-T5 HV follows RV\RV
brakes hard 40 10
True Positive
Successful
FCW-T6
HV driving into a curved right lane\RV
stopped in the left curved lane
50 2 False
Positive N/A
FCW-T7 HV travels behind a
slower RV 50 10
True Positive
Successful
FCW-T8 HV changes lanes
behind a stopped RV 50 8
True Positive
Successful
FCW-T9
HV approaches two RVs in left and right adjacent lanes and
passes between them
50 2 False
Positive N/A
BSW/LCW-T1
LCW Warning, Left 50 8 True
Positive Successful
BSW/LCW-T2
LCW Warning, Right 50 8 True
Positive Successful
BSW/LCW-T3
LCW Warning, Right with Left BSW
Advisory 50 9
True Positive
Successful
BSW/LCW-T4
BSW Advisory Alert, Left
50 8 True
Positive Successful
BSW/LCW-T5
BSW Advisory Alert, Right
50 8 True
Positive Successful
BSW/LCW-T6
No Warning or Advisory for RV behind
50 2 False
Positive N/A
BSW/LCW-T7
No Warning or Advisory for RV far
Right 50 2
False Positive
N/A
BSW/LCW T8
LCW Warning in Curve, Right
35 8 True
Positive Successful
28

VSC-A Final Report
TestScenario Description Speeds Number
of Runs Type
of Test Result
DNPW-T1 Attempt to pass with
oncoming RV in adjacent lane
25/35 10 True
Positive Successful
DNPW-T2 Attempt to pass with
stopped RV in adjacent lane
30/40 10 True
Positive Successful
DNPW-T3 Attempt to pass with oncoming RV not in
adjacent lane 45 2
False Positive
N/A
IMA-T1
Variable speed approaches with
stopped HV/moving RV/open intersection
20/30/40/50 12True
Positive Successful
IMA-T2 Stopped HV/moving RV/open intersection
35/50 4 False
Positive N/A
IMA-T3
Variable speed approaches with moving
HV/moving RV/open intersection
15/25/35/45 16True
Positive Successful
IMA-T4 Moving HV/moving RV/open intersection
25 4 False
Positive N/A
IMA-T5
Stopped HV/moving RV/open
intersection/parked vehicle
20/30/40/50 12True
Positive Successful
CLW-T1
HV at constant speed with CLW RV in same lane ahead in same travel
direction
40 8 True
Positive Successful
CLW-T2 HV at constant speed with CLW RV in 2nd
right lane 30 2
False Positive
N/A
CLW-T3
HV at constant speed with CLW RV in
adjacent lane ahead in opposite travel direction
30 12 True
Positive Successful
As can be seen from the table, all the applications passed the objective tests. A detailed analysis of the results for each of the tests can be found in Appendix C-3.
29
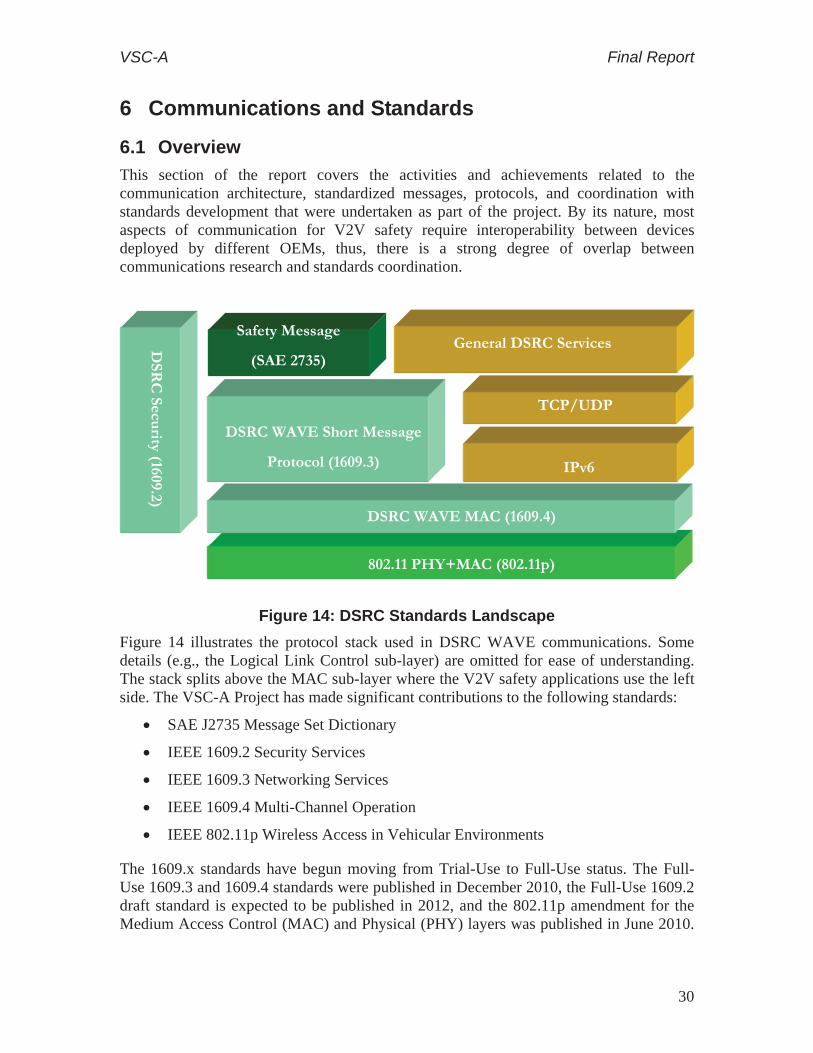
VSC-A Final Report
6 Communications and Standards
6.1 Overview
This section of the report covers the activities and achievements related to the communication architecture, standardized messages, protocols, and coordination with standards development that were undertaken as part of the project. By its nature, most aspects of communication for V2V safety require interoperability between devices deployed by different OEMs, thus, there is a strong degree of overlap between communications research and standards coordination.
802.11 PHY+MAC (802.11p)
DSRC WAVE MAC (1609.4)
IPv6
TCP/UDP
Safety Message
(SAE 2735) General DSRC Services D
SRC
Security (1609.2)
DSRC WAVE Short Message
Protocol (1609.3)
Figure 14: DSRC Standards Landscape
Figure 14 illustrates the protocol stack used in DSRC WAVE communications. Some details (e.g., the Logical Link Control sub-layer) are omitted for ease of understanding. The stack splits above the MAC sub-layer where the V2V safety applications use the left side. The VSC-A Project has made significant contributions to the following standards:
SAE J2735 Message Set Dictionary
IEEE 1609.2 Security Services
IEEE 1609.3 Networking Services
IEEE 1609.4 Multi-Channel Operation
IEEE 802.11p Wireless Access in Vehicular Environments
The 1609.x standards have begun moving from Trial-Use to Full-Use status. The Full-Use 1609.3 and 1609.4 standards were published in December 2010, the Full-Use 1609.2 draft standard is expected to be published in 2012, and the 802.11p amendment for the Medium Access Control (MAC) and Physical (PHY) layers was published in June 2010.
30
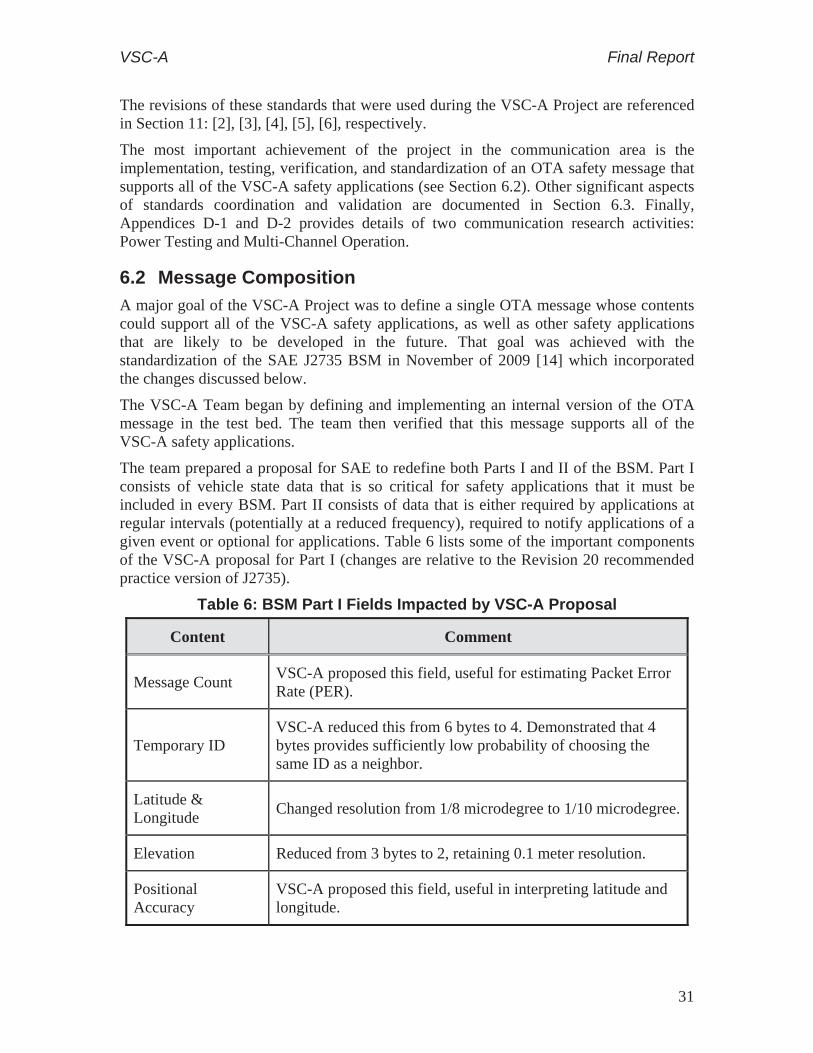
VSC-A Final Report
The revisions of these standards that were used during the VSC-A Project are referenced in Section 11: [2], [3], [4], [5], [6], respectively.
The most important achievement of the project in the communication area is the implementation, testing, verification, and standardization of an OTA safety message that supports all of the VSC-A safety applications (see Section 6.2). Other significant aspects of standards coordination and validation are documented in Section 6.3. Finally, Appendices D-1 and D-2 provides details of two communication research activities: Power Testing and Multi-Channel Operation.
6.2 Message Composition
A major goal of the VSC-A Project was to define a single OTA message whose contents could support all of the VSC-A safety applications, as well as other safety applications that are likely to be developed in the future. That goal was achieved with the standardization of the SAE J2735 BSM in November of 2009 [14] which incorporated the changes discussed below.
The VSC-A Team began by defining and implementing an internal version of the OTA message in the test bed. The team then verified that this message supports all of the VSC-A safety applications.
The team prepared a proposal for SAE to redefine both Parts I and II of the BSM. Part I consists of vehicle state data that is so critical for safety applications that it must be included in every BSM. Part II consists of data that is either required by applications at regular intervals (potentially at a reduced frequency), required to notify applications of a given event or optional for applications. Table 6 lists some of the important components of the VSC-A proposal for Part I (changes are relative to the Revision 20 recommended practice version of J2735).
Table 6: BSM Part I Fields Impacted by VSC-A Proposal
Content Comment
Message Count VSC-A proposed this field, useful for estimating Packet Error Rate (PER).
Temporary ID VSC-A reduced this from 6 bytes to 4. Demonstrated that 4 bytes provides sufficiently low probability of choosing the same ID as a neighbor.
Latitude & Longitude
Changed resolution from 1/8 microdegree to 1/10 microdegree.
Elevation Reduced from 3 bytes to 2, retaining 0.1 meter resolution.
Positional Accuracy
VSC-A proposed this field, useful in interpreting latitude and longitude.
31

VSC-A Final Report
Content Comment
Transmission and Speed
Compact 2-byte field includes gear setting and unsigned vehicle speed.
Brake Status Added fields to convey status of Stability Control, Brake Boost, and Auxiliary Brakes.
Throttle Position and Exterior Lights
VSC-A removed these items from Part I. They remain optional for inclusion in Part II.
All fields For each field representing sensor input, VSC-A defined an “unavailable” state to indicate when the content is not valid.
All fields When a state variable can exceed the indicated range, defined values X and Y to represent “at least X” and “at most Y.”
The VSC-A proposal with regard to Part II of the BSM defined four new fields: Event Flags, Path History, Path Prediction, and RTCM Package. The Event Flags field is included in Part II when at least one of a set of unusual events is occurring, including hard braking (defined as deceleration of at least 0.4g), hazard lights on, or the activation of any of the following systems for at least 100 ms: anti-lock brakes, stability control, or traction control.
The other three Part II fields are intended to be included periodically, perhaps at a reduced rate compared to the overall BSM transmission rate. The Path History field allows a vehicle to indicate its recent movement over a certain distance using an adaptable concise representation. Each prior point is encoded as the difference from the current latitude and longitude indicated in Part I of the BSM, with options to also include time, elevation, and position accuracy. While the selection of points is quite flexible, a design methodology was provided to encourage efficient and compact representations of the path history. For example, the points need not be separated from each other by uniform space or time differences.
The Path Prediction field allows a vehicle to indicate its predicted path trajectory with RVs. This trajectory estimation provides an indication of the future positions of the transmitting vehicle with a special value to indicate “straight path” and an additional field to indicate prediction confidence. It can be used by RVs to significantly enhance in-lane and out-of-lane threat classification.
The RTCM Package field can convey a select sub-set of the RTCM messages (message types 1001 TO 1032) which deal with differential corrections between users with the message of primary interest to VSC-A being RTCM 1002. This message allows a vehicle to share its raw GPS information which enables accurate relative positioning between vehicles using moving base RTK solutions available with relative positioning modules.
32

VSC-A Final Report
In order to emphasize the relative importance of these four Part II fields compared to others that are optional but not critical for VSC-A safety applications, VSC-A defined the set of four fields as the Vehicle Safety Extension portion of Part II. The remaining optional fields are defined as the Vehicle Status portion of Part II (see Figure 15 for the format of the BSM).
DE_EventFlags DF_PathHistory DF_PathPrediction DF_RTCMPackage
DE_DSRC_MessageID
Part I
DF_VehicleStatus
MSG_BasicSafetyMessage
DF_VehicleSafetyExtension
Message Format
Part II
Optional Elements
DF_BSM_Blob
Message Count Temporary ID Time (from GPS receiver corresponding to the position) Position Latitude, Longitude, Elevation, Accuracy Vehicle Speed, Transmission State, Heading, Steering Wheel Angle Vehicle Accelerations, Yaw Rate Brake System Status Vehicle Length, Width
Figure 15: SAE J2735 Rev 35 Basic Safety Message Format
Following the effort to define and standardize the SAE J2735 BSM according to VSC-A requirements, the VSC-A Team modified its OTA message to conform to the J2735 Standard and verified that it supports the VSC-A safety applications. The conformant version of the message uses the Distinguished Encoding Rules to encode the message for over-the-air transmission, as required by J2735.
In addition to the effort to develop and standardize the BSM, the VSC-A Team also initiated a new SAE DSRC standards project: BSM Minimum Performance Requirements (working title). This standard will augment SAE J2735 to define rules necessary for effective V2V safety communication interoperability (e.g., minimum message rate, minimum data accuracy, etc.).
6.3 Standards Coordination and Validation
The VSC-A Team undertook a variety of activities related to the IEEE 1609.x and IEEE 802.11p standards shown in Figure 14. Several of the most significant are summarized in this section.
33

VSC-A Final Report
6.3.1 Multi-Channel Operation and IEEE 1609.3 and 1609.4
The IEEE 1609.4 draft standard defines a channel switching mechanism based on time division. Each 100 ms period is segmented into a Control Channel (CCH) interval and a Service Channel (SCH) interval. The default division is 50 ms for each interval, including short guard intervals at the start of each to allow for clock differences and radio transitions. Under this scheme, BSMs and other important messages, including service advertisements, are exchanged on the CCH (Channel 178) during the CCH interval. During the SCH interval, a vehicle may tune its DSRC radio away from the CCH to any of the SCHs to, for example, access a service of interest. The time division defined by IEEE 1609.4 imposes a significant capacity constraint on V2V safety communication because the CCH is available for the dependable exchange of safety messages less than half the time.
Under the VSC-A Project, alternative approaches to exchanging V2V safety messages were researched. The investigation considered a number of factors, including the co-existence of single-radio and dual-radio vehicles, the protocol information exchanged among vehicles in the lower layer headers, and the fact that the Federal Communications Commission (FCC) has designated DSRC Channel 172 for safety communication. More information about the scope and findings of the multi-channel research is provided in Appendix D-2 to this report.
One goal of the research was to avoid the capacity constraint that time division imposes by defining one channel where safety messages can be exchanged any time (i.e., an “always-on” safety channel). Depending on the approach, the always-on safety channel could be the CCH or it could be one of the SCHs (e.g., Channel 172). An approach that allows most, if not all, vehicles to use the always-on safety channel most, if not all, of the time is attractive and warrants further consideration.
After considering and rejecting a number of approaches, the research identified three candidates that offer enhanced safety communication performance compared to 1609.4 channel switching. Some of these require the exchange of reception capability information among neighboring vehicles. The IEEE 1609 WG agreed to a VSC-A proposal [7] to allocate 2 protocol bits in the IEEE 1609.3 Networking Services Standard to convey that information. These bits are handled in a sub-layer of the IEEE 1609 protocol stack dedicated to safety message processing. Including these bits in IEEE 1609.3 now will improve the chance that vehicles conformant with this version will also be conformant with an enhanced channel switching scheme for safety communication in the future should one be necessary. Details of the three approaches are available in Appendix D-2.
34

VSC-A Final Report
DSRC WAVE Short Message
Protocol (1609.3)
Safety Message
(SAE 2735)
WSMP-S (1609.3)
Figure 16: WAVE Short Message Protocol Safety Supplement between BSM and WSMP
In order to support the VSC-A request, the IEEE 1609 WG modified the protocol stack with the insertion of a new “WAVE Short Message Protocol Safety Supplement” (WSMP-S), as illustrated in Figure 16. In the transmitter, the WSMP-S inserts a new WSMP-S header; and in the receiver, this header is processed. The minimum WSMP-S header is 1 byte, but it can be extended. The 2 bits requested by VSC-A are in the WSMP-S header byte. The remaining bits will be reserved for safety-message-related functions that may be defined in the future. The WSMP-S header will not be added to WAVE Short Messages that do not carry safety payloads. The four mutually exclusive states represented by the 2 bits, as requested by VSC-A, are:
Sender requires others' safety messages to be sent on the CCH during the CCH interval
Sender requires others' safety messages to be sent on the CCH, but has no time interval constraint
Sender is capable of receiving others' safety messages on a designated safety channel that is distinct from the CCH (in the US this is Channel 172)
Sender is not capable of processing received safety messages (all other categories above implicitly assume sender can process safety messages)
6.3.2 Synchronized Collision Issue with IEEE 1609.4 Channel Switching
The VSC-A Team has observed, both in simulations and with vehicle testing, a phenomenon referred to as “synchronized collisions.” This can occur when packet transmissions are requested from the application layer but are delayed to wait for the proper transmission interval (CCH interval or SCH interval). If a number of vehicles have packets waiting for transmission when an interval begins, the packets face a relatively high probability of colliding with each other. The impact on communications performance can be severe. The effect is made worse if, due to periodic broadcasting, the
35

VSC-A Final Report
packets experiencing elevated collision probability come from the same subset of vehicles each 100 ms.
Avoiding synchronized collisions is not difficult conceptually. One general approach involves making channel interval boundaries observable above the MAC sub-layer so that a packet is placed in the transmission queue only during the interval in which it is intended to be sent. Three countermeasures for synchronized collisions have been tested and verified in the VSC-A test bed. Furthermore, there is no need for a single standardized countermeasure. What is important is that vehicles recognize the existence of the problem, understand the magnitude of the performance degradation that can result if it is allowed to persist, and take some local action to avoid it.
To that end, the VSC-A Team drafted an informative annex for the 1609.4 Standard called “Channel congestion phenomenon following a channel switch” [8]. The team requested, and the IEEE 1609 WG agreed, to include this annex in the next published version of IEEE 1609.4. The annex goes into some detail to explain the source of the problem and impress upon the reader the importance of taking steps to avoid it. The annex does not prescribe a specific solution, but it does note that exposing higher layers to channel interval timing can be useful.
6.3.3 Message Signature Key Length and IEEE 1609.2
The IEEE 1609.2 Security Services Standard defines two variants of the ECDSA for authenticating messages. One variant uses a key length of 224 bits while the other uses a key length of 256 bits. The key length of a digital signature provides a fundamental trade-off between processing burden and ease of attack. The 256-key variant requires more processing and more OTA bandwidth but is more difficult to break. The processing burden of ECDSA increases cubically with key length, therefore, a 256-bit key requires approximately 50 percent more processing than a 224-bit key. The VSC-A Team studied the appropriate key length to apply to V2V safety messages. The team determined that due to the relatively short validity time of a BSM, (i.e., on the order of a few seconds or less), the protection provided by ECDSA-224 is entirely adequate to prevent forgery by an attacker who does not have access to a valid certificate. For messages that have longer validity times (e.g., a Security Certificate), ECDSA-256 is more appropriate.
On the basis of this study, the VSC-A Team proposed to the IEEE 1609 WG that the next revision of the 1609.2 Standard mandates the use of ECDSA-224 for messages that have a BSM payload [9]. The 1609 WG accepted this proposal and the technical merit of the argument behind it. In the long term, the 1609 WG expects this requirement to be moved to a different standard under the authority of the organization to which the Provider Service Identifier (PSID) for BSMs is registered. That organization is not yet determined.
6.3.4 Validation of IEEE 802.11p MAC
The IEEE 802.11 Wireless Local Area Network [10] standard defines MAC and PHY layer protocols. DSRC relies on an amendment to this standard, designated IEEE 802.11p. The 802.11p amendment modifies both the MAC and PHY protocols. Members of the VSC-A Team formally represented the VSC2 consortium in the IEEE 802.11 WG, obtaining voting privileges and participating actively in task group meetings and WG ballots. The team made significant contributions to the development of the 802.11p
36
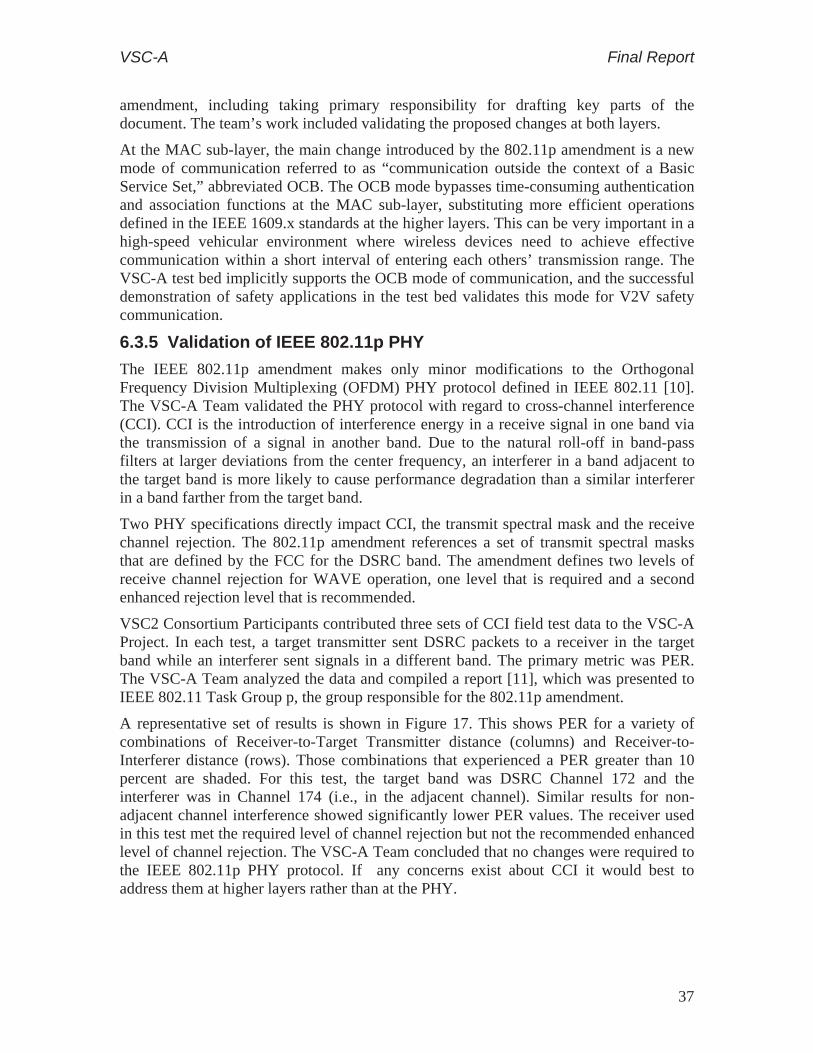
VSC-A Final Report
amendment, including taking primary responsibility for drafting key parts of the document. The team’s work included validating the proposed changes at both layers.
At the MAC sub-layer, the main change introduced by the 802.11p amendment is a new mode of communication referred to as “communication outside the context of a Basic Service Set,” abbreviated OCB. The OCB mode bypasses time-consuming authentication and association functions at the MAC sub-layer, substituting more efficient operations defined in the IEEE 1609.x standards at the higher layers. This can be very important in a high-speed vehicular environment where wireless devices need to achieve effective communication within a short interval of entering each others’ transmission range. The VSC-A test bed implicitly supports the OCB mode of communication, and the successful demonstration of safety applications in the test bed validates this mode for V2V safety communication.
6.3.5 Validation of IEEE 802.11p PHY
The IEEE 802.11p amendment makes only minor modifications to the Orthogonal Frequency Division Multiplexing (OFDM) PHY protocol defined in IEEE 802.11 [10]. The VSC-A Team validated the PHY protocol with regard to cross-channel interference (CCI). CCI is the introduction of interference energy in a receive signal in one band via the transmission of a signal in another band. Due to the natural roll-off in band-pass filters at larger deviations from the center frequency, an interferer in a band adjacent to the target band is more likely to cause performance degradation than a similar interferer in a band farther from the target band.
Two PHY specifications directly impact CCI, the transmit spectral mask and the receive channel rejection. The 802.11p amendment references a set of transmit spectral masks that are defined by the FCC for the DSRC band. The amendment defines two levels of receive channel rejection for WAVE operation, one level that is required and a second enhanced rejection level that is recommended.
VSC2 Consortium Participants contributed three sets of CCI field test data to the VSC-A Project. In each test, a target transmitter sent DSRC packets to a receiver in the target band while an interferer sent signals in a different band. The primary metric was PER. The VSC-A Team analyzed the data and compiled a report [11], which was presented to IEEE 802.11 Task Group p, the group responsible for the 802.11p amendment.
A representative set of results is shown in Figure 17. This shows PER for a variety of combinations of Receiver-to-Target Transmitter distance (columns) and Receiver-to-Interferer distance (rows). Those combinations that experienced a PER greater than 10 percent are shaded. For this test, the target band was DSRC Channel 172 and the interferer was in Channel 174 (i.e., in the adjacent channel). Similar results for non-adjacent channel interference showed significantly lower PER values. The receiver used in this test met the required level of channel rejection but not the recommended enhanced level of channel rejection. The VSC-A Team concluded that no changes were required to the IEEE 802.11p PHY protocol. If any concerns exist about CCI it would best to address them at higher layers rather than at the PHY.
37

VSC-A Final Report
RX
-Interferer Distance (m
eters)
60 0%
40 0% 10%
30 0% 1% 80%
25 0.5% 80% 99%
20 40% 90% 100%
15 0% 1% 40% 92% 95% 100%
12.5 0.10% 1.50% 70% 98% 100% 100%
10 0.90% 35% 99% 100% 100% 100%
7.5 15% 95% 100% 100% 100% 100%
5 55% 98% 100% 100% 100% 100%
2.5 95% 100% 100% 100% 100% 100%
Legend:
PER >10%
15 25 50 100 150 200
RX-TX Distance (meters)
Figure 17: VSC-A CCI Test Results Presented to IEEE 802.11 Task Group P
7 Relative Vehicle Positioning
7.1 Overview
The Positioning Technology development task of the VSC-A Project focused on three main goals. The first was to design, build, and test a prototype positioning system that was capable of meeting the VSC-A relative positioning requirements which, depending on the safety application, require either road level “which road” or lane level “which lane” relative positioning accuracy. The second was to standardize the common components of the system, in particular the OTA data sharing. The third goal was to conduct an extensive performance analysis of the prototype system, via multiple means, and identify paths for future enhancement of the system.
Table 7 below indicates for each of the safety applications if they require “which lane” or “which road” relative positioning accuracy. Refer to [15] for an analysis on the “which lane” and “which road” positioning requirements.
38

VSC-A Final Report
Table 7: VSC-A Safety Application Minimum Relative Positioning Requirements
Safety Application Which Road Which Lane
Emergency Electronic Brake Lights
Forward Collision Warning
Blind Spot Warning+Lane Change Warning
Do Not Pass Warning
Intersection Movement Assist
Control Loss Warning
7.2 Test Bed Positioning Development
GPS was identified as the most viable core technology for the prototype test bed system. The system performance goals were set as Which-Road and Which-Lane relative accuracy levels which correspond to better than 5 m and better than 1.5 m relative positioning accuracy. The system was designed such that two widely used GPS relative positioning methods could be evaluated with the VSC-A safety applications using Commercial Off the Shelf (COTS) HW and SW.
7.2.1 Implementation
Through team expertise and industry input, the VSC-A Team identified the GPS RTK positioning technique, which involves sharing the raw satellite information between vehicles, as a potential technical solution for the VSC-A relative positioning needs. This was in addition to utilizing the straightforward Latitude/Longitude-based SP relative positioning (i.e., differencing individual vehicle positions) such that the team could use both methods for performance evaluation purposes. The VSC-A Team developed the positioning algorithms needed for the SP method of relative positioning. For the RTK method implementation, the VSC-A Team selected a RTK engine from a leading GPS system developer and the system was implemented in a Precise Relative Positioning Module within the VSC-A System test bed. In the initial evaluations, the VSC-A Team identified necessary customizations required for the COTS RTK SW to meet the needs of the VSC-A test bed.
The VSC-A precise Relative Positioning Module was fully integrated with the VSC-A test bed. The module was implemented on a personal computer (PC) which connected to the WSU through an Ethernet interface. Figure 18 is an illustration of the VSC-A Relative Positioning Module along with the rest of the test bed modules that play a role in the V2V relative positioning solution.
39

VSC-A Final Report
Figure 18: VSC-A Test Bed Relative Positioning System Core Modules
The main components of the VSC-A Relative Positioning System are the GPS Receiver and the Relative Positioning Module. The GPS Receiver provides all the information required by the VSC-A safety applications including timing information. The Relative Positioning Module takes in GPS raw data in RTCM v3.0 format from the local GPS Receiver and from all RV rovers to generate precise relative positioning vectors to other vehicles (shown as RTK Output). As shown in Figure 18, the system was designed such that the same system is capable of supporting data from a Cooperative Intersection Collision Avoidance System for Violations (CICAS-V)-like infrastructure system that broadcasts local DGPS corrections.
7.2.2 OTA Support
As a part of the development process, the VSC-A Team successfully incorporated the required OTA data elements and frames into the current revision of the SAE J2735 standard. This includes sharing positioning data elements such as position latitude, longitude, and elevation and GPS raw data messages in RTCM v3.0 format. As is, this revision of SAE J2735 fully supports the OTA needs of both positioning methods implemented in the VSC-A positioning system. Please refer to Section 6.2 for a discussion on the SAE J2735 OTA message format.
7.2.3 VSC-A Positioning Sub-System Performance
The VSC-A Team designed and executed a set of positioning subsystem level tests of the RTK software and the SP relative positioning approach, about mid-way through the project, to verify support of all the safety applications’ positioning needs. The tests were also intended to provide data for a cost/benefit analysis to assist in determining if using RTK SW provides sufficient gains considering the additional OTA data sharing requirements and on-board processing requirements needed for a RTK relative positioning system. Two or more vehicles were involved in several test scenarios. No applications were running and using the RTK software. The calculated RTK solution and the raw GPS data were logged during the tests. Test scenarios were designed to cover different traffic density (variability of reflection sources/GPS noise), street types, operating speeds, tree cover, sky visibility variations (i.e., one vehicle driving next to a
40

VSC-A Final Report
semi), and vehicles operating in different GPS modes such as standalone GPS, Wide Area Augmentation System (WAAS)-enabled GPS, and CICAS-V-enabled GPS.
The VSC-A Team was able to illustrate the pure accuracy benefits of using RTK-based SW as compared to using SP vehicle location differentiation. An illustration is provided in Figure 19. In the test scenario, two VSC-A test vehicles were driven in the same lane on a straight road such that the across distance between them was maintained close to zero. On-board systems were configured to estimate the across distance between vehicles using the RTK SW and using SP differentiation. The top plot in Figure 19 shows the comparison of the output using both relative positioning approaches. The team also investigated the relationship between across distance output and the GPS satellites each vehicle was using. In the case of this illustration, the output from the SP method was found to be adversely influenced by differences in the satellites visible to each vehicle whereas the RTK method was not influenced to the same extent.
Figure 19: Comparison of Between-Vehicle Across Distance
The VSC-A Team also performed field tests with multiple test vehicles with various VSC-A safety applications running using the system output. Some of these tests were conducted in a controlled environment in a test track with up to four VSC-A vehicles. An illustration of one such multiple vehicle test is given in Figure 20 through Figure 22. In this test, four VSC-A test vehicles were driven in a three-lane roadway. One vehicle was selected as the host and one target vehicle was driven in the same lane as the HV. The other two target vehicles were driven in the adjacent lane formation with the HV. This vehicle formation is illustrated in Figure 20.
41

Lane 1Target 1
Host Lane 2
Lane 3
Target 2 Target 3
VSC-A Final Report
Figure 20: Formation of Host Vehicle and Target Vehicles
The VSC-A system in the HV was configured to output between vehicle Across (Lateral) distance and Along (Longitudinal) distance using both RTK and SP methods. Note that for the VSC-A applications, the across distance is generally more important than the along distance with the accuracy of the calculation varying depending on if the application requires “which road” or “which lane” relative positioning (see Table 7). Figure 21 and Figure 22 show the system output for each target vehicle using the color codes assigned to each target vehicle in Figure 20. In each plot the RTK output is shown with a solid line and the output from the SP method is shown using markers. The VSC-A Team was able to show that the SP method may introduce more noise and potential bias into these estimates whereas the RTK method could potentially improve the performance of the VSC-A Relative Positioning System by minimizing such vulnerabilities.
Figure 21: Between-Vehicle across Distances in Multiple Vehicle Test Run (Solid Line: RTK Method Other: Single Point Method)
42

VSC-A Final Report
Figure 22: Between-Vehicle along Distances in Multiple Vehicle Test Run (Solid Line: RTK Method Other: Single Point Method)
The application performance was monitored in all VSC-A tests to verify that the relative-positioning module performs according to the design requirements and the needs of VSC-A safety applications. Data recorded from these tests were analyzed in post-mission to verify the performance of the VSC-A Relative Positioning Module against reference system performance, see Appendix E-1.
7.2.4 Reference System
This section provides a brief summary of the results from GPS reference testing that was conducted to measure the relative positioning accuracy of the OBE system. The tests described here are a subset of the evaluations conducted during both the OTP testing at the TRC test track in East Liberty, Ohio and similar tests conducted post-OTP towards the end of the project. A comparison of the tests reflects the improvements made to the system since the TRC tests.
7.2.4.1 Test Method Data was collected on two vehicles each equipped with the same set-up, as shown in Figure 23 below. A common GPS antenna was split between the WSU’s GPS receiver and the reference system to ensure each unit was viewing the same satellites. Testing was conducted in an open sky environment. The reference system consisted of a high sample rate (100Hz) dual-frequency (L1/L2) GPS/Inertial Navigation System (INS) system with a radio transceiver used to receive base station correction signals to achieve centimeter-level position accuracy. Data was collected from both the WSU and the reference system
43
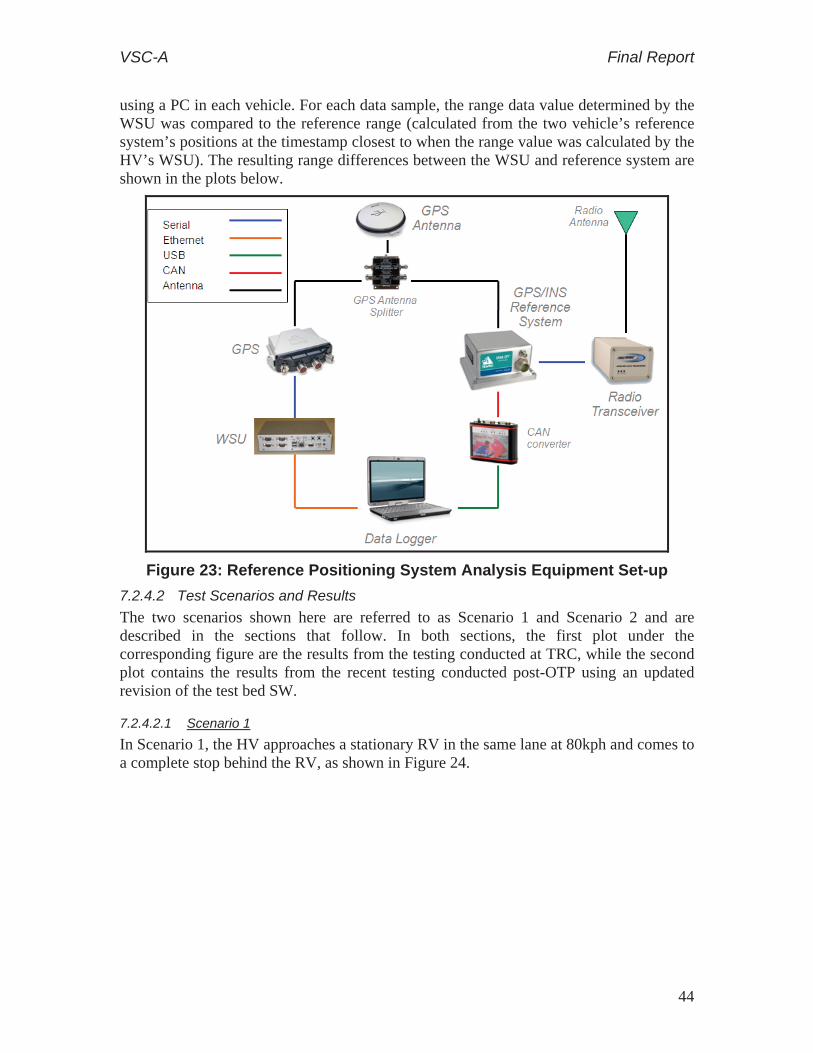
VSC-A Final Report
using a PC in each vehicle. For each data sample, the range data value determined by the WSU was compared to the reference range (calculated from the two vehicle’s reference system’s positions at the timestamp closest to when the range value was calculated by the HV’s WSU). The resulting range differences between the WSU and reference system are shown in the plots below.
Figure 23: Reference Positioning System Analysis Equipment Set-up
7.2.4.2 Test Scenarios and Results The two scenarios shown here are referred to as Scenario 1 and Scenario 2 and are described in the sections that follow. In both sections, the first plot under the corresponding figure are the results from the testing conducted at TRC, while the second plot contains the results from the recent testing conducted post-OTP using an updated revision of the test bed SW.
7.2.4.2.1 Scenario 1 In Scenario 1, the HV approaches a stationary RV in the same lane at 80kph and comes to a complete stop behind the RV, as shown in Figure 24.
44

VSC-A Final Report
Figure 24: Scenario 1 Reference Test Diagram
The plots in Figure 25 and Figure 26 show the SP range difference versus sample time for Scenario 1. As shown in Figure 25, for the SW used during the OTP testing, the WSU range difference from reference exceeded 6m during the test and was generally on the order of several meters. Conversely, Figure 26 shows that when the updated revision of the test bed SW was used post-OTP, the magnitudes of range differences achieved were less than 15cm over the duration of the test.
Scenario 1: Range Difference from Reference (v2.1.1)
Sample Time (s)
Figure 25: Scenario 1 OTP Reference Test Results
10 15 20 25 30 35 40 45-1
0
1
2
3
4
5
6
7
Ran
ge D
iffer
ence
(m
)
45

VSC-A Final Report
0 5 10 15 20 25 30 35-0.1
-0.05
0
0.05
0.1
0.15 Scenario 1: Range Difference from Reference (v2.7)
Ran
ge D
iffer
ence
(m
)
Sample Time (s)
Figure 26: Scenario 1 Post-OTP Reference Test Results
7.2.4.2.2 Scenario 2 In Scenario 2, the HV approaches an oncoming RV in the adjacent lane, as shown in Figure 27. The vehicles start with a separation distance of over 500m. They then accelerate from a stationary position to 50kph and stop after they are again about 500m past one another.
Figure 27: Scenario 2 Reference Test Diagram
The plots in Figure 28 and Figure 29 show the range difference versus sample time for Scenario 2. As shown in Figure 28, for the SW used during the OTP testing, the magnitudes of range difference values spike up to 10m during the test and generally exceeded 5m. When using the updated revision of the test bed SW post-OTP, the magnitudes of range differences are only around 20cm over the duration of the test, as shown in Figure 29.
46

VSC-A Final Report
0 10 20 30 40 50 60 70-15
-10
-5
0
5
10
15Scenario 2: Range Difference from Reference (v2.1.1)
Ran
ge D
iffer
ence
(m
)
Sample Time (s)
Figure 28: Scenario 2 OTP Reference Test Results
0 5 10 15 20 25 30 35 40-0.4
-0.3
-0.2
-0.1
0
0.1
0.2
0.3 Scenario 2: Range Difference from Reference (v2.7)
Sample Time (s)
Ran
ge D
iffer
ence
(m
)
Figure 29: Scenario 2 Post-OTP Reference Test Results
7.2.4.3 Discussion The results show that improvements to the positional accuracy were made with later releases of the SW. The main improvements responsible for the increase in accuracy were the addition of extrapolation routines within the TC module and improved system timing
47

VSC-A Final Report
scheme. The extrapolation routine mitigates the errors caused by both system latencies and sample rates by estimating the position of the vehicle at current time. It also eliminated spikes in error caused by time-delayed misalignment of HV and RV position data. All of this is possible in this system because the OTA data contains the transmitter’s position that is time stamped with a GPS clock (i.e., a universal clock that is also available to the receiver). Another SW improvement, improved process timing schemes, also contributed to reducing system latencies and added to the overall system positioning accuracy. The results from these tests clearly indicated that a high level of performance can be achieved, especially when methods to improve positional accuracy, such as position extrapolation based on a global clock (GPS time), are used.
7.3 GPS Availability Study
Availability of GPS service is a critical requirement for the proper functionality of the VSC-A Positioning System. In addition, operating environment (i.e., sky visibility), availability of GPS augmentations, OTA support, and a host of other factors can influence the performance of the VSC-A Positioning System. The VSC-A Team formulated a GPS Service Availability Study to investigate these performance dependencies of the VSC-A Positioning System. The study, which included a literature review (see Appendix E-2), also included:
An overview of GPS constellation, GPS Signal Structure, and an Overview of GPS Modernization
Outline of GPS Error Sources and Characteristics
Parameters that Impact GPS Performance
Reference Stations and Reference Station Networks
Review of Integration of Global Navigation Satellite System (GNSS) with Inertial Navigation
Impact of Future GNSS and GPS Modernization
The study also included a two-phased field study that included up to 50 hours of field data from two instrumented vehicles concluded in late 2009.
7.3.1 Field Data Collection
The field data collection was conducted as a two-stage process. The Pilot/Phase I of the field data collection included up to 15 hours of field data. The objectives of this phase were:
Classify/identify typical vehicle operation environments and scenarios based on GPS service availability as applicable to VSC Applications
Define bounds for declaring GPS service available/unavailable and appropriate performance measures
Define field test scenarios to cover different GPS environments
Develop two test vehicles with ground-truthing capability
48

VSC-A Final Report
Execute the pilot field survey
Analyze the pilot data and document the results
Define the scope of the Phase II
The Phase II of the study included up to 40 hours of additional field data collection such that a total of 50 hours of data was included in the final study analysis. Analysis procedures validated in Phase I of the study were used for the Phase II analysis. Major work items of the Phase II of the study were:
Make necessary changes to the work plan based on Pilot/Phase I Study
Analyze the Phase II data and document the results
7.3.2 Data Analysis and Reports
The main focus of this study was to do a comparative performance evaluation of the two relative positioning methods implemented in the VSC-A Positioning System (i.e., RTK and SP relative positioning). Of particular interest were the achievable accuracy and the availability of solutions using different GPS receivers and diverse driving environments by means of the two processing methods implemented in the VSC-A Positioning System. Key variables investigated in the analysis included:
Impact of positioning method used (i.e., RTK or SP)
Quality of GPS HW/SW used
Benefits of using WAAS
Size of the GPS constellation (current 31 satellites as compared to guaranteed 24)
Performance under various operational environments (i.e., open sky, urban canyons, etc.)
In terms of system operation, two relative positioning operational scenarios were investigated. The first major focus area, V2V, which was considered in depth, considered only receivers included in each vehicle. The data from each vehicle was shared to estimate the position of one vehicle relative to the other. Full reports of the GPS Availability Study are presented in Appendix E-3.
7.3.3 Study Results
Two GPS receiver types were used in the study. One of them was a high-quality, single– frequency, GPS receiver (Type A). The second receiver was a low-cost, automotive-grade receiver (Type B). Study conclusions and recommendations were based on the observations from these devices.
The proportion of data collection time spent in each of the test environments was designed to represent the road use of an average driver as given in the Federal Highway Administration (FHWA) publication on Our Nation’s Highways [FHWA 2008]. Major conclusions of the study were as follows:
49

VSC-A Final Report
1. Full availability percentages with errors less than 1.5 m in both Along and Across track using the RTK method involving one or two low-cost receivers are lower than those using two high-quality receivers by up to 20 Percent
2. The best availability percentages with errors less than 1.5 m, namely 90 percent or slightly more, occur with pairs of high-quality receivers in either RTK or SP mode or with pairs of low-cost receivers, both with WAAS or both with no WAAS, in SP mode
3. Full availability percentages with errors less than 1.5 m using the SP method with pairs of identical receivers is significantly better than corresponding values using pairs of mixed receivers
4. At the 5 m accuracy level, the SP method for each of the considered receiver combinations has an availability level of at least 95 percent. The detrimental effects of receiver non-homogeneity are not observable at this lower accuracy.
5. Low-cost receiver pairs with WAAS generally perform the same as those with no WAAS in the SP mode
6. Mixing the low-cost WAAS and no WAAS receivers decreased availability
7. The difference in availability between the 24-satellite nominal constellation and the 31-satellite constellation available during the August 2009 tests was negligible using low-cost receivers in SP mode
8. Data gap statistics for the roughly 45 hours of collected data were generated. A gap in the data is defined as a time interval when no solution is available due to the lack of measurements. Most gaps are less than 15 s and have average durations of 2 s to 7 s. Gap statistics are dependent upon the mix of environments used in the data collection; the majority of gaps occurred in the deep urban environment, which accounted for less than 4 percent of the total testing duration.
9. Finally, data gaps for RTK generally occur more often and last longer than those for SP using the same receiver combinations. While it was not possible to determine the cause for each individual RTK data gap, the DSRC radio link between the vehicles was found to be operating properly 99.8 percent of the time suggesting that the majority of gaps were due to insufficient common measurements from the receivers after rejection.
Details of the data collection, analysis, and additional results are available under Appendix E-3.
7.3.4 Relative Positioning Conclusions
Based on the GPS Availability Study results and the extensive testing of the positioning sub-system of the VSC-A test bed, the following conclusions were made:
1. The SP method (exchanging Latitude and Longitude between vehicles and differencing their position), when used in conjunction with high-quality receivers, provided the required positioning performance required by the VSC-A safety application
50

VSC-A Final Report
2. The same SP method when used in conjunction with automotive grade (low-cost) receivers also provided the required positioning performance in the majority of the tested situations when the same receivers are used in each vehicle
3. In the mixed-mode, referring to a mismatch of GPS units between the two vehicles, the VSC-A safety applications still perform at a high level, although the instantaneous relative position between the two vehicles is degraded when compared to the previous case
4. In a few reported instances, where the SP method was being used in the mixed-mode configuration, some relative positional biases in the order of 3 to 4 meters were observed
5. In order to achieve a low-cost solution for the V2V positioning problem, these mixed-mode anomalies need to be further investigated and understood to determine whether this is truly a SP method limitation or a GPS brand-specific limitation. A solution to this issue needs to be developed and it may include specification of minimum V2V relative positioning performance requirements for full system and inter-OEM interoperability.
6. In terms of pure accuracy, the RTK approach provides a better approach to the V2V relative positioning problem than the SP method that is also GPS-unit independent
7. However, the RTK approach also comes at a higher cost both from the implementation and processing viewpoint (RTK engine for a large number of vehicles) but also from the channel bandwidth perspective
8. Nevertheless, the data elements required for the RTK approach have been standardized by the VSC-A Team for potential future use
8 Security
8.1 Overview
Data security and privacy are crucial aspects when considering deployment of V2V safety communications technology. Therefore, security issues were addressed in the VSC Project [12] that was performed by the Vehicle Safety Communication Consortium (VSCC) under a cooperative agreement with the USDOT. In that project, a protocol for authenticating safety broadcast messages was defined. The protocol is based on digital signatures over elliptic curves and requires an existing Public Key Infrastructure (PKI). This work strongly influenced the DSRC security standards work and was incorporated into the IEEE 1609.2 [12] Standard, which is currently in trial use.
The members of the VSC2 Consortium identified some concerns of the previously defined security scheme when used for V2V safety applications. Those concerns focused primarily on the following issues:
Computational complexity and, therefore, cost that might hinder market penetration
Latency due to security processing overhead
51

VSC-A Final Report
Per-message OTA security overhead
Privacy
Those concerns were the starting point for extending the previous work and implementing alternative security protocols for broadcast message authentication1. The desired goals or characteristics for such a protocol(s) were defined as:
High efficiency in both computational complexity and OTA overhead
Low latency processing overhead
Inclusion of a privacy-preserving mechanism
The security protocol work consisted of the following main tasks:
1. Definition and analysis of potential security protocols
2. Implementation of the potential security protocols in a test bed environment
3. Evaluation of the identified security protocols by using extensive network simulations
8.2 Security Protocols and Implementation Results
8.2.1 Overview
The VSC-A Team defined three potential security protocols to support the selected V2V safety applications:
1. ECDSA VoD - This approach is application-driven and selectively verifies messages according to the determined safety threat level of that message2
2. Timed Efficient Stream Loss-tolerant Authentication (TESLA) - This approach incorporates very efficient symmetric cryptographic mechanisms to speed-up verification. This comes at the cost of introducing the requirement for accurate time synchronization as well as introducing additional latencies because message authentication keys must be received prior to successful message verification.
3. TESLA and Digital Signature (TADS) - This approach extends TESLA by including an ECDSA digital signature in every message. It is essentially a hybrid between the two previous ones and, therefore, includes advantages from each approach. However, it comes at the cost of additional OTA overhead (i.e., larger message).
The details of the protocols are described in detail Appendix F.
ECDSA VoD is a sophisticated application-based filter approach aimed at reducing the computational burden of any authentication protocol. In general, VoD can be applied to the IEEE 1609.2 ECDSA, TESLA, or TADS protocol. In this project, VoD was only
1 Note that in literature, often the term multicast source authentication or data origin authentication is used.
2 Note that the VoD approach can be applied not only to ECDSA but also to any authentication protocol.
52

VSC-A Final Report
applied to ECDSA, which is computationally very demanding. It was shown that this approach is able to significantly reduce the computational load of a verify-then-process ECDSA protocol. The computational complexity of TESLA is less than the complexity of ECDSA and TADS, However, the implementation of TESLA proved to be challenging due to its critical time dependencies and conditions caused by the underlying network layer3. TADS leverages the advantages of digital signatures and TESLA but introduces additional OTA bandwidth. All of these schemes provide secure authentication. A privacy protection mechanism, as well as a certificate broadcast mechanism, was developed to complement all three schemes.
8.2.2 Implementation and Results
8.2.2.1 Authentication Protocols The three potential protocols, as well as the IEEE 1609.2 ECDSA security protocol, were implemented on a car-PC (a standard PC running at 2.4 GHz) and also on-board the WSU (400 MHz processor). The implementation for the WSU utilized platform–specific, assembly, optimized, cryptographic operations to speed up the complex ECDSA operations. Two modes of operation were implemented for TESLA and TADS in order to optimize performance. In particular, a piggyback TESLA key disclosure mode (the key needed to validate the current message is appended to the subsequent OTA message) and a separate TESLA key disclosure mode were implemented. These modes provide a trade-off for OTA bandwidth overhead and overall latency.
Performance measurements of the Security Module (SM) running on the WSU indicated that the conventional IEEE 1609.2 ECDSA verify-then-process protocol is too resource demanding to run in SW. This even holds true for the powerful car-PC if several vehicles exchange safety messages simultaneously. The performance measurements showed that both TESLA and TADS are highly computationally efficient. The TESLA and TADS piggyback protocols add delay when compared to IEEE 1609.2 ECDSA while the TESLA and TADS with separate key disclosure protocols also add OTA bandwidth overhead. Performance numbers for the SM running on-board of the WSU are presented in Table 8.
Table 8: Security Protocol Performance
PerformanceMetric
IEEE1609.2
ECDSA TESLA TADS
Authentication generation (crypto only on idle system)
4.9 ms (ECC-224) / 6.6 ms (ECC-256)
0.3 ms 5.2 ms (ECC-224) / 7.3 ms (ECC-256)
Authentication generation*
6.6 ms (ECC-256)
0.6 ms 7.6 ms (ECC-256)
3 In particular, channel switching, as defined in IEEE 1609.4, resulted in a more cumbersome implementation for TESLA.
53

VSC-A Final Report
PerformanceMetric
IEEE1609.2
ECDSA TESLA TADS
Authentication verification (crypto only on idle system)
17.8 ms (ECC-224) / 26.5 ms (ECC-256)
0.3 ms 0.3 ms (TESLA) / 26.5 ms (ECDSA-256)
Authentication verification*
28.5 ms (ECC-256)
0.4 ms 2 ms (average)
(0.1% ECDSA, 99.9% TESLA)
CPU Load for 2 WSUs at 10 messages per second: Signing / Signing + Verifying*
8% / 34% 1% / 2%
8% / 10%
(0.1% ECDSA, 99.9% TESLA verifications)
Latency: Avg. (no channel switching)*
36 ms
piggy-back separate piggy-
back separate
104 ms 46 ms 110 ms 48 ms
Average OTA packet size (send certificate with each 3rd message)
115 bytes 102
bytes 167
bytes 141 bytes
210 bytes
*CPU load and latency was measured on a system that runs the safety applications
8.2.2.2 Privacy Mechanism A simple privacy protection mechanism that provides a basic level of privacy was defined and implemented on the WSU. The algorithm simultaneously randomizes or changes all identifiers, including the certificate currently used by the SM, the cryptographic keys, the MAC address, the vehicle ID, the sender ID, and the sequential message counter at random time intervals instead of a fixed period. This random change of identifiers reduces the ability for vehicles to be easily tracked.
8.2.2.3 Certificate Broadcast Mechanism A general certificate broadcast mechanism was implemented. The implemented mechanism combined a periodic broadcast (e.g., twice per second) and a broadcast on demand. The latter one broadcasts the certificate after a new vehicle in transmission range was discovered. The general certificate broadcast model allowed for a minimum delay between the broadcast of certificates (e.g., if a new vehicle is discovered
54

VSC-A Final Report
immediately after a periodic certificate broadcast) and also allowed for introducing randomized broadcasts to reduce message collisions if all vehicles were to broadcast certificates at the same time. The implemented general certificate broadcast model is described in detail in Appendix F.
8.2.2.4 Protocol Testing All three protocol implementations were extensively tested in a variety of settings including tests in a lab environment, static, and moving (up to 14) vehicles. In these tests the WSU-integrated security protocol implementation was used.
ECDSA verify-then-process was in general computationally infeasible and was not tested. Instead, the focus was on testing and evaluating the ECDSA VoD implementation. The performance numbers per signature generation were equal to those of IEEE 1609.2 ECDSA. However, the CPU load of a receiving WSU was significantly lower due to the fact that only safety messages that result in a high threat level (e.g., one that would cause a warning to be issued to the driver) were verified. ECDSA VoD performed well with all VSC-A safety applications and was selected as the protocol to use for the OTP testing activities.
ECDSA VoD with a certificate attached to each message was designed to have zero verification error rate (VER).4 TESLA and TADS with separate key disclosure, which are both verify-then-process protocols, showed high verification error rates due to high packet losses. These loses resulted from increased OTA security overhead and the fact that two packets (the message to be verified and the separately disclosed authentication key) had to be received in order to successfully verify a message.
When running the security software onboard the WSU, in the presence of high packet losses, the implementation of TADS piggyback did not perform well with more than eight vehicles. This was due to the high computational load caused by TADS piggyback verifying messages that cannot be verified using TESLA, due to a lost key packet, with ECDSA. If many key packets are lost, the CPU load increases until the computational resources are exhausted. Analysis of this issue suggested that a more advanced scheduling strategy to process received packets is necessary to prevent the computational breakdown. However, this will be at the cost of a high verification error rate.
TESLA piggyback performed well in all settings but showed a minimum latency time of 100 ms compared to ECDSA. The reader should note that the delay depends on the OTA message update rate being used; in this case, it was set at 10 Hz. This is due to the key for a particular message being disclosed with the subsequent message and thus for any given message the subsequent message needs to be received before the message can verified.
Overall the implementation proved that a security protocol can be efficiently implemented in SW on-board an automotive grade platform, such as the WSU, if certain conditions, such as VoD filtering, are implemented.
8.2.2.5 Key Length The lifetime of V2V safety messages is expected to be rather short. Table 9, below, shows the estimated year until which signatures computed with ECDSA-224 versus
4 The VER is defined as the fraction of successfully verified packets over received packets.
55

VSC-A Final Report
ECDSA-256 key lengths are believed to be secure for high-security (financial) applications. These lifetimes were estimated by various institutions and security experts with a focus on long-term security at a high-security level. For the considered V2V safety application with a life-time of messages of a few seconds only, the VSC-A Team recommended to IEEE 1609.2 using ECDSA-224 to sign messages. VSC-A also recommended to use ECDSA-256 to issue certificates.
Table 9: Recommended Validity Periods for High Security Applications
Institution / Security Expert Calendar Year Validity ECDSA-224 ECDSA-256
NIST 2011-2030 > 2030 ECRYPT 2009-2028 2009-2038Lenstra/Verheul 2066 2090
Based on today’s HW, the running time for an attack in calendar year 2050 at $100 million U.S. is 1,000 years for ECDSA-224 and 100 million years for ECDSA-256.
8.3 Network Security Protocol Simulations
8.3.1 Overview
The limited number of DSRC radios used in the performance analysis of the SM implementation (i.e., fourteen radios) was insufficient for a realistic security protocol evaluation which considers a large-scale, real-world deployment. Therefore, the VSC-A Team decided to perform a set of network simulations to assist in evaluating the security protocols. The network simulations were performed by three independent teams. The three teams analyzed the performance of the ECDSA protocol (verify-then-process mode according to IEEE 1609.2), as well as TESLA and TADS in piggyback mode and with separate key disclosure. Note that ECDSA VoD was not simulated since ECDSA and ECDSA VoD do not differ at the network layer.
All teams based their simulation on the same parameter set provided by VSC-A. Fixed parameters were used for the network layer, application layer, and security protocol layer. The implementation, including queue management of incoming and outgoing messages, was implemented individually by the teams. All teams simulated an urban and a rural setting to account for a variety of typical traffic scenarios. By default, teams simulated a DSRC network compliant to IEEE 1609 with 20 dBm of transmission power and a 6 Mbps data rate communication channel. The OBU was assumed to hold at most 200 Kbyte of RAM for security short term data such as certificates. Certificates expired in the cache after one minute. The maximum lifetime of incoming messages was 500 ms. If a message was not verified within this time frame, the message was removed from the queue and a verification error was returned. As target platforms, both a 400 MHz PowerPC and a 2.4 GHz Intel PC CPU were simulated. The individual results of the teams are attached in Appendices G-1, G-2 and G-3.
8.3.2 Analysis and Results
The VSC-A Team analyzed the combined results from different perspectives and arrived at the following conclusions:
56

VSC-A Final Report
1. The packet reception rate (the fraction of received packets over sent packets) of ECDSA, TESLA piggyback, and TADS piggyback do not show significant differences. Therefore, using the VER, which measures the fraction of successfully verified packets to received packets, is a proper metric for OTA performance for these three security protocols.
2. TESLA and TADS with separate key disclosure showed a significantly poorer verification rate than the other three protocols. The additional packet required to disclose a TESLA key introduces OTA overhead (in terms of bytes) and an increased number of messages which could not be verified due to the fact that if either the message packet or TESLA key packet is lost OTA then the message cannot be verified. Therefore, TESLA and TADS with separate key disclosure are not viable options for a V2V safety protocol in the given context.
3. ECDSA verify-then-process is computationally infeasible on a 400 MHz platform. It is also computationally infeasible on a 2.4 GHz PC.
4. Before a vehicle is able to verify a message, it needs to have received a certificate from the sender. It was shown that the certificate distribution is not a source for significant verification error rates (i.e., there was no significant difference in VER whether certificates were broadcast once or twice every second). Depending on the vehicle traffic setting, broadcasting the certificate one to three times per second is sufficient to make sure that RVs receive a certificate in time.
8.4 Security Conclusions
This section summarizes the VSC-A security conclusions after evaluating the implementation and network simulation results.
The first observation is that TESLA and TADS with separate key disclosure perform significantly worse than the other protocols. This is due to the additional OTA overhead (in terms of bytes) required to transmit a separate TESLA key disclosure packet and an increased number of unverifiable messages due to a dependency between the consecutive message and key disclosure packets.
The second observation is that ECDSA verify-then-process is computationally infeasible on both the considered 400 MHz platform and the 2.4 GHz car-PC5. That leaves TESLA piggyback, TADS piggyback, as well as ECDSA VoD, as candidates.
The implementation and network simulation showed that TESLA piggyback introduces large worst-case latencies due to lost packets and comes with a best-case latency that corresponds to the heartbeat message frequency rate (e.g., a 10 Hz message rate means a best-case latency of 100 ms, a 5 Hz message rate used in a more congested channel scenario means a best-case latency of 200 ms). TESLA piggyback is considered inferior to TADS piggyback since TADS piggyback provides a better, best-case latency at negligible additional OTA overhead.
5 The only difference between the WSU and car-PC is the maximum number of participating vehicles when using ECDSA verify-then-process.
57

VSC-A Final Report
ECDSA VoD was implemented but not simulated. However, ECDSA verify-then-process was simulated, and it is possible to derive some conclusions based on the network simulation observations:
The ECDSA verify-then-process reception rate is not significantly different from the TESLA and TADS piggyback reception rate. Since the reception rate of ECDSA VoD is equal to ECDSA verify-then-process in terms of OTA performance, the ECDSA VoD reception rate is not significantly different to the TESLA and TADS piggyback reception rate.
Verification errors due to missing certificates are negligible. In the VSC-A test bed, ECDSA VoD was configured in such a way that certificates were attached to each message. Therefore, the VER of ECDSA VoD is zero since all received threat messages can be verified instantly (this is up to the application designer).
TADS piggyback can be viewed as a superset of ECDSA and TESLA. However, the implementation broke down in the test bed when testing with more than eight static vehicles and showed in general a much higher VER than ECDSA VoD. While an enhanced queuing mechanism would certainly improve the performance, it would still appear as if a selective verification approach (e.g., VoD) is required. A TADS VoD protocol was not defined nor implemented during this project. However, it may be considered as an option for the future.
Additionally, it was observed that ECDSA is the only verify-then-process mechanism available at this point (this would include TADS using only ECDSA signature verifications). Only in ECDSA can messages be verified right away without receiving a delayed authentication key. However, ECDSA verify-then-process is not computationally feasible on today’s automotive processors. If a safety application requires a reliable verify-then-process mechanism (i.e., a mechanism that verifies all messages with a VER of zero), then an advanced computing platform is required.
Finally, the VSC-A Team confirmed that ECDSA VoD functioned properly under all test conditions for the VSC-A safety applications.
8.5 Certificate Management Workshop
8.5.1 Overview
One of the crucial aspects of security for V2V safety, besides authentication, is the Security Certificate management architecture required for the PKI scheme. Because this area is important and necessary for any potential system deployment and since it hadn’t previously received the appropriate attention, it became apparent that a solution needs to be developed. The decision was made in the final stage of the VSC-A Project to add this topic to the scope of the work. To this effect, a team of V2V security experts was formed to collaborate with the VSC-A Team in order to define a set of potentially viable approaches. The team, at large, also evaluated, at a high level, advantages and disadvantages of each method, as well as identified the remaining challenges in the area and the recommended next steps.
58

VSC-A Final Report
A total of five security expert teams were contacted to participate in this effort. Each security team was first asked to independently develop a white paper focused on communication channel requirements and properties in the scope of misbehavior detection, vehicle revocation, privacy, and certificate and key distribution. Each of these white papers was provided to the VSC-A Team and is included in Appendices H-1 through H-5. The five teams along with the VSC-A Team took part in a security workshop organized late in the VSC-A Project. Based on their white papers, the security experts presented their analysis and views on communication channel properties and requirements as well as initial thoughts on metrics for security and privacy at the security workshop. The goal of the workshop was to discuss potential options for communication between the Certificate Authority (CA) and vehicles for V2V safety applications. A second goal was to discuss in more detail the metrics used in evaluating the options. Another goal of the workshop was to guide future research efforts in the V2V security certificate management area. The following sections will describe the results of the workshop.
8.5.2 Communication Channel Options
All workshop participants agreed that bi-directional communication between vehicles and the CA is required. The channel for communication between the vehicles and the CA can be different from the channel for communication between the CA and the vehicles. Four main options were identified during the workshop:
1. Road Side Equipment (RSE) - A network of RSE will be deployed. The CA will communicate to vehicles via RSEs, and vehicles will communicate to the CA via RSEs. Scenarios where access points are installed at special locations (e.g., gas stations) or where Wi-Fi access points are used (e.g., vehicle owners’ Wireless Local Area Network (WLAN) access points at home) are included. This type of communication may be supported by V2V communication. It may also be supported by a broadcast mechanism (e.g., satellite or FM radio broadcast) although this is less likely. Open questions here are how many RSEs are required, where the RSEs need to be located and which level of support is required by V2V communications.
2. Secondary Communication Channel - Some or all vehicles are equipped with a secondary communication device that provides a direct channel to the CA (e.g., a built-in cell phone). The vehicles that are equipped with a secondary communication device might bridge communication to other vehicles via V2V in-network communication. Communication might be supported by a broadcast mechanism, for example, via satellite. Open questions are which level of penetration of vehicles with secondary communication channel is required, which secondary communication channel is reasonable, does the device that provides a second communication channel have to be tamper resistant, and which level of support is required by V2V communications.
3. Special Vehicles - Some trusted vehicles (e.g., police cars) are equipped with a secondary communication device (built-in GSM, WiMAX, etc.) to upload data from the vehicle to the CA. This same communication channel might be used between the CA and the vehicles or a broadcast mechanism (e.g., satellite or FM
59

VSC-A Final Report
radio broadcast) might be used. Again, this communication might be supported by V2V communications. Open questions are how many special vehicles are required, which secondary communication device is reasonable and feasible, which vehicles are best suited to act as special vehicles (e.g., only police vehicles or all emergency vehicles), and which level of support is required by V2V communications. The type of special vehicle might need to be distinguished into police vehicles and others since police vehicles might provide a trustworthy physical environment where manipulation of the computing platform and sensor input is unlikely.
4. Periodic Connectivity - Vehicles have periodic connectivity to the CA, say once per year at an annual vehicle inspection. This same channel might be used to upload data from vehicles to the CA or a broadcast mechanism might be used. V2V communications might support this channel. Open questions are how often a connection is required and what further communication support (e.g., V2V and broadcast channel) is required.
The workshop participants agreed that these four options should not be considered separately but that they might be combined. For instance, special locations and special vehicles might be combined, and communication might even be supported by a small number of RSEs. Another aspect to consider is the potential evolution in time of the communication approach, which will depend on the market penetration rate of both RSEs and DSRC-equipped vehicles.
The following areas were also identified during the workshop as remaining issues that need special focus in order to complete any proposed solution:
Attack Model - One of the workshop conclusions is that the current attack model needs to be refined. It appears reasonable to distinguish between alert-based safety systems and control-based ones.
Misbehavior Detection - This includes detection of intentional misbehavior and detection of malfunctioning units. Detection of misbehavior is a crucial mechanism and the starting point of revocation. Detection here means the actual activity of recognizing misbehavior, which is then followed by a report mechanism (e.g., a voting scheme).
PKI Operations - This consists of management of certificates and keys. The certificate management includes installation of certificates and secret keys in vehicles, renewal of certificates and secret keys, reporting of misbehaving vehicles to the CA, and distribution of revocation information to the vehicles. Privacy should be considered as part of PKI operations. The privacy scheme will have a major impact on certificate management and distribution of keys. Finally, the architecture of the CA needs to be designed (e.g., one CA per state and an overseeing CA at the federal level), as well as a decision on who operates the CA will need to be made (e.g., USDOT, OEMs, or a third party).
Physical Security - The higher the physical security, the lower the likelihood is that keys will be extracted from a computing platform and used for an attack. Thereby, reducing the need for mitigation mechanisms and in turn reducing the
60

VSC-A Final Report
required capabilities of the communication channels between the CA and the vehicles.
9 Multiple-OBE Scalability Testing
Understanding how DSRC will perform as larger numbers of DSRC radios are added to the system (i.e., system scalability) is crucial for deployment of DSRC-based V2V safety systems. Following the successful completion of the VSC-A objective testing activities, a preliminary multiple-OBE scalability testing effort was undertaken utilizing up to 60 DSRC radios.
The primary objectives of the testing were to:
1) Gather the necessary data in order to analyze how well the communication channel operates, primarily in terms of PER and the inter-packet gap distribution, in a variety of channel configurations and transmit characteristics as well as a varying total number of radios
2) Gain experience in the set-up and execution of a large scale DSRC test effort and in the areas of tools development, SW tools, efficient logistics, setup, procedures, and analysis to ensure the end results are correct and repeatable.
Secondary goals and achievements were confirming that the core and safety application modules operation were not adversely affected during each of the scaling increments with the full VSC-A system operational, including the on-board ECDSA VoD security.
9.1 DSRC Pod Development
In preparation for the multiple-OBE testing, the following activities were undertaken:
1. The OBE implementation, which supports dual radio operation, was enhanced to enable the OBE to emulate two separate RVs via the dual radios
2. A second OBE was integrated into the vehicle system test bed in such a way that full duplication of the system test bed HW was not required by splitting GPS and CAN inputs. In combination with activity 1 above, this effectively brought the total number of radios per vehicle to four.
3. Self-contained DSRC pods running in a GPS-only mode, where only an OBE connection to the GPS receiver and not the vehicle CAN bus is required, were developed to increase the total number of potential communication nodes to 60
Due to the limited number of OBEs that could be adequately installed in the vehicles and with the aid of the dual-radio functionality, the DSRC pod development was a critical and cost-effective means of increasing the number of radios to the desired level for the scalability testing efforts. The design of the pods allowed for them to be deployed in a static configuration via a tripod mount or in a mobile configuration via magnetic mount to the roof of a vehicle. The magnetic mounting capability, while not critical for the preliminary scalability testing effort, will potentially be more valuable in future scalability testing efforts. It allows the increase of the number of mobile DSRC-capable
61

VSC-A Final Report
vehicles without having to fully equip vehicles and, thus, minimize costs. Figure 30 and Figure 31 below highlight some of the design aspects of the DSRC pods.
Base Plate: See Figure 31
Top Level: Steel Plate for mounting DSRC antenna, GPS antenna / receiver, and WiFi antenna(s)
Middle Level: Holds OBE, Wireless Router (see Section 9.2), and optional equipment via side panel mounting
Bottom Level: Holds 12 Amp hour NiMH battery and steel box for internal component connection to external equipment
Figure 30: DSRC Pod Internal Structure Diagram
Magnetic Mounts
Steel box for external equipment connection to internal components
5/8 – 11 Tripod Mounting Point
Figure 31: DSRC Pod Base Plate Diagram
62

VSC-A Final Report
9.2 Test Command, Control, and Confirmation
Earlier, smaller-scale, project-testing efforts exposed the difficulties in manually configuring and controlling multiple OBEs and ensuring the testing was correct, repeatable, and efficient. Therefore, the team made sure the preparation process included a number of steps to address these difficulties:
1. The use of a wireless network which enabled communication with each of the OBEs from a single point
2. The development of scripts for command and control of the OBEs via the wireless network
3. The addition of the applicable test number to the OTA message to ensure in the field and early on in the tests that each OBE in the network is running the proper test configuration
9.2.1 Wireless Network
A wireless router was installed and connected to the WSU(s) in each of the vehicles and pods. The routers were configured to utilize a light-weight mesh network protocol. Individual nodes use this topology information to compute the best path to a destination using and minimum number of relays or “hops.” This provided a single central point for command and control of the entire system over a large area without requiring use of high power communications equipment. See Figure 32 for the vehicle and pod deployment configuration used during the testing.
9.2.2 Script Development
With the wireless network in place, a set of scripts were developed to take advantage of the single central point of command and control that the network offered. The scripts allowed for pushing the required configuration files and startup/shutdown scripts for each of the tests to each of the OBEs, commanding the OBE to start and stop the tests, and confirming the appropriate logs were captured on the OBEs for each of the tests. The scripts, in combination with the network, allowed for confidence in the repeatability of the tests, great efficiencies in time for executing the tests, and the flexibility to add and/or modify tests without having to manually access each OBE.
9.2.3 Test Number Identification
To confirm that the same test was being run on each of the OBEs for each test, the startup scripts provided a unique test number to the OBE at startup. This test number was then appended to all OTA transmissions from the OBE. A special EGUI screen was developed to display the test number of the test the HV was running as well highlight in red any of the RVs whose test number did not match that of the HV.
9.3 Channel and Test and OBE Deployment Configurations
Four different channel configurations were identified along with seven tests exhibiting different transmit characteristics in order to determine how the channel behaved for each of the tested channel configuration/transmit characteristic combinations. This was one of the primary goals of the testing.
63

VSC-A Final Report
9.3.1 Channel Configurations
Testing by the VSC-A Team showed that, even with smaller numbers of radios, utilization of the IEEE 1609.4 channel switching mode without any changes leads to an increase in the observed PER due to “synchronized collisions.” This is caused by the application layer being unaware of the start point and end point of the control and/or the service channel interval (defined by IEEE 1609.4). This increases the likelihood of the application layer attempting to transmit a message in a channel interval other than the intended one. If this occurs, the MAC layer will hold on to the message and transmit it at the beginning of the appropriate channel interval. Even with the back-off mechanism defined in IEEE 802.11, if enough radios are present in the system, the likelihood of having synchronized collisions increases. Table 10 below lists the channel configurations which were tested.
Table 10: Channel Configurations for Scalability Testing
Configuration # Channel Configuration Description
C1 IEEE 1609.4 channel switching mode
C2 Channel 172 dedicated safety channel (i.e., no channel switching)
C3 IEEE 1609.4 channel switching mode with messages submitted for transmission at a random time during each control channel interval
C4 IEEE 1609.4 channel switching mode with messages submitted for transmission via a time-shifting algorithm in an attempt to evenly space transmissions out during the intended channel
Configuration 1 (C1) was included in the scalability testing to confirm the synchronized collision issue as well as to provide a baseline to compare to the test results of the other channel configurations. Configurations 3 and 4 (C3 and C4) are countermeasures which were developed in an attempt to address the synchronized collision issue and in turn decrease the PER encountered when employing 1609.4 channel switching. Finally, Configuration 2 (C2) does not employ channel switching which provided full-time access to the channel essentially removing the artificial boundaries created by the CCH and SCH intervals. This doubles the bandwidth for transmission which decreases the likelihood of two radios transmitting at the same time, and, thus, was expected to decrease the PER observed over any of the other channel configurations tested.
9.3.2 Test Configurations
Like the channel configurations, a baseline test configuration was defined. This configuration was tested for all four channel configurations in combination with all four DSRC radio scaling increments. Some of the primary configuration settings for the baseline test configuration included:
Static vehicles
Transmit timer re-randomized every 30 seconds (not applicable for C3)
64

VSC-A Final Report
Safety applications disabled
Security disabled
222 bytes of extra padding added to OTA messages (total packet size 378 bytes)
10 Hz message transmit rate
6 Mbps data transmit rate
Note that the 222 bytes of extra padding was included to account for the security overhead that would have been present had security been enabled.
The baseline test configuration was the primary configuration used for analyzing channel behavior for each of the channel configurations. Seven additional tests were defined and were run on a sub-set of the channel configurations and scaling increments (see Table 11). These tests varied one or more of the baseline test configuration settings in order to analyze what effect these settings had on the channel configurations when compared to the results of the baseline test configuration.
Table 11: Test Configurations for Scalability Testing
Test#
Channel Configuration Used
Scaling Increment: Number of Radios Changes to the Baseline Test Configuration
C1 C2 C3 C4 24 36 48 60
1 X X X X X X
Baseline Test (See list above) X X X X X
2 X X X X X Moving Vehicles
3 X X X X X 12 Mbps Data Transmit Rate
4.1 X X X X X X Security Enabled and configured for ECDSA VoD
No extra padding added to OTA messages
4.2 X X X X
Moving Vehicles
Safety Applications Enabled
Security Enabled and configured for ECDSA VoD
No extra padding added to OTA messages
5 X X X X X
86 additional bytes of padding added to OTA message (to account for RTCM 1002 data that would be present if RTK positioning was enabled and seven satellites were in view)
6 X X X X X No Transmit timer re-randomization
0 X X X X X 5 Hz Message Transmit Rate
65

VSC-A Final Report
9.3.3 OBE Static Deployment
As previously mentioned, each OBE was able to emulate two separate RVs via the dual radio functionality supported by the OBE. There were eleven pods, each with one OBE, providing for 22 radios. In addition, there were 10 vehicles, 9 of which had 2 OBEs and 1 that had a single OBE which added an additional 38 radios for a grand total of 60 radios.
The pod/vehicle layout consisted of a center cluster of 4 pods and 5 vehicles with the remaining pods and vehicles placed at varying distances up to 275 m from the center cluster. Figure 32 provides a diagram identifying the location of each of the pods and vehicles used in the tests that involved static vehicles.
Figure 32: Vehicle and Pod Static Deployment Configuration
The layout of the pods and vehicles was such that the center cluster OBEs were in communication range of all the other OBEs, whereas the OBEs furthest from the center cluster were not within communication range of one another. It may be important to note that the primary radio on the OBE supported ~19-20 dBm output power whereas the secondary radio supported ~14.5-16 dBm output power. It was the output power of the secondary radio that influenced selecting 275 m as the maximum range from the center cluster.
Four DSRC radio scaling increments were tested consisting of 24, 36, 48, and 60 radios. In general the lower scaling increments included pods and vehicles closer to the center cluster while the ones that were further away were included as the scaling increments increased.
66

VSC-A Final Report
9.4 Sample Scalability Test Results
For the data analysis, gathering the necessary data in order to analyze the PER and the Inter-Packet Gap (IPG) distribution was of primary interest. Testing the baseline test configuration, as listed in Table 10 in combination with each of the DSRC radio scaling increments for each of the four channel configurations listed, was the initial focus of the testing activities. The results of this testing are presented in this section along with a brief discussion on some of the other non-baseline test results. Refer to Appendix I for the full set of test results and analysis.
Note that the purpose of the testing was to gather the necessary data in order to perform a relative comparison of the performance between the different configurations and not to determine acceptable or reasonable PER and / or IPG values.
9.4.1 Packet Error Rate
Figure 33 below shows the results of PER analysis from the perspective of V2 (Black Volvo) which was part of the center cluster (see Figure 32). C1 (1609.4–Timer Based), C3 (1609.4–Random Control Channel Interval Transmit), and C2 (Dedicated Safety Channel 172) results are shown for the 24, 48, and 60 radio scaling increment tests. The results from C4 (1609.4–Time Shifter) were very similar to C3 thus only the C3 results are presented.
The results show that the configuration method used for message transmission has a strong correlation to PER encountered. As expected, collisions at the beginning of a channel interval result in higher PER for C1 which has the worst performance. Taking advantage of knowing when the channel interval begins and ends and implementing countermeasures in an attempt to avoid collisions as in C3 (and C4 which is not shown) provided better results than C1 which made no such attempt. C2 which provided full-time access to the channel had the best performance and did not appear to be as affected as the other configurations as the scaling increments increased.
9.4.2 Inter-Packet Gap
Figure 34 below shows the results of the average IPG analysis from the perspective of V2 (Black Volvo) for the same channel configurations and radio scaling increments as the PER analysis. The trends for each of the channel configurations and scaling increments are similar to that of the PER results which is to be expected as an increase in PER should lead to an increase in the average time between receiving consecutive messages. Once again, C1 performed the worst, followed by C3 (and C4 which is not shown). C2 performed the best. What should be noted is that the Figure 34 charts only include the radios whose average IPG was less than or equal to 200 ms. In taking this into consideration, the 48 radio test for C1 had only 28 of the 46 possible radios that met this condition; and the 60 radio test for C1 had only 38 of the possible 58 radios that met this condition. Whereas, C2 had 22 of 22 and 57 of 58 radios, respectively, that met this condition.
9.4.3 Other Tests
In addition to the PER and IPG test results discussed above, other static baseline test analysis looked at the PER versus Range and the PER versus Received Signal Strength
67

VSC-A Final Report
(RSS) for each of the configurations. For each of these tests, C2 outperformed C3 and C4, which in turn, outperformed C1 as in the previous test results.
The other non-baseline static tests primarily focused on C2 and C3 for the data gathering and analysis. The data analysis looked at the:
PER versus a 5 Hz message transmit interval (test 0) as opposed to the 10 Hz rate used in the baseline test
PER versus 12 Mbps data rate (test 3) as opposed to the 6 Mbps rate used in the baseline test
PER versus increased packet length (test 5)
Finally, in addition to the static deployment tests, a number of moving tests were run to analyze the effects of PER versus distance in a moving environment. For these tests, the deployment of the pods and vehicles was very similar to the all-static tests with the exception that six of the vehicles were moving throughout the tests.
For an analysis these additional baseline, non-baseline static, and moving tests, please refer to Appendix I.
68

VS
C-A
Fina
l Rep
ort
C1:
160
9.4
– T
imer
Bas
ed
60 T
x / 5
8 R
x R
adio
s C
1: 1
609.
4 –
Tim
er B
ased
48
Tx
/ 46
Rx
Rad
ios
C1:
160
9.4
– T
imer
Bas
ed
24 T
x / 2
2 R
x R
adio
s
C3:
160
9.4
– R
ando
m C
CH
Int
erva
l 60
Tx
/ 58
Rx
Rad
ios
C3:
160
9.4
– R
ando
m C
CH
Int
erva
l 48
Tx
/ 46
Rx
Rad
ios
C3:
160
9.4
– R
ando
m C
CH
Int
erva
l 24
Tx
/ 22
Rx
Rad
ios
C2:
Ded
icat
ed S
afet
y C
hann
el 1
72
24 T
x / 2
2 R
x R
adio
s C
2: D
edic
ated
Saf
ety
Cha
nnel
172
48
Tx
/ 46
Rx
Rad
ios
C2:
Ded
icat
ed S
afet
y C
hann
el 1
72
60 T
x / 5
8 R
x R
adio
s
# Radios: 0 – 50
Cum
ulat
ive
% P
acke
ts L
ost a
t V2
(Bla
ck V
olvo
): 0
% –
100
%
Fig
ure
33:
PE
R –
Ch
. Cfg
. 1, 3
, & 2
– 2
4, 4
8 &
60
Tx
Rad
ios
69

VS
C-A
Fina
l Rep
ort
# Radios: 0 – 50
C1:
160
9.4
– T
imer
Bas
ed
60 T
x / 5
8 R
x R
adio
s C
1: 1
609.
4 –
Tim
er B
ased
48
Tx
/ 46
Rx
Rad
ios
C1:
160
9.4
– T
imer
Bas
ed
24 T
x / 2
2 R
x R
adio
s
C3:
160
9.4
– R
ando
m C
CH
Int
erva
l 60
Tx
/ 58
Rx
Rad
ios
C3:
160
9.4
– R
ando
m C
CH
Int
erva
l 48
Tx
/ 46
Rx
Rad
ios
C3:
160
9.4
– R
ando
m C
CH
Int
erva
l 24
Tx
/ 22
Rx
Rad
ios
C2:
Ded
icat
ed S
afet
y C
hann
el 1
72
24 T
x / 2
2 R
x R
adio
s C
2: D
edic
ated
Saf
ety
Cha
nnel
172
48
Tx
/ 46
Rx
Rad
ios
C2:
Ded
icat
ed S
afet
y C
hann
el 1
72
60 T
x / 5
8 R
x R
adio
s
Ave
rage
Inte
r-pa
cket
Gap
at V
2 (B
lack
Vol
vo):
0 m
s – 2
00 m
s
Fig
ure
34:
IPG
Ave
rag
e –
Ch
. Cfg
. 1, 3
, & 2
– 2
4, 4
8 &
60
Tx
Rad
ios
70

VSC-A Final Report
9.5 Multiple-OBE Result Summary and Next Steps
In general the following conclusions can be drawn from the preliminary scalability test results:
1. Using a dedicated, full-time safety channel to transmit V2V safety messages clearly provides superior performance over any of the other channel configuration methods employing IEEE 1609.4 channel switching when considering the following metrics:
a. PER for:
i. Cumulative PER ii. PER compared to RSS
iii. PER compared to Range b. IPG for:
i. Average IPG ii. Worse Case IPG
The primary benefit of this approach is the increased bandwidth that is available to the radio by allowing full-time access to the channel which results in better communications performance as evidenced by the PER and IPG performance results discussed above.
2. Transmitting smaller packets has a positive effect on the PER
3. Decreasing the message transmit rate (e.g., 5 Hz versus 10 Hz) has a positive effect on PER
4. Increasing the data transmit rate (e.g., 12 Mbps versus 6 Mbps) limits the number of RVs in communication range; however, it appears to have a positive affect on the PER for RVs with stronger signals
5. In a moving environment there exists a greater range of best case and worse case PER versus a static environment. While not conclusive, the difference in PER appears to be caused from blockage from other vehicles, both moving and stationary
Some of the next steps include incorporating lessons learned into future projects where V2V system scalability has to be proven beyond the achievable total number of units used within this project (i.e., 60). This includes lessons learned in test bed design and development, SW design and stability, and scalability testing logistics.
10 Main Project Accomplishments and Remaining Needs
10.1Summary of Project Accomplishments
The following list captures the main VSC-A Project accomplishments:
71

VSC-A Final Report
Defined a set of high-priority crash scenarios that could be addressed by V2V DSRC+Positioning. These scenarios are representative of the major crash categories: same direction, lane change, intersecting and oncoming.
Selected and developed a set of V2V safety applications to address set of crash scenarios listed above
Defined efficient system architecture for a V2V safety system where all VSC-A safety applications are enabled at the same time
Successfully implemented a test bed with all the safety applications on a platform running an automotive grade processor (400 MHz)
Successfully incorporated the test bed and evaluated two relative positioning approaches (RTK and SP)
Successfully incorporated in the test bed the necessary OTA communication protocol (SAE J2735) and security protocol (IEEE 1609.2 ECDSA VoD)
Defined OTPs for all the VSC-A safety applications (including false positive tests)
Successfully executed and passed all objective tests for all the VSC-A safety applications
Refined, with field data, the required OTA message set for V2V safety (BSM within SAE J2735) which led to the recently published version of this standard
Conducted a GPS Service Availability Study to quantify availability and accuracy of V2V GPS-based relative positioning (using RTK and SP methods)
Confirmed that ECDSA VoD functioned properly under all test conditions for the VSC-A safety applications
Performed and analyzed initial scalability with up to 60 radios to characterize channel behavior under IEEE 1609.4 and under dedicated, full-time use of channel 172
10.2 Remaining Needs
10.2.1 Technical Work Items
The VSC-A Team has identified the following as future work items:
1. Large-scale Performance Assessments
a. Further development and standardization of communications protocols for V2V that ensure scalability and reliability at dense penetration by mitigating potential channel congestion through, for example, intelligent broadcast message rate control protocol, intelligent transmit power control protocol, intelligent transmission range control protocol, etc.
b. Data Reliability assessment to determine the overall robustness of the system to support safety applications, including: identification of metrics to effectively quantify data reliability of the system; analysis of reliability
72

VSC-A Final Report
required for identified vehicle safety applications; determination of overall system requirements to support these applications, and assessment of system data reliability to meet potential expansion of safety applications beyond “warnings-only.”
2. Security/Privacy/Authentication/Data Integrity
a. Study is required to determine the feasibility of using non-DSRC-network-based technologies to allow the necessary communications between a CA or authorities; for example, to distribute the certificate revocation list (CRL). This effort would include identification of the required communications between a CA and vehicles and the identification and evaluation of potential alternative communications technologies (e.g., current and next generation cellular technologies, satellite radio, WiMax, WiFi, infrared, etc.) for feasibility to support these requirements.
b. Complete the evaluation and standardization of security protocols that can most effectively support V2V safety applications, taking into account privacy policies developed by others that would apply for this system. This work would include simulations to understand practicability, scalability, and deployability of security protocols.
c. Study is required to determine the security implications associated with aftermarket and retrofit units for V2V safety.
3. Standards/Protocols
a. Safety message standards and protocols, as well as lower layer DSRC standards and protocols, are currently being completed through balloting in the relevant standards development organizations (SDOs). However, these standards and protocols will need to be tested under actual field conditions in order to identify and correct any remaining issues, as well as identify any technical areas where additional standards must be developed to ensure interoperability in deployed systems.
b. Interoperability
i. Minimum Performance Standard for V2V Safety Messaging - dictionary further standard work, complementing SAE J2735, is required to define minimum update rate, transmission rate, data rate, channel congestion mitigation protocol, channel 172 vs. channel switching, message priority, etc.
ii. Procedures, Validation and Certification - How do we know the data received from another vehicle is valid and how “good” it is? This research question involves identification of the minimum set of standards, compliance of which is essential to ensure V2V interoperability. There is also the potential need for third party certification of compliance with relevant standards and spectrum usage “rules,” as well as studying the metrics and mechanisms for conveying the real-time validity of information originating in “other vehicles.”
73

VSC-A Final Report
4. Develop Technical Options to Accelerate Penetration
a. There is a desire to accelerate market penetration, since inclusion on even all new production vehicles will generate safety benefits only at the rate of the inverse square of the percentage of penetration in the overall deployed fleet. Research is required, for example, to determine the necessary levels of technical capabilities to support vehicle safety applications for various potential retrofit units as well as aftermarket units, with varying degrees of connectivity to vehicle systems.
b. Further field testing is required to determine system performance under real-world conditions (e.g., antenna placement, data availability, impact of various weather conditions, etc.). In addition, application effectiveness, user acceptance, and unintended consequences under various levels of market penetration need to be evaluated prior to deployment for new applications. This has historically been accomplished through field operational testing with naïve subjects, which will also be required in this case, unless other suitable evaluation methods are available.
5. Human Machine Interface Development
Additional human factors research and DVI development to handle 360– degree, simultaneous, safety applications operation in V2V environment will be needed before deployment.
10.2.2 Work Items Needed for Expanded Safety Functionality
The VSC-A Team has identified the following as future work items:
1. Applications: Many potential V2V safety applications have been identified. Additional applications should be developed in prototype versions and tested (e.g., vehicle to pedestrian/bicyclists, intersection management with pedestrians, etc.). Besides evaluating applications, this type of testing should determine which additional applications can be effectively supported by the existing SAE J2735 BSM, as well as identifying if any additional data elements, data frames, or additional messages will be required to support these new applications.
2. Vehicle Positioning (Geo-location)
a. Look at ways to make safety applications more tolerant due to loss-of-accurate vehicle location or operation in mixed-mode positioning.
b. Some GPS issues will still be at the research level, especially with new GPS developments. What can be done with improved GPS, GLONASS, GNSS?
10.2.3 Policy and Institutional Issues Identified by VSC2
Although VSC2 is focused on technical research rather than policy, the following policy and institutional issues have been identified by VSC2 as areas that need to be resolved by others in order to allow the effective deployment of V2V safety applications. Please note that this is not meant to be a complete listing of all the policy and institutional issues that
74

VSC-A Final Report
need to be resolved for V2V deployment, but rather only those that have become obvious to VSC2 in the course of its technical considerations.
1. Governance and Enforcement - Currently the FCC only specifies the lower two layers of the protocol stack for use in the 5.9 GHz DSRC spectrum and only generally specifies that the spectrum is to be used primarily for public safety and vehicle safety. There is currently no authority overseeing the use of the spectrum and enforcing any rules of non-interference with vehicle safety or public safety applications. As well, there is currently no mandate to use the middle layer protocols developed by IEEE 1609, or the message sets developed by SAE J2735 while using this spectrum.
2. Certificate Authority - The organizational structure and assignment of responsibilities for overall certificate management for the security of the system needs to be established before deployment technologies can be finalized.
3. Business Model - It will be necessary to make the economic case for deployment of V2V safety applications. For safety applications, presumably, this could be based upon a public sector benefits/cost analysis. However, it needs to be clearly established who will benefit from and who will pay for deployment of this system. It is expected that the selection of the preferred business model would lead to identification of and agreement on the preferred deployment scenario.
4. Priority - Some authority must be established to perform and enforce the assignment of priorities to applications or specific messages in accordance with agreed rules that ensure that the most urgent safety messages are assigned the highest levels of priority.
5. Phased Deployment - Work should be completed to strategically plan for phased deployment to start introducing cooperative safety systems with today’s technologies (basic DSRC and positioning technologies) and to incorporate enhanced performance and functionalities as the technology matures, while addressing backwards compatibility.
11 Publicly Available Project Documentation
The following table lists some of the reports, papers, and presentations that were either published or made publicly available during this project.
Table 12: VSC-A Publicly Available Documentation
Title DocumentType
Publication / Workshop /
Location / etc. Date
1
Vehicle Safety Communications – Applications (VSC-A) First Annual Report – December 7, 2006 through December 31, 2007
Report USDOT Website September 2008
75

VSC-A Final Report
Title DocumentType
Publication / Workshop /
Location / etc. Date
2
Vehicle Safety Communications – Applications (VSC-A) Second Annual Report – January 1, 2008 through December 31, 2008
Report USDOT Website February 2009
3
Vehicle Safety Communications – Applications VSC (VSC-A) Kick Kick-Off Briefing
Presentation USDOT Website January 2007
4 Security in VSC-A Presentation IEEE 1609
Working Group Meeting
August 2008
5 Security in VSC-A Presentation IEEE 1609
Working Group Meeting
October 2008
6 VSC-A Multi-Channel Operation Investigation: A Report to IEEE 1609
Presentation IEEE 1609
Working Group Meeting
February 2009
7 Security in VSC-A Presentation IEEE 1609
Working Group Meeting
February 2009
8 Network Simulation Results from the VSC-A Project as Performed by Ahren Studer and Adrian Perrig
Presentation IEEE 1609
Working Group Meeting
June 2009
9 Network Simulation Results from the VSC-A Project as Performed by Yih-Chin Hu and Jason Haas
Presentation IEEE 1609
Working Group Meeting
June 2009
10 Network Simulation Results from the VSC-A Project as Performed by Mercedes-Benz RDNA
Presentation IEEE 1609
Working Group Meeting
June 2009
11 Preliminary Conclusions of the V2V Security Network Simulations in the VSC-A project
Presentation IEEE 1609
Working Group Meeting
June 2009
12 Security in VSC-A (ECDSA-224 vs. 256 , privacy)
Presentation IEEE 1609
Working Group Meeting
June 2009
13 VSC-A Mulit-Channel Operation Investigation: An update to IEEE 1609
Presentation IEEE 1609
Working Group Meeting
June 2009
14 VSC-A Project – System Update Presentation IEEE 1609
Working Group Meeting
June 2009
76

VSC-A Final Report
Title DocumentType
Publication / Workshop /
Location / etc. Date
15
Vehicle Safety Communications – Applications VSC-A – Proposed Informative Annex on Channel Congestion Phenomenon Following a Channel Switch
Document IEEE 1609
Working Group Meeting
June 2009
16 Proposal to define WSMP bits to support Multi-Channel Operation for Safety
Presentation IEEE 1609
Working Group Meeting
October 2009
17 Vehicle Safety Communications -Applications (VSC-A) Project Overview
Presentation SAE Government / Industry Meeting
February 2009
18
Vehicle Safety Communications – Applications (VSC-A) Project:System Design & Test Bed Implementation
Presentation SAE Government / Industry Meeting
February 2009
19
Vehicle Safety Communications – Applications (VSC-A) Project:Communications & Standards Status
Presentation SAE Government / Industry Meeting
February 2009
20 Vehicle Safety Communications – Applications (VSC-A) Project:Crash Scenarios and Safety Applications
Presentation SAE Government / Industry Meeting
February 2009
21 Vehicle Safety Communications – Applications (VSC-A) Project: Security for Vehicle Safety Messages
Presentation SAE Government / Industry Meeting
February 2009
22 Vehicle-Vehicle and Vehicle-Infrastructure Communications based Safety Applications
Presentation SAE Government / Industry Meeting
January 2010
23 Vehicle-to-Vehicle Communication: A New Generation of Driver Assistance and Safety
Video USDOT Website October 2008
77
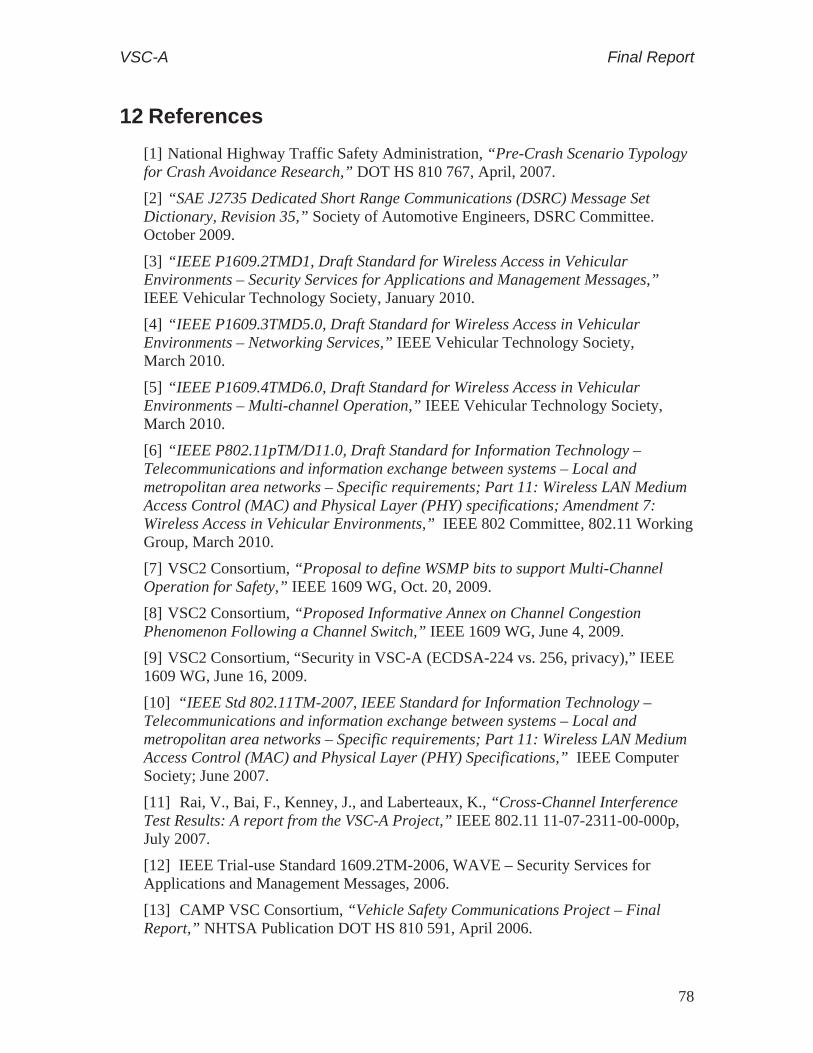
VSC-A Final Report
12 References
[1] National Highway Traffic Safety Administration, “Pre-Crash Scenario Typology for Crash Avoidance Research,” DOT HS 810 767, April, 2007.
[2] “SAE J2735 Dedicated Short Range Communications (DSRC) Message Set Dictionary, Revision 35,” Society of Automotive Engineers, DSRC Committee. October 2009.
[3] “IEEE P1609.2TMD1, Draft Standard for Wireless Access in Vehicular Environments – Security Services for Applications and Management Messages,” IEEE Vehicular Technology Society, January 2010.
[4] “IEEE P1609.3TMD5.0, Draft Standard for Wireless Access in Vehicular Environments – Networking Services,” IEEE Vehicular Technology Society, March 2010.
[5] “IEEE P1609.4TMD6.0, Draft Standard for Wireless Access in Vehicular Environments – Multi-channel Operation,” IEEE Vehicular Technology Society, March 2010.
[6] “IEEE P802.11pTM/D11.0, Draft Standard for Information Technology – Telecommunications and information exchange between systems – Local and metropolitan area networks – Specific requirements; Part 11: Wireless LAN Medium Access Control (MAC) and Physical Layer (PHY) specifications; Amendment 7:Wireless Access in Vehicular Environments,” IEEE 802 Committee, 802.11 Working Group, March 2010.
[7] VSC2 Consortium, “Proposal to define WSMP bits to support Multi-Channel Operation for Safety,” IEEE 1609 WG, Oct. 20, 2009.
[8] VSC2 Consortium, “Proposed Informative Annex on Channel Congestion Phenomenon Following a Channel Switch,” IEEE 1609 WG, June 4, 2009.
[9] VSC2 Consortium, “Security in VSC-A (ECDSA-224 vs. 256, privacy),” IEEE 1609 WG, June 16, 2009.
[10] “IEEE Std 802.11TM-2007, IEEE Standard for Information Technology – Telecommunications and information exchange between systems – Local and metropolitan area networks – Specific requirements; Part 11: Wireless LAN Medium Access Control (MAC) and Physical Layer (PHY) Specifications,” IEEE Computer Society; June 2007.
[11] Rai, V., Bai, F., Kenney, J., and Laberteaux, K., “Cross-Channel Interference Test Results: A report from the VSC-A Project,” IEEE 802.11 11-07-2311-00-000p, July 2007.
[12] IEEE Trial-use Standard 1609.2TM-2006, WAVE – Security Services for Applications and Management Messages, 2006.
[13] CAMP VSC Consortium, “Vehicle Safety Communications Project – Final Report,” NHTSA Publication DOT HS 810 591, April 2006.
78

VSC-A Final Report
[14] SAE International TM, “Surface Vehicle Standard – Dedicated Short Range Communications (DSRC) Message Set Dictionary,” SAE J2735, November 2009.
[15] CAMP EDMap Consortium, “Enhanced Digital Mapping Project Final Report,” FHWA and NHTSA Publication, November 19, 2004.
13 VSC-A Final Report Appendices
Following is a list of the VSC-A Final Report appendices which contain supporting material for the technical and other content contained in this document. The appendices are separated into three (3) separate volumes based on a logical content groupings.
Volume 1: System Design and Objective Test Appendix A DSRC+Positioning and Autonomous Safety System Analysis
Appendix B-1 Test Bed System Development
Appendix B-2 Path History Reference Design and Test Results
Appendix C-1 Minimum Performance Requirements
Appendix C-2 Objective Test Procedures and Plan
Appendix C-3 Objective Testing Results
Volume 2: Communications and Positioning Appendix D-1 Communications Power Testing
Appendix D-2 Multi-Channel Operations
Appendix E-1 Relative Positioning Software Performance Analysis
Appendix E-2 GPS Service Availability Study Literature Review
Appendix E-3 GPS Service Availability Study Final Report
Appendix I Multiple-OBE Scalability Testing Results
Volume 3: Security Appendix F Security Protocols and Implementation Results
Appendix G-1 Security Network Simulations – Prepared by Ahren Studer and Adrian Perrig
Appendix G-2 Security Network Simulations – Prepared by Yih-Chun Hu and Jason J. Haas
Appendix G-3 Security Network Simulations – Prepared by Mercedes-Benz RDNA
Appendix H-1 Analysis of Infrastructure and Communications Requirements for V2V PKI Security Management – Prepared by Adrian Perrig and Ahren Studer
79

VSC-A Final Report
Appendix H-2 Analysis of Infrastructure and Communications Requirements for V2V PKI Security Management – Prepared by India Science Laboratory, General Motors Research & Development
Appendix H-3 Analysis of Infrastructure and Communications Requirements for V2V PKI Security Management – Prepared by Jerry Yih-Chun Hu and T. Chiang
Appendix H-4 Analysis of Infrastructure and Communications Requirements for V2V PKI Security Management – Prepared by Security Innovations
Appendix H-5 Analysis of Infrastructure and Communications Requirements for V2V PKI Security Management – Prepared by Telcordia Technologies, Inc.
80

VSC-A Final Report
14 Acknowledgements
The CAMP VSC2 Participants would like to acknowledge the following USDOT personnel for their invaluable project support; Art Carter, Ray Resendes, Mike Schagrin, and Mike Lukuc. The Participants would also like to thank VRTC personnel, especially Garrick Forkenbrock, for their outstanding support during the execution of the objective tests. Finally the Participants would like to express their appreciation to the following Volpe personnel; Wassim Najm, Bruce Wilson, and Jonathan Koopman for their support with the development and execution of the objective tests.
81

DOT HS 811 492ASeptember 2011


