42
Velocity, Speed, and Acceleration Unit 1: Kinematics

Velocity, Speed,
and AccelerationUnit 1: Kinematics
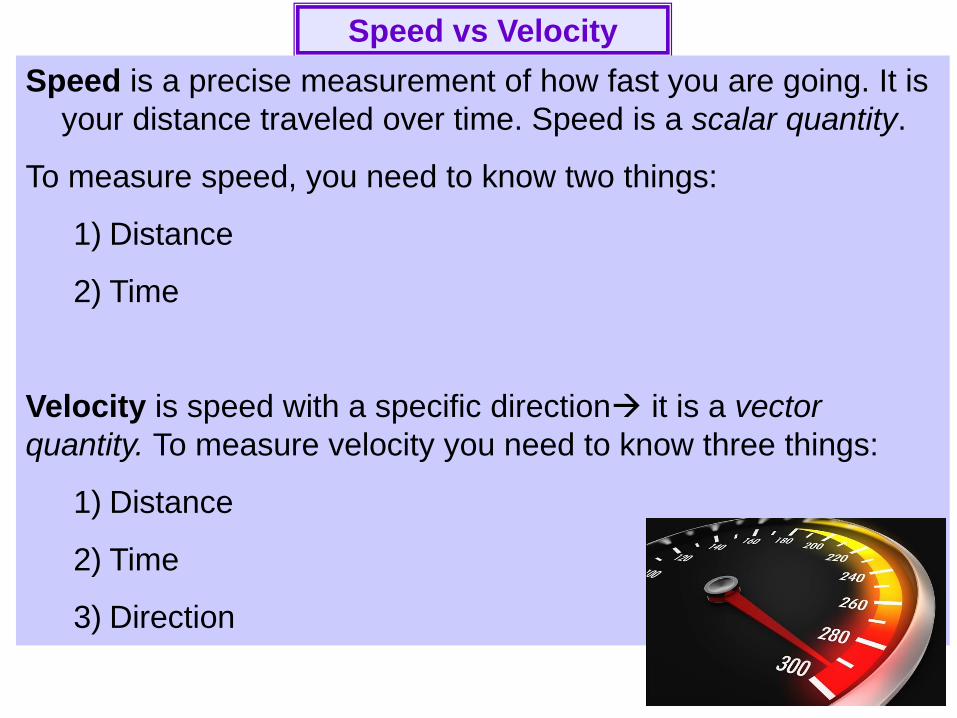
Speed vs Velocity
Speed is a precise measurement of how fast you are going. It is
your distance traveled over time. Speed is a scalar quantity.
To measure speed, you need to know two things:
1) Distance
2) Time
Velocity is speed with a specific direction→ it is a vector
quantity. To measure velocity you need to know three things:
1) Distance
2) Time
3) Direction

The skier has traveled 400 meters in 6 seconds. What
is his speed?
Distance traveled is 400 meters
The time it took was 6 seconds.
The speed is the distance traveled divided by the time taken.
speed = 400 meters
6 seconds
speed = 66.67 ms

Formula In this formula;
•x is the symbol for displacement
•Usually measured in meters
•t is the symbol for time
•Usually measured in seconds
•v is the symbol for velocity
•Usually measured in m/s.
•It must agree with whatever the
distance and time is measured in!
•Velocity is actually speed with a direction
(known as a VECTOR quantity).
•EX: 60 mph on I-80 going east.
The formula for
velocity is
𝑣 =∆𝑥
∆𝑡

Formula In this formula;
•dtotal is the symbol for total distance
•Usually measured in meters
•ttotal is the symbol for total time
•Usually measured in seconds
•savg is the symbol for average speed
•Usually measured in m/s.
•It must agree with whatever the
distance and time is measured in!
The formula for
average
speed is
𝑠𝑎𝑣𝑔 =𝑑𝑡𝑜𝑡𝑎𝑙𝑡𝑡𝑜𝑡𝑎𝑙

Remember: We
have a specific
5-step method
for solving
problems…the
GUESS method.
Problems
When Evelyn Ashford was in the Olympics she
broke the record for the 200 m run by completing
it in 11s. What was her speed?

When Evelyn Ashford was in the Olympics she broke the record for the 200 m
run by completing it in 11s. What was her speed?
G: givens
d = 200 m
t = 11 s
U: unknowns
v = ?
E: equation
𝑣 =∆𝑥
∆𝑡
S: substitution
𝑣 =200
11
S: solution
v = 18 m/s
G: write down the givens
• you can do any necessary
conversions at this point.
U: write down the unknowns
E: write down the equation(s)
• you may want to re-arrange the
equation at this point
S: write down the substitution
• Plug everything in
S: write down the solution
• remember to include the units!

On average, a cheetah can reach speeds of up to 95 km/hr. If the cheetah
can maintain that speed for about 30 seconds, how far will it travel in that
time? G: givens
v = 95 km/hr
t = 30 seconds
1 hour = 3600 seconds
U: unknowns
x = ?
E: equation
𝑣 =∆𝑥
∆𝑡
Rearrange for x,
x = vt
S: substitution
x = ( 26.39 m/s)(30 sec)
S: solution
v = 791.7 m
Problems

G: givens x = 30.5 m
v = 73.14 m/s
U: unknowns t = ?
E: equation ∆𝑡 =∆𝑥
𝑣
S: substitution
t = 30.5m
73.14m/s
S: solution t = 0.42 sec
Problems
In 1931, "'Big Bill' Tilden delivered the fastest serve ever officially
measured. The speed was 73.14 m/s. If the serve covered 30.5
m, how much time did Bill’s opponent have to react before the ball
reached him?

ACCELERATIONWhat is acceleration?The rate at which velocity changes compared to the time it
takes to change. This is also a vector quantity because it includes a direction.
𝑎 =∆𝑣
∆𝑡=𝑣𝑓 − 𝑣𝑖
∆𝑡=𝑓𝑖𝑛𝑎𝑙 𝑣𝑒𝑙𝑜𝑐𝑖𝑡𝑦 − 𝑖𝑛𝑖𝑡𝑖𝑎𝑙 𝑣𝑒𝑙𝑜𝑐𝑖𝑡𝑦
𝑐ℎ𝑎𝑛𝑔𝑒 𝑖𝑛 𝑡𝑖𝑚𝑒
UNITS: 𝑚/𝑠
𝑠= m/s/s or m/s2

1. Given:
Initial Velocity = 20 m/s
Final Velocity = 60 m/s
Δ v = 60 – 20 = 40 m/s
Time = 4 seconds
2. Unknown:
Acceleration = ?
3. Equation:
𝑎 =∆𝒗
∆𝒕
This means your car accelerates
10 m/s each second4 sec 4 sec
EX: If your old Chevy can go from 20 m/s to 60 m/s in 4 seconds, What is your car’s acceleration?
4. Substitute:
𝑎 =40
4
5. Solve:
𝑎 = 10 m/𝑠2

*Any change in speed, is acceleration. *Any change in direction is acceleration.
More about acceleration….Lets say the stop light turns red and you put
the brakes on. Are you accelerating?

When is there zero acceleration?
If you are traveling at a constant speed of 50 mph for 1 hour, are you accelerating?
Remember: 𝑎 =∆𝒗
∆𝒕
Is your speed changing?
No? Then acceleration = 50 mph – 50 mph = 0 mph = ZERO!
1 hr 1 hr
*Acceleration is ZERO if you travel at a constant speed!*
Zero acceleration = cruise control

All of the Kinematics Equations
Based on what information you have, pick the correct equation!

Acceleration Practice – You try the following problems
1. A car must come to an emergency stop. What is its
acceleration if it took 8 seconds for it to stop when it was
traveling at 30 m/s?
2. It was once recorded that a Jaguar left skid marks that
were 290 m in length. Assuming that the Jaguar skidded
to a stop with a constant acceleration of -3.90 m/s2,
determine the speed of the Jaguar before it began to
skid.

GRAVITY• Gravity pulls all things
down toward the center of Earth with the same acceleration
• If you drop an object straight down and no other forces are acting on it, it accelerates in free fall.
Free Fall Acceleration on Earth = -9.8 m/s2 (also known as the acceleration of gravity)
Gravity Problem
A stone is dropped into a deep well and is heard to hit the water 3.41 s after being dropped. Determine the depth of the well.

Visualizing Motion:Position and Time
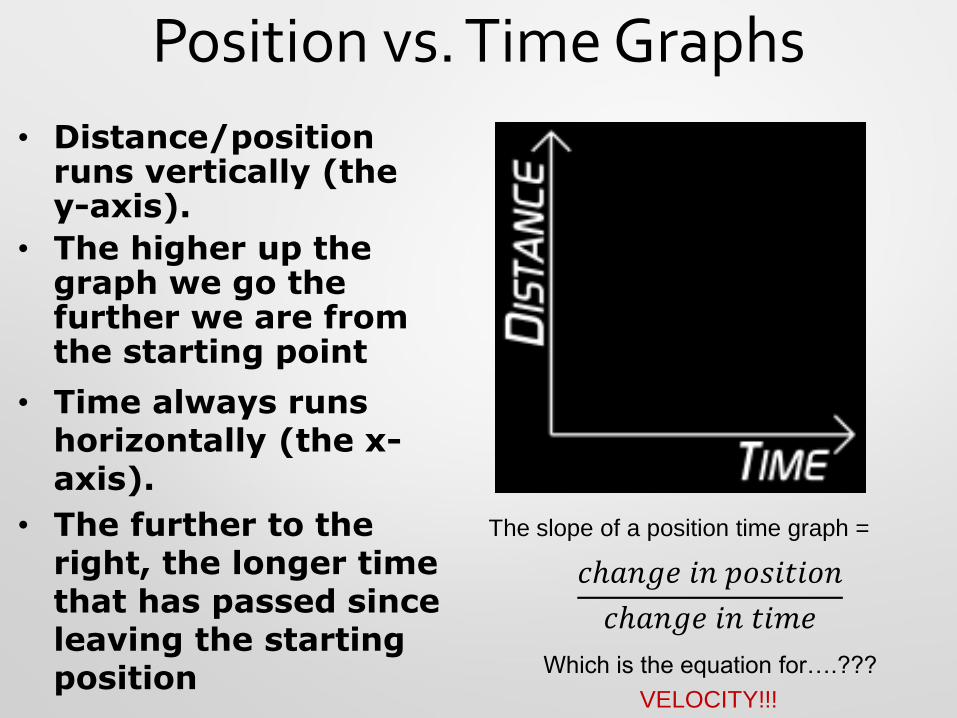
Position vs. Time Graphs
• Time always runs horizontally (the x-axis).
• The further to the right, the longer time that has passed since leaving the starting position
• Distance/position runs vertically (the y-axis).
• The higher up the graph we go the further we are from the starting point
The slope of a position time graph =
𝑐ℎ𝑎𝑛𝑔𝑒 𝑖𝑛 𝑝𝑜𝑠𝑖𝑡𝑖𝑜𝑛
𝑐ℎ𝑎𝑛𝑔𝑒 𝑖𝑛 𝑡𝑖𝑚𝑒
Which is the equation for….???
VELOCITY!!!

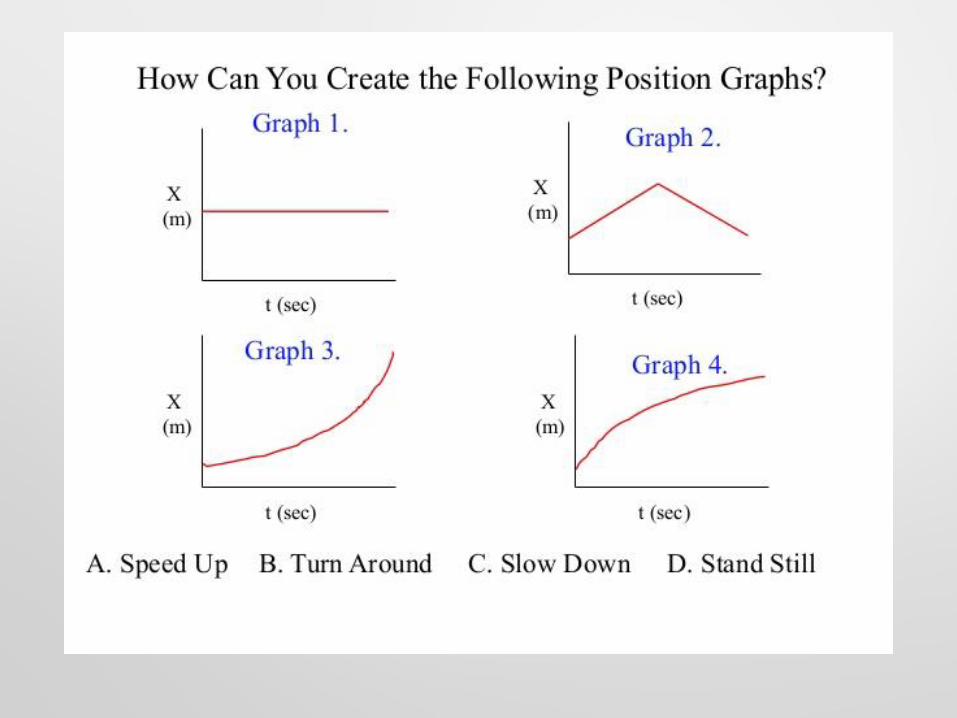
• If something is not moving, a horizontal line is drawn on a distance-time graph.
• Time is increasing to the right, but its distance does not change.
• This graph shows an object that is stationary.
P-T Graphs
Slope = 0 = velocity

• If something is moving at a steady speed, it means we expect the same increase in distance in a given time.
• Time is increasing to the right, and distance is increasing steadily with time.
P-T Graphs
This graph shows an object that
moves at a steady, constant speed.

• Both the lines below show that each object moved the same distance, but the steeper yellow line got there before the other one.
• What does this indicate?
P-T Graphs
▪A steeper slope indicates a larger distance moved in a given time. In other words, higher speed.
▪This is shown in yellow.

• For the first part of the journey shown by the graph below, the object moved at a constant (slow) speed.
• Then the object suddenly increased its speed, covering a much larger distance in the same time.
• The speed increased in the second part of the journey.
P-T Graphs

There are three parts to the journey shown here… Where is the graph showing motion
that is:
Stopped?
Moving at a quick constant speed?
Traveling at a slow constant speed?
P-T Graphs
A
B
CB!
C!
A!

P-T Graphs: Negative Slopes
C
• What do these graphs, with a NEGATIVE SLOPE mean?
• They show an object that is
moving leftward or
backwards.
• Negative in physics means
left, down, West, or South
• Positive means right, up,
North, or East

You Try It: Graphing
Position Vs. Time
• Suppose you are helping a friend who is training for a track meet.
• She wants to know if she is running at constant speed.
• You mark the track in 50-meter increments and measure her time at each position during a practice run.
• Calculate her average speedbased on the data.
Time (s) Position (m)
0 0
10 50
20 100
30 150
𝒔𝒂𝒗𝒈 =𝒅𝒕𝒐𝒕𝒂𝒍𝒕𝒕𝒐𝒕𝒂𝒍
=𝟏𝟓𝟎
𝟑𝟎= 𝟓𝟎𝒎/𝒔
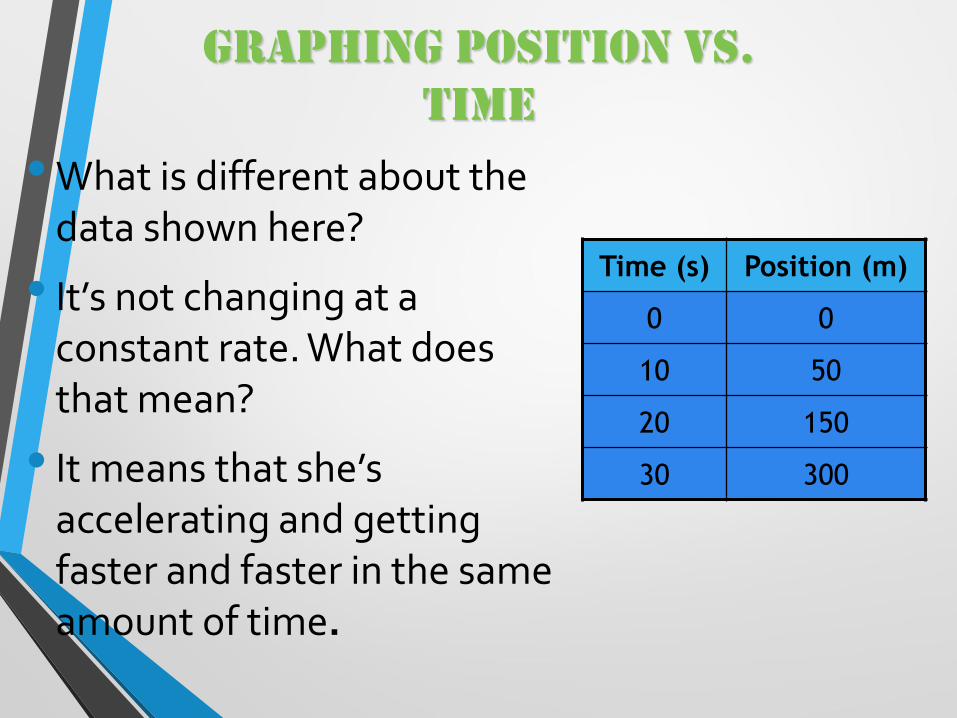
Graphing Position Vs.
Time
• What is different about the data shown here?
• It’s not changing at a constant rate. What does that mean?
• It means that she’s accelerating and getting faster and faster in the same amount of time.
Time (s) Position (m)
0 0
10 50
20 150
30 300

Position Vs. Time -
Changing Velocity
• Now consider a car that has a changing velocity.
• It is not moving at a constant rate, but getting faster by the second (i.e. it’s accelerating)
• What would this graph look like?
• You try it in your notes first…

• The line below is curving upwards. This shows an increase in speed, since the slope is getting steeper over time.
• It is accelerating
P-T Graphs: Acceleration

Acceleration in a P-T Graph
+ acceleration - acceleration

Visualizing Motion:Velocity and Time

VELOCITY vs TIME GRAPHYou just finished designing your own Hot Wheels car and you are ready to
race it down the driveway. You take out your stopwatch and record the time from start (zero) to the end of the driveway.
You then calculated the speed and created a chart. Let’s take a look at how your car did.
What would a velocity vs. time graph look like with this data?
Do it in your notes!

What does the slope of a velocity vs. time
graph tell you?
Remember:
Slope = ∆𝑦
∆𝑥= 𝑐ℎ𝑎𝑛𝑔𝑒 𝑖𝑛 𝑠𝑝𝑒𝑒𝑑
𝑐ℎ𝑎𝑛𝑔𝑒 𝑖𝑛 𝑡𝑖𝑚𝑒
Acceleration = 𝑐ℎ𝑎𝑛𝑔𝑒 𝑖𝑛 𝑠𝑝𝑒𝑒𝑑
𝑐ℎ𝑎𝑛𝑔𝑒 𝑖𝑛 𝑡𝑖𝑚𝑒
So…the slope of a speed vs time graph gives us acceleration!
What else have we talked about
that’s formula is𝑐ℎ𝑎𝑛𝑔𝑒 𝑖𝑛 𝑠𝑝𝑒𝑒𝑑
𝑐ℎ𝑎𝑛𝑔𝑒 𝑖𝑛 𝑡𝑖𝑚𝑒?

-The graph shows a slope with a straight line.
According to the graph, what does this tell you about the acceleration?
→Straight line, so same slope
→ Your car accelerates the same amount every second
(constant acceleration)
-How much is your car accelerating every second?
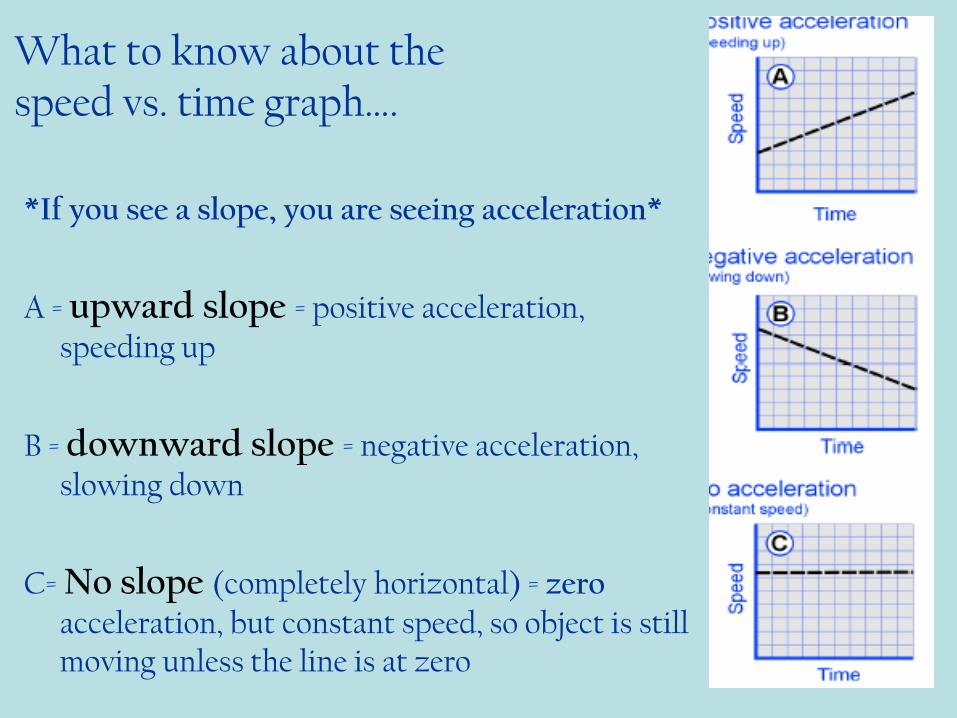
What to know about the speed vs. time graph….
*If you see a slope, you are seeing acceleration*
A = upward slope = positive acceleration, speeding up
B = downward slope = negative acceleration, slowing down
C= No slope (completely horizontal) = zero acceleration, but constant speed, so object is still moving unless the line is at zero

Learning Check

Comparisons

Speeding Up While Falling
• What could cause this?
Object being dropped!

Free Fall/Gravity on a P-T Graph
• Trajectory of a ball being thrown upward

What is happening at each point?
Free Fall/Gravity on a P-T Graph

Free Fall/Gravity on a P-T Graph
What is happening at:
J: Slowing Down K: Slowing Down L: Slowing Down
M: Stopped N: Speeding Up O: Speeding Up
P: Speeding Up
• Gravity is fighting the upward motion of the object on the way up, so the
acceleration is -9.8 m/s/s (negative)
• Gravity is making the object move faster on the way down so the
acceleration is 9.8 m/s/s


