25
Venn Diagrams and Probability Target Goals: I can use a Venn diagram to model a chance process of two events. I can use the general addition rule. 5.2b h.w: p 309: 29, 33 – 36, 49 – 55 odd
| Date post: | 23-Dec-2015 |
| Category: |
Documents |
| Upload: | nathaniel-joseph |
| View: | 216 times |
| Download: | 1 times |

Venn Diagrams and ProbabilityTarget Goals:I can use a Venn diagram to model a chance process of two events.I can use the general addition rule.
5.2bh.w: p 309: 29, 33 – 36, 49 – 55 odd

Review Rules of Probability
Rule 1: 0 ≤ P (A) ≤ 1 for event A
Rule 2: P(S) = 1. Rule 3: Complement Rule
P(Ac ) = 1 – P(A)

Rule 4: Addition RuleP(A or B) = P(A) + P(B)A and B must be disjoint events

Review Intersection

Suppose a six-sided die is rolled. The event that the die would land on an even number would be E = {2, 4, 6}
The event that the die would land on a prime number would be
P = {2, 3, 5}
What would be the event E and P happening?
E and P = {2}
This is an example of the intersection of two events.

The intersection of A and B - consists of all outcomes that are in both of the events
BAB and A
This symbol means “intersection”

Let’s revisit rolling a die and getting an even or a prime number . . .
E and P = {2}
To represent this with a Venn Diagram:
24
6
3
5
1
E and P would be ONLY the middle part that the circles have in
common

Warm up: Distance LearningDistance-learning courses are rapidly gaining popularity
among college students. Randomly select an undergraduate student who is taking distance-learning courses for credit and record the student’s age. Here is the probability model:
Probability R
ules
Age group (yr): 18 to 23 24 to 29 30 to 39 40 or over
Probability: 0.57 0.17 0.14 0.12
(a)Show that this is a legitimate probability model.
(b)Find the probability that the chosen student is not in the traditional college age group (18 to 23 years).
Each probability is between 0 and 1 and 0.57 + 0.17 + 0.14 + 0.12 = 1
P(not 18 to 23 years) = 1 – P(18 to 23 years)
= 1 – 0.57 = 0.43

Union
The union of any collection of events is the event that at least one of the collection occurs.
BAB or A

Suppose a six-sided die is rolled. The event that the die would land on an even number would be E = {2, 4, 6}
The event that the die would land on a prime number would be P = {2, 3, 5}
What would be the event E or P happening?
E or P = {2, 3, 4, 5, 6}This is an example of the union of two events.

The union of A or B - consists of all outcomes that are in at least one of the two events, that is, in A or in B or in both.
BAB or A This symbol
means “union”
Consider a marriage or union of two
people – when two people marry, what
do they do with their possessions ?
The bride takes all her stuff & the groom takes all his stuff & they put it together!
And live happily ever after!
This is similar to the union of A and B.
All of A and all of B are put together!

Let’s revisit rolling a die and getting an even or a prime number . . .
E or P = {2, 3, 4, 5, 6}
Another way to represent this is with a Venn Diagram.
Even number
24
6
Prime number
3
5
1
E or P would be any number in either circle.
Why is the number 1 outside the
circles?

Union of 2 Events that are not Disjoint
They can occur simultaneously Don’t count common outcomes twice.

General Rule for Addition
For any two events A and B,
( ) ( ) ( ) ( )P A B P A P B P A B
A B
Since the intersection is added in twice, we subtract out the intersection.

Joint Events
The simultaneous occurrence of two events is called a joint event.
The probability of a joint event P(A and B) is called a joint probability
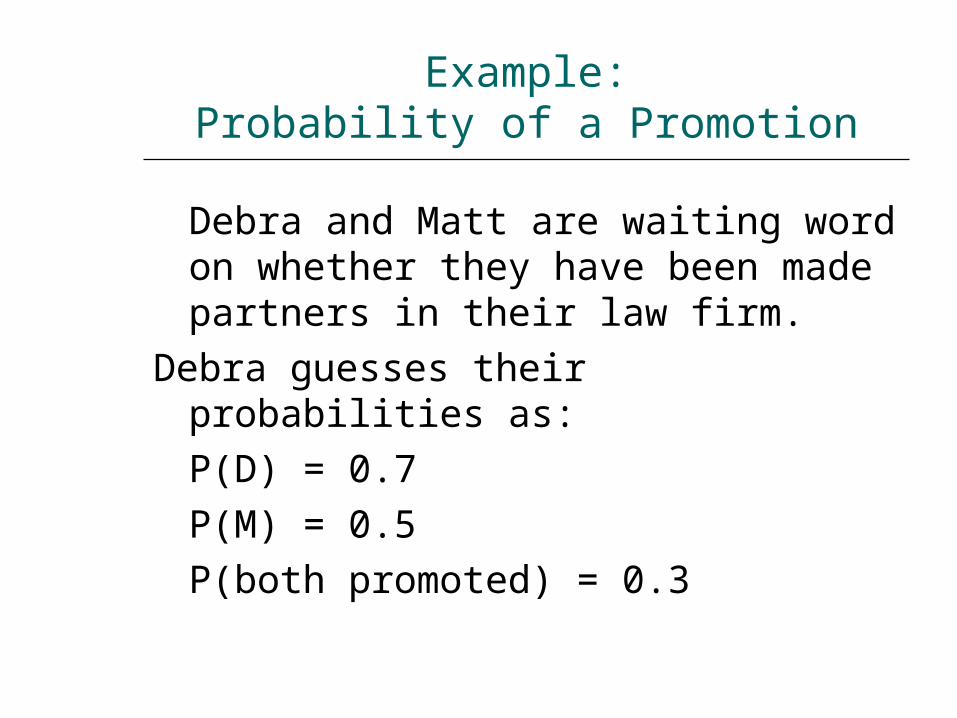
Example:Probability of a Promotion
Debra and Matt are waiting word on whether they have been made partners in their law firm.
Debra guesses their probabilities as:P(D) = 0.7P(M) = 0.5P(both promoted) = 0.3

P(at least one is promoted)
= P(D or M)
= P(D) + P(M) – P(D and M) = 0.7 + 0.5 - 0.3= 0.9

What is the probability neither is promoted?
This is is the complement ofP(at least one is promoted)c = 1 – 0.9= 0.1

Venn diagram and probabilities
Discuss joint probabilities in diagram: P(D and MC)
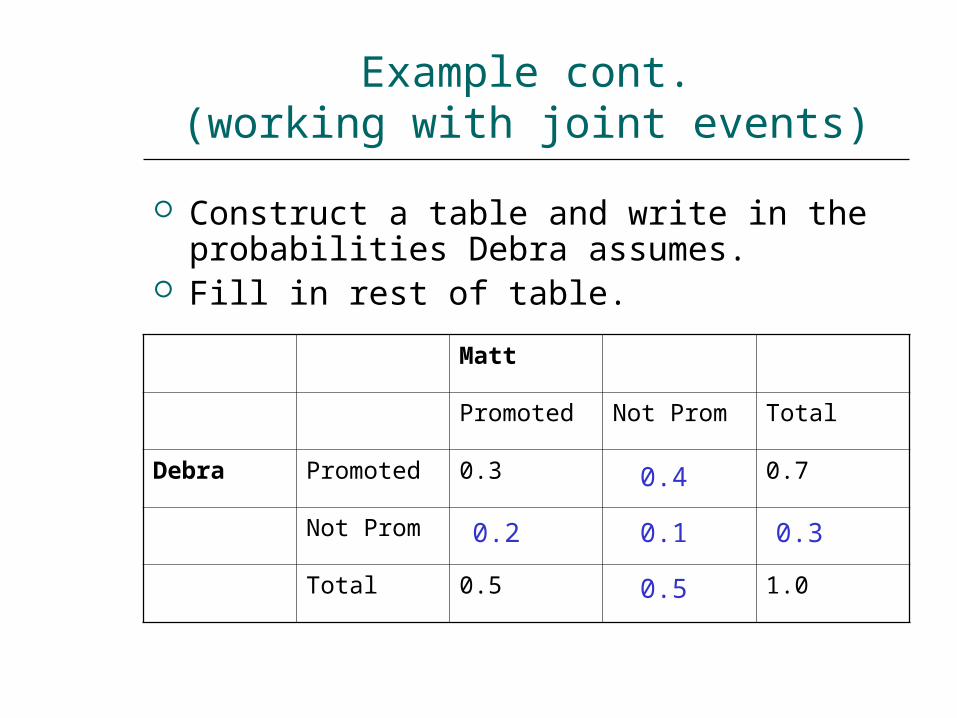
Example cont.(working with joint events)
Construct a table and write in the probabilities Debra assumes.
Fill in rest of table.
Matt
Promoted Not Prom Total
Debra Promoted 0.3 0.7
Not Prom
Total 0.5 1.0
0.4
0.2 0.1
0.5
0.3

Express verbally the following probabilities.
P(D and M) = 0.30P(Deborah and Matt are both promoted)
P(D and MC ) = 0.40P(Deborah is promoted and Matt is not)
P(DC and M) = 0.20P(Deborah is not promoted and Matt is)
P(DC and MC) = 0.10P(Deborah and Matt are both not promoted)
Note: the joint probabilities add to 1.

Venn Diagrams and Probability Because Venn diagrams have uses in other
branches of mathematics, some standard vocabulary and notation have been developed.
Probability R
ules
The complement AC contains exactly the outcomes that are not in A.
The events A and B are mutually exclusive (disjoint) because they do not overlap. That is, they have no outcomes in common.

Venn Diagrams and ProbabilityP
robability Rules
The intersection of events A and B (A ∩ B) is the set of all outcomes in both events A and B.
The union of events A and B (A ∪ B) is the set of all outcomes in either event A or B.

Two-Way Tables and Probability (sm grp) When finding probabilities involving two events, a two-way
table can display the sample space in a way that makes probability calculations easier.
Suppose we choose a student at random. Find the probability that the student P
robability Rules
(a)has pierced ears.
(b)is a male with pierced ears.
(c) is a male or has pierced ears.
Define events A: is male and B: has pierced ears.

Probability R
ules(a)has pierced ears.
(b)is a male with pierced ears.
(c)is a male or has pierced ears.We want to find P(male or pierced ears), that is, P(A or B). There are 90 males in the class and 103 individuals with pierced ears. However, 19 males have pierced ears – don’t count them twice! P(A or B) = (19 + 71 + 84)/178. So, P(A or B) = 174/178
We want to find P(male and pierced ears), that is, P(A and B). Look at the intersection of the “Male” row and “Yes” column. There are 19 males with pierced ears. So, P(A and B) = 19/178.
Each student is equally likely to be chosen. 103 students have pierced ears. So, P(pierced ears) = P(B) = 103/178.


