+ All Categories
Home > Documents > Ventilator-associated events: a patient safety opportunity Michael Klompas MD, MPH, FRCPC, FIDSA...

Ventilator-associated events: a patient safety opportunity Michael Klompas MD, MPH, FRCPC, FIDSA...

Date post: 29-Dec-2015
Category:
Upload: mavis-hicks
View: 213 times
Download: 0 times
Share this document with a friend
Popular Tags:
59
Ventilator-associated events: a patient safety opportunity Michael Klompas MD, MPH, FRCPC, FIDSA Harvard Medical School, Harvard Pilgrim Health Care Institute, and Brigham and Women’s Hospital, Boston, MA CUSP for Mechanically Ventilated Patients April 8, 2014
Transcript

Ventilator-associated events:a patient safety opportunity

Michael Klompas MD, MPH, FRCPC, FIDSA

Harvard Medical School, Harvard Pilgrim Health Care Institute, and

Brigham and Women’s Hospital, Boston, MA

CUSP for Mechanically Ventilated PatientsApril 8, 2014

Disclosures

Honoraria from Premier Healthcare Alliance for lectures on VAP surveillance

Critical Care Medicine 2013;41:2467-2475

Outline

• VAE – how did we get here?

• Limitations of VAP surveillance• VAE: morbidity and clinical correlates

• Preventing VAEs

• Can better surveillance drive better care?

States with mandatory reporting legislation for healthcare-associated infections

Association for Professionals in Infection Control and Epidemiology 2012

Mandatory reporting enacted

Study bill

“Centers for Medicare and Medicaid Services (CMS)announced its decision to cease paying hospitals for some of the

care made necessary by ‘preventable complications’”

CDC’s old surveillance definition for VAP

Patient must fulfill each of the three categories below:ChestRadiograph

Any one of the following:1. New, progressive, or persistent infiltrate2. Consolidation3. Cavitation

Systemic Signs

Any one of the following:1. Temperature >38°C2. WBC <4,000 or >12,000 WBC/mm3

3. For adults 70 years old, altered mental status with no other recognized cause

Pulmonary Signs

Any two of the following:1. New onset of purulent sputum, or change in character

of sputum, or increased respiratory secretions, or increased suctioning requirements

2. New onset or worsening cough, or dyspnea, or tachypnea

3. Rales or bronchial breath sounds4. Worsening gas exchange, increased oxygen

requirements, or increased ventilation demand

Complicated

Labor Intensive

Subjective

Non-Specific

“Diffuse patchy airspace disease right greater than left with obliteration of both hemi-diaphragms. Opacities possibly slightly increased since yesterday accounting for changes in patient position and inspiration. This could represent atelectasis, pneumonia, or effusion.”

Sources of fever and infiltrates

ARDS

Diffuse alveolar damage

Thromboembolic disease

Hemorrhage

Infarction

Fibrosis

Carcinoma

Lymphoma

Contusion

Tracheobronchitis

CLABSI

UTI

Drug fever

Meduri, Chest 1994; 106:221-235Petersen, Scand J Infect Dis 1999; 31:299-303

Pulmonary edema

Atelectasis

Contusion

Fibrosis

PLUS

Accuracy of clinical diagnosis of VAPRelative to 253 autopsies

80%

100%

Sen

sit

ivit

y /

P

osit

ive P

red

icti

ve V

alu

e

60%

40%

20%

0%PositivePredictiv

eValue

Tejerina et al., J Critical Care 2010;25:62

Sensitivity

Loose definition:Infiltrate and 2 of temp / wbc / purulence

Strict definition:Infiltrate and 3 of temp / wbc / purulence

Accuracy of quantitative BAL culturesRelative to histology

80%

100%

Sen

sit

ivit

y /

P

osit

ive P

red

icti

ve V

alu

e

60%

40%

20%

0%PositivePredictiv

eValue

Kirtland, Chest 1997;112:445Fabregas, Thorax 1999;54:867

Chastre, Am Rev Respir Dis 1984;130:924Torres, Am J Resp Crit Care Med 1994;149:324

Marquette, Am J Resp Crit Care Med 1995;151:1878Papazian, Am J Resp Crit Care Med 1995;152:1982

Sensitivity

Implications for surveillance

Interobserver agreement in VAP surveillance

7

IP 1 (11 VAPs)

IP 2(20 VAPs)3

30

1 7

5

IP 3 (15 VAPs)

Klompas, AJIC 2010:38:237Kappa = 0.40

50 ventilated patients with respiratory deterioration

Impact of diagnostictechnique on VAP rates53 patients with clinically suspected VAP

Endotracheal

aspirate(any

growth)

Endotracheal

aspirate>106 CFU/ml

Bronchoalveolar

lavage>104 CFU/ml

80

100

60

40

20

0

% o

f p

atie

nts

wit

h p

os

itiv

e c

ult

ure

s

Morris, Thorax 2009;64:516

24

30

18

12

6

0

VA

Ps

pe

r 100

0 ve

ntila

tor-d

ays

Ways to lower VAP ratesWithout meaningfully changing patient care

1. Narrowly interpret subjective clinical signs

2. Narrowly interpret radiographs

3. Seek consensus between multiple IP’s

4. Allow clinicians to veto surveillance determinations

5. Increase use of quantitative BAL for diagnosis

Klompas, Clin Infect Dis 2010:51:1123-26Klompas, Am J Infect Control 2012;40:408-10

National VAP ratesUnited States, 2004-2011

2002 2003 2004 2005 2006 2007 2008 2009 2010 2011 20120

2

4

6

8

10

VA

Ps

per

100

0 ve

nt-

day

s

Source: CDC NNIS and NHSN

SICUs

MICUs

International VAP Rates

Italy

Austria

Scotla

nd

France

Spain

Belgiu

m

USA Surg

ical

USA Med

ical

0

4

8

12

16

20

Mea

n V

AP

Rat

e

Source: CDC Europe and CDC USA

Increasing gap between clinical and surveillance VAP rates

Thomas et al. Am Surgeon 2011;77:998Skrupky et al. Crit Care Med 2012;40:281

Koulenti et al. Crit Care Med 2009;37:2360Vincent et al. JAMA 2009;302:2323

0

20

40

60

80

100Clinical Diagnosis Surveilance Diagnosis

15% of ICU pts on

VAP Rx on cross-sectional surveys

No.

of

Pat

ient

s

We need to publicly report VAP rates to catalyze

improved quality of care and save lives!

But the definition of VAP is ambiguous, hard to

implement, and open to be gamed!

Where does this leave hospitals?

An alternative approach to surveillance

Broaden the focus from pneumonia alone to the syndrome of ventilator complications in general

• More accurate description of what can be reliably determined using surveillance definitions

• Emphasizes the importance of preventing all complications of mechanical ventilation, not just pneumonia

Streamline the definition using quantitative criteria

• Reduce ambiguity• Improve reproducibility• Enable electronic collection of all variables

VACVentilator-Associated Condition

IVACInfection-related

Ventilator-Associated Complication

PossiblePneumonia

ProbablePneumonia

Ventilator-associated conditions (VAC)

DatePEEP(min)

FiO2(min)

Jan 1 10 100

Jan 2 5 50

Jan 3 5 40

Jan 4 5 40

Jan 5 8 60

Jan 6 8 50

Jan 7 8 40

Jan 8 5 40

Jan 9 5 40

VAC

Sustained rise in daily minimum PEEP or FiO2 after a period of stable or improving daily minimum PEEP or FiO2

Infection-related ventilator-associated complications (IVAC)

DatePEEP(min)

FiO2(min)

Tmin

Tmax

WBCmin

WBCmax

Antibiotic Antibiotic

Jan 1 10 100

Jan 2 5 50

Jan 3 5 40 99.1 99.9 8.4 10.1

Jan 4 5 40 99.9 101.9 9.9 11.2 Linezolid Cefepime

Jan 5 8 60 98.6 102.2 12.1 15.3 Linezolid Cefepime

Jan 6 8 50 98.8 100.3 14.1 17.4 Cefepime

Jan 7 8 40 96.8 99.1 15.0 16.1 Cefepime

Jan 8 5 40 Cefepime

Jan 9 5 40 Cefepime

IVAC

VAC with concurrent abnormal temp or WBC countAND ≥4 days of new antibiotics

Ventilator-associated pneumonia

DatePEEP(min)

FiO2(min)

Gram StainPolys

Gram Stain Epis

Culture

Jan 1 10 100

Jan 2 5 50

Jan 3 5 40

Jan 4 5 40 3+ 0 Klebsiella pneumoniae

Jan 5 8 60

Jan 6 8 50

Jan 7 8 40

Jan 8 5 40

Jan 9 5 40

PROBABLE VAP

IVAC with concurrent purulent sputum (Gram stain neutrophils)and / or positive pulmonary cultures

http://www.cdc.gov/nhsn/VAE-calculator

VAE Web ServiceUpload a CSV or XML file to CDC:

OR

Get back this:

VAE Linelist Report

Intriguing! But many questions

1. How does VAC compare to VAP?

2. What are the clinical correlates of VAC

3. Are these clinically meaningful complications?

4. Are these things preventable?

VAC9.9 events

per 1000 vent days

VAP10.6 events

per 1000 vent days

VS

100 39 109

Muscedere et al. Chest 2013;ePub ahead of print

Canadian Critical Care Trials Group ABATE Study11 ICUs, 1330 patients, VAC vs VAP Surveillance

VAC ≠ VAP

Image from http://img.ehowcdn.com/article-new/ehow/images/a07/86/tp/increase-torque-cars-rear-end-800x800.jpg

Qualitative analysis of 147 VACsRoyal Brisbane & Women’s Hospital, Queensland, Australia

Pneumonia38%

Edema26%

Atelectasis15%

ARDS 6%

Abx + Furosemide 6%

Other 8%Hayashi et al. Clin Infect Dis 2013;56:471-477

VAC = VAP + CHF + ARDS + Atelectasis +Others

Attributablemortality and morbidity

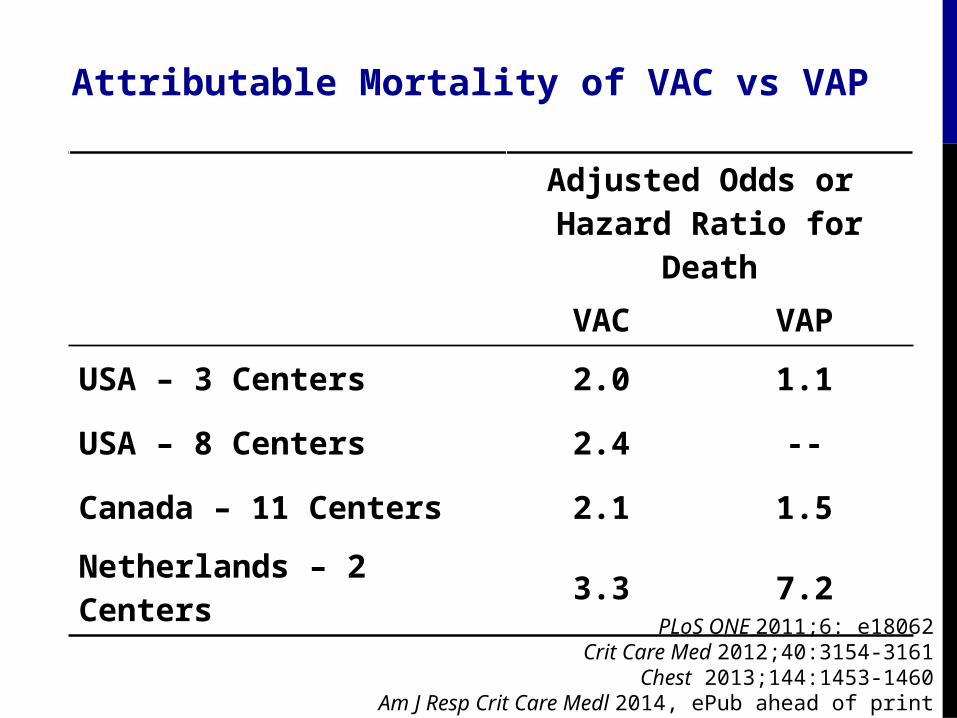
Attributable Mortality of VAC vs VAP

Adjusted Odds or Hazard Ratio for

Death

VAC VAP

USA – 3 Centers 2.0 1.1

USA – 8 Centers 2.4 --

Canada – 11 Centers 2.1 1.5

Netherlands – 2 Centers

3.3 7.2

PLoS ONE 2011;6: e18062Crit Care Med 2012;40:3154-3161

Chest 2013;144:1453-1460Am J Resp Crit Care Medl 2014, ePub ahead of print

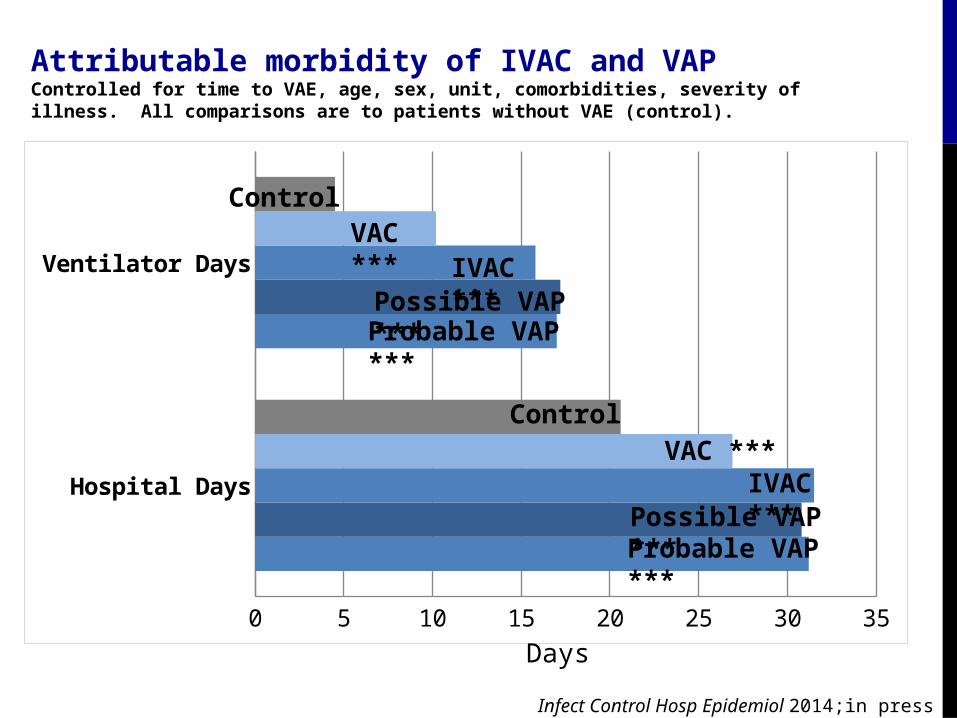
Attributable morbidity of IVAC and VAPControlled for time to VAE, age, sex, unit, comorbidities, severity of illness. All comparisons are to patients without VAE (control).

Hospital Days

Ventilator Days

0 5 10 15 20 25 30 35

ControlVAC ***

IVAC ***Possible VAP ***Probable VAP ***

ControlVAC ***

IVAC ***Possible VAP ***Probable VAP ***

Days

Infect Control Hosp Epidemiol 2014;in press

Preventability

Baseline 6 months 15 months 24 months0

20

40

60

80

100

Oral Intubation Closed Suctioning SystemETT with Subglottic Drainage Vent Circuit ChangesHeated Humidifier Changes Suction System ChangesHOB elevation CHG mouthwash

Co

nco

rdan

ce (

% o

f p

atie

nts

)

Canadian Critical Care Trials Group ABATE StudyEnhanced care for vented patients, 11 ICUs, 1330 patients

Sinuff et al. Crit Care Med 2013;41:15-23

Canadian Critical Care Trials Group ABATE StudyEnhanced care for vented patients, 11 ICUs, 1330 patients

Muscedere et al. Chest 2013;144:1453-1460

Baseline 6 months 15 months 24 months0

4

8

12

16VAC Rate (trend P=.05)

VA

Cs

per

100

pat

ien

ts

How do we get there?

Zero VAC

http

://w

ww

.mac

robe

rt.o

rg/a

sset

s/im

ages

/Film

/May

%20

2013

/Wiz

ardO

fOz_

214P

yxur

z.jp

g

Canadian Critical Care Trials Group Multivariate analysis of risk factors for VAC

Variable Odds Ratio(95% CI)

P-value

APACHE II score 0.92 (0.82, 1.04) 0.17

Hospital days to ICU admission 1.09 (0.99, 1.20) 0.09

% ventilator days with SBTs 0.97 (0.94, 1.01) 0.10

% ventilator days with SATs 0.93 (0.99, 1.04) 0.05

% ventilator days with CHG oral care 1.02 (0.99, 1.04) 0.18

Muscedere et al. Chest 2013;144:1453-1460

Risk factors for VAC and IVAC

Case control study to identify potentially modifiable risk factors for VAC and IVAC

Patient with VAC matched to patients without VAC

• Matched on age, sex, unit type, Charlson score, and time to VAC

• 110 cases, 110 controls

• 38 of the 110 VAC patients met IVAC criteria

Evaluated vent bundle adherence, sedatives, analgesics, paralytics, nutrition, blood products, fluid balance, vent modes, tidal volumes…

Lewis et al., Crit Care Med 2014; in press

Multivariate Analysis

Risk factors for VAC Odds Ratio 95% CI

Mandatory ventilator mode (AC, PC, VC) 3.4 1.6-8.0

3-day net fluid balance (per liter) 1.2 1.0-1.4

Propofol 0.5 0.2-1.1

History of congestive heart failure 0.4 0.2-1.0

Risk factors for IVAC

Benzodiazepines 5.0 1.3-29

Total opioids 3.3 0.9-16

Paralytics 2.3 0.8-8.0

Lewis et al., Crit Care Med 2014; in press

Strategies for preventing VAEs

Decrease duration of mechanical ventilation

Target the primary

conditions associated with VAC

Strategies for preventing VAEs

Decrease duration of mechanical ventilation

Target the primary

conditions associated with VAC

Minimize sedation

Early mobility

ETT with subglottic suction

Low tidal volume ventilation

Conservative fluidmanagement

Minimize blood transfusions

Enhanced prevention of VAEs

Duration of Ventilation

Pneumoni

a

Atelectasi

s

ARDS

Pulmonary Edema

Paired SATs and SBTs

Early Mobility

ETTs with subglottic drainage

Low tidal volume ventilation

Conservative fluid management

Minimize blood transfusions

Strong evidence from RCTs and/or meta-analyses

Probable but not proven

Conservative fluid management

http://microgravity.grc.nasa.gov/SOPO/ICHO/HRP/ExMC/IVFluids/images/IVbag.jpg

About a third of VACs are due to pulmonary edema

Elevated central venous pressures associated with increased mortality rates

Randomized controlled trial showing conservative fluid management associated with more ventilator-free days compared to liberal fluid management

Boyd et al., Crit Care Med 2011;39:259ARDSnet, NEJM 2006;354:2564

BNP Driven Fluid Management• Randomized controlled

trial of ventilator weaning

• 304 patients randomized to daily BNP levels versus usual care

• Patients randomized to daily BNP levels• More diuretics• More negative fluid balance• Less time to extubation• 50% fewer VACs

0%

4%

8%

12%

16%

20%

UsualCare

DailyBNP

P=.02

Dessap et al. Chest 2014; ePub ahead of print

Time for a new ventilator bundle?

Endotracheal tubes with subglottic secretion

drainage

Paired daily spontaneous awakening &

breathing trials

Early mobility

Conservative fluid management strategy

Conservative blood transfusion strategy

Low tidal volume lung ventilation

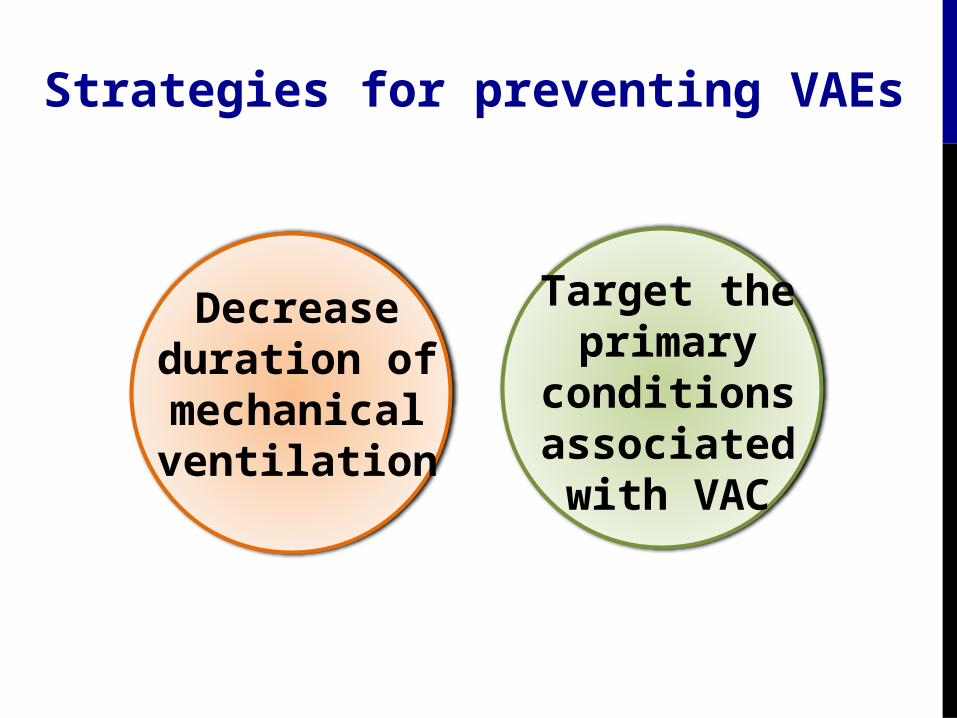
• VAC intentionally seeks all complications of mechanical ventilation severe enough to require sustained increases in ventilator support

• VAC ≠ VAP. Most cases are attributable to:

• Pneumonia• Pulmonary edema• ARDS• Atelectasis

• Powerful predictor of adverse outcomes (increased ventilator days, hospital days, and mortality)

• Emerging evidence of preventability but we probably need a new ventilator bundle that specifically targets the fuller array of conditions associated with VAC

Summary

Ventilator-associated eventsA patient safety opportunity

Broaden Awareness

• VAE surveillance provides hospitals with a fuller picture of serious complications in mechanically ventilated patients

Catalyze Prevention

• A significant portion of VAEs are likely preventable

Reflect and Inform Progress

• VAE surveillance provides an efficient and objective yardstick to track one’s progress relative to oneself and to peers

NEJM 2013;368:1472

Thank You!

Michael Klompas ([email protected])

Next Steps: Technical

Continue using:

• Spontaneous Awakening and Breathing Trials (SAT/SBT)

• RASS/SAS

• CAM-ICU/ASE

Next Steps: Adaptive

• Continue regular CUSP Team meetings

• Continue entering HSOPS data

• By May 6 call:

• Identify 3 barriers to mobilizing patients and brainstorm ways to address the barriers.

Already Completed Steps

• CUSP Team assembled and meeting regularly

• Pre-Mortem conducted and discus

• Viewed the Science of Safety Video


Recommended