21
VENTURA COUNTY AIR POLLUTION CONTROL DISTRICT PM 2.5 MONITORING NETWORK PLAN Prepared By Monitoring and Technical Services Division Ventura County Air Pollution Control District June 1998
| Date post: | 10-May-2018 |
| Category: |
Documents |
| Upload: | duongduong |
| View: | 215 times |
| Download: | 0 times |

VENTURA COUNTY AIR POLLUTION CONTROL DISTRICT
PM2.5 MONITORING NETWORK PLAN
Prepared By
Monitoring and Technical Services DivisionVentura County Air Pollution Control District
June 1998

TABLE OF CONTENTS
Page1.0 Introduction .................................................................................................................1-1
1.1 Physical Setting....................................................................................................1-11.2 Population Characteristics....................................................................................1-31.3 Climate and Weather............................................................................................1-41.4 Dominant Economic Activities and Emission Sources ..........................................1-71.5 PM2.5 Monitoring Requirements...........................................................................1-8
2.0 PM2.5 Monitoring Network Elements ............................................................................2-12.1 PM2.5 Monitors Planned for Deployment..............................................................2-12.2 Existing Particulate Matter Monitors....................................................................2-22.3 PM2.5 Quality Assurance ......................................................................................2-22.4 Laboratory Analysis.............................................................................................2-2
3.0 PM2.5 Monitoring Sites to be Deployed in 1998 ............................................................3-13.1 Monitor Siting .....................................................................................................3-13.2 Site Descriptions..................................................................................................3-2
4.0 PM2.5 Monitoring Sites to be Deployed in 1999 ............................................................4-14.1 Monitoring Sites Operating PM2.5 FRM Monitors ................................................4-14.2 PM2.5 Chemical Speciation Sampling....................................................................4-24.3 Continuous PM2.5 Monitoring ..............................................................................4-3
5.0 Sampling Frequency .....................................................................................................5-15.1 PM2.5 FRM Sampling Frequency..........................................................................5-15.2 PM2.5 Chemical Speciation Sampling Frequency...................................................5-25.3 PM10 Sampling Frequency....................................................................................5-2
Appendix A Sampling Site Maps

Ventura County Monitoring Planning AreaChapter 1 - Page 1
Ventura County Air Pollution Control DistrictPM2.5 Monitoring Network Plan
June 1998
1.0 INTRODUCTION
In July 1997, the U.S. Environmental Protection Agency (USEPA) promulgated new NationalAmbient Air Quality Standards (NAAQS) for fine particulate matter (PM2.5). A first step inaddressing these new standards will be the deployment of a new monitoring network tocharacterize PM2.5 air quality and to determine compliance with the NAAQS.
The new PM2.5 federal regulations require that PM2.5 Monitoring Network Plans be developed andsubmitted to USEPA for approval. The California Air Resources Board (CARB) will besubmitting the State Particulate Matter (PM) Monitoring Network Description to the USEPA, asrequired, by July 1, 1998. The CARB submittal will be a single document in summary formatwith separate sections included as appendices, one section for each of the designated MonitoringPlanning Areas (MPAs) in California.
Ventura County is a designated MPA. The Ventura County Air Pollution Control District(VCAPCD) is responsible for the development of the PM2.5 Network Plan for Ventura County.
This document is the PM2.5 Monitoring Network Plan for Ventura County.
The following are statewide elements of the PM2.5 Monitoring Network Plan that are herebyincluded by reference:
• A description of the statewide Monitoring Planning Areas. The statewide summary willbriefly describe the MPAs that have been defined for the State and summarize the justificationfor these MPAs;
• A schedule for implementing quality assurance aspects of the statewide monitoring plans; • A summary of the existing particulate matter monitoring network in the State; and • Justification for deferring the discussion of Community Monitoring Zones to a later date. 1.1 Physical Setting
Ventura County is located along the southern portion of the central California coast betweenSanta Barbara and Los Angeles Counties. Its diverse topography is characterized by mountainranges to the north, two major river valleys (the Santa Clara, which trends east-west, and theVentura, which trends roughly north-south), and the Oxnard Plain to the south and west.
The “north half” of the county is mountainous and sparsely populated. The “south half” includesthe populated areas where the VCAPCD has an established ambient air monitoring network. Thesouth half of the County includes the Oxnard Plain, with the cities of Oxnard and Ventura, as well

Ventura County Monitoring Planning AreaChapter 1 - Page 2
as four distinct inland valleys: the Simi Valley, the Conejo Valley (Thousand Oaks area), theSanta Clara River Valley, and the Ojai Valley.
Generally, steep hills border the inland valleys. Bluffs dominate the coastline north of the mouthof the Ventura River, while the coastline south of the Ventura River to Point Mugu is near sealevel. The Santa Monica Mountains rise above the Oxnard Plain and continue east into LosAngeles County.
The south half of the County has ten incorporated cities, some unincorporated, populated areas,and includes urban and agricultural areas. Outside of the urban and agricultural areas, thecountryside is dominated by sage brush, chaparral scrub, and oak forest plant communities typicalof a Mediterranean climate. These generally cover the lower hillsides and southern exposures ofhigher slopes, while conifer forests typically occur in deep valleys and on the northern slopes ofhigher elevations.
The major population centers of the County reside in the Oxnard Plain vicinity as well as the rivervalleys, the Simi Valley and the Conejo Valley. Urban areas include Oxnard/Port Hueneme,Ventura, Ojai Valley, Camarillo, Moorpark, Thousand Oaks, and Simi Valley.
Agriculture is the dominant non-urban activity in the Oxnard Plain, along much of the rivervalleys, and on the neighboring hillsides.

Ventura County Monitoring Planning AreaChapter 1 - Page 3
1.2 Population Characteristics
The following table shows the most recent Ventura County population estimates from theVentura County Planning Division of the Resource Management Agency.
Ventura County PopulationGrowth/Nongrowth Area Totals
Estimated Population Ending December 31, 1997AREAS ESTIMATED POPULATION
Camarillo, GA 63,146
Camarillo, NGA 5,431
Fillmore, GA 12,724
Fillmore, NGA 1,655
LAS Posas, NGA 3,431
Moorpark, GA 29,317
Moorpark, NGA 522
North Half, NGA 964
Oak Park, GA 12,358
Oak Park, NGA 6
Ojai, GA 24,287
Ojai, NGA 4,711
Oxnard, GA 156,355
Oxnard, NGA 6,109
Piru, GA 1,740
Piru, NGA 302
Port Hueneme, GA 21,071
Santa Paula, GA 25,834
Santa Paula, NGA 2,952
Simi Valley, GA 107,200
Simi Valley, NGA 1,902
Thousand Oaks, GA 119,321
Thousand Oaks, NGA 901
Ventura, GA 102,501
Ventura, NGA 1,761
Ahmanson Ranch, GA 331
COUNTY TOTAL 706,832
SOURCE: Ventura County RMA Planning, 2/98
Ventura County Monitoring Planning AreaChapter 1 - Page 4
1.3 Climate and Weather
The sun provides the energy to drive the winds by heating the surface of the earth and in turn theair above it. It is this heating that drives the weather in Ventura County most of the time. Thereare three major factors that influence Ventura County weather: 1) the differential heating of theland and ocean masses; 2) the large scale seasonal weather regimes; and 3) the local topography.
The first major influence is caused by the land and ocean surfaces being heated by the radiantenergy from the sun. This in turn heats the air above the surface which causes thermal differencesby the uneven heating of the different masses of the land terrain and the ocean. The air is heatedby the sun’s energy radiating from the surfaces of hills and valleys, which draws air from theocean, creating the sea breeze, which is predominant in the daytime most of the year. The seabreeze is usually a moderately strong afternoon wind, coming from the West to the Southwest.The sea breeze usually peaks during the afternoon and decreases toward sunset as the intensity ofthe surface heating wanes later in the day. The hills and valleys begin to cool and the air abovethem also cools. During the night, this cooler air descends and flows like a slow river of airtoward the ocean. The nighttime “drainage flow” winds are usually light. The next day, as thesun rises, the process begins again.
The second primary influence on Ventura County weather is the seasonal large scale weatherpatterns. Although these large scale weather patterns may vary in intensity and specific location,they influence the local weather in a fairly predictable manner from season to season, as furtherexplained below.
Summer: During the summer months, a mound of high atmospheric pressure, called the EasternPacific High, lies over the Eastern part of the Pacific region and extends over Ventura County.The High provides a typical Northwest flow pattern over the Eastern Pacific, which is modified bythe local sea breeze and terrain to become a Westerly and/or a Southwesterly late morning toafternoon wind.
A frequent occurrence with the dominant weather pattern during the summer, especially at thecoast, are low clouds and fog during the night and morning hours. Solar heating of the interiorvalleys causes the erosion of the low clouds and fog back to the coast, and produces hazyafternoons. Drizzle frequently falls in the morning when the low clouds and fog are the thickest.The low clouds and fog are further enhanced on a larger scale as the deserts to the East heat up,drawing in the air from the Pacific Ocean. Additionally, Ventura County’s low clouds and fogcan sometimes be enhanced by the formation of the coastal eddy that occasionally forms in the“California bight”, as weather systems approach the Pacific Northwest. These coastal eddiesmaintain a circulation of low clouds and fog that can sometimes cover the Southern half ofVentura County for several days. Low clouds and fog are most prevalent from mid-May to mid-July, then decreases in intensity and duration from mid-July through mid-September. August andSeptember are typically the hottest months with only occasional low clouds and fog during theearly morning hours.
Fall: In September the local low clouds and fog become less frequent, if non-existent, giving wayto warm/hot sunny days and warm nights. Beginning in late September, a seasonal change beginswhen the “Santa Ana Winds” begin to become established. The Santa Ana Winds are comprisedof a strong, dry wind, coming from the desert. It is usually a wind from the East or Northeast,

Ventura County Monitoring Planning AreaChapter 1 - Page 5
accompanied by very low humidity. Santa Ana Winds are associated with the storm track movingSouthward toward the region. Even though the weather fronts that move into this area areevidenced at only the mid and high altitudes, following these comes the beginning of the fall SantaAna Wind season. Daytime high temperatures decrease during this season. Skies are usuallyclear from September to late October. From October to November the frequency of the SantaAna Winds increases from one every tenth day to on every fourth day, on average.
The first local rain event for Ventura County usually occurs around the end of October. Althoughthis is typically a mild event, it does indicate that the onset of winter is near. The first significantrainfall is usually in mid-November and November is typically wetter than December.
Winter: January and February are our wettest months, on average bringing two to three inches ofrainfall per month in the Southern half of the County. The Northern half of the County ismountainous and receives four to six inches of rainfall during January and February, on average.Wet and cold weather systems move into the Ventura County region every three to six days. Thetransition between these weather systems usually involve the formation of the Great Basin Highpressure area (over Idaho and Northern Nevada), causing strong Santa Ana Winds to blow fromthe Northeast at times. These wintertime Santa Ana Winds are strongest and most frequent inDecember and January. The Santa Ana Winds decrease in frequency from one every fourth day inDecember, to one every fifteenth day by the end of March.
Spring: The wet winter storms usually end by the fourth week of March. March and April arethe windiest months. The cold Low pressure areas are more frequent in early spring, although theprecipitation with these Lows drops off by the end of March. As the Eastern Pacific High beginsto build and intensify, the frequency of the cold Lows decreases by mid-April. The Santa AnaWinds are at the end of their season as well, with the last Santa Ana Wind event usually occurringin mid-May.
The third major weather influence/enhancement in Ventura County is the topography. There isthe Pacific Ocean to the West, deserts to the East, and the transverse mountain range to theNorth. In between are the local inland valleys and the coastal plain. The North half of the Countyhas mountains that reach elevations up to 8,000 ft. and are oriented West to East. Thesemountains enhance the rainfall from winter weather systems and also increase and dry out theSanta Ana Winds systems which occur from late September to mid-May. The mountains alsoprevent the marine layer from intruding too far inland and help direct the coastal eddy that formsduring the early summer months. Ventura County’s coastal plain and valleys of the South half ofthe region serve to direct the air flow to and from the ocean. The inland valleys are orientedSouthwest to Northeast. The nearby coastal hills help to contain the marine layer. The local hillsheat up in the daytime, burning off the morning low clouds and fog, then draw the sea breezeinland as the air rises from the inland valleys and hillsides. During the nights, the land cools fasterthan the ocean mass, causing a land breeze where the air flows slowly down the hills into valleystowards the ocean.
In addition to the dominant climatic and topographic features of Ventura County, it is appropriateto mention general atmospheric conditions that can be conducive to the buildup of certainpollutant concentrations. These are inversion conditions and stagnation. Inversion conditionsexist when the vertical profile of atmospheric temperature is increasing with altitude. The “base”of the inversion, or the position at which the temperature begins to increase with height, typically

Ventura County Monitoring Planning AreaChapter 1 - Page 6
is at the surface during the night, and will rise to some altitude, ranging from a few hundred feetto one or two thousand feet. During these inversion days, the base of the inversion will rise to acertain level, then stop. When this occurs, the inversion base intersects with the sides of the hillsin the inland valleys, and a “box” is formed. This box effect creates a limited volume for the airunder it to mix. Therefore, pollutants emitted during this period tend to stay within the box, andbuild up in concentration. When the inversion condition is accompanied by low winds, a generalatmospheric stagnation can occur. These conditions are most prevalent during the summer, butcan occur at other times of the year. When an inversion/stagnation condition occurs during thesummer, high ozone levels occur in the inland valleys. When the condition occurs (albeit lessfrequently) in the winter, increased carbon monoxide levels can result. It is expected that theseconditions may also be conducive to an increase in PM2.5 levels.

Ventura County Monitoring Planning AreaChapter 1 - Page 7
1.4 Dominant Economic Activities and Emission Sources Related to PM2.5
The PM2.5 in California’s air is the result of primary and secondary particulates. Primaryparticulate emissions are directly emitted from sources such as residential fireplaces, diesel trucks,forest burning, dust sources, and industrial processes. Secondary particulates form when gaseousor non-particulate substances react in the atmosphere with other substances to produce particulatematter.
The predominant sources of directly emitted PM2.5 vary regionally in California. InSouthern California, inventory estimates show that approximately 25% of PM2.5 is from mobilesources. In the San Joaquin Valley, the mobile contribution is only 9% but geologic dust sourcesare more substantial PM2.5 contributors. In the San Francisco region, fireplaces are a majorsource of PM2.5. In the Southeast Desert region, dust sources are dominant. Each region in thestate has its own unique mix of PM2.5 source contributors.
Precursors to secondary PM2.5 formation in California include oxides of nitrogen (NOx)from motor vehicles and other combustion sources, ammonia emissions, certain organicsubstances which form particulate matter, and additional emission sources. Secondary particulatelevels are highly variable and are dependent on atmospheric conditions and precursor levels forformation. For example, in some regions at certain times of the year the secondary particles cancomprise 50% or more of the total ambient measured PM2.5 concentrations. At other times, thesecondary particulates are nearly negligible. Because secondary particles form through complexand variable atmospheric processes, it is not currently possible to produce accurate secondaryparticulate emission estimates as can now be done for the primary, directly emitted PM2.5.

Ventura County Monitoring Planning AreaChapter 1 - Page 8
Major PM2.5 Sources
The following table shows the major Ventura County PM2.5 point sources.
Ventura County - Major PM2.5 Sources
Facility Name FAC ID UTM East UTM North TPY
Calmat Company 006 303.1 3794.1 4.7
SCE - Mandalay 013 292.7 3787.2 15.6
Proctor & Gamble 015 303.1 3787.0 34.9
Pacific Custom 036 312.8 3850.1 12.7
SCE - Ormond 065 300.5 3777.8 15.7
E.F. Oxnard 214 300.8 3786.0 5.4
U.S. Navy - NAWS 1207 267.0 3681.0 8.0
Ogden Power 1210 297.8 3789.0 5.7
O.L.S. Energy 1267 285.5 3805.8 6.0
1.5 PM2.5 Monitoring Requirements
For the purpose of PM2.5 Network Plan development, Ventura County has been determined to bea single Metropolitan Statistical Area (MSA) and a single Monitoring Planning Area (MPA). TheMSA and the MPA are one and the same.
The federal regulation for PM2.5 Monitoring Network Plans (40CFR58) specifies the number ofrequired “Community Oriented” (Core) PM2.5 monitoring sites, based on population and othercriteria. The Core PM2.5 monitoring sites are to be part of the State and Local Air MonitoringStations (SLAMS) network.
The regulation requires, for the Ventura County population (>500,000, <1,000,000), at least two(2) Core SLAMS for PM2.5. Ventura County is also a designated Photochemical AssessmentMonitoring Stations (PAMS) area. At least one (1) additional Core SLAMS for PM2.5 is requiredat a PAMS site if the MPA is also a PAMS area. The total number of required Core PM2.5
SLAMS for Ventura County is three (3). Additionally, Ventura County is proposing to includetwo (2) additional non-core SLAMS for PM2.5, dependent upon EPA funding. The specificproposed PM2.5 monitoring sites are discussed later in this document.

Ventura County Monitoring Planning AreaChapter 2 - Page 1
2.0 PM2.5 MONITORING NETWORK ELEMENTS
Several types of PM2.5 monitors will be part of the PM2.5 monitoring network. This sectionsummarizes the PM2.5 monitors: 1) planned for deployment in 1998 and 1999; and 2) existingparticulate matter monitors at the proposed PM2.5 sites. For a summary of particulate mattermonitoring in California outside of the PM2.5 monitoring network, please refer to the statewidesummary.
2.1 PM2.5 Monitors Planned for Deployment
To satisfy monitoring objectives of the PM2.5 program, several types of PM monitors will beneeded in California. Of these, two (2) types are proposed for Ventura County. The mostimportant objective of the PM2.5 monitoring program is developing a data base for comparison tothe annual-average and 24-hour-average PM2.5 NAAQS. Federal Reference Method (FRM)monitors will collect mass PM2.5 measurements to support area designations such as attainment ornonattainment. In addition to FRM monitors, speciation samplers will provide full chemicalcharacterization of PM2.5 data. Table 2.1.1 below shows the PM2.5 monitoring network plannedfor deployment in 1998 and 1999 in Ventura County.
Table 2.1.1 Ventura County - PM2.5 Monitoring Network
Site Location AIRS Site ID PM2.5 FRM PM2.5 Speciation PM2.5
TEOM/BAMOther PM2.5
MonitorsEl Rio-Rio MesaSchool #2
061113001 X Y --- ---
Simi Valley-Cochran St.
061112002 X Y --- ---
Thousand Oaks -Moorpark Rd.
061110007 X & XX --- --- ---
Ojai-Ojai Ave. 061111004 Y* --- --- ---Piru-2 miles sw 061110004 Y* --- --- ---Codes: X - PM2.5 monitor to be deployed in 1998
Y - PM2.5 monitor to be deployed in 1999XX - Collocated PM2.5 monitor used for precision data to be deployed in 1998*NOTE: For purposes of the 1998 official plan submittal to ARB, the Piru site is the preferred site for 1999 implementation, if only
one additional site is funded for Ventura County. Ojai is proposed for further consideration, as funding allows. Ref. discussion in Sec. 4.1 of this document.
Ventura County Monitoring Planning AreaChapter 2 - Page 2
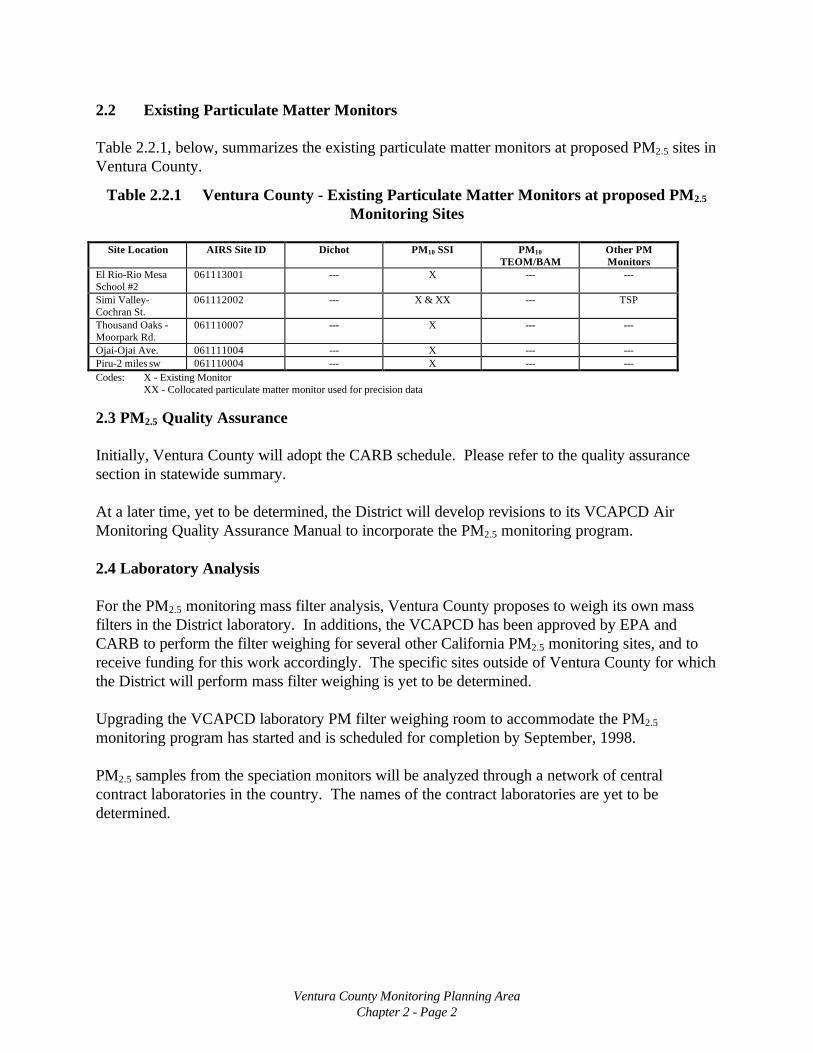
2.2 Existing Particulate Matter Monitors
Table 2.2.1, below, summarizes the existing particulate matter monitors at proposed PM2.5 sites inVentura County.
Table 2.2.1 Ventura County - Existing Particulate Matter Monitors at proposed PM2.5
Monitoring Sites
Site Location AIRS Site ID Dichot PM10 SSI PM10
TEOM/BAMOther PMMonitors
El Rio-Rio MesaSchool #2
061113001 --- X --- ---
Simi Valley-Cochran St.
061112002 --- X & XX --- TSP
Thousand Oaks -Moorpark Rd.
061110007 --- X --- ---
Ojai-Ojai Ave. 061111004 --- X --- ---Piru-2 miles sw 061110004 --- X --- ---Codes: X - Existing Monitor
XX - Collocated particulate matter monitor used for precision data
2.3 PM2.5 Quality Assurance
Initially, Ventura County will adopt the CARB schedule. Please refer to the quality assurancesection in statewide summary.
At a later time, yet to be determined, the District will develop revisions to its VCAPCD AirMonitoring Quality Assurance Manual to incorporate the PM2.5 monitoring program.
2.4 Laboratory Analysis
For the PM2.5 monitoring mass filter analysis, Ventura County proposes to weigh its own massfilters in the District laboratory. In additions, the VCAPCD has been approved by EPA andCARB to perform the filter weighing for several other California PM2.5 monitoring sites, and toreceive funding for this work accordingly. The specific sites outside of Ventura County for whichthe District will perform mass filter weighing is yet to be determined.
Upgrading the VCAPCD laboratory PM filter weighing room to accommodate the PM2.5
monitoring program has started and is scheduled for completion by September, 1998.
PM2.5 samples from the speciation monitors will be analyzed through a network of centralcontract laboratories in the country. The names of the contract laboratories are yet to bedetermined.
Ventura County Monitoring Planning AreaChapter 3 - Page 1
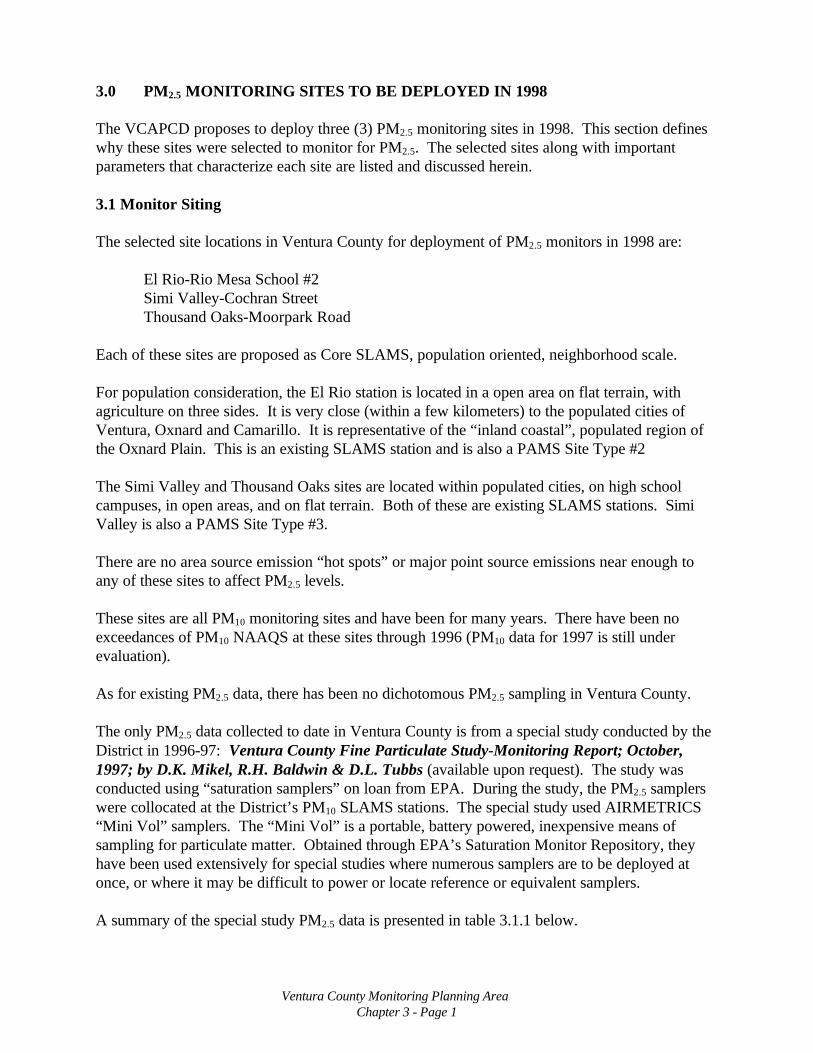
3.0 PM2.5 MONITORING SITES TO BE DEPLOYED IN 1998
The VCAPCD proposes to deploy three (3) PM2.5 monitoring sites in 1998. This section defineswhy these sites were selected to monitor for PM2.5. The selected sites along with importantparameters that characterize each site are listed and discussed herein.
3.1 Monitor Siting
The selected site locations in Ventura County for deployment of PM2.5 monitors in 1998 are:
El Rio-Rio Mesa School #2Simi Valley-Cochran StreetThousand Oaks-Moorpark Road
Each of these sites are proposed as Core SLAMS, population oriented, neighborhood scale.
For population consideration, the El Rio station is located in a open area on flat terrain, withagriculture on three sides. It is very close (within a few kilometers) to the populated cities ofVentura, Oxnard and Camarillo. It is representative of the “inland coastal”, populated region ofthe Oxnard Plain. This is an existing SLAMS station and is also a PAMS Site Type #2
The Simi Valley and Thousand Oaks sites are located within populated cities, on high schoolcampuses, in open areas, and on flat terrain. Both of these are existing SLAMS stations. SimiValley is also a PAMS Site Type #3.
There are no area source emission “hot spots” or major point source emissions near enough toany of these sites to affect PM2.5 levels.
These sites are all PM10 monitoring sites and have been for many years. There have been noexceedances of PM10 NAAQS at these sites through 1996 (PM10 data for 1997 is still underevaluation).
As for existing PM2.5 data, there has been no dichotomous PM2.5 sampling in Ventura County.
The only PM2.5 data collected to date in Ventura County is from a special study conducted by theDistrict in 1996-97: Ventura County Fine Particulate Study-Monitoring Report; October,1997; by D.K. Mikel, R.H. Baldwin & D.L. Tubbs (available upon request). The study wasconducted using “saturation samplers” on loan from EPA. During the study, the PM2.5 samplerswere collocated at the District’s PM10 SLAMS stations. The special study used AIRMETRICS“Mini Vol” samplers. The “Mini Vol” is a portable, battery powered, inexpensive means ofsampling for particulate matter. Obtained through EPA’s Saturation Monitor Repository, theyhave been used extensively for special studies where numerous samplers are to be deployed atonce, or where it may be difficult to power or locate reference or equivalent samplers.
A summary of the special study PM2.5 data is presented in table 3.1.1 below.
Ventura County Monitoring Planning AreaChapter 3 - Page 2
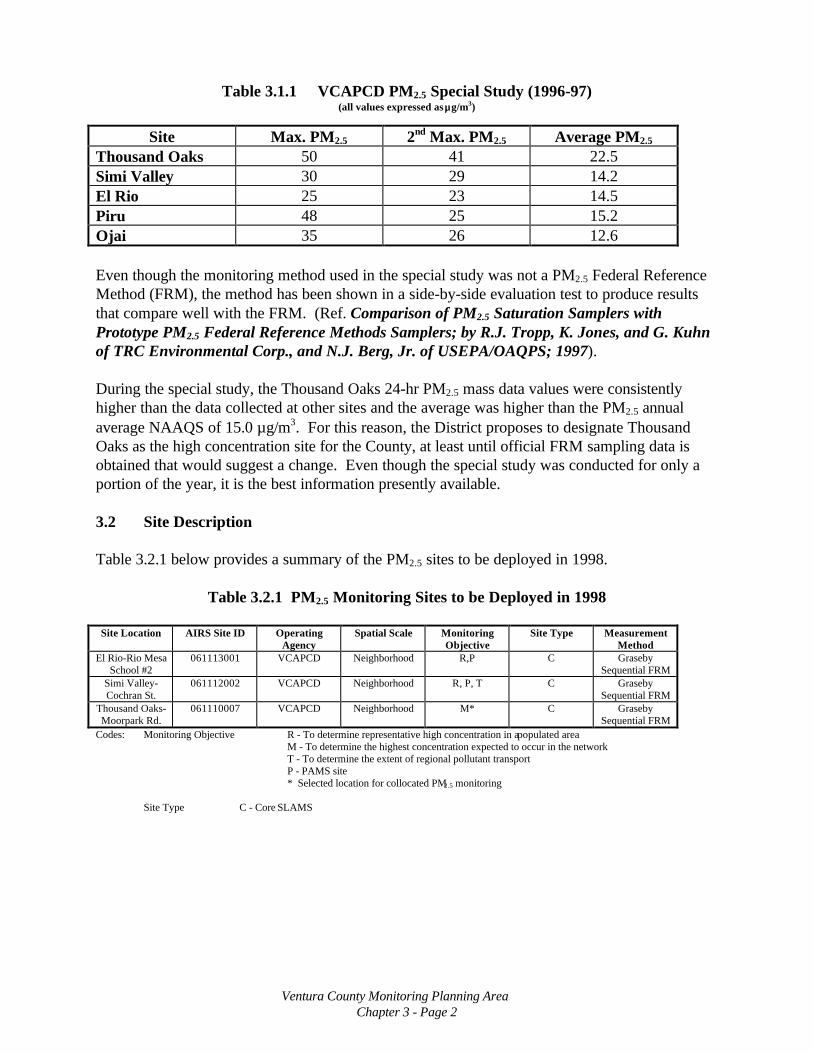
Table 3.1.1 VCAPCD PM2.5 Special Study (1996-97)(all values expressed as µµg/m3)
Site Max. PM2.5 2nd Max. PM2.5 Average PM2.5
Thousand Oaks 50 41 22.5Simi Valley 30 29 14.2El Rio 25 23 14.5Piru 48 25 15.2Ojai 35 26 12.6
Even though the monitoring method used in the special study was not a PM2.5 Federal ReferenceMethod (FRM), the method has been shown in a side-by-side evaluation test to produce resultsthat compare well with the FRM. (Ref. Comparison of PM2.5 Saturation Samplers withPrototype PM2.5 Federal Reference Methods Samplers; by R.J. Tropp, K. Jones, and G. Kuhnof TRC Environmental Corp., and N.J. Berg, Jr. of USEPA/OAQPS; 1997).
During the special study, the Thousand Oaks 24-hr PM2.5 mass data values were consistentlyhigher than the data collected at other sites and the average was higher than the PM2.5 annualaverage NAAQS of 15.0 µg/m3. For this reason, the District proposes to designate ThousandOaks as the high concentration site for the County, at least until official FRM sampling data isobtained that would suggest a change. Even though the special study was conducted for only aportion of the year, it is the best information presently available.
3.2 Site Description
Table 3.2.1 below provides a summary of the PM2.5 sites to be deployed in 1998.
Table 3.2.1 PM2.5 Monitoring Sites to be Deployed in 1998
Site Location AIRS Site ID OperatingAgency
Spatial Scale MonitoringObjective
Site Type MeasurementMethod
El Rio-Rio MesaSchool #2
061113001 VCAPCD Neighborhood R,P C GrasebySequential FRM
Simi Valley-Cochran St.
061112002 VCAPCD Neighborhood R, P, T C GrasebySequential FRM
Thousand Oaks-Moorpark Rd.
061110007 VCAPCD Neighborhood M* C GrasebySequential FRM
Codes: Monitoring Objective R - To determine representative high concentration in a populated areaM - To determine the highest concentration expected to occur in the networkT - To determine the extent of regional pollutant transportP - PAMS site* Selected location for collocated PM2.5 monitoring
Site Type C - Core SLAMS

Ventura County Monitoring Planning AreaChapter 3 - Page 3
The PM2.5 data measured at all of these sites will be compared to both the annual-average and the24-hour average PM2.5 NAAQS because each site meets the following conditions:
a) population-oriented location; andb) representative of neighborhood scale.

Ventura County Monitoring Planning AreaChapter 4 - Page 1
4.0 PM2.5 MONITORING SITES TO BE DEPLOYED IN 1999
Dependent upon sufficient EPA funding, the District proposes to establish additional PM2.5
monitoring sites in 1999 that would operate FRM monitors. The PM2.5 data from these sites willhelp better define boundaries of the attainment/nonattainment area and to provide public healthinformation. The District also plans to deploy PM2.5 chemical speciation monitors in 1999, givenapproval and sufficient funding.
4.1 Monitoring Sites Operating PM2.5 FRM Monitors
For purposes of the official submittal to ARB for the 1998 plan, one additional site fordeployment in 1999 in Ventura County is proposed as core SLAMS at the existing SLAMS site atPiru, and is summarized in Table 4.1.1 below.
Table 4.1.1 PM2.5 Monitoring Site to be Deployed in 1999 (Official ’98 ARB PlanSubmittal)
Site Location AIRS Site ID OperationAgency
Spatial Scale MonitoringObjective
Site Type MeasurementMethod
Piru-2 miles sw 061110004 VCAPCD Neighborhood R, T S R & P SingleEvent
Codes: Monitoring Objective R - To determine representative high concentration in a populated areaT - To determine the extent of regional pollutant transport
Site Type S - core SLAMS
In addition, however, the District recognizes that the actual funding and specific details for theFY99 phase are not yet determined and that there will be a network plan revision in mid-99.Subject to further consideration in 1999, the District is also proposing to add another core-SLAMS at the existing Ojai SLAMS site, should the funding become available. This is shown inTable 4.1.2 below.
Table 4.1.2 Additional Proposed PM2.5 Monitoring Site to be Deployed in 1999(Tentative, subject to further consideration)
Site Location AIRS Site ID OperatingAgency
Spatial Scale MonitoringObjective
Site Type MeasurementMethod
Ojai-Ojai Ave. 061111004 VCAPCD Neighborhood R S R & P SingleEvent
Codes: Monitoring Objective R - To determine representative high concentration in a populated area.
Site Type S - core SLAMS
The VCAPCD proposes to seek EPA funding in 1999 for adding PM2.5 sites at the existingSLAMS stations at Ojai and Piru. This will give the network more complete geographicalrepresentation, provide data to better define the attainment/nonattainment boundary in the MPA,and provide valuable public health information for the affected populations in these areas.
Ojai and Piru are located in distinct inland valleys of Ventura County. Among the separate,populated areas of the County, the Ojai Valley area is the Northern boundary, and there are about25,000 people in the area. The area around Piru represents the Northeast boundary of the MPA.Piru also represents the Santa Clara River Valley which includes the cities of Santa Paula andFillmore, as well as the community of Piru. The total population of the valley is about 45,000.
Ventura County Monitoring Planning AreaChapter 4 - Page 2
Also, the Piru station is in a transport corridor to a highly populated portion of Los AngelesCounty (Santa Clarita), to the East.
Both of these stations are located in open areas on flat terrain and both are existing SLAMSstations.
There are no area source emission “hot spots” or major point source emissions near enough tothese sites to affect PM2.5 levels.
These sites are PM10 monitoring sites and have been for many years. There have been noexceedances of PM10 NAAQS at these sites through 1996 (PM10 data for 1997 is still underevaluation).
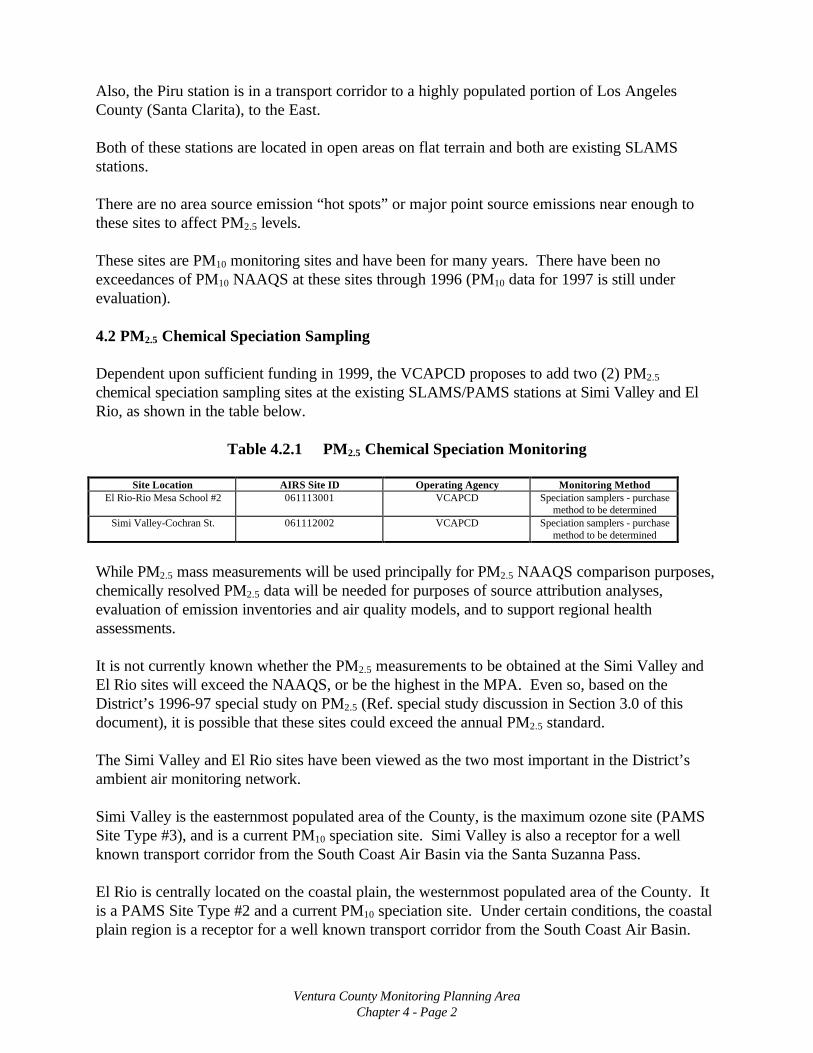
4.2 PM2.5 Chemical Speciation Sampling
Dependent upon sufficient funding in 1999, the VCAPCD proposes to add two (2) PM2.5
chemical speciation sampling sites at the existing SLAMS/PAMS stations at Simi Valley and ElRio, as shown in the table below.
Table 4.2.1 PM2.5 Chemical Speciation Monitoring
Site Location AIRS Site ID Operating Agency Monitoring MethodEl Rio-Rio Mesa School #2 061113001 VCAPCD Speciation samplers - purchase
method to be determinedSimi Valley-Cochran St. 061112002 VCAPCD Speciation samplers - purchase
method to be determined
While PM2.5 mass measurements will be used principally for PM2.5 NAAQS comparison purposes,chemically resolved PM2.5 data will be needed for purposes of source attribution analyses,evaluation of emission inventories and air quality models, and to support regional healthassessments.
It is not currently known whether the PM2.5 measurements to be obtained at the Simi Valley andEl Rio sites will exceed the NAAQS, or be the highest in the MPA. Even so, based on theDistrict’s 1996-97 special study on PM2.5 (Ref. special study discussion in Section 3.0 of thisdocument), it is possible that these sites could exceed the annual PM2.5 standard.
The Simi Valley and El Rio sites have been viewed as the two most important in the District’sambient air monitoring network.
Simi Valley is the easternmost populated area of the County, is the maximum ozone site (PAMSSite Type #3), and is a current PM10 speciation site. Simi Valley is also a receptor for a wellknown transport corridor from the South Coast Air Basin via the Santa Suzanna Pass.
El Rio is centrally located on the coastal plain, the westernmost populated area of the County. Itis a PAMS Site Type #2 and a current PM10 speciation site. Under certain conditions, the coastalplain region is a receptor for a well known transport corridor from the South Coast Air Basin.

Ventura County Monitoring Planning AreaChapter 4 - Page 3
The NAMS/SLAMS/PAMS data from the Simi Valley and El Rio sites are commonly used torepresent the ambient conditions in, and the atmospheric interactions between, the County’s twoprimary populated regions - inland valleys and coastal.
For the above reasons, the Simi Valley and El Rio sites will be ideal as PM2.5 speciation samplingsites in the Ventura County MPA.
4.3 Continuous PM2.5 Monitoring
No continuous PM2.5 monitoring is being proposed for the Ventura County MPA. The PM2.5
regulation does not require continuous monitoring in areas with less than one million population.The District believes that continuous PM2.5 monitoring could only be justified if there were higherpopulation in the MPA, along with an expectation that there will be 24-hour PM2.5 measurementsclose to or exceeding the 24-hour PM2.5 NAAQS.
Based on the results of the PM2.5 monitoring special study conducted by the District in 1996-97(Ref. special study discussion in Section 3.0 of this document), there is no expectation ofobtaining 24-hour PM2.5 measurements approaching the 24-hour NAAQS.
Given the expectation that the annual PM2.5 NAAQS will be the “controlling standard” for theVentura County MPA and that the current population is well below one million, the District doesnot propose to include continuous PM2.5 monitoring in the initial Ventura County PM2.5
Monitoring Network Plan.

Ventura County Monitoring Planning AreaChapter 5 - Page 1
5.0b SAMPLING FREQUENCY
The federal requirements call for everyday sampling for PM2.5 at certain Core SLAMS and one inthree day sampling at all other PM2.5 sites. There is also a requirement for all PM10 sites tosample on a one in three day schedule, at minimum. In order to collect sufficient data and at thesame time conserve monitoring resources, the VCAPCD is proposing alternative samplingfrequencies for PM2.5 and PM10. The following sections discuss sampling frequencies for these, aswell as for PM2.5 chemical speciation.
5.1 PM2.5 FRM Sampling Frequency
The table below presents the proposed PM2.5 FRM sampling frequencies for the Ventura CountyMPA.
Table 5.1.1 PM2.5 FRM Sampling FrequencySite Location AIRS Site ID Sampling Frequency
Required ProposedTime Period Frequency
El Rio- Rio Mesa School#2
061113001 1 in 3 day all 1 in 3 day
Simi Valley-Cochran St.
061112002 everyday all 1 in 3 day
Thousand Oads -Moorpark Rd.
061110007 everyday all 1 in 3 day
Ojai-Ojai Ave. 061111004 -- mid-1999 - on 1 in 6 dayPiru-2 mile sw 061110004 -- mid-1999 - on 1 in 6 day
For the initial Core SLAMS PM2.5 monitoring sites to be deployed in 1998 at El Rio, Simi Valleyand Thousand Oaks, the VCAPCD proposes 1 in 3 day sampling. Everyday sampling is notjustified, based on the best information available.
In the VCAPCD’s PM2.5 monitoring 1996-97 special study (Ref. special study discussion inSection 3.0 of this document), there were no 24-hour single day samples approaching the level ofthe 24-hour PM2.5 NAAQS of 65 µg/m3. The highest value obtained was 50 µg/m3, which is lessthan eighty percent of the 24-hour standard. The second highest value was 41 µg/m3, which isonly sixty-three percent of the 24-hour standard.
Considering the data from the special study, which is presently the best data available, the Districtbelieves that there is a strong likelihood that the “controlling standard” for PM2.5 in VenturaCounty will be the annual standard. We believe that less frequent than everyday sampling isappropriate at locations where the annual standard is the controlling standard and where theexpected 24-hour values are far less than the 24-hour standard. If future FRM sampling for theofficial PM2.5 monitoring program yields different results, the Network Plan can be adjustedaccordingly at a later time.
For the non-core SLAMS proposed at Ojai and Piru in mid-1999, a 1 in 6 day sampling scheduleis adequate. The District believes that less frequent sampling at non-core SLAMS that are notrequired sites is appropriate. The proposed 1 in 6 day sampling at these sites will be adequate forthe purposes of helping to define the Ventura County MPA attainment/nonattainment boundary

Ventura County Monitoring Planning AreaChapter 5 - Page 2
and to provide public health information for affected populations in these areas. If future FRMsampling for PM2.5 at these sites yields values that are approaching or exceeding NAAQS, theNetwork Plan can be adjusted accordingly at a later time.
5.2 PM2.5 Chemical Speciation Sampling Frequency
A nationwide chemical speciation network for PM2.5 is being proposed, consisting of 50 sites thatwill provide first order characterization of the metals, ions, and carbon constituents of PM2.5.These sites will be part of the National Air Monitoring Stations (NAMS) network and willprovide nationally consistent data for trends assessments, and will serve as a model for otherchemical speciation efforts. An additional 250 PM2.5 speciation sites are planned nationwide, for atotal of 300 sites in the initial PM2.5 chemical speciation network.
Based on discussions at the spring Standing Air Monitoring Work Group (SAMWG) meeting,(consisting of EPA and state and local air pollution control agency air monitoring technical staff),there was a consensus that the appropriate sampling frequency for the 50 NAMS sites should beone-in-six day sampling, at a minimum. The sampling frequency for the other 250 sites can beone-in-twelve days.
At this time, our preliminary proposal is that the VCAPCD’s Simi Valley PM2.5 chemicalspeciation site be part of the NAMS network, with one-in-six day sampling. It is also proposedthat the coastal region PM2.5 chemical speciation site at El Rio, will implement one-in-twelve daysampling.
These discussions are preliminary. The actual appropriate sampling frequencies for PM2.5
chemical speciation sites will be determined in the future.
5.3 PM10 Sampling Frequency
The U.S. EPA’s new minimum required sampling frequency for PM10, as stated in the regulation,is one-in-three days, with a waiver possible, on a case-by-case basis, to be granted by the EPAregional office. The California Air Resources Board and the local air pollution control agencies inCalifornia are requesting that U.S. EPA Region IX grant a statewide waiver, allowing PM10
sampling to continue at the current schedule of one-in-six days. This is applicable to VenturaCounty, where the 24-hour PM10 measurements do not approach the 24-hour PM10 NAAQS, andthe annual standard is the controlling standard for PM10.

Ventura County Monitoring Planning AreaAppendix A
Appendix A
Sampling Site Maps(see following pages)
• Ventura County Proposed PM2.5 Monitoring Sites• El Rio (Oxnard) SLAMS Site• Simi Valley SLAMS Site• Thousand Oaks SLAMS Site• Ojai SLAMS Site• Piru SLAMS Site


