18
VENTURE CAPITAL REPORT Venture Capital Report Europe | 4Q | 2016

V E N T U R E C A P I T A L R E P O R T
Venture Capital Report Europe | 4Q | 2016

V E N T U R E C A P I T A L R E P O R T
VENTURE CAPITAL REPORT
The following report presents Dow Jones VentureSource’s quarterly findings for European venture capital fundraising, investment, valuation,
and liquidity. The included charts and graphs offer a comprehensive view of the trends currently affecting the venture capital market.
Highlights for 4Q 2016 include:
• European venture capital fundraising increased slightly both compared to the prior quarter and to the same quarter in 2015;
• Venture capital investment into European companies increased significantly from 3Q 2016;
• The number of mergers and acquisitions (M&As) was one deal lower, but the total amount raised in M&As increased from the previous quarter;
• While the number of initial public offerings (IPOs) increased slightly, the total amount raised decreased noticeably from 3Q 2016.
2

V E N T U R E C A P I T A L R E P O R T
EUROPEAN VENTURE CAPITAL FUNDRAISING REBOUNDS IN 4Q 2016
3
FUNDRAISING
European VC Fundraising Based on multiple closings (2013–2016) 19 European venture capital funds raised
€1.60 billion during 4Q 2016. Compared with 3Q 2016, total
capital raised experienced a slight increase, while the
number of fund closings decreased by 21%.
• Compared with the same quarter last year, euros raised
remained stable, while the number of fund closings
decreased by 17%.
• Scottish Equity Partners LLP’s SEP V fund, which raised
€307 million, was the largest fund of the quarter,
accounting for 19% of the total amount raised in 4Q 2016.
4Q'13 1Q'14 2Q'14 3Q'14 4Q'14 1Q'15 2Q'15 3Q'15 4Q'15 1Q'16 2Q'16 3Q'16 4Q'16
Amount Raised (€B) € 2.74 € 1.09 € 1.73 € 1.10 € 1.97 € 1.37 € 2.14 € 1.33 € 1.54 € 2.79 € 2.71 € 1.42 € 1.60
Number of Funds 46 25 24 20 29 24 26 17 23 25 24 24 19
€ 2.74
€ 1.09
€ 1.73
€ 1.10
€ 1.97
€ 1.37
€ 2.14
€ 1.33
€ 1.54
€ 2.79 € 2.71
€ 1.42 € 1.60
0
5
10
15
20
25
30
35
40
45
50
€ 0.00
€ 0.50
€ 1.00
€ 1.50
€ 2.00
€ 2.50
€ 3.00

V E N T U R E C A P I T A L R E P O R T
LARGEST EUROPEAN VC FUNDS RAISED IN 4Q 2016
4
FUNDRAISING
Firm Name Fund Name Amount (€M) Location Offering Status
Fund Type Fund Category Closing Type
Scottish Equity Partners LLP SEP V € 307.06 Glasgow,
United Kingdom Closed
Multi-stage venture capital
Venture Capital Final
Alven Capital SA Alven Capital V € 250.00 Paris, France Closed Multi-stage venture
capital Venture Capital Final
Statoil ASA Statoil Energy Ventures € 186.25 Stavanger, Norway Closed Multi-stage venture
capital Venture Capital
Final
daphni SAS Daphni Purple € 150.00 Paris, France Closed Early-stage venture
capital Venture Capital
Final
Abingworth Management Inc. Abingworth Bioventures VII LP €109.08 London, United Kingdom Open Multi-stage venture
capital Venture Capital First
V E N T U R E C A P I T A L R E P O R T
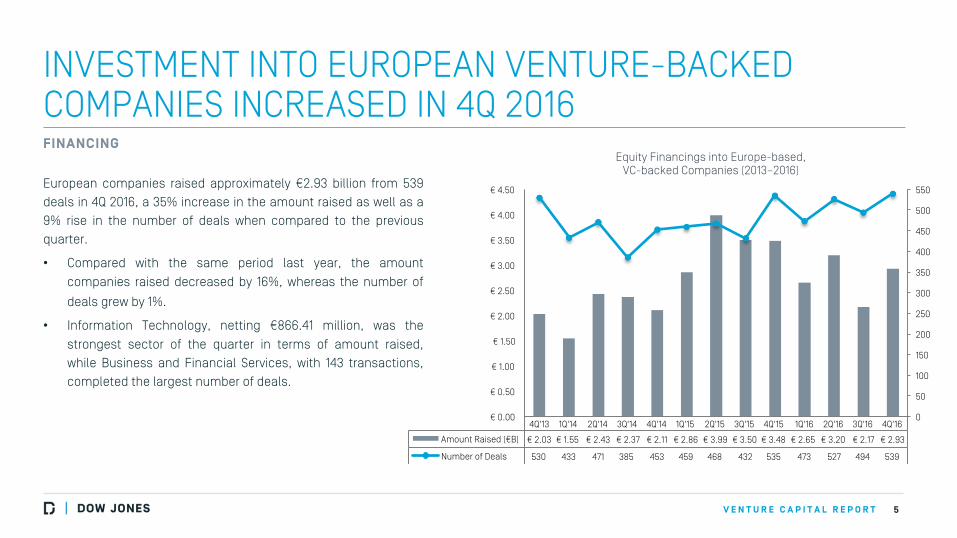
INVESTMENT INTO EUROPEAN VENTURE-BACKED COMPANIES INCREASED IN 4Q 2016
European companies raised approximately €2.93 billion from 539
deals in 4Q 2016, a 35% increase in the amount raised as well as a
9% rise in the number of deals when compared to the previous
quarter.
• Compared with the same period last year, the amount
companies raised decreased by 16%, whereas the number of
deals grew by 1%.
• Information Technology, netting €866.41 million, was the
strongest sector of the quarter in terms of amount raised,
while Business and Financial Services, with 143 transactions,
completed the largest number of deals.
5
FINANCING Equity Financings into Europe-based,
VC-backed Companies (2013–2016)
4Q'13 1Q'14 2Q'14 3Q'14 4Q'14 1Q'15 2Q'15 3Q'15 4Q'15 1Q'16 2Q'16 3Q'16 4Q'16
Amount Raised (€B) € 2.03 € 1.55 € 2.43 € 2.37 € 2.11 € 2.86 € 3.99 € 3.50 € 3.48 € 2.65 € 3.20 € 2.17 € 2.93
Number of Deals 530 433 471 385 453 459 468 432 535 473 527 494 539
0
50
100
150
200
250
300
350
400
450
500
550
€ 0.00
€ 0.50
€ 1.00
€ 1.50
€ 2.00
€ 2.50
€ 3.00
€ 3.50
€ 4.00
€ 4.50

V E N T U R E C A P I T A L R E P O R T
EQUITY FINANCINGS INTO EUROPE-BASED, VC-BACKED COMPANIES, BY ROUND CLASS (2013–2016) – NUMBER OF DEALS
6
FINANCING
4Q'13 1Q'14 2Q'14 3Q'14 4Q'14 1Q'15 2Q'15 3Q'15 4Q'15 1Q'16 2Q'16 3Q'16 4Q'16
Seed 82 45 38 34 46 34 50 38 45 45 30 36 40
First 238 229 235 191 221 231 201 209 274 221 273 242 234
Second 92 64 94 67 76 81 80 83 96 101 96 100 106
Later 80 61 78 62 61 80 106 78 78 85 91 73 88
Restart 0 0 0 1 0 0 1 0 0 0 1 0 1
0
40
80
120
160
200
240
280
320

V E N T U R E C A P I T A L R E P O R T
EQUITY FINANCINGS INTO EUROPE-BASED, VC-BACKED COMPANIES, BY ROUND CLASS (2013–2016) – AMOUNT RAISED (€M)
7
FINANCING
4Q'13 1Q'14 2Q'14 3Q'14 4Q'14 1Q'15 2Q'15 3Q'15 4Q'15 1Q'16 2Q'16 3Q'16 4Q'16
Seed € 32 € 25 € 24 € 17 € 32 € 31 € 39 € 31 € 35 € 39 € 22 € 47 € 47
First € 515 € 483 € 621 € 495 € 482 € 636 € 575 € 939 € 782 € 730 € 894 € 665 € 1,037
Second € 432 € 307 € 479 € 223 € 773 € 442 € 921 € 609 € 603 € 771 € 660 € 444 € 533
Later € 986 € 696 € 1,124 € 902 € 780 € 1,682 € 2,289 € 1,874 € 1,604 € 1,076 € 1,572 € 902 € 1,178
Restart € 0 € 0 € 0 € 1 € 0 € 0 € 1 € 0 € 0 € 0 € 2 € 0 € 1
€ 0
€ 500
€ 1,000
€ 1,500
€ 2,000
€ 2,500

V E N T U R E C A P I T A L R E P O R T
EQUITY FINANCINGS INTO EUROPE-BASED, VC-BACKED COMPANIES (2013–2016) – MEDIAN EQUITY DEAL SIZE (€M)
8
FINANCING
4Q'13 1Q'14 2Q'14 3Q'14 4Q'14 1Q'15 2Q'15 3Q'15 4Q'15 1Q'16 2Q'16 3Q'16 4Q'16
Median Equity Deal Size (€M) € 1.31 € 1.45 € 1.70 € 1.55 € 1.88 € 1.80 € 2.09 € 2.10 € 2.00 € 2.09 € 2.00 € 2.00 € 2.50
€ 0.00
€ 0.50
€ 1.00
€ 1.50
€ 2.00
€ 2.50
€ 3.00

V E N T U R E C A P I T A L R E P O R T
EQUITY FINANCINGS INTO EUROPE-BASED, VC-BACKED COMPANIES, BY INDUSTRY GROUP (4Q 2016)
Information Technology received the largest allocation of investment during 4Q
2016, raising €866.41 million through 135 deals. The sector attracted 30% of the
total amount invested and a 25% share of all deals completed in the quarter.
Healthcare ranked second in terms of euros invested. The sector garnered
€745.97 million across 81 deals. This deal flow represented 15% of all transactions
and 25% of the total amount invested into European VC-backed companies for
the quarter.
Business and Financial Services placed third, receiving €567.80 million via 143
deals. The sector’s investment figure represents 19% of the total equity financing
into European VC-backed companies for 4Q 2016.
9
FINANCING 4Q'16 Industry Breakdown By Number of Deals
4Q’16 Industry Breakdown By Amount Raised
27%
4%
24% 3%
15%
1%
25%
Business and Financial Services
Consumer Goods
Consumer Services
Energy & Utilities
Healthcare
Industrial Goods & Materials
Information Technology
19%
3%
16%
5%
25%
2%
30%
Business and Financial Services
Consumer Goods
Consumer Services
Energy & Utilities
Healthcare
Industrial Goods & Materials
Information Technology

V E N T U R E C A P I T A L R E P O R T
TOP 5 DEALS INTO EUROPEAN VC-BACKED COMPANIES (4Q 2016)
1 0
Co. Name Location Industry
Code Industry Segment
Industry Group
Brief Description
Close Date
Round Type
Raised (€M)
Round Investors (* denotes lead)
Sigfox SA Labège, France
Wireless Communications
Equipment
Communications and Networking
Information Technology
Operator of a cellular network. 18/11/2016 5th € 150.00
Air Liquide, Alto Invest, Bpifrance Investissement SAS, Elliott Associates LP, Idinvest Partners,
Individual Investor(s), Intel Capital, iXO Private Equity SAS, Salesforce Ventures, SWEN Capital
Partners, Tamer Group, Total SA
Oxford Nanopore
Technologies Ltd.
Oxford, United Kingdom
Drug Development Technologies
Biopharmaceuticals Healthcare Provider of nanopore technology. 12/12/2016 Later € 118.28 GT Healthcare*, IP Group PLC, Woodford
Investment Management LLP*
Devialet SA Paris,
France Consumer Electronics
Electronics and Computer Hardware
Information Technology
Provider of high-end amplifiers and sound amplification
technology. 29/11/2016 First Round € 100.00
Bpifrance Investissement SAS, CM-CIC Investissement, Foxconn Technology Group,
Future French Champions, Ginko Ventures Sarl*, Korleya Capital, Playground Global LLC, Renault
SA, Roc Nation LLC, Sharp Corp.
Kymab Ltd. Cambridge,
United Kingdom
Biotechnology Therapeutics
Biopharmaceuticals Healthcare Developer of human monoclonal
antibody therapeutics. 24/11/2016 4th € 94.43
Bill & Melinda Gates Foundation, Malin Corporation plc, ORI Capital Investment Advisory (Hong Kong)
Ltd.*, Shenzhen Hepalink Pharmaceutical Co. Ltd., Wellcome Trust Ltd., Woodford Investment
Management LLP
HelloFresh SE Berlin,
Germany Restaurants / Food Service
Travel and Leisure Consumer Services Provider of meal kit delivery
services. 20/12/2016 7th € 85.00 Baillie Gifford & Co. Ltd.
FINANCING

V E N T U R E C A P I T A L R E P O R T
MOST ACTIVE INVESTORS FOR EUROPE-BASED, VC-BACKED COMPANIES (4Q 2016) BY DEALS COMPLETED
1 1
FINANCING
13
11
9
8
7 7 7
0
2
4
6
8
10
12
14
16
High-Tech Gruenderfonds
Management GmbH
Bpifrance Investissement SAS
Enterprise Ireland Localglobe LLP Sunstone Capital A/S ALMI Invest AB Internet Initiatives Development Fund

V E N T U R E C A P I T A L R E P O R T
EQUITY FINANCINGS INTO EUROPE-BASED, VC-BACKED COMPANIES BY COUNTRY (4Q 2016)
The United Kingdom remained the most favoured destination for equity
financing during 4Q 2016, receiving €754.73 million across 122 deals. The
country attracted 23% of all equity financing in 4Q 2016.
France, ranked second, raised €603.15 million through 62 deals. With a 96%
increase in capital invested and a 17% drop in the number of deals from last
quarter, France garnered a 21% share of all European financing in 4Q 2016.
Germany occupied third position raising €525.06 million, or 18% of the total
amount raised for the quarter. Ireland placed fourth based on raising €220.83
million during 4Q 2016.
1 2
FINANCING Number of Deals in 4Q 2016 by Country (Top 4)
Amount Raised in 4Q 2016 by Country (Top 4)
23%
19%
23%
14%
12% 11%
40%
United Kingdom
Germany
Sweden
France
Rest of Europe
26%
21%
18%
7%
28%
United Kingdom
France
Germany
Ireland
Rest of Europe

V E N T U R E C A P I T A L R E P O R T
EUROPE 4Q 2016 VENTURE EXIT ACTIVITY
60 venture-backed M&As took place in Europe
during 4Q 2016, a 2% decrease from 3Q 2016. However,
the number of exits is 58% higher than that of 4Q 2015.
The total amount raised through European VC-backed
M&As in 4Q 2016 was €4.31 billion. This represents an
11% increase from the previous quarter and a 28%
decrease from the same quarter last year.
15 venture-backed IPOs took place during 4Q 2016, a
15% rise from 3Q 2016 but a 12% drop from last year, 4Q
2015.
1 3
LIQUIDITY
Exit Opportunities for European VC–backed Companies (2013–2016)
0 10 20 30 40 50 60 70
4Q'13
1Q'14
2Q'14
3Q'14
4Q'14
1Q'15
2Q'15
3Q'15
4Q'15
1Q'16
2Q'16
3Q'16
4Q'16
4Q'13 1Q'14 2Q'14 3Q'14 4Q'14 1Q'15 2Q'15 3Q'15 4Q'15 1Q'16 2Q'16 3Q'16 4Q'16
IPOs 9 9 22 16 10 12 17 8 17 6 10 13 15
M&As 44 56 44 51 52 56 44 48 38 53 57 61 60

V E N T U R E C A P I T A L R E P O R T
TOP 3 M&As IN EUROPE (4Q 2016)
1 4
Company Name Location Brief
Description Industry
Code Industry Segment Industry Group
Close Date
Round Type
Amount Paid (€M)
Acquirer
Skyscanner Ltd. Edinburgh,
United Kingdom Provider of an online flight search
engine. Search Portals
Consumer Information Services
Consumer Services 09/12/2016 Acquisition € 1,655.86 Ctrip.com
Ganymed Pharmaceuticals
AG Mainz, Germany
Provider of Ideal Monoclonal Antibody (IMAB) therapeutics for
solid cancers and infectious diseases.
Biotechnology Therapeutics
Biopharmaceuticals Healthcare 20/12/2016 Acquisition € 422.00 Astellas Pharma Inc.
Banca ITB SpA Milan, Italy
Provider of banking services dedicated to Italian
tobacconists.
Personal / Commercial Banking
Financial Institutions and Services
Business and Financial Services
19/12/2016 Acquisition € 153.00 Intesa Sanpaolo SpA
LIQUIDITY

V E N T U R E C A P I T A L R E P O R T
EUROPEAN VC-BACKED IPOs (2013-2016)
1 5
LIQUIDITY
The number of IPOs during 4Q 2016 increased slightly in
comparison to the prior quarter, whereas the amount raised
decreased significantly.
15 venture-backed companies went public during 4Q 2016, a
15% increase from the prior quarter.
IPOs raised €193.86 million during 4Q 2016, a drop of 60%
from the €483.22 million raised in 3Q 2016.
The largest European VC-backed IPO of 4Q 2016 was Crispr Therapeutics AG. The company raised €49.82
million for its offering on NASDAQ.
4Q'13 1Q'14 2Q'14 3Q'14 4Q'14 1Q'15 2Q'15 3Q'15 4Q'15 1Q'16 2Q'16 3Q'16 4Q'16
Raised (€M) through IPO € 366.10 € 691.24 € 542.15 € 447.47 € 2,249.97 € 417.40 € 576.70 € 699.69 € 612.93 € 130.08 € 184.48 € 483.22 € 193.86
Number of IPOs 9 9 22 16 10 12 17 8 17 6 10 13 15
0
5
10
15
20
25
€ 0.00
€ 500.00
€ 1,000.00
€ 1,500.00
€ 2,000.00
€ 2,500.00

V E N T U R E C A P I T A L R E P O R T
TOP 3 IPOs IN EUROPE (4Q 2016)
1 6
LIQUIDITY
Company Name Location Brief
Description Industry
Code Industry Segment Industry Group
Close Date
Raised through IPO (€M)
Exchange/ Symbol
Crispr Therapeutics AG
Switzerland Developer of genome-editing
technologies for the treatment of serious human genetic diseases.
Biotechnology Therapeutics
Biopharmaceuticals Healthcare 19/10/2016 € 49.82 NASDAQ: CRSP
Alligator Bioscience AB
Sweden Developer of antibody-based drugs
for immunotherapy of cancer.
Biotechnology Therapeutics
Biopharmaceuticals Healthcare 23/11/2016 € 35.81 OMX : ATORX
InDex Pharmaceuticals
Holding AB Sweden
Developer of pharmaceuticals to treat immunological diseases.
Biotechnology Therapeutics
Biopharmaceuticals Healthcare 11/10/2016 € 25.95 NASDAQ: INDEX

V E N T U R E C A P I T A L R E P O R T
ABOUT US & METHODOLOGY
Dow Jones VentureSource helps venture capitalists, corporate development executives, investment bankers and service providers find deal and
partnership opportunities, perform comprehensive due diligence and examine trends in venture capital investment, fund-raising and liquidity. It provides
accurate, comprehensive data on venture-backed companies – including their investors and executives – in every region, industry and stage of
development throughout the world.
The investment figures included in this report cover venture backed companies headquartered in Europe, and are based on aggregate findings of Dow
Jones’ proprietary research for VentureSource.
This data was collected through surveys of professional firms, interviews with company executives, and from secondary sources. To be included,
companies have to receive financing from a venture capital or private equity firm. Our figures do not include companies that have received funding solely
from individual, corporate and/or government investors. The data in this report only accounts for equity funding, not convertible debt deals.
Figures contained throughout the report are current at time of editorial but subject to change without notice. No statement herein is to be construed as a
recommendation to buy or sell securities or to provide investment advice.
1 7

V E N T U R E C A P I T A L R E P O R T
ABOUT DOW JONES
Dow Jones is a global provider of news and business information, delivering content to consumers and organizations around the world across multiple
formats, including print, digital, mobile and live events. Dow Jones has produced unrivaled quality content for more than 125 years and today has one of
the world’s largest newsgathering operations globally. It produces leading publications and products including the flagship Wall Street Journal,
America’s largest newspaper by paid circulation; Factiva, Barron’s, MarketWatch, Financial News, DJX, Dow Jones Risk & Compliance, Dow Jones
Newswires, and Dow Jones VentureSource.
MEDIA CONTACT:
Sophie Bent
+44 (0) 203 426 1381
1 8


![VENTURE CAPITAL FOR SUSTAINABILITY 2007 REPORT [2007] Venture Capital... · growing sector as Venture Capital for Sustainability ... Venture Capitalists’ stake in ... Venture Capital](https://static.documents.pub/doc/80x56/5a7926b77f8b9a00168dc540/venture-capital-for-sustainability-2007-2007-venture-capitalgrowing-sector.jpg)


