<Document Name> Protected under CASL Multi-Party NDA No. 793IP 1 CASL-U-2015-0302-000 VERA Modeling and Simulation of the AP1000 PWR Cycle 1 Depletion L3:VMA.AMA.P11.06 David Salazar, Westinghouse Fausto Franceschini, Westinghouse September 30, 2015
Transcript
<Document Name>
Protected under CASL Multi-Party NDA No. 793IP 1
CASL-U-2015-0302-000
VERA Modeling and Simulation of the AP1000 PWR Cycle 1 Depletion L3:VMA.AMA.P11.06
David Salazar, Westinghouse Fausto Franceschini, Westinghouse September 30, 2015
L3:VMA.AMA.P11.06
Official Use Only ii Protected under CASL Master NDA CASL-U-2015-0302-000
REVISION LOG
Revision Date Affected Pages Revision Description
0 09/30/2015 All Initial issuance
Document pages that are: Export Controlled ____________No______________________________________
Protected under CASL Master NDA iii Official Use Only CASL-X-2015-0302-000
EXECUTIVE SUMMARY The purpose of this report is to apply the VERA-CS code system for core physics analysis of the AP1000 Pressurized Water Reactor (PWR), specifically for hot full power (HFP) depletions. The AP1000 PWR features an advanced first core with radial and axial heterogeneities and at-power control rods insertion to perform the MSHIM™ Operation and Control Strategy. These advanced features make application of VERA-CS to the AP1000 PWR first core especially relevant to qualify VERA performance. Results are presented for quarter core depletions of the low leakage cycle 1 and coefficients of reactivity calculated at different burnups of interest. The calculations performed for this document are the natural evolution of the startup simulation work accomplished in the Westinghouse VERA Test Stand (Reference 1). A preliminary VERA-CS model based on Reference 1 was set up and executed on the ORNL Titan HPC platform. However, the results presented in this report were obtained from calculations executed on Eos. The evaluation showed that the VERA-CS code system is capable of modeling and simulating HFP depletions for the AP1000 plant Cycle 1.
AP1000 and MSHIM are trademarks or registered trademarks of Westinghouse Electric Company LLC, its affiliates and/or its subsidiaries in the United States of America and may be registered in other countries throughout the world. All rights reserved. Unauthorized use is strictly prohibited. Other names may be trademarks of their respective owners.
L3:VMA.AMA.P11.06
Official Use Only iv Protected under CASL Master NDA CASL-U-2015-0302-000
ACRONYMS ................................................................................................................................. vi
1. MILESTONE DESCRIPTION ................................................................................................1 1.1 Working Group ........................................................................................................................1
2. BACKGROUND INFORMATION .........................................................................................2 2.1 AP1000 PWR Advanced Cycle 1 ............................................................................................2 2.2 HZP Test Stand ........................................................................................................................3 2.3 Computer Codes ......................................................................................................................4
2.3.1 MPACT .......................................................................................................................4 2.3.2 CTF ..............................................................................................................................5 2.3.2 ORIGEN ......................................................................................................................5
Official Use Only vi Protected under CASL Master NDA CASL-U-2015-0302-000
ACRONYMS AFD Axial Flux Difference BOC Beginning of cycle CASL Consortium for Advanced Simulation of Light Water Reactors CHF Critical Heat Flux CTF Subchannel thermal-hydraulics code base on COBRA-TF DNB departure from nucleate boiling DOE US Department of Energy ELT Extended Leadership Team EOC End of cycle HFP Hot Full Power HPC high-performance computing HZP Hot Zero Power INL Idaho National Laboratory LWR light water reactor M&S modeling and simulation MOC method of characteristics MOC Middle of cycle OLCF Oak Ridge Leadership Computing Facility ORNL Oak Ridge National Laboratory PHI Physics Integration PWR pressurized water reactor RCCA Rod Cluster Control Assembly SLT Senior Leadership Team T/H thermal-hydraulics VERA Virtual Environment for Reactor Applications VMA Validation and Modeling Applications WEC Westinghouse Electric Company
L3:VMA.AMA.P11.06
Protected under CASL Master NDA 1 Official Use Only CASL-X-2015-0302-000
1. MILESTONE DESCRIPTION The latest application of VERA-CS (MPACT/CTF/ORIGEN) code system is used to simulate the AP1000 plant Cycle 1 HFP depletion. The work is primarily intended to show the VERA-CS capabilities and document the user experience. Additional simulations were performed to calculate the HZP Isothermal Temperature Coefficient and Moderator Temperature Coefficient. The report is concluded with identified areas for improvement from the user’s perspective.
1.1 Working Group The authors appreciate contributions and support to this milestone work from the CASL leadership teams including the Senior Leadership Team and the Focus Area Leads, and the following working group members:
Name CASL Focus Area Affiliated Organization
Andrew Godfrey PHI ORNL
Shane G. Stimpson PHI ORNL
Benjamin S. Collins PHI ORNL
Scott Palmtag PHI Core Physics, Inc.
John Turner Chief Computer Scientist ORNL This report contains results of research supported by the Consortium for Advanced Simulation of Light Water Reactors (www.casl.gov), an Energy Innovation Hub (http://www.energy.gov/hubs) for Modeling and Simulation of Nuclear Reactors under U.S. Department of Energy (DOE) Contract No. DE-AC05-00OR22725. This research also used resources of the Oak Ridge Leadership Computing Facility at the Oak Ridge National Laboratory, which is supported by the Office of Science of the U.S. DOE under Contract No. DE-AC05-00OR22725.
L3:VMA.AMA.P11.06
Official Use Only 2 Protected under CASL Master NDA CASL-U-2015-0302-000
2. BACKGROUND INFORMATION
2.1 AP1000 PWR Advanced Cycle 1 The advanced Cycle 1 is described in detail in section 4 of Reference 1. Only a high level description will be presented here. The loading pattern consists of 5 fuel regions covering a wide range of enrichments including radially zoned enrichment in 2 regions. There is also a combination of burnable absorbers; the Westinghouse integral fuel burnable absorber (IFBA) and the wet annular burnable absorber (WABA) are used. The fuel description is summarized in Table 2-1.
The AP1000 plant operates following the MSHIM control strategy, an advanced operational strategy that entails operation with multiple control rod banks inserted in the core. M-banks based on tungsten material are used for reactivity control, and standard silver-indium-cadmium (Ag-In-Cd) rods, termed AO-bank, are used for axial power distribution control. The quarter core control banks configuration is shown in Figure 2-1.
L3:VMA.AMA.P11.06
Protected under CASL Master NDA 3 Official Use Only CASL-X-2015-0302-000
Bank Number of Clusters MA ( MSHIM Control Gray Bank A ) 4 MB ( MSHIM Control Gray Bank B ) 4 MC ( MSHIM Control Gray Bank C ) 4 MD ( MSHIM Control Gray Bank D ) 4 M1 ( MSHIM Control Black Bank 1) 4 M2 ( MSHIM Control Black Bank 2) 8 AO ( AO Control Bank ) 9 S1 ( Shutdown Bank 1 ) 8 S2 ( Shutdown Bank 2 ) 8 S3 ( Shutdown Bank 3 ) 8 S4 ( Shutdown Bank 4 ) 8
TOTAL 69
Figure 2-1: Control rod locations
2.2 HZP Test Stand Reference 1 presents an extensive set of calculations including critical boron concentrations, temperature reactivity coefficients, and control bank worths at BOC HZP conditions. The results are compared between KENO and VERA-CS with good numerical agreement. The same modeling approach as discussed in Reference 1 was used here. Code limitations described in the Test Stand are shown below as they are also applicable to this analysis.
• The thermal expansion of structures in the core, including the fuel, is not being modeled by VERA-CS. The results shown in this document use cold dimensions.
AO MD M1 MB
SD1 SD3 SD2
MD MA AO SD4
SD3 SD1 M2
M1 AO MC
SD2 M2
MB SD4
L3:VMA.AMA.P11.06
Official Use Only 4 Protected under CASL Master NDA CASL-U-2015-0302-000
• The radial reflector region consists only of the baffle next to a moderator region. This was modeled using a 1-in thick stainless steel baffle reflector surrounded by water. Sensitivities performed in Reference 1 indicate the acceptable use of this simplified model.
• VERAIn did not have the capability to accept material input in the form of atomic number density at the time Reference 1 was completed. Even though this feature is available now, the material compositions are still provided by Westinghouse tools.
The VERA-CS input from Appendix G in Reference 1 was used as the starting point for this simulation. Changes and updates are discussed later in this report.
2.3 Computer Codes VERA-CS (Reference 2) includes coupled neutronics, thermal-hydraulics, and fuel temperature components with an isotopic depletion capability. The neutronics capability employed is based on MPACT, a three-dimensional (3-D) whole core transport code. The thermal-hydraulics and fuel temperature models are provided by the COBRA-TF (CTF) subchannel code. The isotopic depletion is performed using the ORIGEN code (Reference 5) from the SCALE system. An extensive multi-cycle benchmark exercise for Watts Bar Unit 1 was completed in Reference 6 which supports the use of these tools.
2.3.1 MPACT MPACT (Reference 3) is a 3-D whole core transport code that is capable of generating subpin level power distributions. This is accomplished by solving an integral form of the Boltzmann transport equation for the heterogeneous reactor problem in which the detailed geometrical configuration of fuel components, such as the pellet and cladding, are explicitly retained. The cross section data needed for the neutron transport calculation are obtained directly from a multigroup cross section library, which has traditionally been used by lattice physics codes to generate few-group homogenized cross sections for nodal core simulators. Hence, MPACT involves neither a priori homogenization nor group condensation for the full core spatial solution.
The integral transport solution is obtained using the method of characteristics (MOC), and employs discrete ray tracing within each fuel pin. MPACT provides a 3-D MOC solution; however, for practical reactor applications, the direct application of MOC to 3-D core configuration requires considerable amounts of memory and computing time associated with the large number of rays. Therefore, an alternative approximate 3-D solution method is implemented in MPACT for practical full core calculations, based on a “2D/1D" method in which MOC solutions are performed for each radial plane and the axial solution is performed using a lower-order one-dimensional (1-D) diffusion or SP3 approximation. The core is divided into several planes, each on the order of 5-10 cm thick, and the planar solution is obtained for each plane using 2D MOC. The axial solution is obtained for each pin, and the planar and axial problems are coupled through a transverse leakage. The use of a lower order 1-D solution, which is most often the nodal expansion method (NEM) with the diffusion or P3 approximation, is justified by the fact that most heterogeneity in the core occurs in the radial direction rather than the axial direction. Alternatively, a full 3D MOC solution can be performed, if the computational resources are available.
The Coarse Mesh Finite Difference (CMFD) acceleration method, which was originally introduced to improve the efficiency of the nodal diffusion method, is used in MPACT for the acceleration of the whole core transport calculation. The basic mesh in the CMFD formulation is a pin cell, which is much coarser than the flat source regions defined for MOC calculations (typically there are on the order of fifty (50) flat source regions in each fuel pin). The concept of dynamic homogenization of group constants for the pin cell is the basis for the effectiveness of the CMFD formulation to
L3:VMA.AMA.P11.06
Protected under CASL Master NDA 5 Official Use Only CASL-X-2015-0302-000
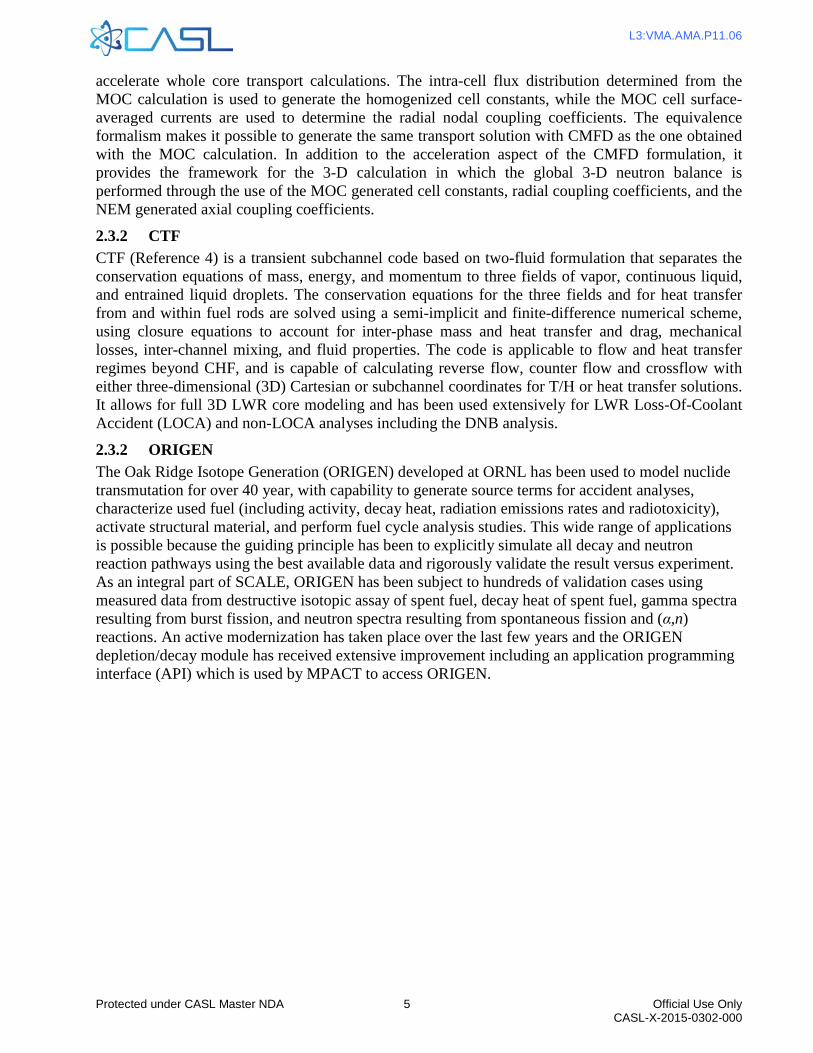
accelerate whole core transport calculations. The intra-cell flux distribution determined from the MOC calculation is used to generate the homogenized cell constants, while the MOC cell surface-averaged currents are used to determine the radial nodal coupling coefficients. The equivalence formalism makes it possible to generate the same transport solution with CMFD as the one obtained with the MOC calculation. In addition to the acceleration aspect of the CMFD formulation, it provides the framework for the 3-D calculation in which the global 3-D neutron balance is performed through the use of the MOC generated cell constants, radial coupling coefficients, and the NEM generated axial coupling coefficients.
2.3.2 CTF CTF (Reference 4) is a transient subchannel code based on two-fluid formulation that separates the conservation equations of mass, energy, and momentum to three fields of vapor, continuous liquid, and entrained liquid droplets. The conservation equations for the three fields and for heat transfer from and within fuel rods are solved using a semi-implicit and finite-difference numerical scheme, using closure equations to account for inter-phase mass and heat transfer and drag, mechanical losses, inter-channel mixing, and fluid properties. The code is applicable to flow and heat transfer regimes beyond CHF, and is capable of calculating reverse flow, counter flow and crossflow with either three-dimensional (3D) Cartesian or subchannel coordinates for T/H or heat transfer solutions. It allows for full 3D LWR core modeling and has been used extensively for LWR Loss-Of-Coolant Accident (LOCA) and non-LOCA analyses including the DNB analysis.
2.3.2 ORIGEN The Oak Ridge Isotope Generation (ORIGEN) developed at ORNL has been used to model nuclide transmutation for over 40 year, with capability to generate source terms for accident analyses, characterize used fuel (including activity, decay heat, radiation emissions rates and radiotoxicity), activate structural material, and perform fuel cycle analysis studies. This wide range of applications is possible because the guiding principle has been to explicitly simulate all decay and neutron reaction pathways using the best available data and rigorously validate the result versus experiment. As an integral part of SCALE, ORIGEN has been subject to hundreds of validation cases using measured data from destructive isotopic assay of spent fuel, decay heat of spent fuel, gamma spectra resulting from burst fission, and neutron spectra resulting from spontaneous fission and (α,n) reactions. An active modernization has taken place over the last few years and the ORIGEN depletion/decay module has received extensive improvement including an application programming interface (API) which is used by MPACT to access ORIGEN.
L3:VMA.AMA.P11.06
Official Use Only 6 Protected under CASL Master NDA CASL-U-2015-0302-000
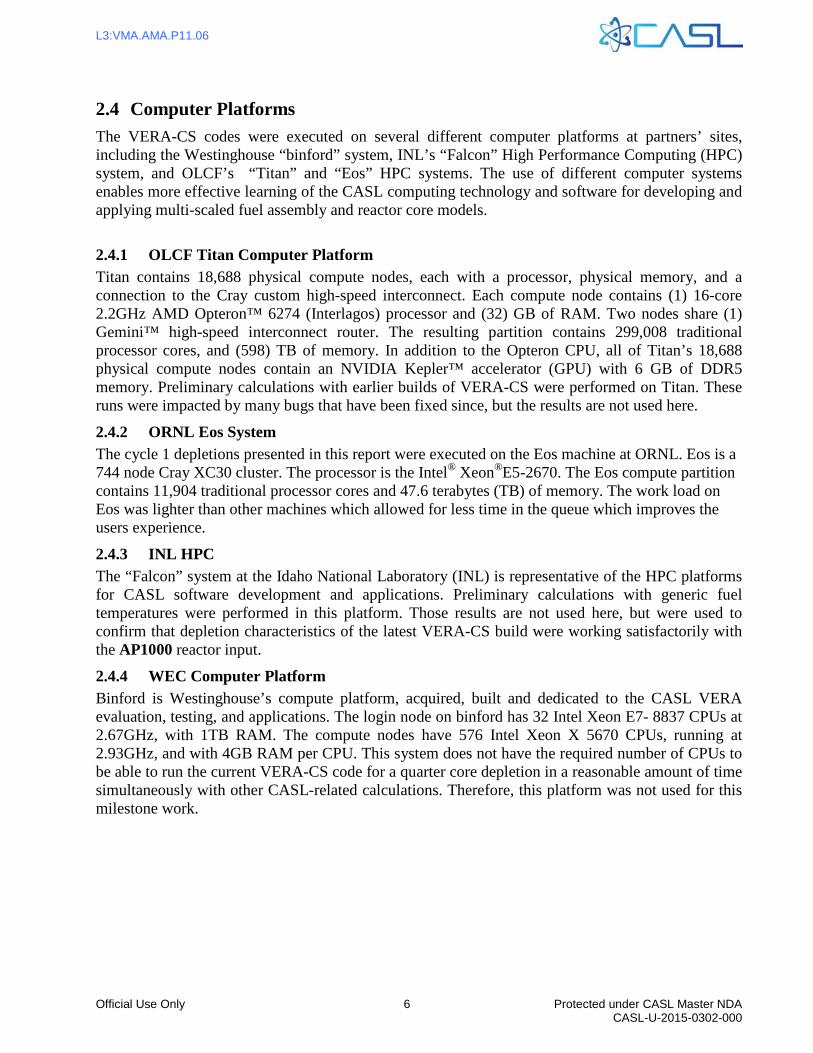
2.4 Computer Platforms The VERA-CS codes were executed on several different computer platforms at partners’ sites, including the Westinghouse “binford” system, INL’s “Falcon” High Performance Computing (HPC) system, and OLCF’s “Titan” and “Eos” HPC systems. The use of different computer systems enables more effective learning of the CASL computing technology and software for developing and applying multi-scaled fuel assembly and reactor core models.
2.4.1 OLCF Titan Computer Platform Titan contains 18,688 physical compute nodes, each with a processor, physical memory, and a connection to the Cray custom high-speed interconnect. Each compute node contains (1) 16-core 2.2GHz AMD Opteron™ 6274 (Interlagos) processor and (32) GB of RAM. Two nodes share (1) Gemini™ high-speed interconnect router. The resulting partition contains 299,008 traditional processor cores, and (598) TB of memory. In addition to the Opteron CPU, all of Titan’s 18,688 physical compute nodes contain an NVIDIA Kepler™ accelerator (GPU) with 6 GB of DDR5 memory. Preliminary calculations with earlier builds of VERA-CS were performed on Titan. These runs were impacted by many bugs that have been fixed since, but the results are not used here.
2.4.2 ORNL Eos System The cycle 1 depletions presented in this report were executed on the Eos machine at ORNL. Eos is a 744 node Cray XC30 cluster. The processor is the Intel® Xeon®E5-2670. The Eos compute partition contains 11,904 traditional processor cores and 47.6 terabytes (TB) of memory. The work load on Eos was lighter than other machines which allowed for less time in the queue which improves the users experience.
2.4.3 INL HPC The “Falcon” system at the Idaho National Laboratory (INL) is representative of the HPC platforms for CASL software development and applications. Preliminary calculations with generic fuel temperatures were performed in this platform. Those results are not used here, but were used to confirm that depletion characteristics of the latest VERA-CS build were working satisfactorily with the AP1000 reactor input.
2.4.4 WEC Computer Platform Binford is Westinghouse’s compute platform, acquired, built and dedicated to the CASL VERA evaluation, testing, and applications. The login node on binford has 32 Intel Xeon E7- 8837 CPUs at 2.67GHz, with 1TB RAM. The compute nodes have 576 Intel Xeon X 5670 CPUs, running at 2.93GHz, and with 4GB RAM per CPU. This system does not have the required number of CPUs to be able to run the current VERA-CS code for a quarter core depletion in a reasonable amount of time simultaneously with other CASL-related calculations. Therefore, this platform was not used for this milestone work.
L3:VMA.AMA.P11.06
Protected under CASL Master NDA 7 Official Use Only CASL-X-2015-0302-000
3. APPROACH TO SIMULATION As mentioned earlier, the VERA-CS input from Reference 1 was used as the starting point to set up the HFP depletion. The key changes and updates are explained in the following sections.
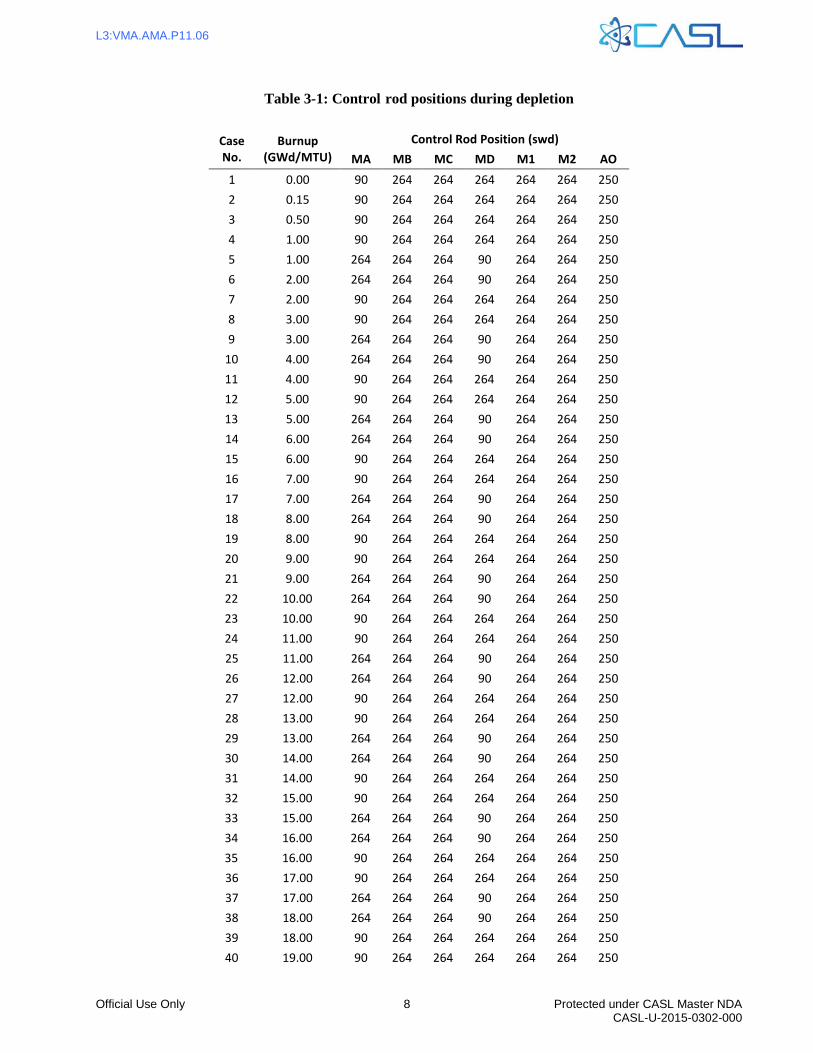
3.1 Core General Parameters The core power is defined as 100% and core inlet temperature was set to 537.2 °F consistent with HFP inlet temperature for the AP1000 plant Cycle 1. The criticality search is set to boron and xenon is set to equilibrium. The feedback is turned on, so moderator density will be calculated by CTF. The fuel temperatures are calculated using a lookup table which is defined as a function of rod power and burnup. This table was developed using fuel temperature information from the Westinghouse fuel performance codes. The control rod positions were defined at 264 steps withdrawn (swd) for all control banks for the ARO depletion. This depletion was performed to obtain a reference model that is not impacted by control rod insertion. However, the AP1000 plant will operate with control rods inserted and a second depletion was performed to simulate the MSHIM Control Strategy. This was accomplished by maintaining the lead gray bank at 90 swd and the AO bank at 250 swd. Additionally, a lead bank exchange is modeled by creating a new core state with no fuel depletion, but the lead bank is switched back and forth between gray banks MA and MD every 1 GWd/MTU. The AO bank stays positioned at 250 swd throughout the depletion. This is a coarse approximation of what the expected plant operation would be and is acceptable to use here in the absent of actual plant history. The control rod positions as a function of burnup are shown in Table 3-1. Note that Table 3-1 shows a delta burnup of 1 GWd/MTU after case number 5 as this was the target change in depletion per step. However, a sensitivity performed showed that burnup steps larger than 0.5 GWd/MTU introduce a small reactivity bias which increases throughout the depletion. The final depletion simulations modeled fuel depletion burnup steps no larger than 0.5 GWd/MTU. Therefore, the final ARO depletion model ends up with 39 steps and the pseudo MSHIM control depletion showed in Table 3-1 goes from 40 to 57 cases or steps.
L3:VMA.AMA.P11.06
Official Use Only 8 Protected under CASL Master NDA CASL-U-2015-0302-000
Protected under CASL Master NDA 9 Official Use Only CASL-X-2015-0302-000
3.2 Geometry Optimization In an effort to reduce the computer resources (i.e. number of cores) and speed up the calculation time, the core geometry is optimized when compared to the input from Reference 1 to decrease the number of axial planes and other area improvements explained below:
• The lower and upper core plates are removed from the geometry and not included in the calculations.
• The updated reflector region smears end plugs, grids, and gaps. • Detector thimbles are not modeled. • Thimble plug devices are not modeled. • Dashpot is not modeled (CTF does not run if more than one thimble type is modeled). • Fuel temperature tables are used and the fuel conductivity model in CTF is disabled.
Note that most of the options used here are consistent where applicable with those applied the Watts Bar multi-cycle depletion from Reference 6.
4. RESULTS A quarter-core model was depleted for the AP1000 plant Cycle 1 using coupled MPACT and CTF. The neutronic model used 56 axial meshes, 4 in the bottom reflector region, 3 in the top reflector region, and 49 in the active fuel region, resulting in 12376 mesh elements and 43368326 flat source regions with 0.05cm spacing in the 2D Method-of-Characteristics (MOC) calculations. The quadrature set used 32 directions. Flux calculations used a 47 energy group library, with transport-corrected P0 scattering. MPACT performed the transport sweeps on 224x16=3584 cores of the OLCF’s Eos platform, using spatial domain decomposition only. The CTF model included 5640 channels, 9823 gaps, and 4700 rods in the quarter-core model. For parallel processing, CTF partitioned the spatial domain based on assembly boundaries and performed the simulations on 40 cores.
Table 4-1 summarizes the computational performance for the calculations performed in this report.
Table 4-1: Computational performance of VERA-CS for AP1000 plant simulations
Case Core # Core hours Wall Time (hrs) Memory
ARO Depletion 3584 118K 33 < 4 GB/core
MSHIM control depletion 3584 163K 45.5
ITC 3584 3-5K 1.0-1.5
MTC 3584 2K 0.5
L3:VMA.AMA.P11.06
Official Use Only 10 Protected under CASL Master NDA CASL-U-2015-0302-000
4.1 All-Rods-Out Depletion The preliminary Cycle 1 ARO depletion was completed on Eos using 3584 cores and a wall-time of 22 hours. This case had only 26 steps as it was using 1 GWd/MTU depletion time steps after 5 GWd/MTU. A new depletion case was executed using consistently 0.5 GWd/MTU delta burnup throughout the depletion for a total of 39 steps and 33 hours of wall-time. Figure 4-1 illustrates the reactivity impact on the depletion because of the larger time step. The delta boron below is calculated as the difference in critical boron concentration from the two ARO models with different depletion delta burnup.
Figure 4-1: ARO depletion time step sensitivity
The impact in peaking factors and axial offset is not as pronounced as the reactivity impact. All the results shown in the following sections used the finer depletion time step results. Parameters of interest were collected from the ARO depletion and illustrated below in Figure 4-2. The critical boron concentration is well behaved and the impact of burnable absorber depletion is clearly captured during the depletion.
-8
-6
-4
-2
0
2
4
6
0 2 4 6 8 10 12 14 16 18 20
delta
bor
on (p
pm)
Burnup (GWd/MTU)
L3:VMA.AMA.P11.06
Protected under CASL Master NDA 11 Official Use Only CASL-X-2015-0302-000
Figure 4-2: ARO depletion results
0
200
400
600
800
1000
1200
0 5 10 15 20
Boro
n (p
pm)
Burnup (GWd/MTU)
Critical Boron
1.2
1.3
1.4
1.5
1.6
1.7
1.8
1.9
0 5 10 15 20Burnup (GWd/MTU)
FQ FDH
-6.0%
-5.0%
-4.0%
-3.0%
-2.0%
-1.0%
0.0%
0 5 10 15 20Burnup (GWd/MTU)
Axial Offset
L3:VMA.AMA.P11.06
Official Use Only 12 Protected under CASL Master NDA CASL-U-2015-0302-000
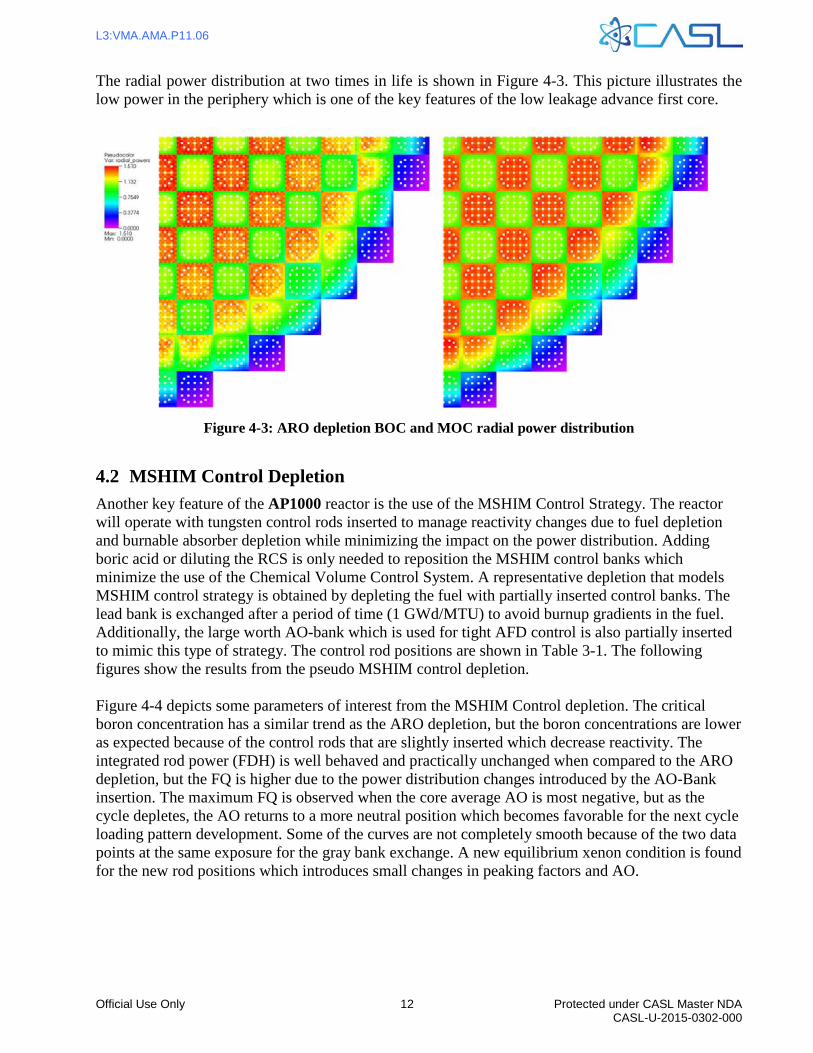
The radial power distribution at two times in life is shown in Figure 4-3. This picture illustrates the low power in the periphery which is one of the key features of the low leakage advance first core.
Figure 4-3: ARO depletion BOC and MOC radial power distribution
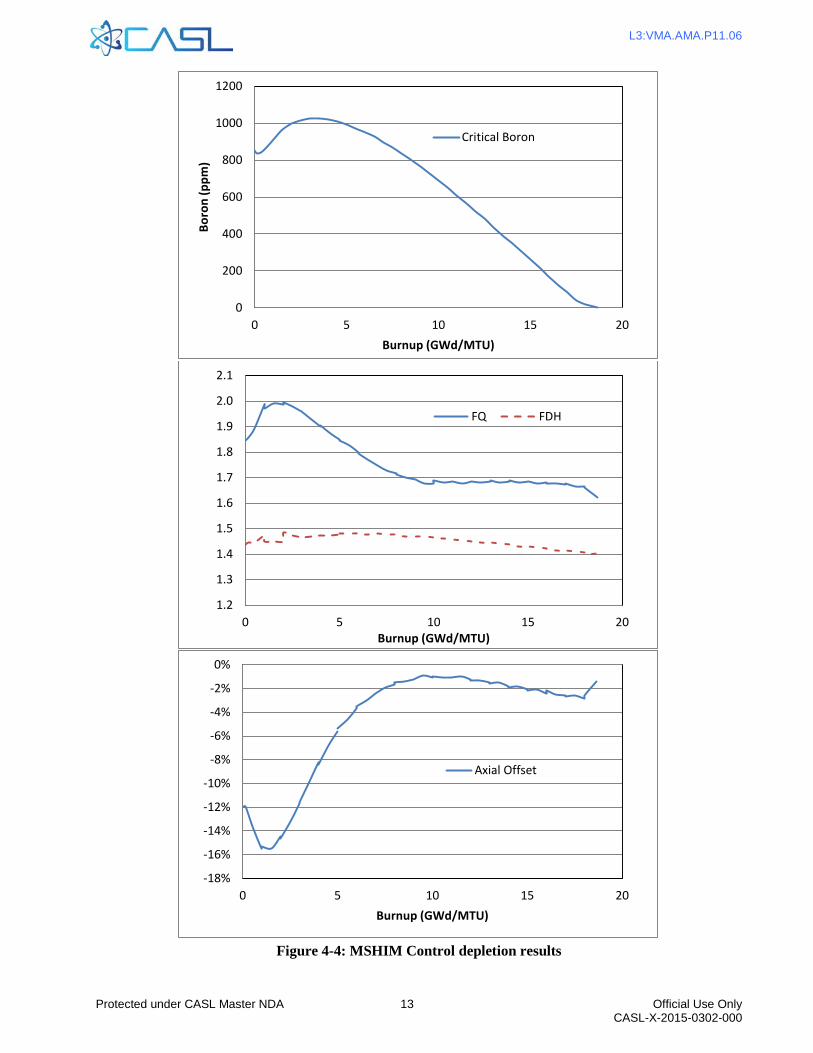
4.2 MSHIM Control Depletion Another key feature of the AP1000 reactor is the use of the MSHIM Control Strategy. The reactor will operate with tungsten control rods inserted to manage reactivity changes due to fuel depletion and burnable absorber depletion while minimizing the impact on the power distribution. Adding boric acid or diluting the RCS is only needed to reposition the MSHIM control banks which minimize the use of the Chemical Volume Control System. A representative depletion that models MSHIM control strategy is obtained by depleting the fuel with partially inserted control banks. The lead bank is exchanged after a period of time (1 GWd/MTU) to avoid burnup gradients in the fuel. Additionally, the large worth AO-bank which is used for tight AFD control is also partially inserted to mimic this type of strategy. The control rod positions are shown in Table 3-1. The following figures show the results from the pseudo MSHIM control depletion. Figure 4-4 depicts some parameters of interest from the MSHIM Control depletion. The critical boron concentration has a similar trend as the ARO depletion, but the boron concentrations are lower as expected because of the control rods that are slightly inserted which decrease reactivity. The integrated rod power (FDH) is well behaved and practically unchanged when compared to the ARO depletion, but the FQ is higher due to the power distribution changes introduced by the AO-Bank insertion. The maximum FQ is observed when the core average AO is most negative, but as the cycle depletes, the AO returns to a more neutral position which becomes favorable for the next cycle loading pattern development. Some of the curves are not completely smooth because of the two data points at the same exposure for the gray bank exchange. A new equilibrium xenon condition is found for the new rod positions which introduces small changes in peaking factors and AO.
L3:VMA.AMA.P11.06
Protected under CASL Master NDA 13 Official Use Only CASL-X-2015-0302-000
Figure 4-4: MSHIM Control depletion results
0
200
400
600
800
1000
1200
0 5 10 15 20
Boro
n (p
pm)
Burnup (GWd/MTU)
Critical Boron
1.2
1.3
1.4
1.5
1.6
1.7
1.8
1.9
2.0
2.1
0 5 10 15 20Burnup (GWd/MTU)
FQ FDH
-18%
-16%
-14%
-12%
-10%
-8%
-6%
-4%
-2%
0%
0 5 10 15 20Burnup (GWd/MTU)
Axial Offset
L3:VMA.AMA.P11.06
Official Use Only 14 Protected under CASL Master NDA CASL-U-2015-0302-000
Figure 4-5: MSHIM Control depletion BOC & MOC pin power distribution Figure 4-5 illustrates the pin powers at two different times in core life. The impact of the large negative AO at BOC (left) drives the hot pin location to the bottom of the core, but this effect dissipates as the fuel burns and the AO develops to a more neutral value. The core locations where the AO-Bank is inserted can also be discerned in the top of the half core figures by the darker blue in some inboard assemblies.
L3:VMA.AMA.P11.06
Protected under CASL Master NDA 15 Official Use Only CASL-X-2015-0302-000
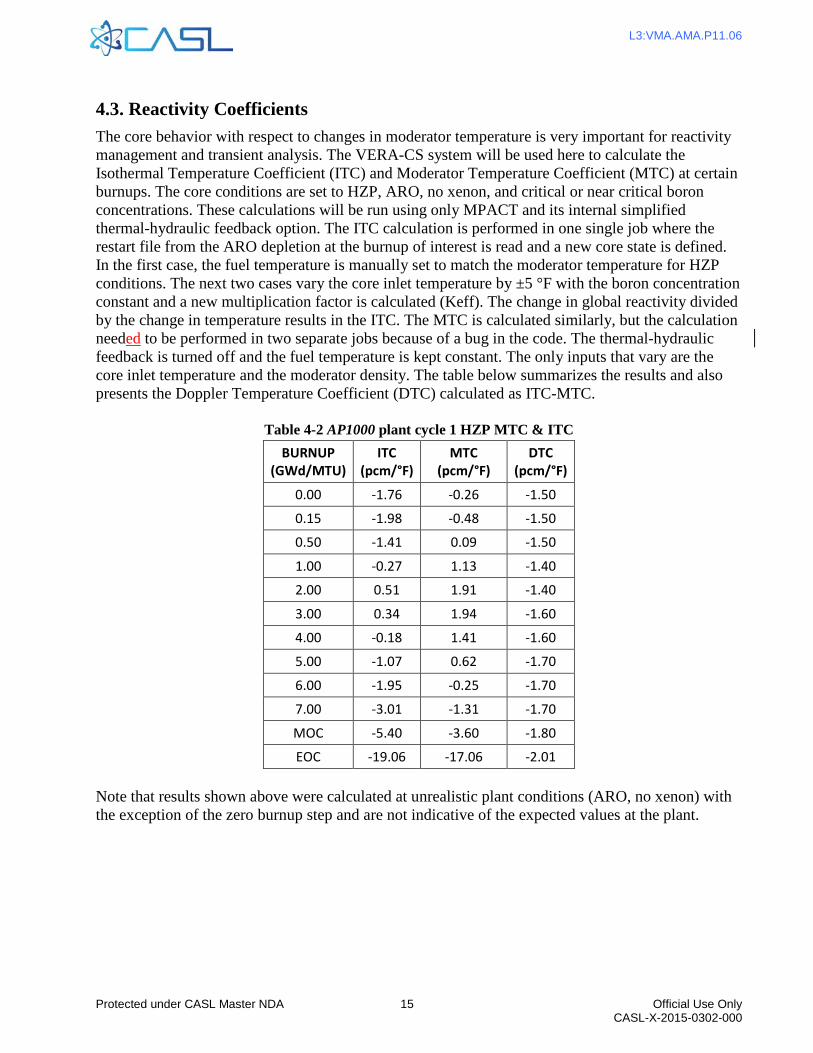
4.3. Reactivity Coefficients The core behavior with respect to changes in moderator temperature is very important for reactivity management and transient analysis. The VERA-CS system will be used here to calculate the Isothermal Temperature Coefficient (ITC) and Moderator Temperature Coefficient (MTC) at certain burnups. The core conditions are set to HZP, ARO, no xenon, and critical or near critical boron concentrations. These calculations will be run using only MPACT and its internal simplified thermal-hydraulic feedback option. The ITC calculation is performed in one single job where the restart file from the ARO depletion at the burnup of interest is read and a new core state is defined. In the first case, the fuel temperature is manually set to match the moderator temperature for HZP conditions. The next two cases vary the core inlet temperature by ±5 °F with the boron concentration constant and a new multiplication factor is calculated (Keff). The change in global reactivity divided by the change in temperature results in the ITC. The MTC is calculated similarly, but the calculation needed to be performed in two separate jobs because of a bug in the code. The thermal-hydraulic feedback is turned off and the fuel temperature is kept constant. The only inputs that vary are the core inlet temperature and the moderator density. The table below summarizes the results and also presents the Doppler Temperature Coefficient (DTC) calculated as ITC-MTC.
Note that results shown above were calculated at unrealistic plant conditions (ARO, no xenon) with the exception of the zero burnup step and are not indicative of the expected values at the plant.
L3:VMA.AMA.P11.06
Official Use Only 16 Protected under CASL Master NDA CASL-U-2015-0302-000
4.4. User Experience The VERA-CS code system has been successfully applied to predicting the AP1000 plant cycle 1 HFP depletion. This task could not have been completed without the support of the ORNL team. The depletion set up was moderately simple because of the already generated input file in Reference 1 and the clear instructions in the VERA user manual (Reference 2). The sample input in the manual is useful, but the assistance and support from the ORNL members was tremendously helpful while running these cases thanks to their availability and quick turnaround with answers to any user inquiry. The following were identified as areas of improvement that would be very useful as the code continues to mature and targets the nuclear industry as a streamline user.
• Thermal expansion should be modeled for all components and structures. This should be done automatically after the user inputs the cold dimensions. Sensitivities to the impact of radial and axial thermal expansion were performed with modified Westinghouse tools and the results indicate a significant impact to global reactivity. This feature needs to be added to the VERA-CS system so it can be used for consistent benchmark exercises in the future.
• Input for pellet dishing and chamfer should be added to the list of variables. This is currently accounted for in the fuel density, but it is a practice prone to errors.
• The xenon options should work flawlessly when running multiple cases with restarts. It is true that equilibrium xenon is the most practical conditions for plant simple simulations and cycle depletions, but the features described in the user manual (zero, deplete) are useful if they can be set after a restart or re-converged case to find bounding conditions which is currently not available. This or a similar issue may be already identified in MPACT.
• Automated sequences of key reactor parameters or conditions should be added. Reactivity coefficients and rod worths are some of the parameters that need to be calculated during loading pattern development and with a simple user interface or minimum input requirement; it becomes an incentive to use VERA-CS.
• Output edits need to improve to be more user friendly. It is understandable that the team has dedicated more effort and energy to the development of key technical capabilities of VERA-CS, but as the code becomes more stable, key information should be added to the output edits to improve the user experience. However, all output information is the hdf5 file created by the code and data post-processing and visualization can be subjective to the user needs or organizational requirements and not necessarily needs to be defined by CASL.
• As the options for edits in the output files continue to evolve, flags should be added to prevent some pin edits that make the output files very large and sometimes unmanageable.
• Errors messages should be more descriptive or give better indications of what type of problem prevented the code system from executing. There were some instances of user input error or missing input that caused the code to exit with errors; however, the output sometimes does not give enough detail for a quick diagnosis.
• Along the same lines as the previous bullet, it could be beneficial to have the code perform a check in the input file for errors or missing data before the job goes to the queue. This will save time and energy as some jobs exit with errors because of something as simple as typos and it is painful to waste time in the queue for this reason.
L3:VMA.AMA.P11.06
Protected under CASL Master NDA 17 Official Use Only CASL-X-2015-0302-000
5. SUMMARY
As the CASL tools continue to evolve and include new capabilities, more opportunities for advanced modeling in areas of interest become available. The latest capabilities of the VERA-CS tools were used to deplete the AP1000 PWR advanced cycle 1. The results confirm the VERA-CS system capabilities, specifically for this the case the coupling of MPACT and CTF, for depleting the AP1000 PWR Cycle 1 without any major issues. The depletion feature was shown to work for the ARO depletion and for the more challenging pseudo MSHIM Control depletion. Additionally, calculations were performed to evaluate the ITC, MTC, and DTC at HZP, no xenon, ARO conditions. A short paragraph was also provided describing the user experience and potential areas for improvement. The VERA-CS tools are shown to be consistent with expectations. As the VERA-CS system continues to mature, add capabilities and new features, and improve the user interface, it will enter a new realm in the nuclear industry where it will be used as the go-to tool for reactor analysis and benchmark.
L3:VMA.AMA.P11.06
Official Use Only 18 Protected under CASL Master NDA CASL-U-2015-0302-000
6. REFERENCES
1. CASL-U-2014-0012-001, “Westinghouse VERA Test Stand - Zero Power Physics Test
Simulations for the AP1000 PWR,” March 2014.
2. CASL-U-2014-0014-002, “VERA Common Input User Manual, Version 2.0.0,” Revision 2, February 2015.
3. CASL-U-2015-0077-000, “MPACT User’s Manual Version 2.0.0,” February 2015.
4. CASL-U-2015-0055-000, “CTF – A Thermal-Hydraulic Subchannel Code for LWRs Transient Analysis,” February 2015.
5. CASL-U-2014-0114-000, “ORIGEN Integration into MPACT,” July 2014.
6. CASL-U-2015-0206-000, “VERA Benchmarking Results For Watts Bar Nuclear Plant,” June 2015.