Page 1
ORNL/SUB/98-85B99398W3
,
Verification Ctilculation Results to Validate the Procedures and Codes for
Pin-by-Pin Power Computation In VVER Type Reactors with
MOX Fuel Loading
Authors
2. N. Chizhikova A. G. Kalashnikov
E. N. Kapranova V. E. Korobitsyn
G. N. Manturov A. A. Tsibouiia
Page 2
This report has been reproduced from the best available copy.
Reports are available to the public from the following source.
National Technical information Service 5285 Port Royal Road Springfield, VA 22161 Telephone 703-605-6000 (l-600-553-6847) TDD 7034874639 Fax 703-605-6900 Einail ordersOntls.fedworld.gov Web site http%ww.ntis.govJordering.htm
Reports are available to U.S. Department of Energy (DOE) employees, DOE contractors, Energy Technology Data Exchange (ETDE) representatives, and International Nuclear information System (IRIS) representatives from the following source.
Office of Scientific and Technical Information P-0. Box 62 Oak Ridge, TN 37831 Telephone 423-576-8401 Fax 423-576-5728
. .
E-malt reportsOadonis.osti.gov Web she httpYJwww.osti.govJproductsJsources.htmf
deports produced after January I, 1996, are generally available via the DOE Information Bridge. Web she httpYJwww.doe.govJbridge
.
This report was prepared as an account of work sponsored by an agency of the United States Government. Neither the United States Government nor any agency thereof, nor any of their employees, makes any warranty, express or implied, or assumes any legal liability or responsibility for the accuracy, compteteness, or usefulness of any information, apparatus, product, or process disclosed, or represents that its use woutd not infringe privately owned rights. Reference herein to any specific commercial product. process, or service by trade name, trademark, manufacturer, or otherwise. does not necessarily constitute or imply its endorsement, recommendation, or favoring by the United States Government or any agency thereof. The views and opinions of authors expressed herein do not necessarily state or reflect those of the United States Government or any agency thereof.
*
Page 3
ORNL/SUBi98-85B99398V-3
VERIFICATION CALCULATION RESULTS TO VALIDATE THE PROCEDURES AND CODES FOR PIN-BY-PIN POWER COMPUTATION
IN VVER TYPE REACTORS WITH MOX FUEL LOADING (American-Russian Benchmark, Variants 13,14)
Authors
Z. N. Chizhikova A. G. Kalashnikov E. N. Kapranova V. E. Korobitsyn G. N. Manturov A. A. Tsiboulia
Date Published: December 1998
Report Prepared by LOCKHEED MARTIN ENERGY RESEARCH CORP.
P.O. Box 2008 Oak Ridge, Tennessee 3783 I-6363
under Subcontract Number 85B99398V
Funded by Office of Fissile Materials Disposition United States Department of Energy
Prepared for
Computational Physics and Engineering Division Oak Ridge National Laboratory
O.ak Ridge, Tennessee 3783 1 managed by
LOCKHEED MARTIN ENERGY RESEARCH CORP. for the
U.S. DEPARTMENT OF ENERGY under contract DE-960R22464
Page 4
STATE SCIENTIFIC CENTRE OF RUSSIAN FEDERATION - Leipunsky INSTITUTE OF PHYSICS AND POWER ENGINEERING
VERIFICATION CALCULATION RESULTS TO VALIDATE THE PROCEDURES AND CODES
FOR PIN-BY-PIN POWER COMPUTATION IN VVER TYPE REACTORS WITH MOX FUEL LOADING
(American-Russian benchmark, Variants 13,1.4)
SCIENTIFIC REPORT
Authors:
Chizhiiova Z.N. Kalashnikov A.G. Kapranova E.N. Korobitsyn V.E. Manturov G.N. TsibouIia A.A.
Obninsk - 1998
Page 5
ABSTRACT
INTRODUCTION _I
1. SPECIFICATION OF CALCULATIONAL BENCHMARKS 1 1 .l. Material Specification
1.2. Geometry Description
1.3. A Set of States to Be Calculated
1.4. Parameters to Be Calculated
1.5. Description of Calculational Variants
2. BRIEF DESCRIPTION OF CALCULATIONAL CODES
2.1. MCU-B Code
2.2. Program-Constant Complex CONSIST-KENO-MAYAK-ORIGEN
2.3. Description of Methodical Basis of the TVS-M Code
2.4. IIELIOS Code
2.5. Program Complex TRIANG-PWR
2.6. WIMS-ABBN
3. CALCULATION RESULTS
3.1. Comparison of the Calculation Results Obtained by the CONKEMO Code with Different Time Steps
3.2. Comparison of the Kef/ Value Calculation Results
3.3. The Results of Power Distribution Calculations Using Benchmark Codes at the Beginning of Burnup
3.4. Comparison of the Calculations of Power Distributions on Burning Obtained by the TVS-M, HELIOS and CONKEMO Codes
3.5. The Statistical Error Estimate on Power Distribution Calculation by CONKEMO Code
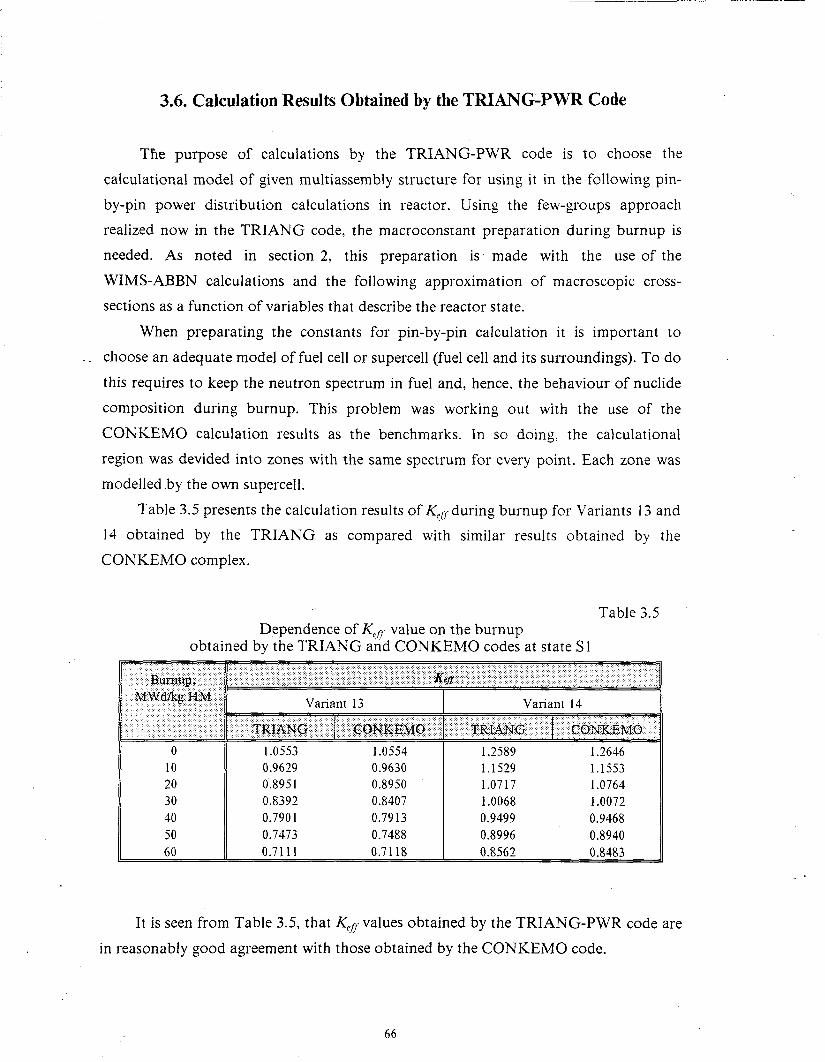
3.6. Calculation Results Obtained by the TRIANG-PWR Code
3
5
5
5
7
8
8
9
9
11
14
16
17
18
21
22
27
29
34
63
66
CONCLUSION
REFERENCES
2
76
77
Page 6
INTRODUCTION
One of the important problems for ensuring the VVER type reactor safety when
the reactor is partially loaded with MOX fuel is the choice of appropriate physical
zonning to achieve the maximum flattening of pin-by-pin power distribution. When
uranium fuel is replaced by MOX one provided that the reactivity due to fuel assemblies
is kept constant, the fuel enrichment slightly decreases. However, the average neutron
spectrum fission microscopic cross-section for *39Pu is approximately twice that for *jsU.
Therefore power peaks occur in the peripheral fuel assemblies containing MOX fuel
which are aggravated by the interassembly water. Physical zonning has to be applied to
. flatten the power peaks in fuel assemblies containing MOX fuel. Moreover, physical
zonning cannot be confined to one row of fuel elements as is the case with a uniform
lattice of uranium fuel assemblies.
Both the water gap and the jump in neutron absorption macroscopic cross-
sections which occurs at the interface of fuel assemblies with different fuels make the
problem of calculating space-energy neutron flux distribution more complicated since
it increases nondiffusibility effects. To solve this problem it is necessary to update the
current codes, to develop new codes and to verify all the codes including nuclear-
physical constants libraries employed. In so doing it is important to develop and
validate codes of different levels - from design codes to benchmark ones.
This paper presents the results of the burnup calculation for a multiassembly
structure, consisting of MOX fuel assemblies surrounded by uranium dioxide fuel
assemblies. The structure concerned can be assumed to model a fuel assembly lattice
symmetry element of the VVER-1000 type reactor in which l/4 of all fuel assemblies
contains MOX fuel.
Two variants are considered which differ in zonning fuel assemblies with MOX
fuel:
l no zonning (Variant 13 according to the Russian-American benchmark numbering);
l zonning in two peripheral rows of MOX fuel elements (Variant 14).
The calculations were performed by using the MCU-B /l, 2, 3, 4/, CONSYST-
KENO-MAYAK-ORIGEN, TVS-M /5/, HELIOS /6,7/ and TRIANG-PWR codes.
Page 7
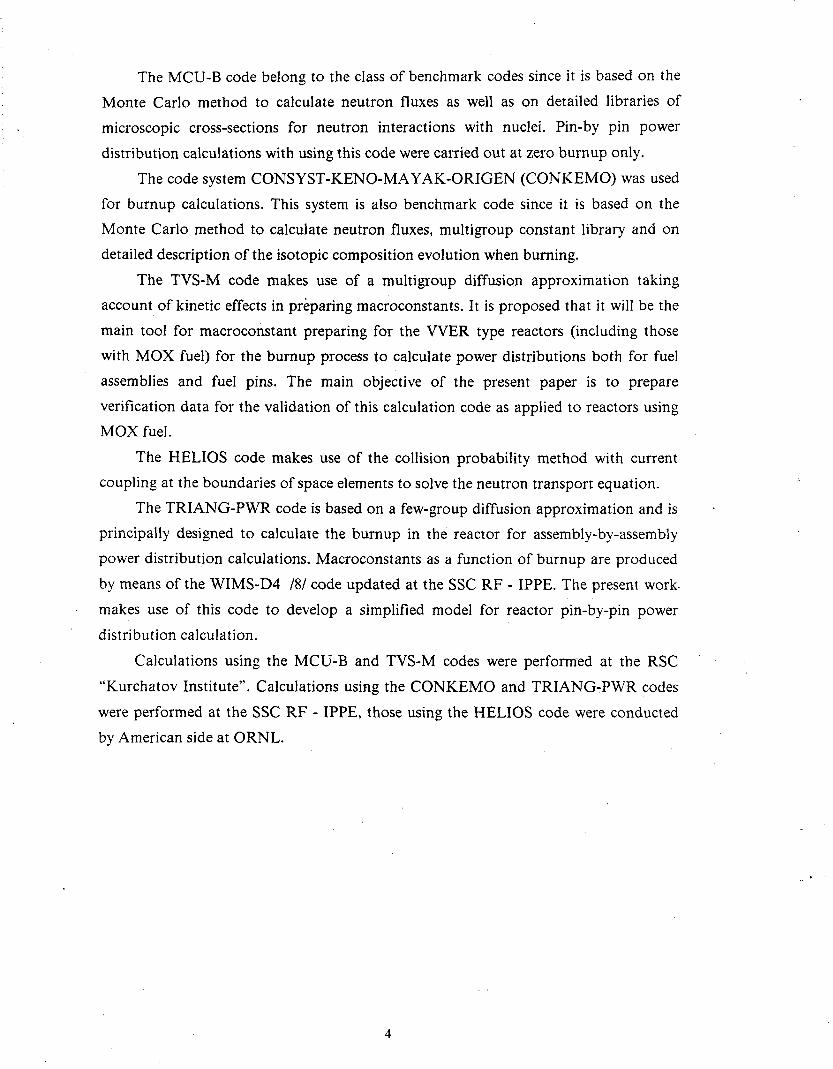
The MCU-B code belong to the class of benchmark codes since it is based on the
Monte Carlo method to calculate neutron fluxes as well as on detailed libraries of
microscopic cross-sections for neutron interactions with nuclei. Pin-by pin power
distribution calculations with using this code were carried out at zero burnup only.
The code system CONSYST-KENO-MAYAK-ORIGEN (CONKEMO) was used
for burnup calculations. This system is also benchmark code since it is based on the
Monte Carlo method to calculate neutron fluxes, multigroup constant library and on
detailed description of the isotopic composition evolution when burning.
The TVS-M code makes use of a multigroup diffusion approximation taking
account of kinetic effects in preparing macroconstants. It is proposed that it will be the
main tool for macroconstant preparing for the WER type reactors (including those
with MOX fuel) for the burnup process to calculate power distributions both for fuel
assemblies and fuel pins. The main objective of the present paper is to prepare
verification data for the validation of this calculation code as applied to reactors using
MOX fuel.
The HELIOS code makes use of the collision probability method with current
coupling at the boundaries of space elements to solve the neutron transport equation.
The TRIANG-PWR code is based on a few-group diffusion approximation and is
principally designed to calculate the burnup in the reactor for assembly-by-assembly
power distribution calculations. Macroconstants as a function of burnup are produced
by means of the WIMS-D4 /8/ code updated at the SSC RF - IPPE. The present work.
makes use of this code to develop a simplified model for reactor pin-by-pin power
distribution calculation.
.
Calculations using the MCU-B and TVS-M codes were performed at the RSC
“Kurchatov Institute”. Calculations using the CONKEMO and TRIANG-PWR codes
were performed at the SSC RF - IPPE, those using the HELIOS code were conducted
by American side at ORNL.
Page 8
1. SPECIFICATION OF CALCULATIONAL BENCHMARKS
I
1 .l. Material Specification
Material description Table 1.1
FUI
FU2
FU12
FU13
FU14
CL1 MOD1
Fresh uranium fuel
Fresh MOX fuel
MOX fuel of type 1 in zonned FA
MOX fuel of type 2 in zonned FA
MOX fuel of type 3 in zonned FA
Cladding Hot moderator with
., ,., . . ,.,. ., .,., .,. ,. ,. ,, .,~,.: .,.,:, ,., ,., .: ,.~ ,:....: :::::::., ,::...::::,,:: j:: j~:j:, ,:.:,,:.:, ,... . .i.....i. . . . ~~~iiiiii:i~~~~~~~~~t~~~~~~~~~~~:~~~~~~~~~~~~~~~~~~~~~
f :...:.y;..:,;: :,.,.(,.(.:::: :.,:,: ., ,;:i,::::.::.::: ..:., .‘:‘.‘:.,/. .:’ ‘.: . . ::: ..,.. :.., . . .,,.,, ., .: .I. . .I. . . .\. :.:...:... : .:.c...:.,.:.:..: ..:.:.: :,:,:,:: : ..:::.i!:, ,:.:“:: .,... ,...: .,.., ‘...“.:.‘.,.::.. .::,,. 235U 8.7370 IO-4 ‘60 3.9235 1 O-2 238U 1.8744 1 O-2 235U 3.8393 1 O-5 239PU 6.5875-I O4 238U 1.8917 10-I’ 24OpU 4.2323.10-S ‘60 4.1707 10-2 24IpU 7.0246.1 O-6
23SU 3.7918 10-s 239pu 8.7697.10-1 238U 1.8683 10.2 24opu 5.6343.10-s ‘60 4.1707 10-2 24lpU 9.3516.10-6
23SU 3.8786 1 O-5 239p, 4.7835.1 O-4 238U 1.9111 10-l 24OpU 3.0733.1 o-5 ‘60 4.1707 IO-2 24lpU 5.1009.1 O-6
235U 3.8959 lo-5 239pu 3.9862.10-4 238U 1.9196 IO-2 24OpU 2.56 10.1 O-5 ‘60 4.1707 IO-2 24lpU 4.2507-l O-6
Zr 4.230 IO-2 H 0.04783 ‘OB 4.7344.1 O-6
MOD3 0.6 g/kg of natural boron ‘60 0.02391 “B 1.9177.10-5 Cold moderator with ‘H 0.06694 ‘OB 6.6262.1 O-6 0.6 g/kg of natural boron ‘60 0.03347 “B 2.6839.1 O-5
1.2. Geometry Description
There are three types of geometric objects:
- a three-zone elementary cell (C3); .
- an assembly containing 33 1 elementary cells of three types (K331);
- a multi-assembly structure formed by assemblies of two types (MI@.
A three-zone elementary cell C3 is :
I-st zone - Cyl(r0,rl=0.386 cm) ;
2-nd zone - Cyl(r,,r2=Q.4582 cm) \ Cyl(r,,r,) ;
3-d zone - Hex(r,,h=1.275 cm) \ Cyl(r,,r,) ;
were CYKchri) is a cylinder of radius 5 with the center at point ro;
Hex(r,,h=1.275 cm) is a hexagon with the center at point r. and
across flats dimension k1.275 cm.
Assembly K33Z :
This structure is a “container” Hex(r,,H=23.6 cm), that contains 331 elementary
cells C3 of three types (see Fig. 1.1).
5
Page 9
0 : 1 - cell number \\ \
2 - cell type ‘\ \ ‘1 ‘\, “Container” zone
Fig. 1.1. Assembly K331
6
Page 10
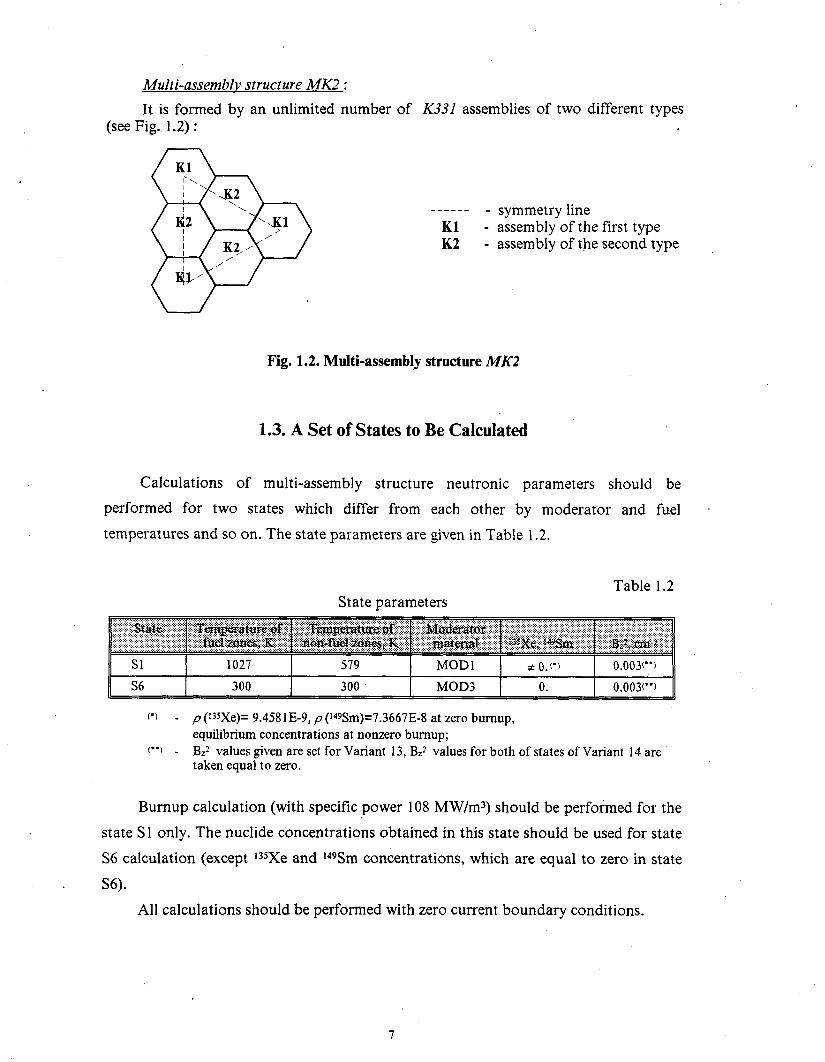
Multi-assembly structure MC? :
It is formed by an unlimited number of K33Z assemblies of two different types (see Fig.. 1.2) :
.----- _ symmetry line Kl - assembly of the first type K2 - assembly of the second type
Fig. 1.2. Multi-assembly structure WC2
1.3. A Set of States to Be Calculated
Calculations of multi-assembly structure neutronic parameters should be
performed for two states which differ from each other by moderator and fuel
temperatures and so on. The state parameters are given in Table 1.2.
.
State parameters Table 1.2
Sl 1027 579 MOD1 # 0.f’) 0.003(“)
S6 300 300 MOD3 0. 0.003(“)
(‘) - p (135Xe)= 9.458 1 E-9, p (Tjm)=7.3667E-8 at zero bumup, equilibrium concentrations at nonzero bumup;
(“) - BZ2 values given are set for Variant 13, Bd values for both of states of Variant 14 are taken equal to zero.
Burnup calculation (with specific power 108 MW/mJ) should be performed for the
state Sl only. The nuclide concentrations obtained in this state should be used for state
S6 calculation (except i3sXe and i@Sm concentrations, which are equal to zero in state
S6).
All calculations should be performed with zero current boundary conditions.
Page 11
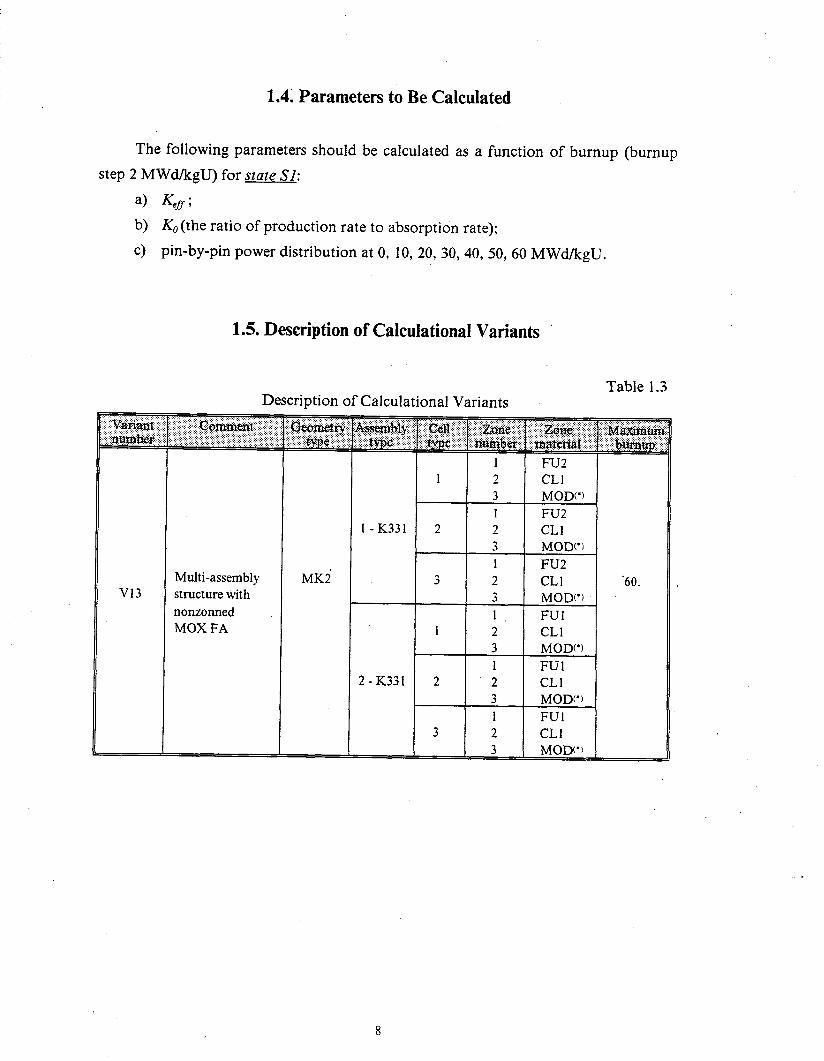
1.4. Parameters to Be Calculated
The following parameters should be calculated as a function of burnup (burnup
step 2 MWd/kgU) for staze SI:
a) K,/;
b) K, (the ratio of production rate to absorption rate);
c) pin-by-pin power distribution at 0, 10, 20, 30, 40, 50, 60 MWd/kgU.
1.5. Description of Calculational Variants
Table 1.3 Description of Calculational Variants
Multi-assembly structure with nonzonned MOX FA
1 ( FU2 1 2 CL1
3 MOD(*) 1 FU2
l-K331 2 2 CL1 3 MOD(‘) 1 FU2
3 2 CL1 3 MOD(‘) 1 FUI
1 2 CL1 3 MOD(*) 1 FUl
2-K331 2 2 CL1 3 MOD(‘) 1 FIJI
3 2 CL1 3 MOD(*) -
.
8
Page 12
Multi-assembly structure with zonned MOX FA
-
Table 1.3 (continue)
I 1 1 FU12 1 1 2 CL1
3 MOD(*) 1 FU13
2 2 CL1 3 MOD(*) 1 FU14
3 2 CL1 60. 3 MOD(‘) 1 FIJI
1 2 CL1 3 MOD(*) 1 FIJI
2 2 CL1 3 MOD(‘) 1 FIJI
3 2 CL1 3 MOD(‘)
(‘1 MOD = MODl, S=Sl
MOD3, S=S6
2. BRIEF DESCRIPTION OF CALCULATIONAL CODES
2.1. MCU-B Code
The MCU-B code with constant library DLWMCUDAT-2.1 /l/ .and BURNUP
module /2/ has been developed to predict isotopic composition of the burnable
materials of the VVER type reactor depending on its lifetime. The following parameters
of the burnable materials are taken into account .during calculation:
l change of average cross sections depending on time;
l change of initially present isotope concentration and occurrence of new stable
and radioactive nuclides.
Multiplication factor, other neutronic reactor characteristics are obtained
simultaneously with isotopic composition calculation.
Thus, MCU-B enables to predict multiplying performance of the reactor and
burnable material isotopic compositions depending on operating time and load
schedule.
The MCU-B code is developed on the basis of the MCU-RFFI/A code /3,4/.
9
Page 13
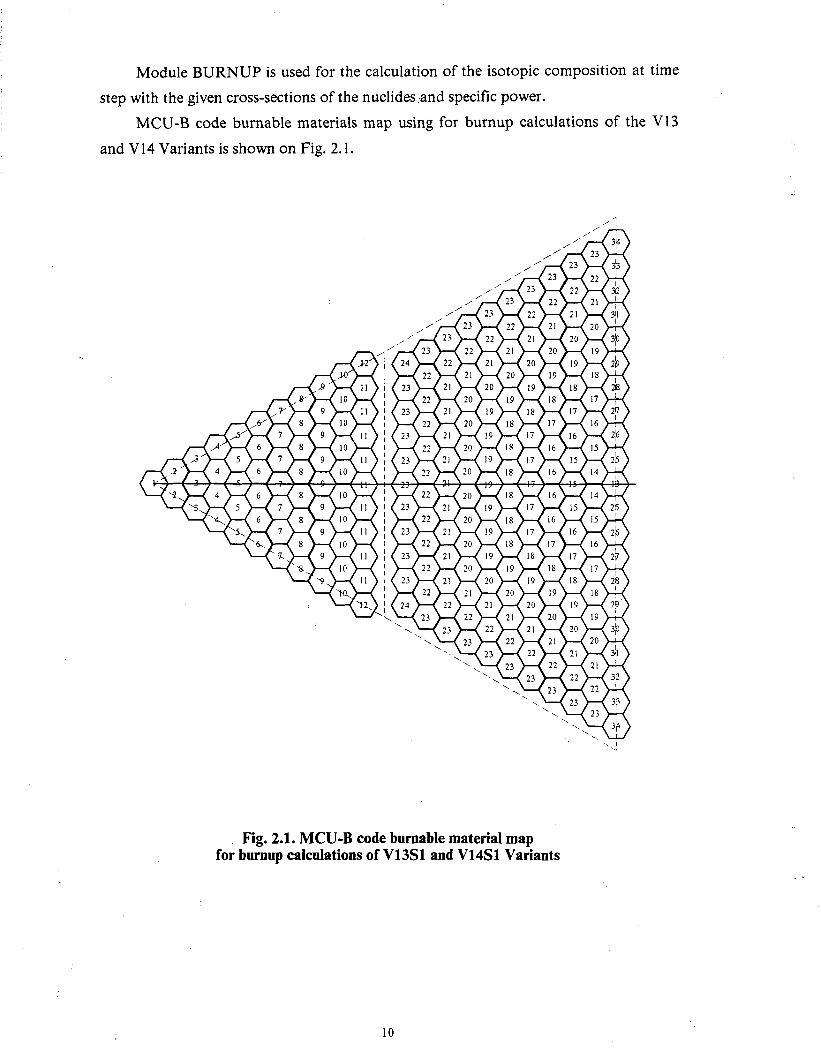
Module BURNUP is used for the calculation of the isotopic composition at time
step with the given cross-sections of the nuclides:and specific power.
MCU-B code burnable materials map using for burnup calculations of the V13
and V14 Variants is shown on Fig. 2.1.
Fig. 2.1. MCU-B code burnable material map for burnup calculations of V13Sl and V14Sl Variants
10
Page 14
2.2. Program-Constant Complex CONSYST-KENO-MAYAK-ORIGEN
Code complex CONKEMO was specially developed for burnup calculations. Its
diagram is shown on Fig. 2.2. The parts of the complex used for calculations of
Variants 13, 14 are marked with the bold line.
l CONSYST prepares the group (299 groups) cross-sections of medium based on
ABBN-93 neutron data library /9/;
l KENO-VI is used for neutronic flux calculations in an arbitrary geometry
(including hexagonal one) by the Monte Carlo method;
l ORIGEN performs isotope evaluation calculations;
l MAYAK provides the joint work of the codes in the complex, information
flows, process the results.
Short descriptions of the above mentioned codes are given below.
The CONSYST code is the main part of CONSYST2 cross-section provision
system which provides the use of ABBN-93 cross sections for different practical
applications. CONSYST calculates microscopic group cross-sections of nuclides in the
medium, neutron and photon cross-sections of the medium etc. CONSYST provides
cross-sections for such transport codes as ANISN, DOT, TWODANT, also it gives an
opportunity to make use of ABBN-93 data in KENO-VI Monte Carlo calculations etc..
CONSYST2 system also includes sets of service procedures. For example, there is a set
of procedures which read data from GMF,file - the output file of CONSYST. These
data are further used in MAYAK code.
KENO-VI / lO/ is a part of American SCALE43 system and performs precision
calculations in arbitrary three-dimensional geometry by the Monte Carlo method.
ORIGEN-S /l I/ (further ORIGEN) is also ,a part of the SCALE4.3 system.‘Cross-
sections from original ORIGEN libraries are updated during the calculations.. The
description of this process is below in the text.
MAYAK makes possible the joint use of CONSYST processing code together
with neutron and photon transport codes (TWODANT, KENO, and MCNP) with
burnup codes (ORIGEN or CARE /12/). Set of batch files provides sequential code
start up.
11
Page 15
-----_-
- NJOY91.94 4
4
Z
Fig. 2.2. Block diagram of program-constant complex
12
Page 16
CONSYST starts first, going through the following steps : 1) reading the input
feed data, 2) reading data from ABBN-93 neutron and photon libraries, 3) calculating
self-shielding factors for all nuclides in all zones in energy groups specified (in this case
299 groups). If required, the heterogeneity can be considered, 4) writing to Generalized
Microconstants File (GMF) the calculation results - microscopic cross-sections of
nuclides -6 for each zone n, 5) compiling the files of medium macro cross-sections C;
(cross-sections for isotopes or their mixtures) in CCC-254/ANISN format, which is used
by transport codes for neutron and photon flux calculations in P,,-approximations of
scattering kernel.
The transport code runs then with the cross-sections prepared by CONSYST. It is
the KENO-VI code for the case described.
MAYAK receives information about averaged fluxes and the geometry of the
computational model from a transport code. CONSYST provides MAYAK with
isotopic and microscopic cross-sections. Some external libraries are also used. MAYAK
performs the normalization of fluxes per power of the system, formats the information
for the burnup code and provides the interaction of different parts of the program
complex. MAYAK also calculates some additional values such as weighted cross
sections, reaction rates, others, and writes these values to external files.
The cross-section processing, transport, depletion, and MAYAK codes are driven
by a system of batch files that provide the possibility.of multistep burnup calculations.
The ORIGEN code starts next. A special EXCHANGE format is used for the
information exchanges between MAYAK and burnup codes. The format allows to
deliver all the information needed to produce the input feed for ORIGEN
(concentrations C,, one-group cross-sections a,, neutron fluxes, power, radiation
history) as well as take back the new concentrations and cumulative fission product
capture cross-section.
While the input for ORIGEN is being created the neutron cross-sections are
updated in the ORIGEN libraries. The cross-sections blockings from CONSYST is
being taking into account and for the absent isotopes required for calculations of
burnup chains cross-sections are read from external neutron group libraries ABBN.
These libraries are: a) FP-fission products and b) ACT - neutron cross-sections for
actinides. The library of atomic masses is also used.
Multigroup (299 groups) library of fission products contains only radiation
capture cross-sections (as original ORIGEN library). These cross-sections are produced
on the base of the FOND2.2 library of evaluated neutron files for 169 nuclides.
13
Page 17
When ORIGEN stops MAYAK updates the input file for CONSYST for next
calculated step with concentrations in zones after burnup process. So calculated cycle is
closed.
2.3. Description of Methodical Basis of the TVS-M Code
TVS-M is the spectral code for calculations of neutronic constants of cells,
supercells, and fuel assemblies of WER reactors. It is a component of the code package
’ for WER calculations.
A constants library used by TVS-M is based on almost the same nuclear data as
the MCU-RFFIIA code and has the following main features:
l In the fast energy region (E,,>4.65 keV), the multigroup cross-sections library ABBN
is applied. This energy range includes 12 groups of the library. In parallel with the
nuclides group constants, the subgroup ones are used.
The subgroup method allows one to express in a simplified form the average of
any function g of, say, the total cross-section o, , which is given by
where oIL and o,, - are the lower and upper limits of the o, variation in an
energy interval AE;
P(~l) - is the probability that the total cross-section has a value
a, in that interval /13/.
l The resonance energy range (4.65 keV>E,>0.625 eV) includes the ABBN groups
from 13th to 24th (the cross-sections of the 24th group are modified because the
lower boundary of this group is not coincident with the one of the ABBN library).
In this energy range the TVS-M code also uses both subgroup and group constants.
Besides, the files of resonance parameters from the LIPAR-3 library are.applied for
resonance nuclides. For most of these nuclides, the cross-section calculation is based
on the Breit-Wigner multilevel model (and on the Adler-Adler model for fissile
nuclides).
l The thermal energy range (&CO.625 eV) is subdivided into 24 groups. A set of
scattering matrices calculated for various temperatures by the Koppel-Young model
is applied for hydrogen bonded in a water molecule. Group cross-sections of nuclides
14
Page 18
and the scattering matrixes have been obtained with the use of the same algorithms
and nuclear data (TEPCON library) as in the case of the MCU-RFFI/A code.
l Ninety-six FPs are taken into account under burnup calculation. The TVS-M code
uses a library of their yields based on ENDF/B-VI data and group cross-sections
from the MCU data library.
The TVS-M calculation technique consists of the following main stages: (1) a
detailed calculation of all cell types forming a fuel assembly (such as fuel cell, absorber
cell, and so on) is performed, and correspondin g sets of few-group constants are
computed (number of the groups is arbitrary); then (2) these group-effective constants
are used in a group nodal diffusion calculation of the whole assembly:
Computing of the neutron’s spatial distribution in the specified energy group
structure (or at a specified energy point) is performed by method of passing through
probability (similar to the first collision probability method). At the present time, an
angular distribution of the one-direction neutron’s current at a given zone boundary is
described by six angular harmonics. A neutron’s reflection at a cell boundary takes into
account a real hexagonal form of the boundary. For a calculation of an effective
diffusion coefficient, both isotropic and anisotropic probabilities in R and Z directions
are computed in the same manner.
In the fast energy region, a detailed calculation is carried out with the use of group
and subgroup microscopic cross-sections from the ABBN library. In doing so, each
energy group is subdivided into an arbitrary number of intervals of uniform width. The
energy loss of a neutron on nonelastic slowing down is described by a continuous
function specified by the group matrix of nonelastic transfers. The neutron energy loss
on elastic slowing down is also described continuously, taken into account scattering
anisotropy in a system of inertia centers. In the resonance region, the slowing down of
neutrons is calculated in the same manner as in the fast energy region. Cross-sections of
resonance nuclides at each energy point are calculated with the CROSS code using the
file of resonance parameters for each nuclide. Interference between potential and
resonance scattering, the cross-section’s temperature dependence, and p-wave
contribution into scattering cross-sections are strictly taken into consideration. An
effect of mutual overlapping of different resonance nuclides is also taken into account.
A calculation technique applied in the thermal energy region is traditional. The
group thermalization equation is solved by the method of passing through probability.
The sources are shaped when the upper energy groups are calculated, with Nelkine
asymptotic limit of scattering applied for hydrogen.
Page 19
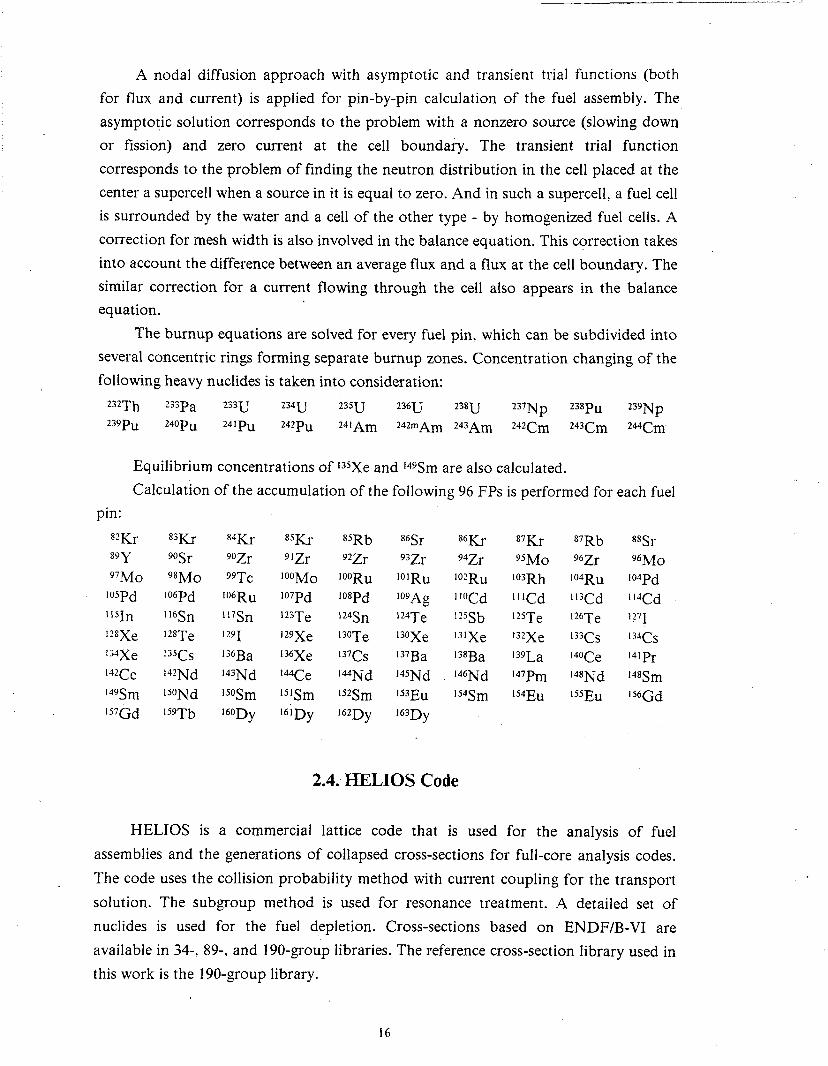
A nodal diffusion approach with asymptotic and transient trial functions (both
for flux and current) is applied for pin-by-pin calculation of the fuel assembly. The
asymptotic solution corresponds to the problem with a nonzero source (slowing down
or fission) and zero current at the cell boundary. The transient trial function
corresponds to the problem of finding the neutron distribution in the cell placed at the
center a supercell when a source in it is equal to zero. And in such a supercell, a fuel cell
is surrounded by the water and a cell of the other type - by homogenized fuel cells. A
correction for mesh width is also involved in the balance equation. This correction takes
into account the difference between an average flux and a flux at the cell boundary. The
similar correction for a current flowing through the cell also appears in the balance
equation.
The burnup equations are solved for every fuel pin, which can be subdivided into
several concentric rings forming separate burnup zones. Concentration changing of the
following heavy nuclides is taken into consideration: 2i2Th 233pa 233U 234U 23SU 236U 238U 237Np 238Pu 2s9Np 239pu 240Pu 24’Pu 2“2Pu 24’Am 242mAm 243Am 242Cm 243Cm 244Cm
Equilibrium concentrations of ‘35Xe and ‘@Sm are also calculated.
Calculation of the accumulation of the following 96 FPs is performed for each fuel
pin:
82&
89Y 9’Mo ‘“5Pd ll5In
I28Xe
134Xe
l42Ce
‘49Sm ‘57Gd
83Q
90Sr 98Mo ‘06Pd I 16Sn l28Te
I “SCS
142Nd lsoNd ‘59Tb
84Kr 90Zr 99Tc “‘6Ru I 17Sn ‘291
l36Ba
l43Nd
lsoSm ‘60Dy
8*Rb 92Zr ““‘Ru ‘08Pd 124Sn l3OTe
‘Ts IaNd ls2Sm ’ QDy
86Sr 93Zr ‘O’Ru ‘09Ag
l2”Te 13OXe
‘37Ba ‘45Nd 15jEU
‘63Dy
86Kr 94Zr
102Ru
’ ’ OCd l25Sb l3lXe
l38Ba
‘b6Nd 154Sm
87Kr 9*Mo ‘O3Rh ’ ’ ‘Cd l25Te
t32Xe
‘39La ‘47Pm 154Eu
87Rb 96Zr ‘@‘Ru I l3Cd
‘26Te Ii3(-J
140Ce ‘48Nd ls5Eu
88Sr 96Mo ‘04Pd ’ ‘lCd ‘277
I”“&
14’Pr ‘48Sm *S6Gd
2.4: HELIOS Code
HELIOS is a commercial lattice code that is used for the analysis of fuel
assemblies and the generations of collapsed cross-sections for full-core analysis codes.
The code uses the collision probability method with current coupling for the transport
solution. The subgroup method is used for resonance treatment. A detailed set of
nuclides is used for the fuel depletion. Cross-sections based on ENDF/B-VI are
available in 34-, 89-, and 190-group libraries. The reference cross-section library used in
this work is the 190-group library.
16
Page 20
2.5. Program Complex TRIANG-P WR
The program complex TRIANG-PWR is a new version of TRIANG code /14/ for
three-dimensional calculations of VVER reactors. TRIANG-PWR is used for
simulation of (1) reactor burnup while maintaining criticality by adjusting the
concentration of dissoived boron in the coolant and (2) refuelling.
Three-dimensional neutron fluxes are calculated by the diffusion approximation.
Number of points in a plane is 6000 (base variant). Angles of a symmetry from 30”
to 180” on a triangular (in a plane) grid are accepted. The maximum number of planes
is 50.
TRIANG-PWR is used mainly for three-dimensional, rough mesh calculations of
VVER type reactors. A grid with 7 nodes per one fuel assembly is usually used. If
needed, more detailed geometric descriptions with tighter grids are possible. In this case
the specific cells containing, for example, absorber regions (absorber/burnable absorber
rods surrounded by fuel pins) are formed within the assembly. A grid pitch will be
something like the trebled fuel pin one. Fine mesh (pin-by-pin) calculations are possible
too.
To save computation time, the few-group approach is utilized. The homogenized
macroscopic cross-sections of zones of a three-dimensional model are determined from
cell (fuel assembly) calculations. The macroconstants, generally speaking, depend on
instantaneous conditions of fuel assembly operation: water density, temperature of
water and fuel, concentration of a dissolved boron, etc.
To obtain accurate macroscopic cross-sections, an iterative process is required. In
a complex TRIANG mode, the correction of constants can be produced through a
given number of external iterations.
The WIMS-ABBN code is used to make cell burnup calculations and, as a result,
to obtain few-group macroscopic cross-sections. Then the program PARSEC
determines approximating coefficients as a function of state variables for zone required.
These coefficients are used by the TRIANG code to calculate and to correct
macroscopic cross-sections during reactor calculations.
In present work the TRIANG code was used for pin-by-pin calculations of multi-
assembly structure (Variants VI3 and V14). All cell macroconstants during burnup were
found in according with benchmark specification at constant water density and
temperature, fuel temperature and dissolved boron concentration.
17
Page 21
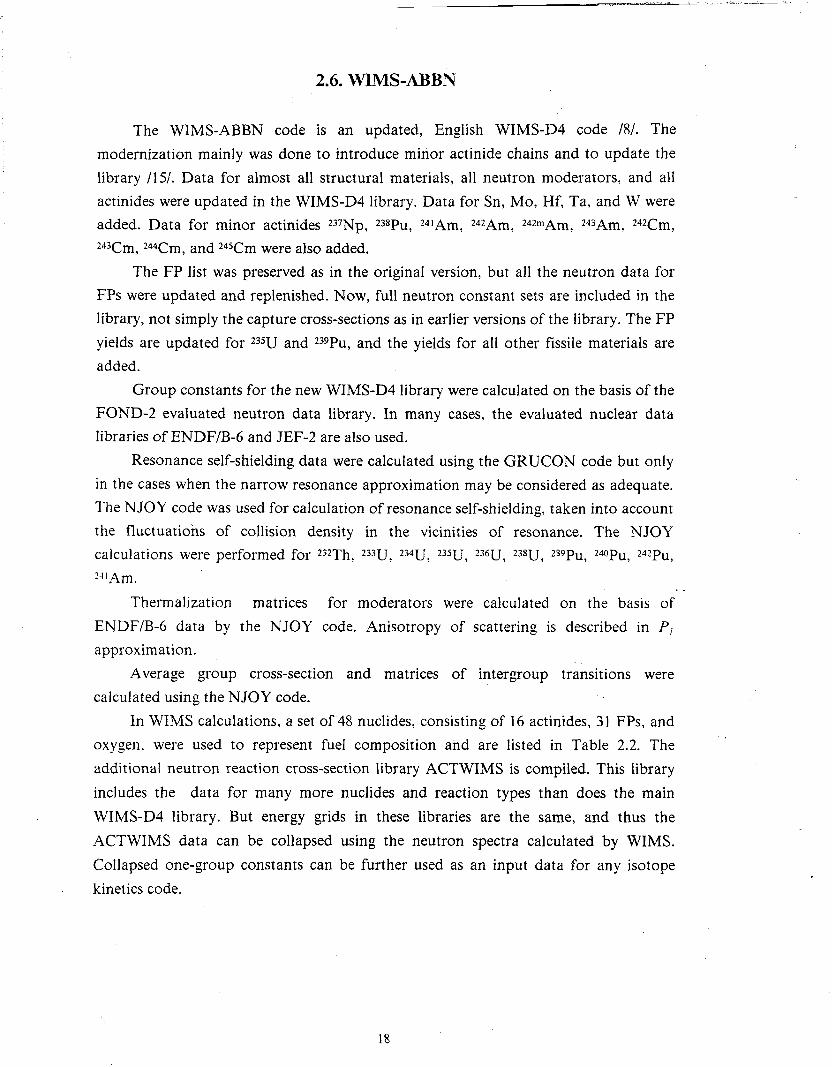
2.6. WWIS-ABBN
The WIMS-ABBN code is an updated, English WIMS-D4 code /8/. The
modernization mainly was done to introduce minor actinide chains and to update the
library /IV. Data for almost all structural materials, all neutron moderators, and all
actinides were updated in the WIMS-D4 library. Data for Sn, MO, Hf, Ta, and W were
added. Data for minor actinides 237Np, 238Pu, 241Am, 242Am, 242mAm, z4jArn, 242Cm,
243Cm, 244Cm, and 24sCm were also added.
The FP list was preserved as in the original version, but all the neutron data for
FPs were updated and replenished. Now, full neutron constant sets are included in the
library, not simply the capture cross-sections as in earlier versions of the library. The FP
yields are updated for 235U and 239Pu, and the yields for all other fissile materials are
added.
Group constants for the new WIMS-D4 library were calculated on the basis of the
FOND-2 evaluated neutron data library. In many cases, the evaluated nuclear data
libraries of ENDF/B-6 and JEF-2 are also used.
Resonance self-shielding data were calculated using the GRUCON code but only
in the cases when the narrow resonance approximation may be considered as adequate.
The NJOY code was used for calculation of resonance self-shielding, taken into account
the fluctuations of collision density in the vicinities of resonance. The NJOY
calculations were performed for 232Th, 233U, 234U, 23SU, 236U, 238U, 239pu, 240pu, 242pu,
Z1lAm.
Thermalization matrices for moderators were calculated on the basis of
ENDF/B-6 data by the NJOY code. Anisotropy of scattering is described in P,
approximation.
Average group cross-section and matrices of intergroup transitions were
calculated using the NJOY code.
In WIMS calculations, a set of 48 nuclides, consisting of 16 actinides, 31 FPs, and
oxygen, were used to represent fuel composition and are listed in Table 2.2. The
additional neutron reaction cross-section library ACTWIMS is compiled. This library
includes the data for many more nuclides and reaction types than does the main
WIMS-D4 library. But energy grids in these libraries are the same, and thus the
ACTWIMS data can be collapsed using the neutron spectra calculated by WIMS.
Collapsed one-group constants can be further used as an input data for any isotope
kinetics code.
18
Page 22
Table 2.2
234U
241E
83Kr ‘08Pd l35&
‘5%m
‘60
23SU
242pU
95Mo JOgAg ‘43Nd lS2Sm
Nuclides representing fuel composition
Actinides 236U 238U 23’Np 238h 239Pu 24Opll
241Am 243b 242Cm 2Wm 144Cm 245Cm
FPS
99Tc ‘O’Ru ‘03Ru ‘03Rh IOSRh ‘05Pd “Xd ’ ’ 5111 I?i] ‘31Xe ‘33CS ‘34Cs ‘45Nd I47pm 14’Srn 148Pm 14Y3m 150Srn ‘53Eu 154Eu ‘=Eu ‘S’Gd Lumped FP
Oxygen
Improvements were introduced in WIMS-D4. Resonance self-shielding of neutron
cross-sections is extended to the thermal region. This improvement is especially
important for the accurate treatment of neutron capture in 242Pu, which has a resonance
at very low energy (2.68 eV). The second improvement consists of the addition of a
special module (AVERAGE) for collapsing the ACTWIMS cross-sections using
WIMS’s cell-averaged neutron spectra. Collapsed one-group cross-sections are then
used in kinetics calculations.
The number of nuclear reactions considered in the WIMS library during actinide
generation was considerably extended. However, the structure of the WIMS-D4 library
does not allow the inclusion of some nuclear reactions. The production of 2jzAm and
*d?InArn by the 211Am neutron capture cannot be taken into account today because the
current version of the WIMS-D4 code cannot treat branching in the capture process.
Thus, the production of 242Cm, 243Cm, 244Cm and 245Cm are ‘considered inaccurately.
For this reason, for any nuclide, the reaction (n, 2n) cannot be considered if the
reaction (n, y) has been included.
The CREDE code was produced to correct these flaws, This code works together
with WIMS and AVERAGE. The CREDE code is used for calculations of heavy metal
(HM) (229 I A I 245) and its decay products concentrations during burnup and over a
long period after unloadin,. (J It should be noted that these refinements, as a rule, are
insignificant for the nuclides having effect on neutron balance and their influence on
WIMS neutron flux calculations are not taken into account.
Figure 2.3 shows the nuclide chains that are taken into account in the CREDE
code depletion calculations.
19
Page 23
1. /*
2. -+
3. e
4. L
5. t
6. 4
7. A/
8. Jr
reaction ( n,f )
reaction ( n,y )
reaction ( 11,211
J reaction ( n,3n
fl -decay
k -capture
a -decay
y -decay
LEGEND:
: :
.’ :
: .-
Discontinuous lines indicate reactions not involved
in CREDE
---1 227Th
18.72di i7- ?‘Ra f
*) Transitions concerning *4*Am:
Fig. 2.3
20
Page 24
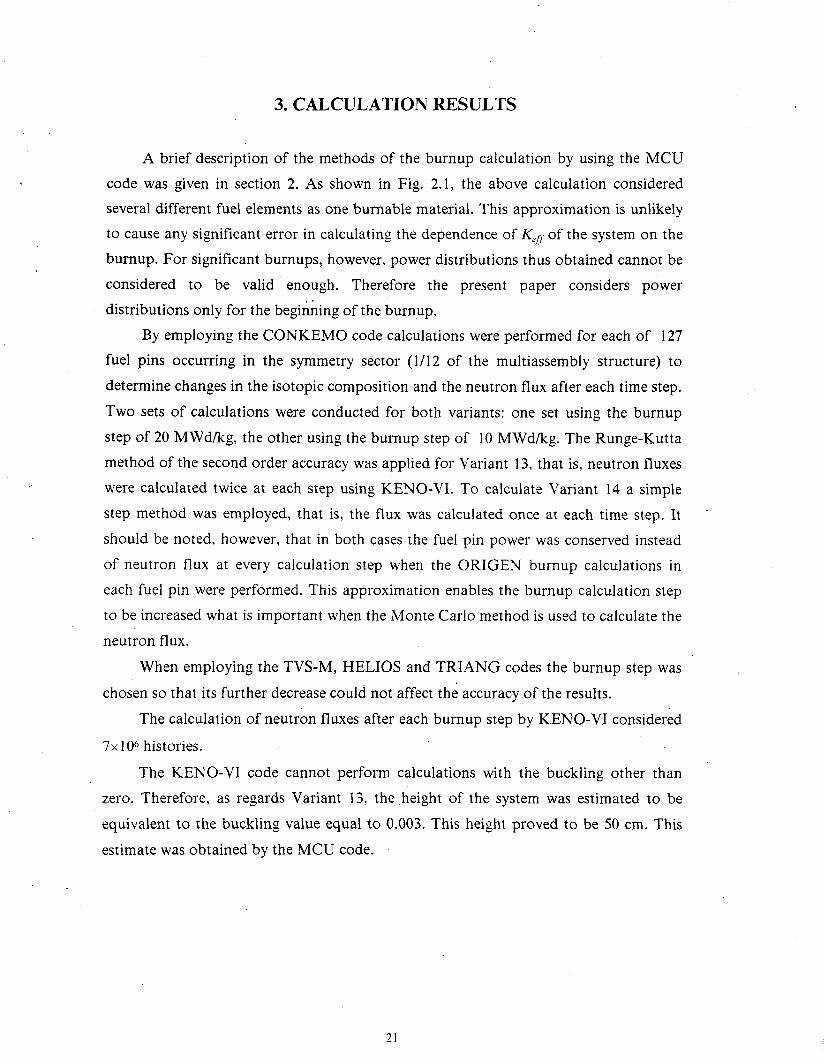
3. CALCULATION RESULTS
A brief description of the methods of the burnup calculation by using the MCU
code was given in section 2. As shown in Fig. 2.1, the above calculation considered
several different fuel elements as one burnable material. This approximation is unlikely
to cause any significant error in calculating the dependence of Kert- of the system on the
burnup. For significant burnups, however, power distributions thus obtained cannot be
considered to be valid enough. Therefore the present paper considers power
distributions only for the beginning of the burnup.
By employing the CONKEMO code calculations were performed for each of 127
fuel pins occurring in the symmetry sector (l/12 of the multiassembly structure) to
determine changes in the isotopic composition and the neutron flux after each time step.
Two sets of calculations were conducted for both variants: one set using the burnup
step of 20 MWd/kg, the other using the burnup step of 10 MWd/kg. The Runge-Kutta
method of the second order accuracy was applied for Variant 13, that is, neutron fluxes
were calculated twice at each step using KENO-VI. To calculate Variant 14 a simple
step method was employed, that is, the flux was calculated once at each time step. It f
should be noted, however, that in both cases the fuel pin power was conserved instead
of neutron flux at every calculation step when the ORIGEN burnup calculations in
each fuel pin were performed. This approximation enables the burnup calculation step
to be increased what is important when the Monte Carlo method is used to calculate the
neutron flux.
When employing the TVS-M, HELIOS and TRIANG codes the burnup step was
chosen so that its further decrease could not affect the accuracy of the results.
The calculation of neutron fluxes after each burnup step by KENO-VI considered
7x 10⁶ histories.
The KENO-VI code cannot perform calculations with the buckling other than
zero. Therefore, as regards Variant 13, the .height of the system was estimated to be
equivalent to the buckling value equal to 0.003. This height proved to be 50 cm. This
estimate was obtained by the MCU code.
Page 25
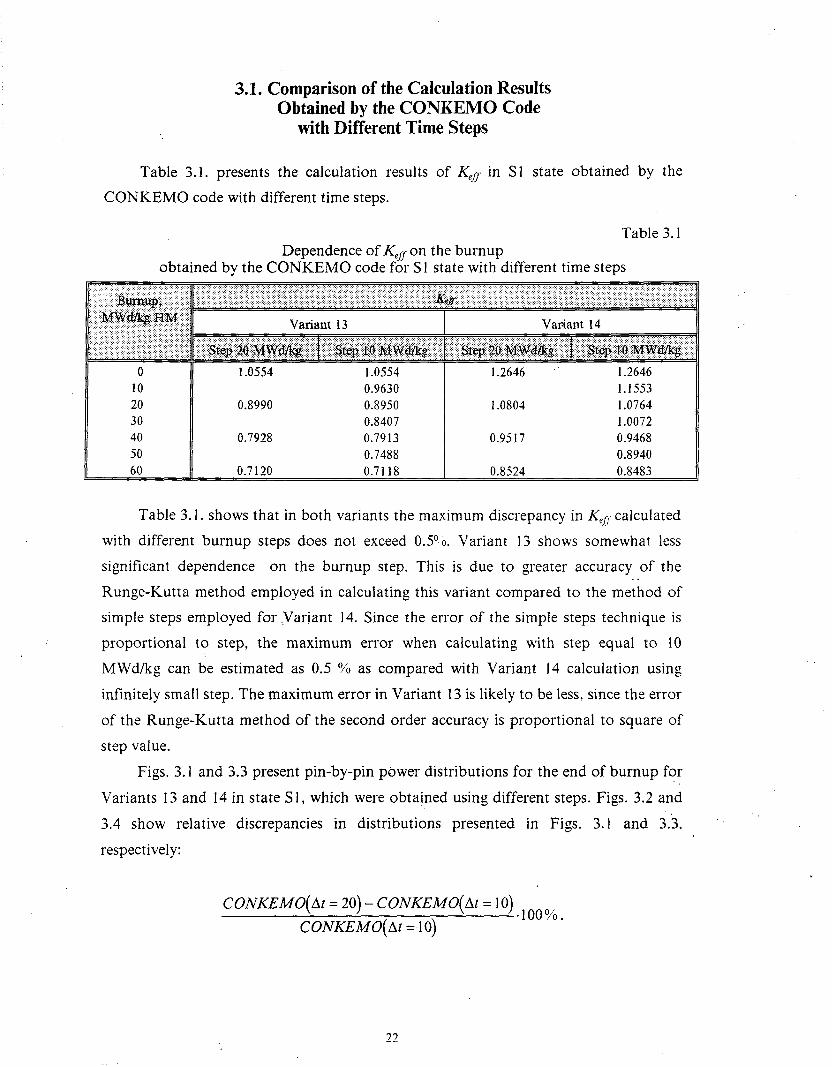
3.1. Comparison of the Calculation Results Obtained by the CONKEMO Code
.. with Different Time Steps
Table 3.1. presents the calculation results of Kef/ in Sl state obtained by the
CONKEMO code with different time steps.
Table 3.1 Dependence of Serf on the burnup
obtained by the CONKEMO code for S 1 state with different time steps . . ,. ..,, ..,.. .., ,, : : .‘. :..:::::,, . . . . . ..(..~........ :j:.. ,.P..::.::,,:.,~ .\.. :, :,;:i’.:.. j’.,:::::.:,‘:‘.,,,, ::.:.: : ‘w:. : .:.: :.,. i”.::, ,. .‘.. ‘.. ; ::,j, .::: ,,:“. .,.. ‘;“‘.: ..,,.., ., ,,
,:J&+& .,, ; .;,:; I:;::;: ;,I.. ,:-i~i’:.iii::;,l~~~~~~:~ i::.;:‘.ili”~:~~~~~~~~~~~~~:~~~~~ I$:;, i,,.i,:i:.::,ii.-j:I~:,::,,:.~ :$>: :; . . . .;:-iy$&#.~ .,,, y .: ., ,.: :“‘..‘~i :: i’:::‘;:: ,.,, :j .:‘;‘:;, :,:‘jj .,: ,I:.’ ‘: ,. ‘..:L: ..v.. : “.’
,,‘:,~~~~~~~~~i~ r :, : i’::::; : ,;; :.. : j ,j i:: j :,,. ~~i:.‘ei;:‘::~~~::~:~:, ;;;;;.Yii--;\i,j;::i~ .;:I: :,:: :..i:i.iil;::~i:~~~I~~,:.~~:~~:~~~~:~~~~
“.. .: .,,, ,.;, .‘,, ...,‘(,‘i’, :.... ., ,. . . . . . . :. :: Variant 13 Variant 14 : ,.;., ; .,,I.: ,.;;(: ,,,, :.. :““:.: “: g :,:;.:, .“. : ,., . . .:. ,::. :,,:,, ,.;g::‘:.::‘:‘i:‘: . : :: : :., : -:;::: .:.:.;, :.,;::::,,, ‘.‘I. . . .‘.‘.‘:‘:A, :‘.‘E, : : : .c./..:,..:., :..:.:.: : .:.s:.;..:., .I.: .,,.:,, .: . . . . . . . ,:,. 5: : .,:.: :,.:..;:::,.,:: 5......: . .:., . . . . . . . . . . . . . . ..~~.....‘.‘..., :: ‘::.::,::.,, ;; .:..: .:,.: .;j:..: ::::,: i&:F;:;:;,, ::. :.:: ,::.y::,,: . . .,. . . . . ‘..::.~,‘:.., ..’ ::..i i ::Q ::::w::i’i:: ,. ,.: . . . . . . . . :i. :...%,. .>‘,:.:::;..‘ : .,::; ,:,:,:,, . . .., :: : :::,;. :
:.:’ .:. :.,::. ., ‘.‘::&::..,: “. ., .>: .,.:: ..’ . . . . ‘.‘.. .y-“::?: ::..:.,:::.: :-:i~~~~~~~~~~~~~~ ;;““i’i~i~~~iti;‘::~:~~~~ ,;;ii::!ii:sr~~~~~~~~ ;: ;;;; :iiiii~~~~~~~~~~~~~~~~~,,:: : :
,,, ,., . . . .,.... ., . . . . . . . . ..I.. ..,. . . . ..F .,.. . . ,.,. :. . .\. ,-.I... ., 0 1.0554 1.0554 1.2646 .’ 1.2646
10 0.9630 1.1553 20 0.8990 0.8950 1.0804 1.0764 30 0.8407 1.0072 40 0.7928 0.7913 0.9517 0.9468 50 0.7488 0.8940 60 0.7120 0.7118 0.8524 0.8483
Table 3.1. shows that in both variants the maximum discrepancy in I&. calculated
with different burnup steps does not exceed 0.5O O. Variant 13 shows somewhat less
significant dependence on the burnup step. This is due to greater accuracy of the
Runge-Kutta method employed in calculating this variant compared to the method of
simple steps employed for Variant 14. Since the error of the simple steps technique is
proportional to step, the maximum error when calculating with step equal to 10
MWd/kg can be estimated as 0.5 O/b as compared with Variant 14 calculation using
infinitely small step. The maximum error in Variant 13 is likely to be less, since the error
of the Runge-Kutta method of the second order accuracy is proportional to square of
step value.
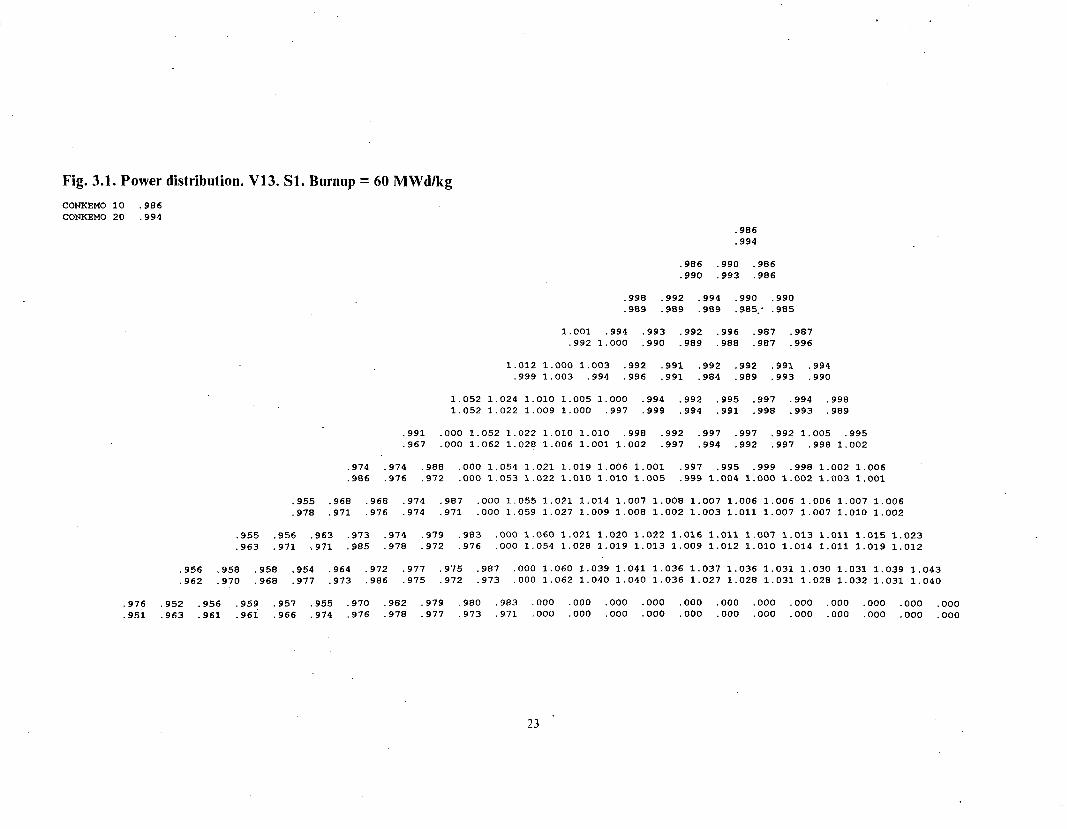
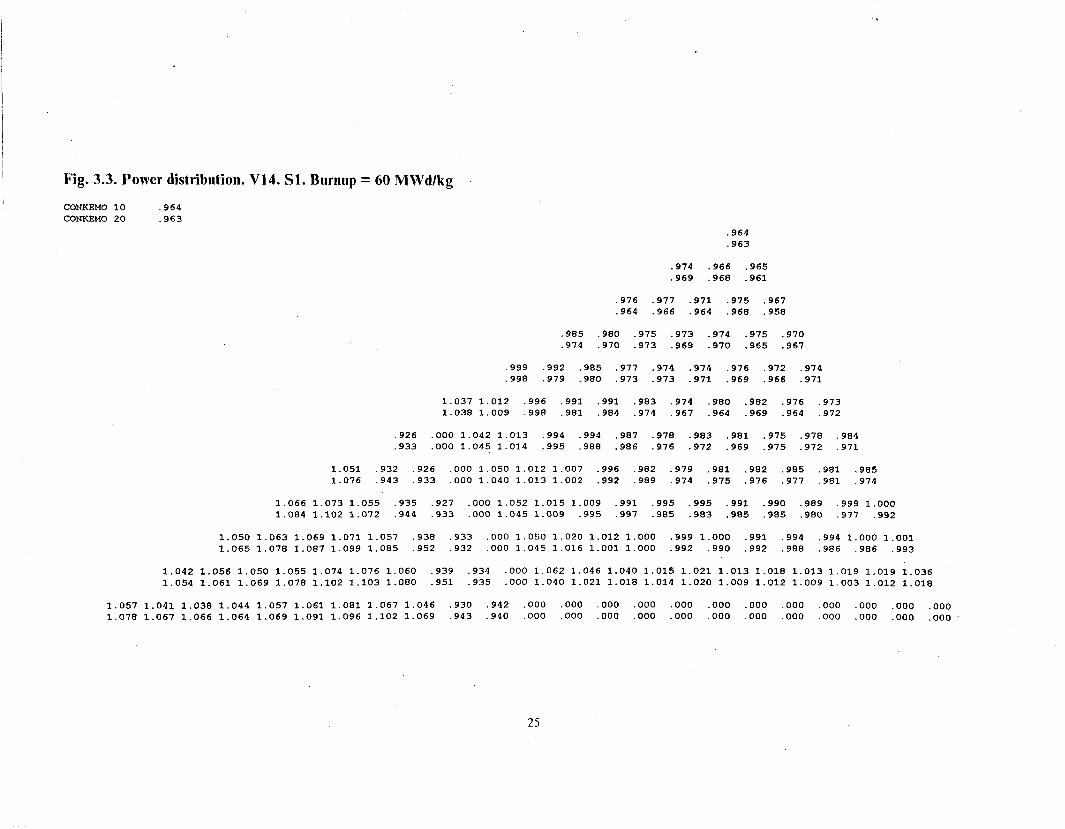
Figs. 3.1 and 3.3 present pin-by-pin power distributions for the end of burnup for
Variants 13 and 14 in state S 1, which were obtained using different steps. Figs. 3.2 and
3.4 show relative discrepancies in distributions presented in Figs. 3.1 and 3.3,
22
Page 26
Fig. 3.1. Power distribution. V13. Sl. Burnup = 60 MWd/kg
CONKEMO 10 .986 CONKEMO 20 .994
.986
.994
.906 .990 .986
.990 .993 .906
.998 .992 .994 .990 .990 ,969 .989 .989 .985.* .985
1.001 ,994 .993 .992 ,996 .987 .987 ,992 1.000 .990 .989 ,988 .987 .996
1.012 1.000 1.003 .992 .991 .992 .992 .991 .994 ,999 1.003 .994 ,996 .991 .984 .989 .993 ,990
1.052 1.024 1.010 1.005 1.000 .994 .992 .995 .997 .994 ,998 1.052 1.022 1.009 1.000 ,997 ,999 .994 .991 .998 .993 ,989
,991 . 000 1.052 1.022 1.010 1.010 ,998 .992 .997 .997 .992 1.005 .995 .967 . 000 1.062 1.028 1.006 1.001 1.002 .997 .994 ,992 .997 .998 1.002
,974 .974 .988 . 000 1.054 1.021 1.019 1.006 1.001 .997 .995 .999 .998 1.002 1.006 .986 ,976 .972 .ooo 1.053 1.022 1.010 1.010 1.005 . 999 1.004 1.000 1.002 1.003 1.001
.955 .968 .968 .974 .987 .OOO 1.055 1.021 1.014 1.007 1.008 1.007 1.006 1.006 1.006 1.007 1.006 ,978 .971 ,976 .974 ,971 .ooo 1.059 1.027 1.009 1.008 1.002 1.003 1.011 1.007 1.007 1.010 1.002
.955 .956 .963 ,973 .974 .979 ,983 ,000 1.060 1.021 1.020 1.022 1.016 1.011 1.007 1.013 1.011 1.015 1.023 ,963 .971 ;971 .985 ,970 ,972 .976 000 1.054 1.028 1.019 1.013 1.009 1.012 1.010 1.014 1.011 1.019 1.012
.956 .958 .958 .954 .964 .972 .9?7 .975 .987 000 1.060 1.039 1.041 1.036 1.037 1.036 1.031 1.030 1.031 1.039 1.043
.962 .970 .968 .977 .973 ,986 .975 ,972 .973 000 1.062 1.040 1.040 1.036 1.027 1.028 1.031 1.026 1.032 1.031 1.040
,976 .952 .956 .959 .957 .955 ,970 .982 .979 -980 ,983 .OOO .OOO .ooo .ooo .ooo .ooo .ooo .ooo .ooo .ooo .ooo .ooo .951 .963 .961 .96i .966 .974 .976 ,978 .977 .973 .97l ,000 ,000 .ooo .ooo .ooo .ooo .ooo .ooo .ooo ,000 .ooo .ooo
Page 27
loinlo
m
I+ l-4
1 (D
l-l 00 r-4
.
no0 .
.
0
I I ,
I N
O0
. .
moo
I+ .
.
cv100 4
.
0
Page 28
Fig. 3.3. Power distribution. V14. Sl. Burnup = 60 MWd/kg
CONKEMO 10 ,964 CONKEMO 20 .963
.964
.963
,974 .966 ,965 .969 .968 .961
.976 .977 .971 .975 .967
.964 .966 .964 .968 .958
.985 .980 .975 .973 .974 .975 .970
.974 .970 .973 .969 .970 .965 .967
,999 .992 ,985 .977 .974 .974 976 .972 .974 ,998 .979 .980 .973 .973 .971 1969 966 .971 .
1.037 1.012 ,996 ,991 .991 .983 .974 ,980 .982 .976 .973 1.038 1.009 .998 .981 .984 .974 .967 .964 .969 .964 .972
.926 . 000 1.042 1.013 ,994 .994 .987 ,978 .983 .981 .975 .978 .984 ,933 000 1.045 1.014 .995 .988 .986 .976 .972 .969 ,975 .972 .971
1.051 ,932 .926 . 000 1.050 1.012 1.007 .996 ,982 .979 ,981 .982 .985 ,981 .985 1.076 .943 ,933 000 1.040 1.013 1.002 .992 .989 .974 .975 .976 .977 .981 ,974
1.066 1.073 1.055 ,935 ,927 .OOO 1.052 1.015 1.009 .991 ,995 .995 .991 .990 .989 ,999 1.000 1.004 1.102 1.072 .944 .933 .ooo 1.045 1.009 ,995 ,997 .985 .983 .985 .985 .980 .977 ,992
1.050 1.063 1.069 1.071 1.057 ,938 ,933 .OOO 1.050 1.020 1.012 1.000 .999 1.000 .991 ,994 .994 1.000 1.001 1.065 1.078 1.087 1.099 1.085 .952 .932 ,000 1.045 1.016 1.001 1.000 .992 .990 .992 .9FJ8 ,986 .986 ,993
1.042 1.056 1.050 1.055 1.074 1.076 1.060 .939 .934 000 1.062 1.046 1.040 1.015 1.021 1.013 1.018 1.013 1.019 1.019 1.036 1.054 1.061 1.069 1.078 1.102 1.103 1.080 .951 .935 .ooo 1.040 1.021 1.018 1.014 1.020 1.009 1.012 1.009 1.003 1.012 1.018
1.057 1.041 1.038 1.044 1.057 1.061 1.081 1.067 1.046 .930 .942 ,000 .OOO .ooo .ooo .ooo .ooo .ooo .ooo ,000 .ooo 000 .ooo 1.078 1.067 1.066 1.064 1.069 1.091 1.096 1.102 1.069 ,943 .940 ,000 ,000 .OOO .ooo .ooo .ooo .ooo .ooo .ooo .ooo :ooo ,000
25
Page 29
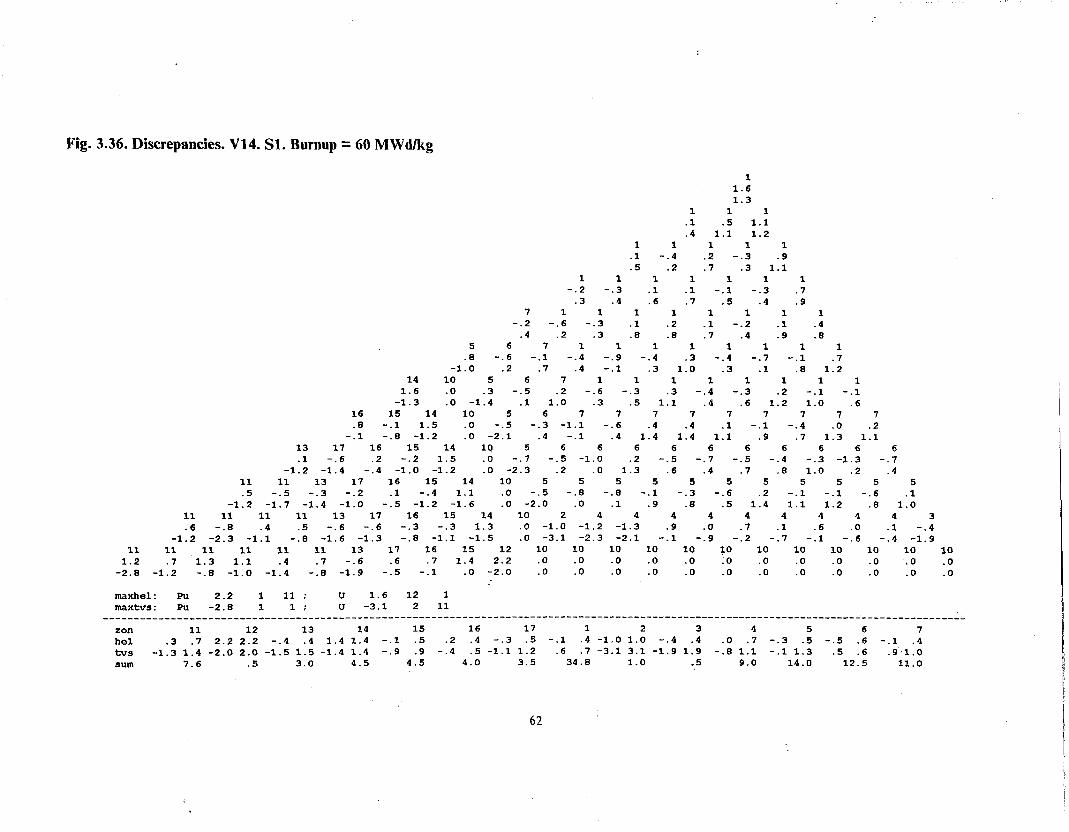
Fig. 3.4. Discrepancies. V14. Sl. Burnup = 60 MWdkg
1 1 1 -.5 .2 -.4
1 1 1 1 1 -1.2 -1.1 -.7 -.7 -.9
1 1 1 1 1 1 1 -1.1 -1.0 -.2 -.4 -.4 -1.0 -.3
7 1 1 1 1 1 1 1 1 -.l -1.3 -.5 -.4 -.l -.3 -.7 -.6 -.3
5 6 7 1 1 1 1 1 1 1 1 .l -.3 .2 -1.0 -.7 -.9 -.7 -1.6 -1.3 -1.2 -.l
14 10 5 6 7 1 1 1 1 1 1 1 1 .8 .o .3 .l .l -.6 -.l -.2 -1.1 -1.2 .O -.6 -1.3
16 15 14 10 5 6 7 7 7 7 7 7 7 7 7 2.4 1.2 .El .O -1.0 .l -.5 -.4 .7 -.5 -.6 -.6 -.0 .O -1.1
13 17 16 15 14 10 5 6 6 6 6 6 6 6 6 6 6 1.7 2.7 1.6 1.0 .6 .O -.7 -.6 -1.4 .6 -1.0 -1.2 -.6 -.5 -.9 -2.2 -.8
11 11 13 17 16 15 14 10 5 5 5 5 5 5 5 5 5 5 5 1.4 1.4 1.7 2.6 2.6 1.5 -.l .O -.5 -.4 -1.1 .O -.7 -1.0 .l -.6 -.B -1.4 -.8
11 11 11 11 13 17 16 ‘15 14 10 2 4 4 4 4 4 4 4 4 4 3 1.2 .5 1.8 2.2 2.6 2.5 1.9 1.3 .l .o -2.1 -2.4 -2.1 -.l -.l -.4 -.6 -.4 -1.6 -.7 -1.7
11 11 11 11 11 11 13 17 16 15 12 10 10 10 10 10 10 10 10 10 10 10 10 2.0 2.5 2.7 1.9 1.1 2.8 1.4 3.3 2.2 1.4 -.2 .O .O .o .o .o .O .o .o .o .o .O .O
maxerr : Pu 3.3 1 8 : u -2.4 2 12 __--__-__-__-___--__----------------------------------------------- -------------------------------------------------------------------------
zon 11 12 13 14 15 16 17 1 2 3 4 5 6 7 err 1.7 1.8 -.2 .2 1.9 2.0 .4 .5 1.2 1.3 2.1 2.1 2.7 2.7 -.7 . 8 -2.1 2.1 -1.7 1.7 -.9 1.2 -.6 .7 -.7 1.0 -.3 .5 sum 7.6 .5 3.0 4.5 4.5 .' 4.0 3.5 34.8 1.0 .5 9.0 14.0 12.5 11.0
1 -.l
26
Page 30
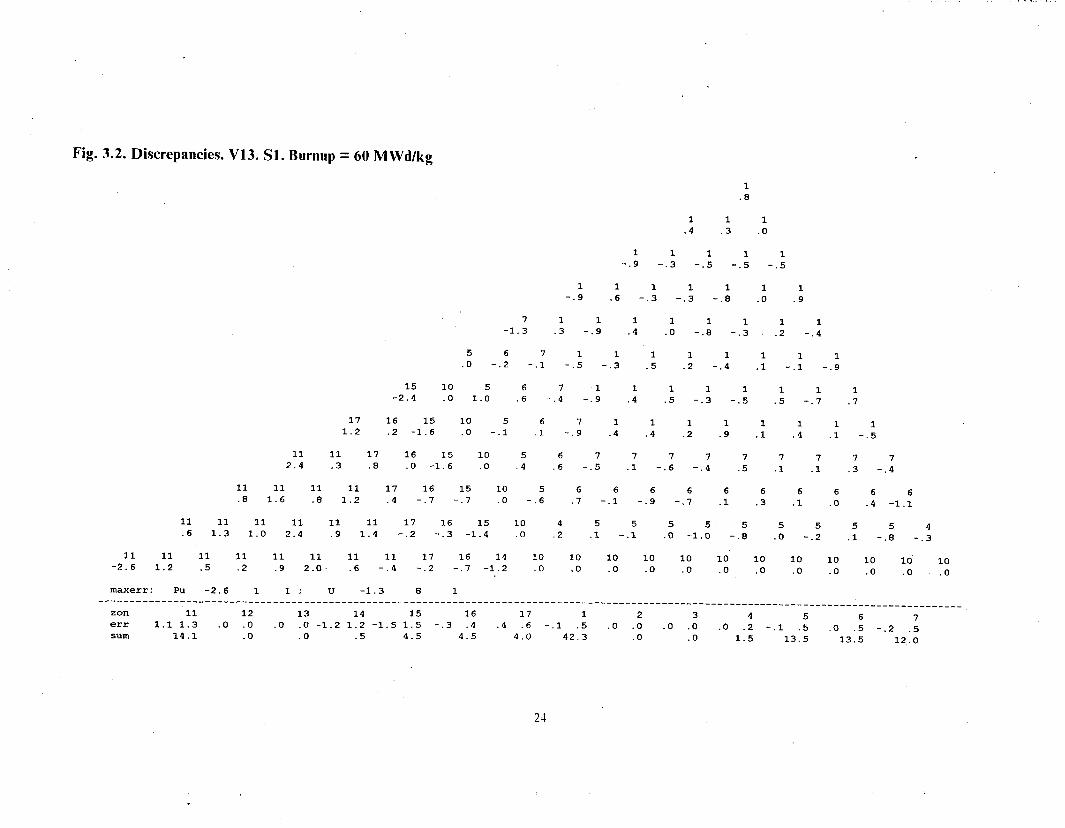
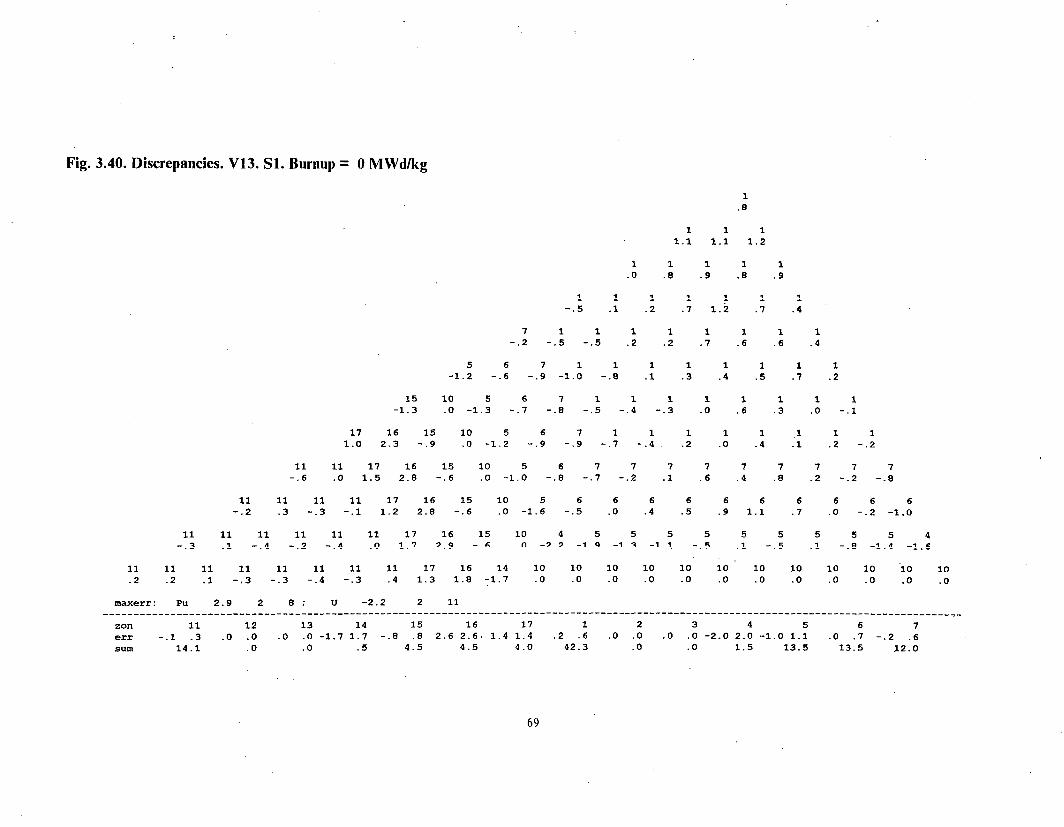
The same figures present the numbers of the zones in which the fuel pins are
assumed to be integrated to perform analysis. The lower part of the figures shows
arithmetic mean and root-mean-square deviations in particular zones as well as the
number of calculation points in the zones. Maximum distinctions ,in plutonium and
uranium fuel assemblies as well as the coordinates of fuel pins of which these
distinctions occur are given too. (See row number from bottom to top, point number
from left to right.)
Figures 3.2 and 3.4 show that the maximum discrepancies in power distributions
for the end of the burnup obtained with different burnup steps in both Variants are
about 390. Due to the above mentioned linear dependence of the calculation error on
the burnup step the maximum calculation error in Variant 14 with the burnup step of
10 MWd/kg, related to the finiteness of the step, can be estimated to be 39/b as well. In
variant 13 the error is likely to be less due to the root-mean-square dependence on the
burnup step.
The values of Kc.- and power distribution obtained by the CONKEMO code with
the step of 10 MWd/kg are presented below to enable them to be compared with the
data obtained by other codes.
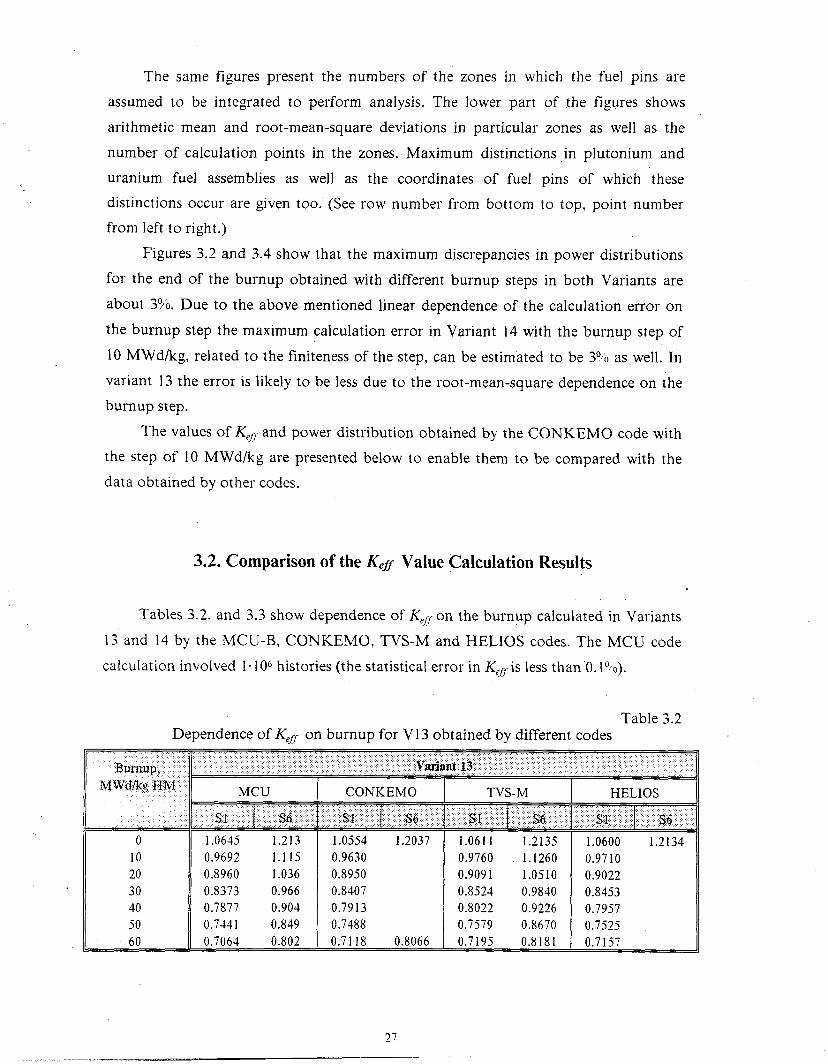
3.2. Comparison of the Kea Value Calculation Results
Tables 3.2. and 3.3 show dependence of Kffl on the burnup calculated in Variants
13 and 14 by the MCU-B, CONKEMO, TVS-M and HELIOS codes. The MCU code
calculation involved 1.1 O6 histories (the statistical error in K,,is less than ‘0. 1Of0).
Table 3.2 Dependence of KeIf on burnup for V13 obtained by different codes
‘../’ ..:. .,: ‘. : ., ‘,., .,’ y j :., : : : “., .I Bunlup, ..$&& $3 :‘.: ‘.. :
MWd&HM MCU CONKEMO TVS-M HELIOS
1.. : .’
;-g& .:“.,. ;,.;: ::c+ “’
s1 .: : .,.. .tg.. :‘: ,: ‘. . . . ..s1 .‘.,.
; ,: j:; :,,;,,,:, ,sfj ,. ;s:1,:, ;...,:._.ii: : ‘.@j
0 1.0645 1.213 1.0554 1.2037 1.0611 1.2135 1.0600 1.2134 10 0.9692 1.115 0.9630 0.9760 1.1260 0.9710 20 0.8960 1.036 0.8950 0.909 1 1.0510 0.9022 30 0.8373 0.966 0.8407 0.8524 0.9840 0.8453 40 0.7877 0.904 0.7913 0.8022 0.9226 0.7957 50 0.7441 0.849 0.7488 0.7579 0.8670 0.7525 60 0.7064 0.802 0.7118 0.8066 0.7195 0.8181 0.7157
21
-, -_ .___--.. --__ ,.~._
Page 31
Table 3.4 presents the reactivity shifts on burning and changing the fuel and
moderator temperatures in going from operation state to cold one. Reactivity shifts
were calculated with the formula:
- P 1.2 = K2 K,
K,*K, ’
in so doing Tables 3.2 and 3.3 data were used.
Table 3.3 Dependence of Kg on burnup for V14 obtained by different codes
:: ;$&i&;j :j .:j
;. ‘1 _:I ;:,j ::Ii, :c%:::,,j :::fi .:,::; ““.,).-“..~’ 3. ” : ” .:: >. ‘?.:,:,,j:‘j:.,:, -:.. . . . . . . . :“p..:. ., ‘...’ ,,,. ‘..‘,,: ,,,.,,, ‘,’ : ,, ;;,: ,:,: y,,;.. ..,,( ,. . . ,,, ,., ,‘,I ,: ,’ j/ .,
., ., ,., ,, ,., ;: ‘.;;I :‘?:. .,.: ;;-I:,;;;:: : :$ ‘lilii’“‘.:::iii:~‘,;~~~~~~~~~~? I:&::j::I::; l: :: :y;:;,: : :. ‘:: : ~~y:::T;;I fc:;;;:.yl .i“:2;‘:, ~~..: :.: ,;..; ,j :: ,: : 1.1 I: ‘y:) .~ .: :: : ,*. ,:: j .: ..: j :
::‘+$yf$igj~j. ’ MCU CONKEMO TVS-M HELIOS .:,, ,,:: . . . ., .:. .:: ::.,. . . ‘.:....-: j :..:.:. :.‘.,..,, ‘: . . . . . . . . . . . . . :,,: .,. . ,..
~,~:.‘.i:;:~:.;v&tj: ,:.,::‘::~.,,::.::.: ,:., : .j,:, .‘.:. . . ‘.:,ji:;~;:: >; :::j i’:-:,$4&::.:‘.‘I:; . . . . .:..,.: : .,, .:. :. : . . . . : .:, ,,
0 1.2645 1.360 1.2646 1.3603 1.2626 1.3598 1.265 1 1.3629 10 1.1616 1.255 1.1553 1.1636 1.2607 1.1581 1.2608 20 1.0849 1.167 1.0764 1.0834 1.1763 1.0762 1.1749 30 1.0175 1.087 1.0072 1.0157 1.1015 1.0084 1.0993 40 0.9594 1.017 0.9468 0.9558 1.0329 0.9490 1.0302 50 0.9079 0.956 0.8940 0.9027 0.9707 0.8968 0.9676 60 0.8628 0.902 0.8483 0.9069 0.8565 0.9151 0.8521 0.9131
Table 3.4 Reactivity shifts on burnup and
changing the fuel and moderator temperatures from operation state to cold one at the beginning and the end of burnup
..‘, $a~;,,,:yF;z-; MCU CONKEMO TVS-M HELIOS
Variant 13
p bumup -0.478 -0.457 -0.147 -0.453
P h-c(O) 0.115 0.117 0.118 0.119 p h-c(60) 0.169 0.165 -0.168
Variant 14
p bumup -0.368 -0.388 -0.376 -0.383 P h-c(O) 0.056 0.056 0.057 0.057
,D tx(60) 0.050 0.076 0.075 0.078
The consideration of results presented in Tables 3.2e3.4 shows:
1. The Kej7 values for the beginning of. burnup in states Sl and S6 calculated with the
use of different codes are in good agreement. Maximum discrepancy does not exceed
0.5 Ob. The exception are the Ker/ values calculated using CONKEMO code for
Variant 13, which are somewhat less (by 0.4+0.8 “0). This is likely because the height
corresponding to specified bucklin g was not enough accurately estimated. For
Variant 14 with zero buckling, the Ken values calculated using CONKEMO are in a
good agreement with other calculations.
28
Page 32
2. Burnup reactivity shift and temperature reactivity shift caused by fuel and coolant
temperature change in going from operation state to cold one are in a good
agreement as well. Maximum discrepancies of results are 6 % for burnup reactivity
shift *and 4 % for reactivity related with going from operation state to cold one. Only
one exception is the reactivity shift related with reactor cooling at the end of burnup
in Variant 14, which was calculated using MCU code. This shift is significantly less
then those obtained by use of other codes.
3.3. The Results of Power Distribution Calculations
Using Benchmark Codes at the Beginning of Burnup
Figs. 3.5 and 3.7 present power distributions at the beginning of burnup for
Variants 13 and 14 at state Sl obtained with use of MCU and CONKEMO codes. Figs.
3.6 and 3.8 show relative distinctions in given distributions:
MCU - CONKEMO . , ooo ‘0.
CONKEMO
The same figures give arithmetic mean and root-mean-square deviations in the
zones and the number of points. Maximum distinctions in plutonium and uranium fuel
assemblies as well as the coordinates of fuel pins of which these distinctions occur are
given too. (See row number from bottom to top, point number from left to right.)
Figs. 3.6 and 3.8 show that MCU code values of power of fuel pins at assembly
boundaries are slightly greater. The most distinctions are about 3 O,,O and 5 9.0 for MOX
fuel assembly and uranium one, respectively. This level of agreement between
distributions obtained can be considered as satisfactory. However, it seems likely that
the cause of pointed above difference in power in peripheral fuel pins should be found
out later on.
29
Page 33
Fig. 3.5. Power distribution. V13. Sl. Burnup = 0 MWd/kg
CONKEMO ,995 MC0 .985
.995
.985
.990 .991 .991
.981 .992 .990
.996 .991 .992 .994 .994
.989 .982 .984 .987-’ .989
.992 .991 .994 .992 .989 .996 .999
.990 .97-l .980 .983 .986 .904 .990
.9?1 .986 .993 .991 .995 993 .996 . 998 1.000
.978 .988 .988 .987 . 904 :9ee .993 .990 .997
,967 ,974 .985 .992 .998 ,994 .996 .998 .999 .999 1.005 .989 .986 .900 .985 .907 .988 .990 .989 .989 .995 1.004
1.174 .OOO .969 ,977 .907 .991 . 998 1.003 1.004 1.001 1.006 1.010 1.013 1.183 .OOO 1.003 ,996 .992 .994 .995 .909 .995 . 995 1.002 1.001 1.016 . .
.884 . 962 1.170 .ooo ,973 .985 . 995 1.005 1.010 1.010 1.016 1.015 1.020 1.021 1.028
.860 . 956 1.180 . 000 1.004 1.001 1.002 1.008 . 999 1.007 1.006 1.012 1.010 1.022 1.032
. 1.173 .OOO .980 . 995 1.013 1.022 :em 830 .a37 .845 .a70 .881 960 959 1.196 .OOO 1.019 1.015 1.023 1.028 1.023 1.028 1.028 1.029 1.026 1.035 1.036 1.033 1.041 1.040 1.046 1.048 1.060 1.060
.815 .815 .828 .848 .887 . 968 1.189 .OOO 1.003 1.025 1.043 1.053 1.062 1.064 1.066 1.072 1.082 1.087 1.104
.807 .809 .814 .a33 .070 . 966 1.200 .OOO 1.044 1.049 1.069 1.068 1.070 1.070 1.078 1.077 1.080 1.093 1.130
.813 .a11 .817 .820 .831 .852 .a93 . 986 1.222 ,000 1.055 1.092 1.112 1.126 1.129 1.128 1.138 1.134 1.148 1.159 1.188
.803 .I90 .805 .809 .824 .845 .B86 .987 1.254 .OOO 1.110 1.124 1.140 1.151 1.152 1.156 1.156 1.165 1.173 1.196 1.240
.000 .808 .810 .815 .818 .825 .836 .861 .922 1.044 1.336 .ooo .ooo .ooo .ooo .ooo .ooo .ooo .ooo .ooo .ooo . 000 . 000 .795 .807 .-I90 .I97 .809 .817 .825 ,858 . 909 1.046 1.379 . 000 .ooo .ooo . 000 . 000 .ooo .ooo . 000 . 000 .ooo .ooo .ooo
30
Page 34
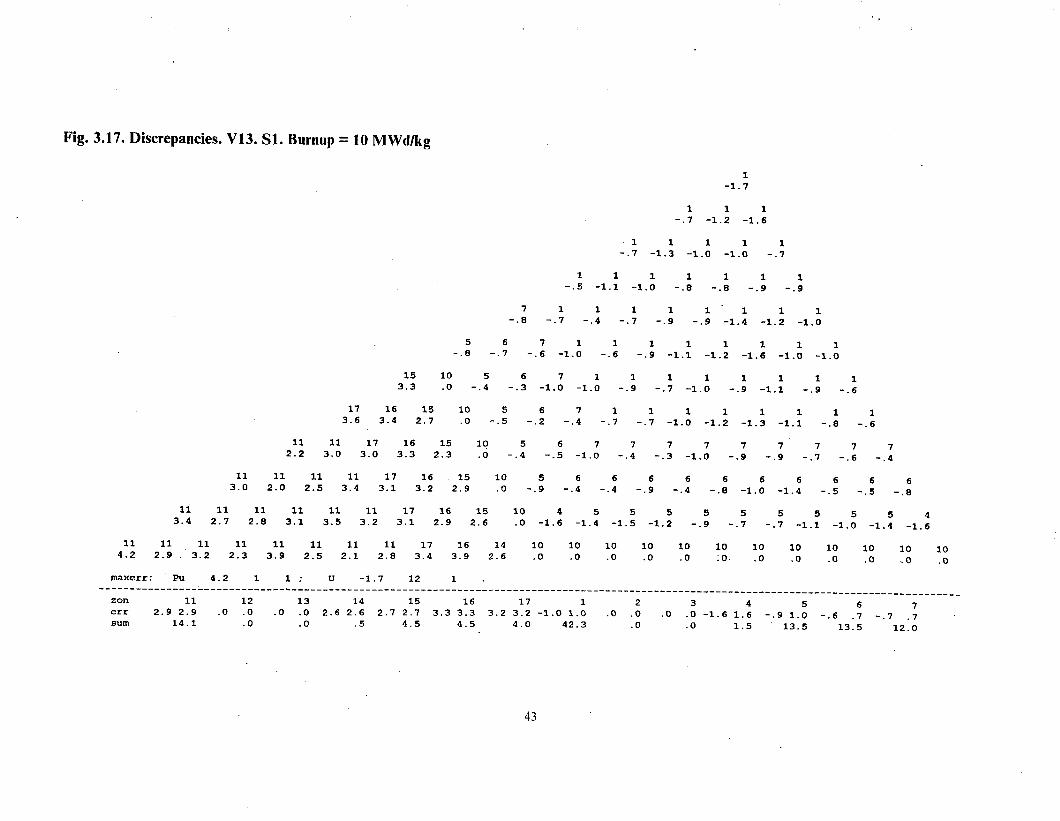
Fig. 3.6. Discrepancies. V13. Sl. Burnup = 0 MWdlkg
. -1.:
1 1 1 -.9 .l -.l
1 1 1 1 1 -. 7 -.9 -.B -.I -.5
1 1 1 1 1 1 1 -.2 -1.4 -1.4 -.9 - :3 -1.2 -.9
7 1 1 1 1 1 1 1 1 .l .2 -.5 -.4 -1.1 -.5 -.3. -.8 -.3
5 6 7 1 1 1 1 1 1 1 1 2.3 1.2 .3 -.7 -1.1 -.6 -.6 -.9 -1.0 -.4 -.l
15 10 5 6 7 1 1 1 1 1 1 1 1 .B .o 3.5 1.9 .5 .3 -.3 -1.4 -.9 -.6 -.4 -.9 .3
17 16 15 10 5 6 7 1 1 1 1 1 1 1 1 -2.7 -.6 .9 .O 3.2 1.6 .I .3 -1.1 -.3 -1.0 -.3 -110 .l .4
11 11 17 16 15 10 5 6 7 7 7 7 7 7 7 7 7 -1.4 -.9 -1.2 -.l 2.0 .o 4.0 2.0 1.0 .6 -.5 -.l -.9 .3 -.l -.2 .O
11 11 11 11 17 16 15 10 5 6 6 6 6 6 6 6 6 6 6 -1.0 -.I -1.7 -1.8 -1.0 -.2 .9 .o 4.1 2.3 2.5 1.4 .8 .6 1.1 .5 -.2 .6 2.4
11 11 11 11 11 11 17 16 15 10 4 5 5 5 5 5 5 5 5 5 4 -1.2 -1.6 -1.5 -1.3 -.8 -.8 -.B .l 2.6 .O 5.2 2.9 2.5 2.2 2.0 2.5 1.6 2.7 2.2 3.2 4.4
11 11 11 11 11 11 11 11 17 16 14 10 10 10 10 10 10' 10 10 10 10 10 lo -1.6 -.l -1.5 -2.2 -1.1 -l'.O -1.3 -.3 -1.4 .2 3.2 .O .O .O .O .O .O .O .O .O .O .O .O
maxerr : Pu 3.2 1 11 ; u 5.2 2 11 ________________________________________------------------------------- -___-__-___--_-_-_-_-------------------------------------------------
zon 11 12 13 14 15 16 17 1 2 3 4 5 6 7 err -1.2 1.3 .O .O .O .O 3.2 3.2 1.5 1.7 -.2 .Zj -1.3 1.4 -.6 .8 .O .O .O .O 4.9 5.0 2.8 2.9 1.3 1.5 .l .5 sum 14.1 .O .O .5 4.5 4.5 4.0 42.3 .O .O 1.5 13.5 13.5 12.0
31
Page 35
Fig. 3.7. Power distribution. V14. Sl. Burnup = 0 MWd/kg
CONKEMO .996 Mcu .900
.996
.980
.998 .996 .999
.983 .907 .900
.992 .994 .995 .992 _ 996
.904 .907 .904 .907 .976
.997 .992 ,992 .994 .994 .998 ,996
.907 .989 .987 .903 .979 .991 .992
.995 .993 .998 .994 .996 .995 . 995 1.002 1.000
.986 .990 .987 .993 .989 .991 .907 .989 .992
.999 .993 ,994 .990 .996 .995 .998 .996 . 999 1.004 1.013 1.037 1.009 1.002 .995 .994 .993 .990 .998 .990 .997 1.002
.904 ,000 1.004 .997 . 997 1.002 1.004 1.001 1.004 1.006 1.009 1.012 1.023
.920 .OOO 1.033 1.011 1.006 .990 .997 .995 1.003 1.005 .999 1.005 1.007
1.031 .832 .913 .OOO 1.010 1.005 1.010 1.012 1.015 1.012 1.015 1.017 1.023 1.028 1.042 1.019 .830 .933 .OOO 1.042 1.018 1.011 1.013 1.006 1.013 1.013 1.004 1.015 1.021 1.027
.863 . 913 1.034 .835 .913 .OOO 1.024 1.019 1.021 1.026 1.027 1.032 1.038 1.038 1.043 1.051 1.062
.860 ,904 1.023 .036 .929 .OOO 1.055 1.031 1.029 1.032 1.033 1.038 1.035 1.034 1:046 1.048 1.059
.044 .a47 .867 .921 1.045 .047 .934 . 000 1.047 1.046 1.054 1.063 1.061 1.063 1.068 1.075 1.082 1.009 1.110
.827 .841 .860 . 911 1.033 .a47 .954 000 1.079 1.062 1.072 1.077 1.076 1.072 1.072 1.078 1.084 1.099 1.117
.839 .039 .841 .854 .078 . 924 1.063 .868 .964 . 000 1.092 1.110 1.125 1.128 1.128 1.134 1.135 1.144 1.147 1.161 1.193
.025 ,824 .830 .845 .065 . 922 1.050 .871 ,979 .OOO 1.143 1.150 1.149 1.156 1.159 1.161 1.159 1.167 1.174 1.193 1.220
.840 .040 .034 .033- .841 .855 .097' ,960 1.134 .937 1.043 .ooo .ooo .ooo .ooo .ooo .ooo .ooo .ooo ,000 .ooo .ooo .ooo
.825 .032 .821 .827 .827 .046 .075 . 959 1.134 .944 1.071 ,000 .ooo ,000 .ooo .ooo .ooo .ooo .ooo .ooo ,000 .ooo ,000
Page 36
Fig. 3.8. Discrepancies. V14. Sl. Burnup = 0 MWd/kg
1 -1.6
1 1 1 -1.5 -.9 -1.1
1 1 1 1 1 -.B -.l -1.1 -.5 -2.0
1 1 1 1 1 1 1 -1.0 -.3 -.5 -1.1 -1.5 -.7 -.4
7 1 1 1 1 1 1 1 1 -. 9 -. 3 -1.1 -.l -.I -.4 -.a -1.3 -.8
5 6 7 1 1 1 1 1 1 1 1 3.8 1.6 .8 -.3 -.2 -.2 -.8 .2 -.l -.7 -1.1
14 10 5 6 7 1 1 1 1 1 1 1 1 2.7 .O 2.9 1.4 .9 -.4 -.7 -.6 -.l -.l -1.0 -.I -1.6
16 15 14 10 5 6 7 7 7 7 7 7 7 7 7 -1.2 -.2 2.2 .O 3.2 1.3 .l .l -.9 .l -.2 -1.3 -.B -.7 -1.4
13 17 16 15 14 10 5 6 6 6 6 6 6 6 6 6 6 -.3 -1.0 -1.1 .l 1.8 .o 3.0 1.2 .8 .6 .6 .6 -.3 -.4 .3 -.3 -.3
11 11 13 17 16 15 14 10 5 5 5 5 5 5 5 5 5 5 5 -2.0 -.7 -.8 -1.1 -1.1 .,o 2.1 .o 3.1 1.5 1.7 1.3 1.4 .8 .4 .3 .2 .9 .6
11 11 11 11 13 17 16 15 14 10 2 4 4 4 4 4 4 4 4 4 3 -1.7 -1.8 -1.3 -1.1. -1.5 -.2 -.5 .3 1.6 .O 4.7 3.6 2.1 2.5 2.7 2.4 2.1 2.0 2.4 2.8 2.9
11 11 11 11 11 11 13 17 16 15 12 10 10 10 10 10 10 10 10 10 10 10 10 -1.8 -1.0 -1.6 -.I -1.7 -1.1 -2.5 -.l .O .7 2.7 .O .O .O .O .O .O .O .o. .o .o .O .O
maxerr : Pu 2.7 1 11 : u 4.7 2 11 ____________________----------------------------------------------- -------------------------------------------------------------------------
zon 11 12 13 14 15 16 17 1 2 3 4 5 6 7 err -1.3 1.4 2.7 2.7 -1.2 1.4 2.0 2.0 .1 .3 2.8 .9 -.7 .8 -.I 8 4.7 4.7 2.9 2.9 2.5 2.6 1.6 2.0 .6 .9 -.3 .8 sum 7.6 .5 3.0 4.5 4.5 4.0 3.5 34.0 1.0 .5 9.0 14.0 12.5 11.0
33
Page 37
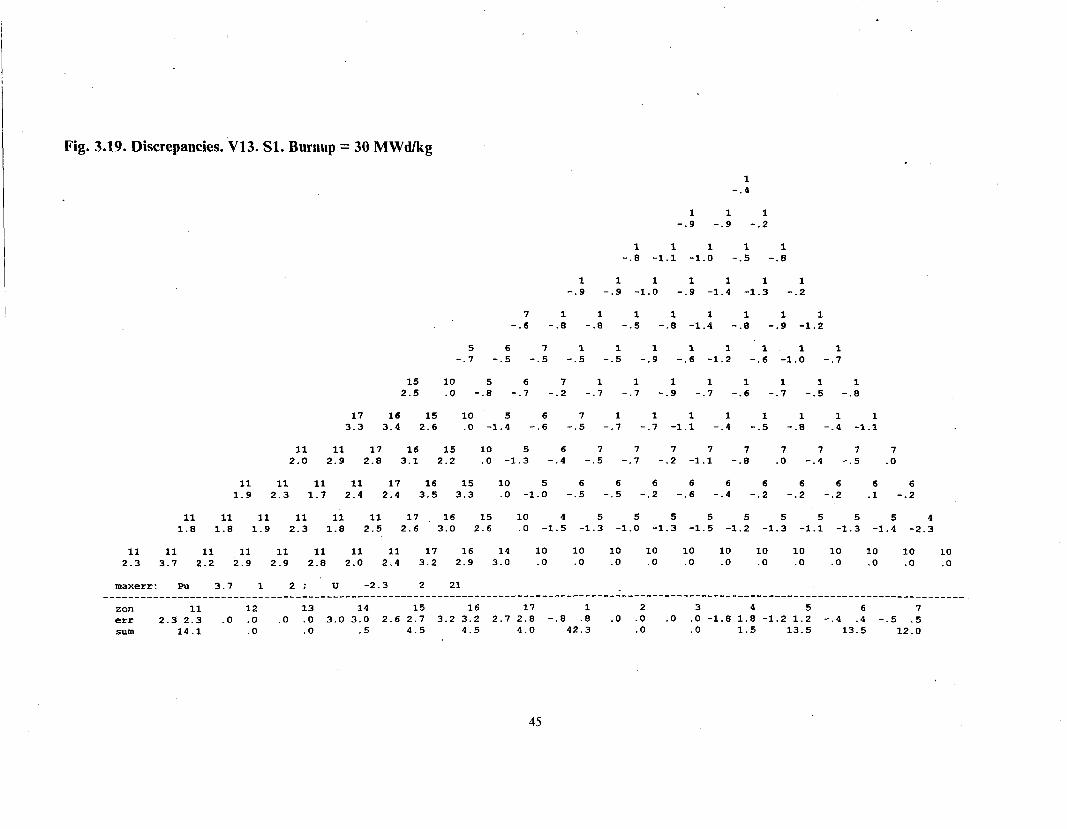
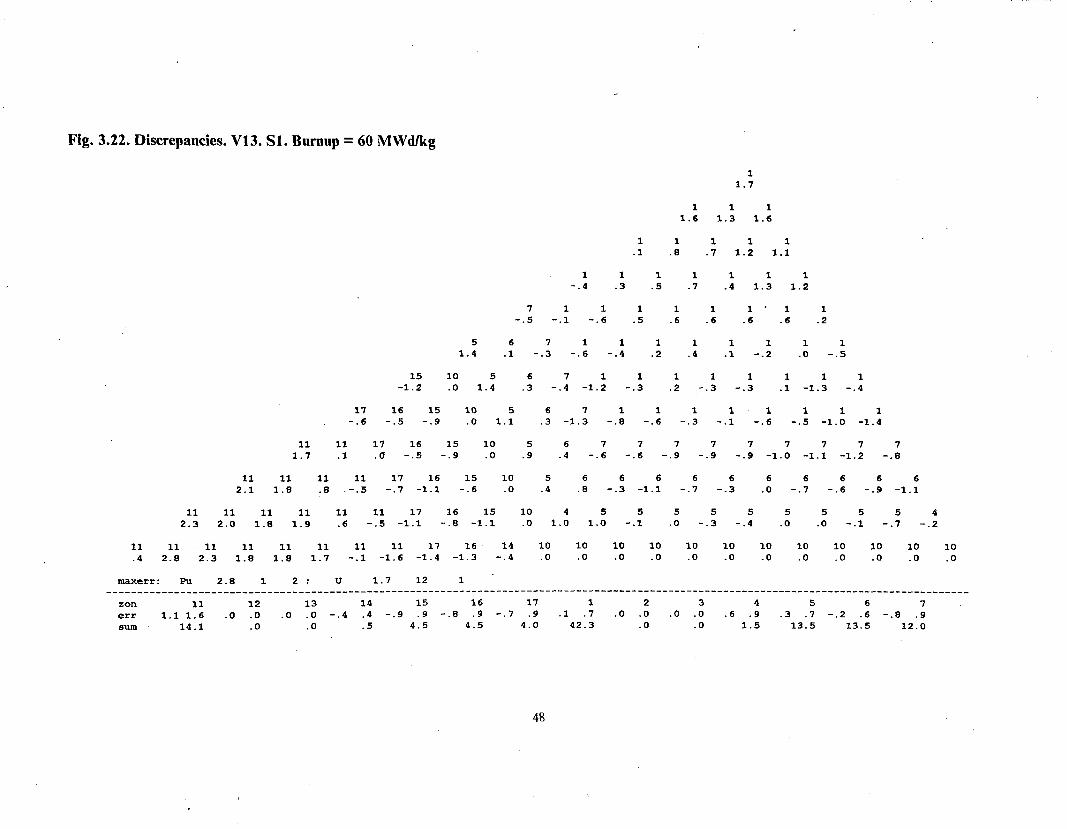
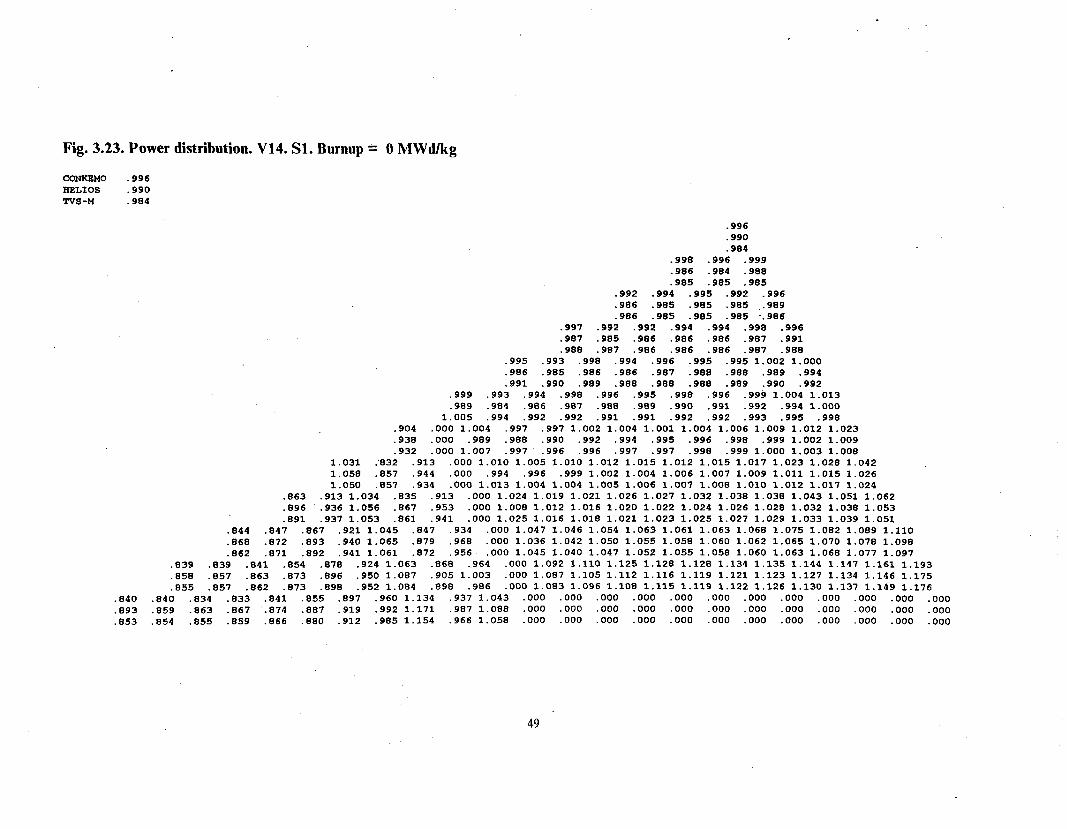
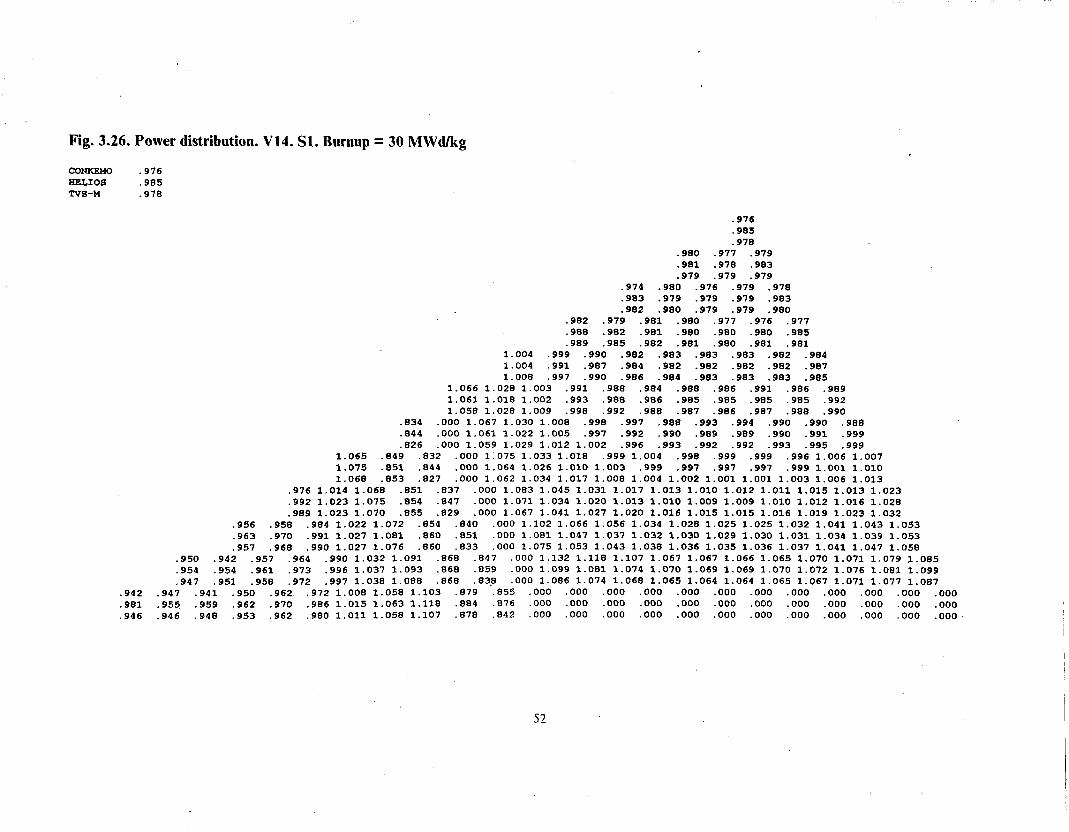
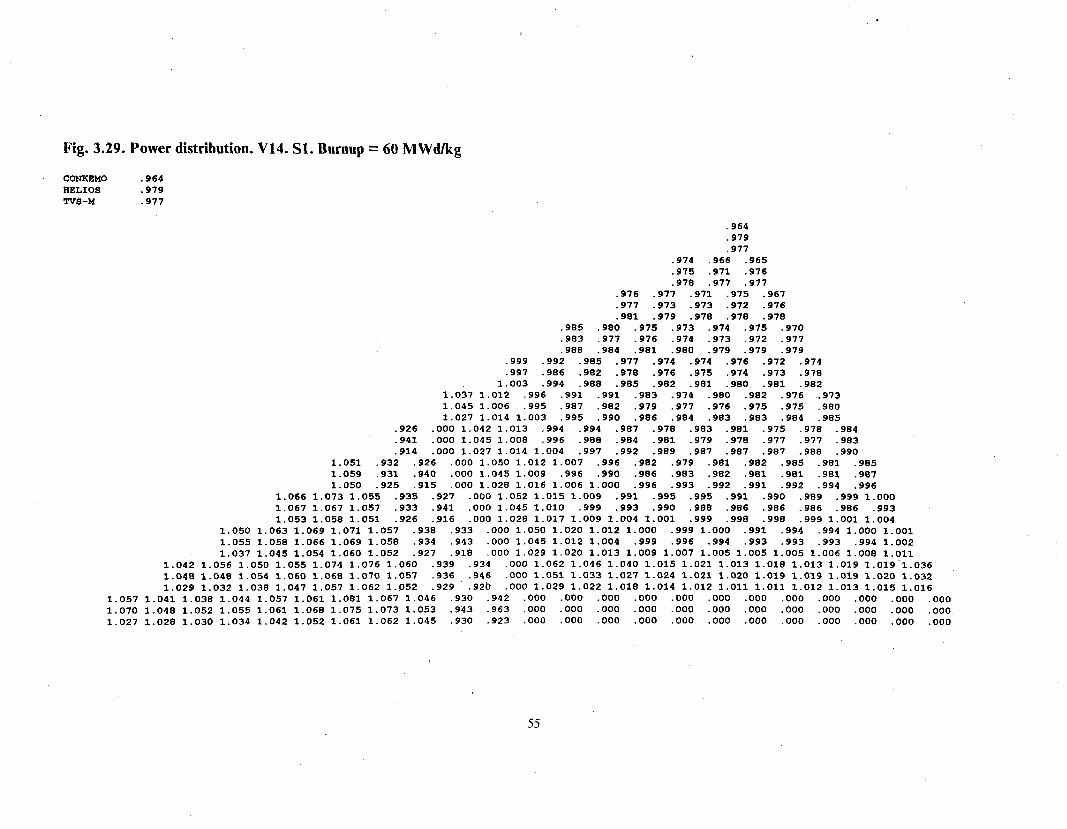
3.4. Comparison of the Calculations of Power Distributions on Burning Obtained by the TVS-M, HELIOS and CONKEMO Codes
Figs. 3.9~3.13 show power distributions for burnups of 0, 10, 20, 30, 40, 50 and 60
MWd/kg obtained in Variant 13 by the TVS-M and CONKEMO codes. The calculation
values obtained by the HELIOS code are also presented for the initial state.
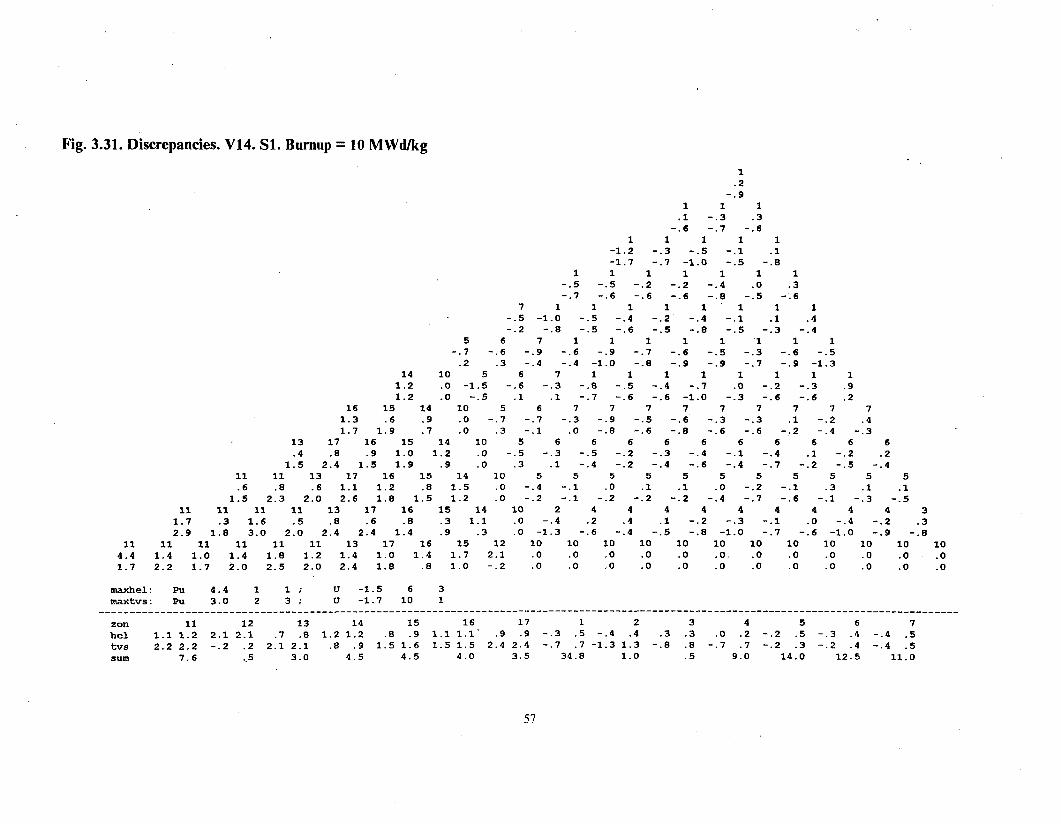
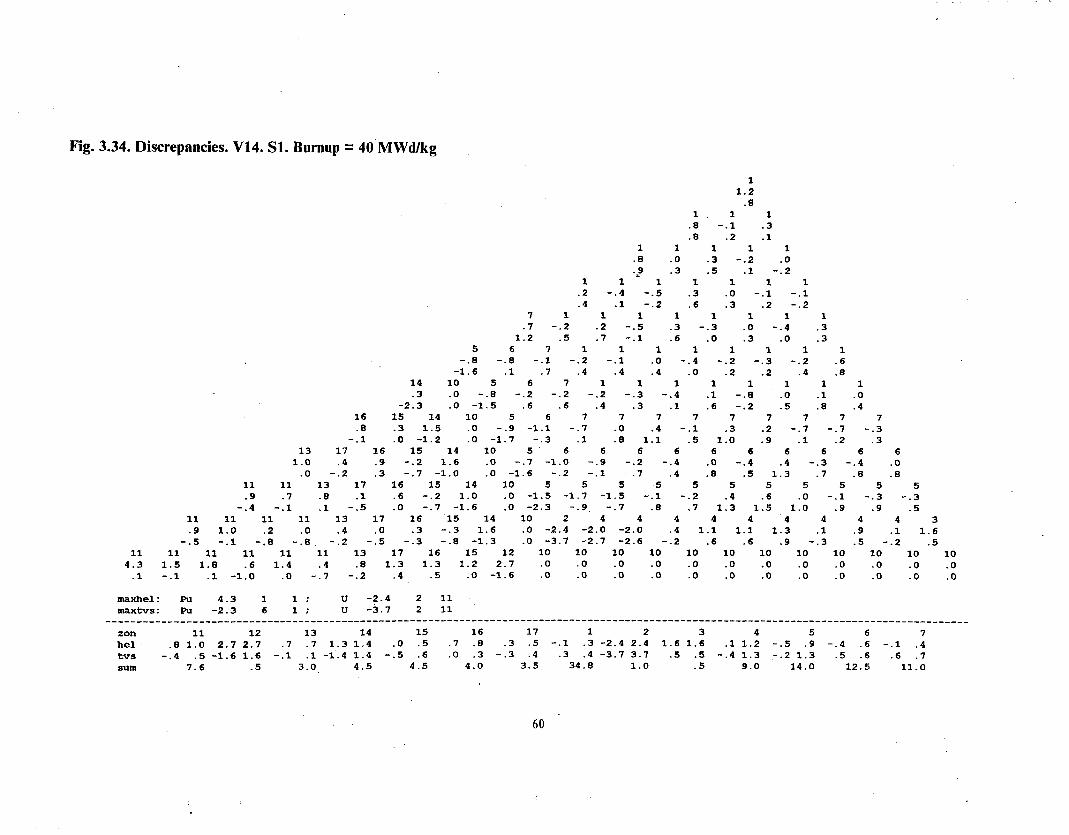
Figs. 3.16~3.22 present the correspondin, (J relative distinctions in the calculation
results obtained by the TVS-M (HELIOS) code from those calculated by the :
CONKEMO code: . .
Code - CONKEMO . I ooo/ 0.
CONKEMO
Similar information for Variant 14 is presented in Figs. 3.23e3.36. For this
particular Variant the HELIOS calculation results are presented for all the burnup
values involved.
From the results presented in Figs. 3.16~3.22 it can be concluded that in all states
during burnup in Variant 13 the maximum discrepancy in the results obtained by the
TVS-M and the CONKEMO codes does not exceed 4.2O,0 for MOX fuel assemblies and . .
2.3’ o for uranium fuel ones. For Variant 14 similar maximum discrepancies are 3.5O o
and 4.5O 0, respectively (see Figs. 3.30t3.36). This shows that pin-by-pin power
distributions calculated by the TVS-M code are in good agreement with those obtained
by the benchmark CONKEMO code over the whole burnup process.
Calculations performed by the TVS-M code in Variant 13 reveal a slight increase
of fuel pin power in MOX fuel assemblies and a slight decrease in uranium fuel
assemblies. In Variant 14 this effect only occurs at the initial stage of the burnup.
Maximum discrepancies in calculations by the HELIOS and CONKEMO codes
(see Figs. 3.30~ 3.36) are close to similar values for the TVS-M code. The exception is
the central fuel pin in MOX fuel assemblies where this discrepancy is slightly greater. As
seen from Figs. 3.9 and 3.2 in calculations performed by the HELIOS code the fuel pin
power in the central point is higher than that in adjacent points. This effect might result
from some error in the procedure for calculating the neutron flux in the central point
inherent in the code.
Page 38
Fig. 3.9. Power distribution. V13. Sl. Burnup = 0 MWd/kg
. c0NxE!40 995 HELIOS :995 TVS-M .904
.995
.995
.904 .990 .991 .991 .987 .980 .992 .904 .904 .904
.996 .991 .992 .994 '.994
.986 .988 .987 . 988 .993
.905 .904 .904 .905 .905 .992 .991 .994 .992 .989 .996 .999 .903 .907 .901 .980 .989 .989 .995 .985 .985 .905 .985 .906 .906 .907
.977 ,986 .993 .991 .995 .993 .996 .998 1.000
.972 .981 .984 .907 .989 .990 .991 .992 .999 900 .984 .905 .986 .987 .987 .988 .989 .991
.967 .974 985 .992 .998 .994 .996 .998 .999 . 999 1.005
.943 .962 .973 .902 .907 .990 .992 .994 .995 .997 1.004
.965 973 981 ,906 .900 .909 .990 .991 .993 .994 .997 1.174 .OOO .964 .97; 987 .991 . 998 1.003 1.004 1.001 1.006 1.010 1.013 1.184 .OOO .942 .963 .970 .987 .992 .996 .998 1.000 1.002 1.005 1.014 1.104 ,000 .966 .976 .985 .990 .993 .995 .997 .998 1.000 1.003 1.007
.884 . 962 1.170 .OOO .973 .985 . 995 1.005 1.010 1.010 1.016 1.015 1.020 1.021 1.028
.891 .978 1.196 .ooo .948 .971 .907 .997 1.003 1.007 1.009 1.012 1.014 1.018 1.031
.900 982 1.186 .ooo .972 982 992 999 1.003 1.005 1.007 1.009 1.012 1.016 1.024 .830 .845 .eei . 960 1.173 .ooo .9eo 99; 1.01; 1.022 1.028 1.029 1.035 1.033 1.041 1.048 1.060 .838 .859 .895 .907 i.206 . 000 _ 961 :988 1.005 1.016 1.022 1.026 1.029 1.031 1.035 1.041 1.058 .047 .865 .901 985 1.194 .ooo .983 . 995 1.007 1.015 1.020 1.023 1.026 1.028 1.032 1.039 1.051
.815 .015 .828 .848 .ee; . 968 1.189 .OOO 1.003 1.025 1.043 1.053 1.062 1.064 1.066 1.072 1.082 1.087 1.104
.824 .832 .840 .859 .900 .997 1.223 .ooo 990 1.021 1.041 1.052 1.057 1.061 1.064 1.067 1.073 1.082 1.105
.834 .839 .848 .067 .906 ,993 1.210 . 000 1.004 1.019 1.035 1.046 1.052 1.055 1.059 1.062 1.068 1.077 1.096 .852 ,093 .986 1.222 .OOO 1.055 1.092 1.112 1.126 1.129 1.128 1.138 1.140
:816 813 .811 .823 .a17 .025 .831 ,020 .842 .831 .864 . 910 1.017 1.264 .ooo 1.050 1.088 1.105 1.114 1.118 1.122 1.125 1.1?4 1.130 1.137 1.159 1.150 1.188 1.182 .a30 .832 .835 .840 .851 .872 .916 1.014 1.247 .OOO 1.044 1.076 1.097 1.109 1.115 1.120 1.124 1.129 1.136 1.148 1.175
.eoe .eoe .810 .815 .818 .825 .836 .861 . 922 1.044 1.336 .OOO .OOO .ooo . 000 .ooo .ooo .ooo .ooo .ooo ,000 .ooo .ooo
.837 .826 .826 .830 .835 .843 .857 .885 ,947 1.088 1.386 .OOO .ooo .ooo .ooo .ooo .ooo .ooo .ooo ,000 .ooo .ooo .ooo
.829 .029 .830 .833 .836 .844 .857 .885 943.1.069 1.355 .OOO .ooo .ooo .ooo .ooo .ooo ,000 .ooo ,000 .ooo .ooo ,000
Page 39
Fig. 3.10. Power distribution. V13. Sl. Burnup = 10 MWd/kg
coNKEMo 1.001 we-M .984
1.001 .984
.991 . 996 1.000
.984 .984 .904
.992 .998 .995 .995 .993 _ 905 .985 .985 ‘.985 .986
.992 .997 .996 .994 .994 .996 .997
.987 .986 .986 .906 .986 .987 .988
1.001 .997 .992 .994 .996 . 997 1.002 1.001 1.001 .993 .990 .988 .987 .987 .988 .988 .989 .991
1.019 1.005 1.000 1.002 .997 . 999 1.002 1.003 1.008 1.004 1.007 1.011 .998 .994 .992 .99i .990 .991 .991 .992 .994 .997
1.048 .OOO 1.016 1.004 1.007 1.006 1.005 1.003 1.007 1.007 1.010 1.011 1.013 1.083 .OOO 1.012 1.001 .997 .996 .996 .996 .997 .998 .999 1.002 1.007
.a03 . 944 1.056 .OOO 1.022 1.009 1.008 1.011 1.012 1.016 1.019 1.022 1.022 1.023 1.029
.915 . 976 1.084 .OOO 1.017 1.007 1.004 1.004 1.005 1.006 1.007 1.009 1.011 1,015 1.023
.046 .a57 .a05 .948 1.066 .OOO 1.031 1.023 1.028 1.023 1.024 1.033 1.034 1.036 1.038 1.043 1.053
.865 .a83 .916 .979 1.090 .OOO 1.027 1.018 1.018 1.019 1.021 1.023 1.025 1.027 1.031 1.037 1.049
.826 ,839 .a45 .856 .a93 .956 1.069 .ooo 1.053 1.043 1.047 1.056 1.054 1.062 1.066 1.073 1.068 1.077 1.098
.a51 .a56 .866 .a85 .921 .987 1.100 .OOO 1.044 1.039 1.043 1.047 1.050 1.053 1.055 1.058 1.063 1.072 1.089
.a18 .826 .a29 .a32 .a40 .863 ,903 .975 1.093 .OOO 1.093 1.101 1.112 1.113 1.114 l.il5 1.118 1.126 1.132 1.147 1.172
.846 .a48 .a52 .a58 .a69 .a91 .931 1.003 1.121 000 1.075 1.086 1.095 1.100 1.104 1.107 1.110 1.114 1.121 1.131 1.153
,811 .a22 .a21 .a30 .a22 .a41 .a58 .a79 . 923 1.0.00 1.135 .ooo ,000 .ooo .ooo .ooo .ooo . 000 .ooo .ooo .ooo .ooo .ooo .a45 .846 .a47 .a49 .a54 .862 .876. ,904 .954 1.039 1.165 ,000 .ooo . 000 . 000 .ooo . 000 . 000 .ooo ,000 .ooo .ooo .ooo
36
Page 40
Fig. 3.11. Power distribution. V13. Sl. Burnup = 20 MWd/kg
coNK!zMo .992 ~vs-M .983
.992 ,983
1.003 .997 .997 .983 .983 .983
.999 .99i .998 .998 .997
.984 .983 .983 .983 ..984
.997 . 995 .997 1.000 1.000 .997 1.000
.988 .986 .985 .984 .984 .905 .986
1.001 1.001 .996 .991 .996 .999 .998 1.001 1.005 1.000 .993 ,989 .987 .986 .986 .987 .988 .989
1.050 1.016 1.006 1.002 . 997 1.002 1.004 1.005 .998 1.007 1.004 1.037 1.013 1.001 .995 .991 .990 .990 .990 .991 .992 ,995
.991 .OOO 1.042 1.015 1.012 1.007 1.001 1.007 1.008 1.000 1.009 1.007 1.023 1.026 000 1.038 1.015 1.004 .999 .996 .995 .995 .996 . 998 1.000 1.005
.905 .943 .996 .OOO 1.040 1.024 1.012 1.011 1.014 1.018 1.017 1.012 1.019 1.018 1.032
.935 . 977 1.027 . 000 1.042 1.021 1.011 1.006 1.005 1.005 1.005 1.007 1.009 1.013 1.020
.a73 .a87 .911 .947 .994 .OOO 1.054 1.033 1.027 1.029 1.031 1.028 1.026 1.033 1.030 1.036 1.052
.a91 .908 .936 .979 1.031 .OOO 1.050 1.030 1.022 1.020 1.020 1.020 1.021 1.023 1.027 1.032 1.043
.a52 .a55 .867 .a05 .908 ,951 1.007 .OOO 1.077 1.055 1.046 1.052 1.048 1.048 1.054 1.055 1.061 1.069 1.078
.876 .a81 .a92 .910 .940 . 985 1.038 .OOO 1.063 1.047 1.044 1.044 1.044 1.046 1.047 1.050 1.055 1.062 1.076
.a53 .a50 .a54 .a59 .866 .a87 .921 .968 1.015 . 000 1.101 1.097 1.092 1.095 1.096 1.102 1.104 1.107 1.109 1.121 1.141
.a71 .a73 .876 .a83 .a95 .916 .p49 997 1.049 .ooo 1.085 1.082 1.083 1.084 1.005 1.087 1.089 1.093 1.098 1.107 1.122
.a58 .856 .a54 .a54 .a61 ,860 .a75 .895 .931 ,990 1.026 .OOO .OOO .ooo .ooo .ooo .ooo .ooo .ooo .ooo .ooo .ooo .ooo
.a69 .a70 .a71 .a74 .a79 .a87 .902 .927 ,967 1.010 1.062 .ooo .ooo .ooo .ooo .ooo .ooo .ooo .ooo ,000 .ooo .ooo .ooo
37
Page 41
Fig. 3.12. Power distribution. V13. Sl. Burnup = 30 MWdkg
comt4o .987 TVS-M .983
.907
.983
.992 .992 .985
.983 .983 .983
.993 .995 .993 .988 .992
.985 .984 .983 .983 .984
1990 999 1987 996 .995 . 985 .994 .985 .998 .984 .998 .985 .988 .986
1.011 1.004 .999 .993 .995 1.000 .995 .997 1.001 1.005 .996 .99i .900 .987 .986 .987 .988 .989
1.057 1.027 1.011 1.003 .990 1.000 .996 1.002 . 997 1.002 1.002 1.050 1.022 1.006 .998 .993 .991 .990 .990 .991 .992 ,995
.969 .ooo 1.060 1.031 1.011 1.008 1.004 1.005 1.002 1.002 1.004 1.005 1.012
.993 .OOO 1.051 1.024 1.009 1.001 .997 .996 .995 .996 .997 1.000 1.004
.920 .944 .969 .OOO 1.069 1.034 1.020 1.015 1.012 1.015 1.008 1.010 1.015 1.015 1.028
.950 .976 -994 .ooo 1.054 1.028 1.015 1.008 1.005 1.004 1.004 1.005 1.007 1.011 1.017
.896 .903 .925 .949 .975 .OOO 1.074 1.040 1.030 1.027 1.020 1.029 1.026 1.020 1.027 1.033 1.037
.914 .929 .951 .970 .996 .OOO 1.060 1.036 1.025 1.020 1.010 1.018 1.018 1.020 1.023 1.028 1.037
.a02 .ee5 .900 .909 .933 .950 .968 .OOO 1.079 1.054 1.046 1.041 1.044 1.042 1.041 1.044 1.048 1.051 1.065
.a99 .905 .915 .93i .955 .983 1.000 000 1.068 1.049 1.041 1.039 1.038 1.038 1.039 1.042 1.046 1.052 1.063
.a78 .a80 .a83 .a87 ..902 .9i4 .938 .961 ,980 . 000 1.099 1.086 1.080 1.081 1.083 1.081 1.083 1.084 1.091 1.090 1.119
.a94 .a96 .goo .9o7 ..910 .937 .962 .990 1.005 . 000 1.082 1.072 1.069 1.067 1.067 1.068 1.069 1.072 1.077 1.083 1.093
.a72 861 .a75 .a72 .a77 .a86 ,907 .924 .944 .972 .977 .ooo .ooo ,000 .ooo .ooo .ooo .ooo .ooo .ooo .ooo .ooo .ooo
.892 1893 .a94 .a97 .902 .911 .925 .946 .974 1.000 1.006 .ooo .ooo .ooo .ooo .ooo .ooo .ooo .ooo .ooo .ooo .ooo .ooo
38
Page 42
Fig. 3.13. Power distribution. V13. Sl. Burnup = 40 MWd/kg
CONKEMO .994 TVS-M .983
.994
.983
1.001 .994 .994 .984 .904 .984
1.004 .998 1.000 .995 .998 .986 .985 .984 .984 ..905
1.002 .996 . 999 1.000 1.003 1.000 1.001 .992 .988 .986 .985 .985 .986 .986
1.011 .999 .999 .996 .995 .996 998 1.000 .995 1.009 .999 .993 .989 . 988 .907 1987 .980 .990
1.065 1.028 1.012 1.000 999 .999 .997 .998 .995 .996 1.003 1.052 1.026 1.010 1.000 :995 .992 .991 .990 .991 .992 .995
.953 .OOO 1.061 1.026 1.019 1.008 1.007 1.004 1.002 1.004 1.005 1.005 1.011
.978 .OOO 1.053 1.027 1.012 1.003 .999 .996 .996 .996 .997 . 999 1.002
.934 .952 .960 .OOO 1.070 1.032 1.018 1.018 1.010 1.012 1.009 1.006 1.009 1.010 1.019
.964 .977 .979 .OOO 1.055 1.031 1.016 1.009 1.005 1.004 1.003 1.004 1.006 1.009 1.014
.919 .929 .941 .956 .966 .OOO 1.073 1.041 1.027 1.017 1.017 1.020 1.017 1.013 1.019 1.027 1.023
.937 .949 .965 .978 .980 .OOO 1.059 1.036 1.024 1.010 1.015 1.014 1.015 1.016 1.010 1.022 1.029
.900 .914 .917 .929 .947 .962 .970 .OOO 1.079 1.044 1.035 1.033 1.030 1.032 1.032 1.031 1.038 1.030 1.056
.923 .929 .938 .95x .967 .982 .983 .OOO 1.064 1.045 1.036 1.032 1.030 1.030 1.031 1.032 1.035 1.040 1.040
.896 .099 .903 .913 .921 .932 .948 .957 ;966 .OOO 1.091 1.077 1.063 1.061 1.060 1.059 1.056 1.065 1.060 1.070 1.004
.9ie .920 .924 .930 .941 .955 .973 .986 .984 .OOO 1.070 1.059 1.053 1.050 1.049 1.049 1.050 1.052 1.055 1.060 1.066
.gol ,903 .903 .905 .911 .911 .926 .950 .953 ,955 .969 .ooo .ooo . 000 .ooo . 000 . 000 . 000 .ooo .ooo .ooo ,000 .ooo
.916 .917 .918 .921 .926 .934 .946 .963 .980 .989 ,981 .ooo ,000 .ooo .ooo .ooo .ooo .ooo .ooo .ooo ,000 .ooo .ooo
39
Page 43
Fig. 3.14. Power distribution. V13. Sl. Burnup = 50 MWdkg
CONKEMO .990 Pm-14 .984
.990
.984
.993 .992 .990
.984 .984 .904
1.001 .995 .997 .993 .994 .987 .985 .985 . . 985 .985
1.002 .995 .996 . 996 1.000 .993 .994 .993 .989 .987 .986 .986 .986 .986
1.012 1.000 1.001 .994 .993 .994 .995 .995 .995 1.010 1.000 .994 .990 .988 .988 .907 .980 .909
1.059 1.026 1.011 1.003 1.000 .997 .994 .997 .996 .995 1.000 1.048 1.026 1.010 1.001 .995 .992 .991 .990 .990 .992 .994
.972 .OOO 1.056 1.024 1.015 1.009 1.003 .990 .999 1.000 .998 1.005 1.003
.977 .OOO 1.040 1.027 1.012 1.003 .999 .996 .995 .995 .995 -.997 1.000
.954 .963 .974 .OOO 1.062 1.026 1.019 1.012 1.006 1.004 1.002 1.003 1.003 1.006 1.013
.977 .902 .978 .OOO 1.050 1.029 1.016 1.000 1.004 1.002 1.001 1.001 1.003 1.005 1.009
.OOO 1.064 1.031 1.020 1.012 1.013 I959 937 .949 * 968 .954 .978 .903 .965 .977 .979 .OOO 1.052 1.032 1.021 1.015 1.011 1.013 1.010 1.012 1.010 1.010 1.011 1.012 1.013 1.015 1.017 1.020 1.015
.928 935 .940 .951 .961 .970 .977 . 000 1.069 1.033 1.027 1.027 1.023 1.021 1.020 1.022 1.025 1.026 1.039
.948 :953 .960 .970 .980 .985 .980 .OOO 1.054 1.038 1.029 1.024 1.022 1.021 1.021 1.022 1.024 1.028 1.033
.926 .928 .931 .933 .942 .952 .962 .966 .977 . 000 1.076 1.058 1.052 1.049 1.b48 1.048 1.043 1.048 1.046 1.055 1.063
.943 ,945 .940 .954 .962 .973 .983 .987 ,980 000 1.056 1.045 1.038 1.035 1.033 1.032 1.033 l.q34 1.036 1.039 1.042
.942 .928 .929 .932 .934 .933 .948 .966 .966 .967 .976 .OOO .ooo . 000 . 000 . 000 ,000 .ooo . 000 .ooo .ooo .ooo .ooo
.942 .942 .943 .946 .950 .957 .967 .978 .986 .987 .976 .OoO .L-Ul .oOO .ooo .ooo .ooo .ooo .ooo .ooo .ooo .ooo .ooo
40
Page 44
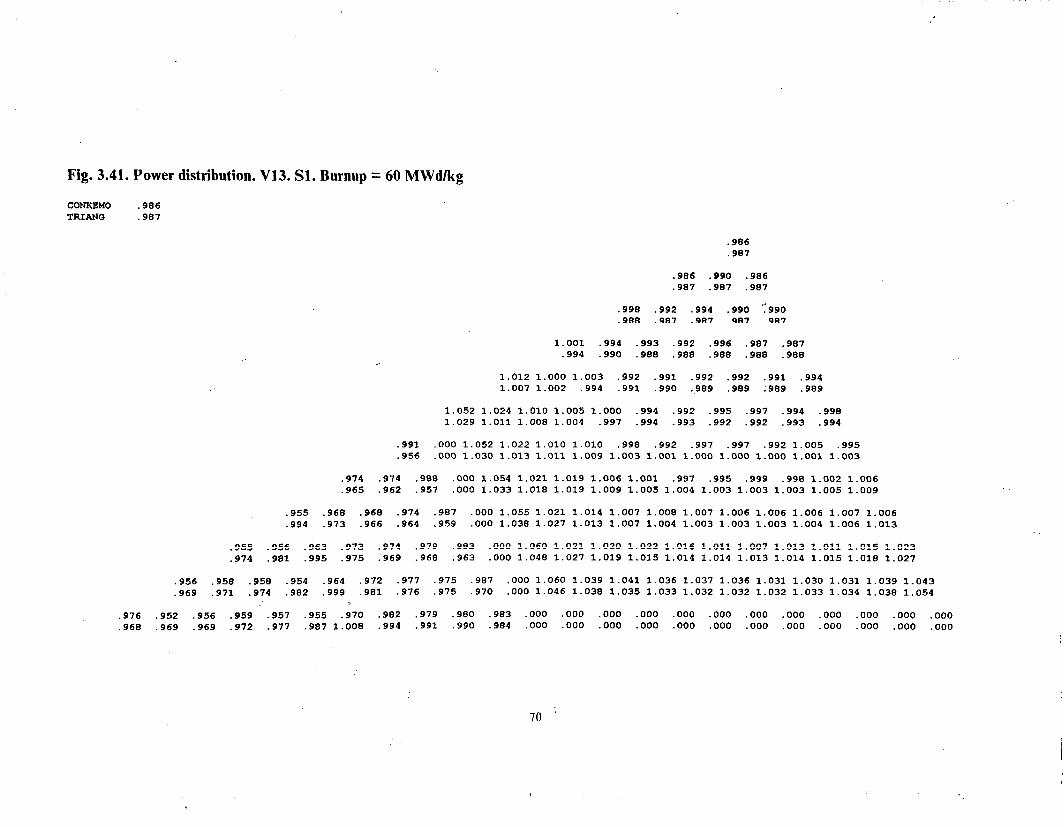
Fig. 3.15. Power distribution. V13. Sl. Burnup = 60 MWd/kg
coNKJ3Mo .906 TVS-M 1.003
.986 1.003
.906 .990 .906 1.002 1.003 1.002
.998 .992 .994 ..990 .990
.999 1.000 1.001 1.002 1.001
1.001 .994 .993 .992 .996 .987 .907 .997 .997 .998 . 999 1.000 1.000 .999
1.012 1.000 1.003 .992 .991 .992 .992 .991 .994 1.007 .999 .997 .997 .997 .990 .99B .997 .996
1.052 1.024 1.010 1.005 1.000 .994 .992 .995 .997 .994 .998 1.067 1.025 1.007 .999 .996 .996 .996 .996 .995 .994 .993
.991 .OOO 1.052 1.022 1.010 1.010 .998 .992 .997 .997 .992 1.005 .995
.979 .OOO 1.067 1.025 1.006 .998 .995 .994 .994 .994 .993 .992 .991
.974 .974 .988 . 000 1.054 1.021 1.019 1.006 1.001 .997 .995 .999 .998 1.002 1.006
.968 .969 .979 .OOO 1.066 1.024 1.006 .998 .995 .994 .994 .993 .993 .992 .992
.955 .968 .960 .974 .987 .OOO 1.055 1.021 1.014 1.007 1.008 1.007 1.006 1.006 1.006 1.007 1.006
.971 .969 .968 .969 .978 .OOO 1.065 1.025 1.008 1.001 .999 .998 .997 .996 .995 .995 .998
.955 .956 .963 .973 .974 .979 .983 .OOO 1.060 1.021 1.020 1.022 1.016 1.011 1.007 1.013 1.011 1.015 1.023
.975 .973 .971 .968 .967 .968 .977 .OOO 1.064 1.029 1.017 1.011 1.009 l.OCIE 1.007 1.006 1.005 1.006 1.012
,972 .977 .975 .987 .OOO 1.060 1.039 1.041 1.036 1.037 1.036 1.031 1.030 1.031 1.039 1978 956 .958 . 977 .958 .975 .954 .972 .964 .970 .967 .966 .967 .976 000 1.071 1.049 1.040 1.036 1.034 1.032 1.031 1.030 1.030 1.032 1.043 1.041
.976 .952 .956 .959 .957 .955 ,970 .982 .979 ,980 .983 .ooo .ooo .ooo .ooo .ooo .ooo .ooo .ooo .ooo .ooo .ooo .ooo
.980 .979 .978 .976 .974 .971 .969 .966 .965 .967 .979 ,000 .ooo ,000 .ooo .ooo .ooo .ooo .ooo .ooo .ooo .ooo .ooo
41
Page 45
Fig. 3.16. Discrepancies. V13. Sl. Burnup = 0 MWdlkg
1 .O
-1.1 1 1 1
-:6 3 -.7 -.3 -.I .l
1 1 1 1 1 -1.0 -.3 -.5 -.6 -.l -1.1 -.7 -.a -.9 -.9
1 1 1 1 1 1 1 I:7 9 -.4 -.6 119 7 -. -.7 4 -.3 .O -2.0 7 -1.2 -.4
7 1 1 1 1 1 1 1 1 -.5 -.5 -.9 -.4 -.b -.3 -.5 -.6 -.l
.3 -.2 -.a -.5 -.a -.6 -.a -.9 -.9 5 6 7 1 1 1 1 1 1 1 1
-2.5 -1.2 -1.2 -1.0 -1.1 -.4 -.4 -.4 -.4 -.2 -.l -. 2 -.l -.4 -.6 -1.0 -.5 -.6 -.7 -.6 -.5 -.a
15 10 5 6 7 1 1 1 1 1 1 1 1 .9 .o -2.8 -1.4 9 -.4 -.6
.o -.3 -.l I:2 -.l -.5 -.I 6 -.l -.4 -.5 .l
.9 -.a -17 -.3 -.6 -.7 -.6 17 16 15 10 5 6 7 1 1 1 1 1 1 1 1 .e 1.7 2.2 .O -2.6 -1.4 -.a -.8 -.I 3 7 3 -.6 -.3 .3
1.8 2.1 1.4 .o -.l -.3 -.3 -.6 -.I -:5 I:9 -:6 -.a -.5 -.4 11 11 17 16 15 10 5 6 7 7 7 7 7 7 7 7 7
1.0 1.7 1.6 2.8 2.8 .O -1.9 -.I - 8 -. 6 - 6 -.3 -.6 - 2 6 -. 7 -.2 2.0 2.4 2.3 2.6 1.8 .O .3 .o - 6 -. 7 - 8 -. 6 -.9 -5 119 -.9 -.a
11 11 11 11 17 16 15 10 5 6 6 6 6 6 6 6 6 6 6 1.1 2.1 1.4 1.3 1.5 3.0 2.9 .O -1.3 -.4 -.2 -.l 2.3 2.9 2.4 2.2 2.1 2.6 1.8 .O .l -.6 -. 8 -.I
-:9 5 110 3 -.2 -.I -.9 -.5 -1.3 -.a -.5 -.9 -.I .l
11 11 11 11 11 11 17 16 15 10 4 5 5 5 5 5 5 5 5 5 4 .4 1.5 1.0 1.3 1.3 1.4 1.9 3.1 3.4 .O 5 - 4 6 -1 1 -1.0 -.5 -1 1 4 -1.0 -.a -.5
2.1 2.6 2.2 2.4 2.4 2.3 2.6 2.8 2.0 .O -Lo -1 5 -;:3 -1 5 -1.2 -.I -1 2 ::4 -1.0 -.9 -1.1 11 11 11 11 11 11 11 11 17 16 14 10 10 10 10 10 10 10 10 10 10 10 10
3.6 2.2 2.0 1.0 2.1 2.2 2.5 2.8 2.7 4.2 3.7 .o .o .o .o .o .o .O .O .O .o .o .O 2.6 2.6 2.5 2.2 2.2 2.3 2.5 2.0 2.3 2.4 1.4 .O .O .O .O .O .O .o .o .O .O .o .o
maxhel: pu 4.2 1 10 ; v -2.8 6 3 maxtvs: Pu 2.9 3 2: V -1.5 2 14
_-_______________--_----------------------- -________-_____-____-----------------------------------------------------------------------------
zcm 11 12 13 14 15 16 17 1 2 3 4 5 6 7 he1 1.6 1.7 .O .O .O .o 3.7 3.7 2.6 2.7 2.0 2.9 1.7 1.0 -.5 .5 .o .o .o .o -.5 .5 -1.2 1.5 -.6 .a -.6 .I tvs 2.4 2.4 .O .O .O .O 1.4 1.4 1.6 1.7 2.5 2.5 2.3 2.3 -.I .I .o .o .o .o -1.1 1.1 -.I 1.0 -.6 7 -.6 .6 SUlU 14.1 .O .O .5 4.5 4.5 4.0 42.3 .O .O 1.5 13.5 13:5 12.0
Page 46
f-P-0 . .
2 I.
;’ m
oo * .
0
NO
0 .
.
00 s-4
0
PO
t4 I w
tn I
00 t-l
.
00 Fl
.
00 s-l
.
0’0 d
. lnw
“4
l-d l-l
. m
t-lo) rl
. N
P-0
“Pi
l-4-(01 “c;
I-IO
l-4 . m
r(vI ld
. N
V-IN
-
L-4 299
0
rlF4 “P
i T-IO
l-4
. N
r1U2
r( . m
l-lm
-4 $199
0
t-40
“vi
Page 47
00 5-l .
i I I
I
00 t-4 .
-7 100 .
.
0
i 0
I I I
00 l-l .
a00 . .
0
1 U
-IN
00 r( .
;’ 00 l-l .
i I m
‘InIn
. . m
* vi
‘00 . . 0
i m
I
t-4
I
00 . .
0
Page 48
Fig. 3.19. Discrepancies. V13. Sl. Burnup = 30 MWdkg
1 -. 4
1 1 1 -. 9 -.9 -.2
1 1 1 1 1 -.B -1.1 -1.0 -.5 -.8
1 1 1 1 1 1 1 -. 9 -.9 -1.0 -.9 -1.4 -1.3 -.2
7 1 1 1 1 1 1 1 1 -. 6 -. 8 -.0 -.5 -.8 -1.4 -.8 -.9 -1.2
5 6 7 1 1 1 1 1 '1 1 1 -.7 -.5 -.5 -.5 -.5 -.9 -.6 -1.2 -.6 -1.0 -.7
15 10 5 6 7 1 1 1 1 1 1 1 1 2.5 .O -.8 -.7 -.2 -.7 -.7 -.9 -.7 -.6 -.7 -.5 -.a
17 16 15 10 5 6 7 1 1 1 1 1 1 1 1 3.3 3.4 2.6 .O -1.4 -.6 -.5 -.7 -.7 -1.1 -.4 -.5 -.0 -.4 -1.1
11 11 17 16 15 10 5 6 7 7 7 7 7 7 7 7 7 2.0 2.9 2.8 3.1 2.2 .O -1.3 -.4 -.5 -.7 -.2 -1.1 -.0 .o -.4 -.5 .O
11 11 11 11 17 16 15 10 5 6 6 6 6 6 6 6 6 6 6 1.9 2.3 1.7 2.4 2.4 3.5 3.3 .O -1.0 -.5 -.5 -.2 -.6 -.4 -.2 -.2 -.2 .l -.2
11 11 11 11 11 11 17 16 15 10 4 5 5 5 5 5 5 5 5 5 4 1.8 1.8 1.9 2.3 1.8 2.5 2.6 3.0 2.6 .O -1.5 -1.3 -1.0 -1.3 -1.5 -1.2 -1.3 -1.1 -1.3 -1.4 -2.3
11 11 11 11 11 11 11 11 17 16 14 10 10 10 10 10 10 10 10 10 10 10 10 2.3 3.7 2.2 2.9 2.9 2.8 2.0 2.4 3.2 2.9 3.0 .O .O .O .O .O .O .O .o .o .O .O .O
maxerr: Pu 3.7 1 2: u -2.3 2 21 ______________-_____--------------------- ____-___-__--______--------------------------------------------------------------------------------
zon 11 12 13 14 15 16 17 1 2 3 4 5 6 7 err 2.3 2.3 .O .O .O .O 3.0 3.0 2.6 2.7 3.2 3.2 2.7 2.8 -.a .8 .o .o .o .O -1.8 1.8 -1.2 1.2 -.4 .4 -.5 .5 sum 14.1 .O .O .5 4.5 4.5 4.0 42.3 .O .O 1.5 13.5 13.5 12.0
45
Page 49
Fig. 3.20. Discrepancies. V13. Sl. Burnup = 40 MWd/kg
1 -1.1
1 1 1 -1.7 -1.0 -1.0
1 1 1 1 1 -1.6 -1.3 -1.6 -1.1 -1.3
1 1 1 1 1 1 1 -1.0 -.8 -1.3 -1.5 -1.8 -1.4 -1.5
7 1 1 1 1 1 1 1 1 -. 2 .O -.6 -.7 -.7 -.9 -1.1 -1.2 -.5
5 6 7 1 1 1 1 1 1 1 1 -1.2 -.2 -.2 .o -.4 -.7 -.6 -.8 -.4 -.4 -.8
15 10 5 6 7 1 1 1 1 1 1 1 1 2.6 .O -.B .l -.7 -.5 -.8 -.8 -.6 -.8 -.B -.6 -.9
17 16 15 10 5 6 7 1 1 1 1 1 1 1 1 3.2 2.6 2.0 .O -1.4 -.l -.2 -.9 -.5 -.8 -.6 -.2 -.3 -.l -.5
11 11 17 16 15 10 5 6 7 7 7 7 7 7 7 7 7 2.0 2.2 2.6 2.3 1.4 .O -1.3 -.5 -.3 .l -.2 -.6 -.2 .3 -.l -.5 .6
11 11 11 11 17 16 15 10 5 6 6 6 6 6 6 6 6 6 6 2.6 1.6 2.3 2.4 2.1 2.1 1.3 .O -1.4 .l .1 -.l .o -.2 -.l .l -.3 .2 -.B
11 11 11 11 11 11 17 '16 15 10 4 5 5 5 5 5 5 5 5 5 4 2.5 2.3 2.3 1.9 2.2 2.5 2.6 3.0 1.9 .O -1.9 -1.7 -.9 -1.0 -1.0 -.9 -.6 -1.2 -.5 -.9 -1.7
11 11 11 11 11 11 11 11 17 16 14 10 10 10 10 10 10 10 10 10 10 IO lo 1.0 1.6 1.7 1.8 1.6 2.5 2.2 1.4 2.6 3.6 1.2 .O .O .O .O .O .O .O .O .O .O .O .O
- maxerr : Pu 3.6 1 10 : U -1.9 2 11 ----------------------------------------------------------~---------------------------------------------------------------------------------
ran 11 12 13 14 15 16 17 1 2 3 4 5 6 7 err 2.1 2.1 .o .o .o .o 1.2 1.2 1.6 1.6 2.6 q.7 2.6 2.6 -.0 .9 .o .o .o .o -1.8 1.8 -1.1 1.1 -.l .2 -.2 .4 S"Ul 14.1 .O .O .5 4.5 4.5 4.0 42.3 .O .O 1.5 13.5 13.5 12.0
46
Page 50
00 s-4 .
-0 4 m
m
;’ lnol
WV
) I’
r-m
l-04 v-+%
-l 1.
WO
00 l-4 .
t-0 m
m
s-40 W
O
l-lw
wl-4
00 l-4 .
I-Ill) Icr( I’
r(m
I’ W
O
00 t-l .
lnln ;’
mm
;’
mm
v-lo w
r( 7
wm
r-m
W
I-I 00 5-l .
I-IV) I’ r-0
FN
wul
I
WN
FN
;’
00 s-4
.
l-l-l m
-3 rl I
00 l-l *
t-l I
00 l-l .
(00 InI- I-l
I 00 t-4 *
IO(L)
In- ?! .
DO
;’ m
m
r( .
WO
-0;
Page 51
Fig. 3.22. Discrepancies. V13. Sl. Burnup = 60 MWdkg
1 1.7
1 1 1 1.6 1.3 1.6
1 1 1 1 1 .1 .0 .7 1.2 1.1
1 1 1 1 1 1 1 -. 4 .3 .5 .7 .4 1.3 1.2
7 1 1 1 1 1 1-1 1 -.5 -.l -.6 .5 .6 .6 .6 .6 .2
5 6 7 1 1 1 1 1 1 1 1 1.4 .l -.3 -.6 -.4 .2 .4 .l -.2 .O -.5
15 10 5 6 7 1 1 1 1 1 1 1 1 -1.2 .O 1.4 .3 -.4 -1.2 -.3 .2 -.3 -.3 .l -1.3 -.4
17 16 15 10 5 6 7 1 1 1 1 1 1 1 1 -.6 -.5 -.9 .o 1.1 .3 -1.3 -.8 -.6 -.3 -.l -.6 -.5 -1.0 -1.4
11 11 17 16 15 10 5 6 7 7 7 7 7 7 7 7 7 1.7 .l .o -.5 -.9 .o .9 .4 -.6 -.6 -.9 -.9 -.9 -1.0 -1.1 -1.2 -.8
11 11 11 11 17 16 15 10 5 6 6 6 6 6 6 6 6 6 6 2.1 1.8 .B .-.5 -.7 -1.1 -.6 .O .4 .0 -.3 -1.1 -.7 -.3 .O -.7 -.6 -.9 -1.1
11 11 11 11 11 11 17 16 15 10 4 5 5 5 5 5 5 5 5 5 4 2.3 2.0 1.0 1.9 .6 -.5 -1.1 -.0 -1.1 .O 1.0 1.0 -.l .o -.3 -.4 .O .o -.l -.7 -.2
11 11 11 11 11 11 11 11 17 16 14 10 10 10 10 10 10 10 10 10 10 .lO 10 .4 2.8 2.3 1.8 1.8 1.7 -.l -1.6 -1.4 -1.3 -.4 .o .O .o .o .O .O .O .O .O .O .O .O
maxerr : Pu 2.8 1 2; U 1.7 12 1‘ ____________________------------------------- __________-___-_____---------------------------------------------------------------------------
zon 11 12 13 14 15 16 17 1 2 3 4 5 6 7 err 1.1 1.6 .O .O .O .O -.4 .4 -.9 .9 -.0 .9 -.7 .9 .l .7 .O .O .O .O .6 .9 .3 .7 -.2 .6 -.0 .9 sum 14.1 .O .O .5 4.5 4.5 4.0 42.3 .O .O 1.5 13.5 13.5 12.0
48
Page 52
Fig. 3.23. Power distribution. V14. Sl. Burnup = 0 MWdkg
CONKEMO .996 RELIOS .990 TVS-M .984
.996
.990
.984 -998 .996 .999 .986 .984 .988 .985 .985 .985
.992 .994 .995 .992 .996
.986 .985 .985 .985 ..989
.986 .985 .985 .985 -. 986 .997 .992 .992 .994 .994 .998 .996 .987 .985 .986 .986 .986 .987 .991
988 .987 986 .986 .986 .987 .988
:986 995 .99; . 985 .998 .986 .99; .986 . .987 996 .995 .988 . .988 995 1.002 .989 1.000 .994 .991 .990 .989 .988 .988 .988 .989 .990 .992
.999 . 993 .994 .998 .996 .995 .998 .996 .999 1.004 1.013
.989 .984 .986 .987 .988 .989 .990 .991 .992 .994 1.000 1.005 .994 .992 .992 .991 .991 .992 992 .993 995 .998
.904 .ooo 1.004 .997 . 997 1.002 1.004 1.001 1.00; 1.006 1.00; 1.012 1.023
.938 .ooo .989 .988 .990 .992 .994 .995 .996 .998 . 999 1.002 1.009
.932 . 000 1.007 .997 .996 .996 .997 .997 .998 . 999 1.000 1.003 1.008 1.031 ‘832 .913 .OOO 1.010 1.005 1.010 1.012 1.015 1.012 1.015 1.017 1.023 1.028 1.042 1.058 1857 .944 .OOO .994 .996 . 999 1.002 1.004 1.006 1.007 1.009 1.011 1.015 1.026 1.050 .857 .934 .OOO 1.013 1.004 1.004 1.005 1.006 1.007 1.008 1.010 1.012 1.017 1.024
.863 . 913 1.034 .a35 .913 .OOO 1.024 1.019 1.021 1.026 1.027 1.032 1.038 1.038 1.043 1.051 1.062
.896 . 936 1.056 .867 953 .OOO 1.008 1.012 1.016 1.020 1.022 1.024 1.026 1.028 1.032 1.038 1.053
.891 . 937 1.053 .861 :941 .OOO 1.025 1.016 1.018 1.021 1.023 1.025 1.027 1.629 1.033 1.039 1.051 .844 .847 .S67 . 921 1.045 .847 .934 .OOO 1.047 1.046 1.054 1.063 1.061 1.063 1.068 1.075 1.082 1.089 1.110 .868 .072 .893 .940 1.065 .879 968 .OOO 1.036 1.042 1.050 1.055 1.058 1.060 1.062 1.065 1.070 1.078 1.098 .862 .871 .892 .941 1.061 .872 : 956 .OOO 1.045 1.040 1.047 1.052 1.055 1.058 1.060 1.063 1.068 1.077 1.097
.839 .839 .841 .854 .878 .924 1.063 .868 ..964 .OOO 1.092 1.110 1.125 1.128 1.128 1.134 1.135 1.144 1.147 1.161 1.193
.858 .S57 .863 .873 ,896 . 950 1.087 .905 1.003 .OOO 1.087 1.105 1.112 1.116 1.119 1.121 1.123 1.127 1.134 1.146 1.175
.a55 .857 .862 .873 .898 .952 1.084 .898 .986 .OOO 1.083 1.096 1.108 1.115 1.119 1.122 1.126 1.130 1.137 1.149 1.176 .840 .840 .a34 .833 .841 .855 .a97 .960 1.134 ,937 1.043 .ooo .ooo .ooo .ooo .ooo .ooo .ooo .ooo .ooo .ooo .ooo .ooo .893 .e59 .863 .867 '.874 .807 .919 .992 1.171 .987 1.088 .ooo .ooo ,000 .ooo .ooo .ooo . 000 .ooo .ooo .ooo .ooo .ooo .853 .854 .855 .859 .866 .880 .912 .985 1.154 .966 1.058 .ooo .ooo .ooo . 000 .ooo .ooo .ooo . 000 .ooo .ooo .ooo .ooo
49
Page 53
Fig. 3.24. Power distribution. V14. Sl. Burnup = 10 MWdkg
CoNKEMO .992 HELIOS .994 TVS-M .983
.992
.994
.983 .989 .990 .989 .990 .987 .992 .983 .983 .983
1.002 .991 .994 .989 .992 .990 .988 .989 r.988 .993 .985 .904 .984 .904 .984
.996 .993 .991 .991 .993 .990 .992
.991 .980 .989 .989 .909 .990 .995
.989 .907 .985 .985 .985 .985 .986 1.004 1.002 .995 .994 .992 .995 .992 .991 .994 1:002 999 .992 .994 .990 .990 .990 .988 .990 .987 .987 .991 1987 991 .992 .988 .990 .998
1.041 1.013 1.007 1.000 1.002 .999 .999 .999 .998 1.002 1.008 1.034 1.007 .998 .994 .993 .992 .993 .994 . 995 .996 1.003 1.043 1.016 1.003 .996 .992 .991 .990 ,990 .991 .993 .995
.842 .OOO 1.050 1.017 1.005 1.007 1.003 1.002 1.006 1.000 1.004 1.007 1.003
.852 .OOO 1.034 1.011 1.002 .999 .998 .998 . 999 1.000 1.002 1.004 1.012
.852 .OOO 1.045 1.018 1.006 1.000 .997 .996 .996 .997 .998 1.001 1.005 1.042 .827 .847 .OOO 1.047 1.025 1.013 1.016 1.012 1.014 1.012 1.014 1.012 1.018 1.024 1.056 .832 .855 .OOO 1.040 1.018 1.010 1.007 1.007 1.008 1.009 1.011 1.013 1.016 1.028 1.060 .843 .853 .OOO 1.050 1.024 1.013 1.008 1.006 1.006 1.006 1.008 1.010 1.014 1.021
.909 .944 1.046 .831 .850 .OOO 1.057 1.034 1.030 1.025 1.027 1.029 1.028 1.033 1.031 1.040 1.051
.913 . 952 1.055 .839 .860 .OOO 1.052 1.031 1.025 1.023 1.024 1.025 1.027 1.029 1.032 1.038 1.053
.923 .967 1.062 .847 .858 .OOO 1.060 1.035 1.026 1.023 1.023 1.023 1.024 1.026 1.029 1.035 1.047 .879 .882 .906 . 947 1.051 .842 .857 .OOO 1.078 1.057 1.054 1.053 1.054 1.057 1.061 1.063 1.063 1.073 1.093 .884 .889 .911 .957 1.064 .849 .870 .OOO 1.074 1.056 1.054 1.054 1.055 1.057 1.059 1.062 1.066 1.074 1.094 .892 .902 .924 .972 1.070 .855 .867 .OOO 1.076 1.056 1.052 1.051 1.052 1.053 1.054 1.057 1.062 1.070 1.087
.859 .871 .867 .887 .908 .961 1.076 .866 .879 .OOO 1.118 1.108 1.106 1.109 1.114 1.117 1.117 1.120 1.130 1.139 1.160
.874 .874 .881 .891 .915 . 967 1.085 .869 .889 . 000 1.113 1.110 1.110 1.110 1.112 1.114 1.116 1.120 1.126 1.137 1.163
.884 .887 .893 .905 .930 . 984 1.091 ,874 .882 .OOO 1.104 1.101 1.102 1.104 1.105 1.106 1.109 1.113 1.119 1.129 1.151 .868 .864 .870 .871 .874 .894 .924 .996 1.135 .904 .910 .ooo .ooo .ooo .ooo . 000 .ooo . 000 . 000 . 000 .ooo .ooo .ooo .906 876 .879 .883 .890 .905 . 937 1.006 1.151 .919 .929 .ooo .ooo .ooo .ooo .ooo .ooo .ooo .ooo .ooo .ooo .ooo .ooo .883 1883 .885 .888 .896 .912 . 946 1.014 1.144 .913 .908 .ooo .ooo .ooo .ooo .ooo .ooo .ooo .ooo .ooo .ooo .ooo ..ooo
50
Page 54
Fig. 3.25. Power distribution. V14. Sl. Burnup = 20 MWd/kg
CONKEMO .976 HELIOS .989 TVS-M .900
.976 1909 .900
.979 .979 .980
.904 .981 .987
.980 .980 .980 -902 .903 .978 .979 .984 .985 .902 .983 .902 . . 987 .982 .981 .900 .980 -.9Sl
.993 .907 .982 .981 .903 .984 .903
.909 .904 .984 .983 .984 .984 .989
.989 .905 903 982 .982 .982 .983 1.011 .994 .987 .98; .90i 986 .987 .983 .906 1.003 991 .988 .986 .985 :985 .905 .986 .991 1.006 :996 .989 .986 .904 -984 .904 .985 .986
1.064 1.027 1.011 .999 .992 .985 .985 .906 .987 .988 .988 1.056 1.016 1.002 .994 .990 .988 .980 .988 .989 . 990 .996 1.058 1.025 1.007 .997 .992 .989 .980 .987 .908 989 .992
.034 .OOO 1.064 1.032 1.013 .997 .996 .993 .992 .991 .99; . 994 1.002
.834 .OOO 1.056 1.020 1.005 .998 .994 ,993 .993 .994 .995 .996 1.005
.824 .OOO 1.059 1.027 1.010 1.001 .996 .994 .993 .994 .995 . 997 1.002 1.061 .'841 .829 .OOO 1.071 1.036 1.020 1.000 1.001 1.009 1.006 1.005 1.001 1.007 1.010 1.072 .837 .035 .OOO 1.060 1.026 1.012 1.005 1.003 1.002 1.002 1.003 1.005 1.008 1.010 1.069 .844 .825 . 000 1.063 1.032 1.017 1.009 1.005 1.003 1.003 1.004 1.006 1.010 1.017
.946 989 1.064 .841 .829 .OOO 1.089 1.054 1.035 1.022 1.010 1.020 1.017 1.016 1.017 1.023 1.036
.956 :992 1.072 .842 .038 .OOO 1.070 1.037 1.024 1.019 1.017 1.017 1.017 1.019 1.021 1.026 1.040
.958 999 1.071 .047 .820 .OOO 1.071 1.042 1.028 1.022 1.020 1.019 1.019 1.021 1.024 1.029 1.039 .920 .94; . 992 1.068 .849 .835 .OOO 1.107 1.076 1.071 1.041 1.040 1.045 1.046 1.039 1.040 1.053 1.067 .932 .?54 .997 1.080 .850 .845 .OOO 1.086 1.055 1.047 1.044 1.043 1.043 1.044 1.046 1.050 1.056 1.073
.926 .937 .960 1.004 1.070 .854 .834 .OOO 1.083 1.058 1.049 1.045 1.044 1.044 1.045 1.047 1.052 1.059 1.073 .902 .912 .909 .920 .948 1.004 1.089 .865 .840 .OOO 1.151 1.136 1.130 1.086 1.088 1.090 1.091 1.089 1.097 1.104 1.127 .917 .916 .923 .934 .958 1.007 1.098 .863 .856 .OOO 1.113 1.099 1.093 1.091 1.090 1.091 1.093 1.096 1.101 1.109 1.131 .917 .920 .927 .940 966 1.015 1.096 .866 .842 .OOO 1.102 1.091 1.087 1.005 1.085 1.005 1.087 1.090 1.095 1.103 1.119
.887 .901 .907 .914 .915 .936 . 964 1.034 1.128 .892 .854 .ooo .ooo .ooo . 000 .ooo .ooo .ooo .ooo .ooo .ooo .ooo . 000
.945 .918 .921 .924 .932 .948 .900 1.041 1.144 .891 .878 .ooo .ooo .ooo .ooo . 000 .ooo .ooo .ooo . 000 .ooo .ooo .ooo
.916 .916 .918 .922 .931 .948 .982 1.042 1.131 .887 .852 .ooo . 000 .ooo .ooo .ooo .ooo .ooo .ooo .ooo .ooo .ooo .ooo
51 .
Page 55
Fig. 3.26. Power distribution. V14. Sl. Burnup = 30 MWdkg
CONKEMO .976 HELIOS .985 TVS-M .978
.976
.985 970
-980 .97; .979 .981 .978 .983 .979 .979 .979
.974 .980 .976 .979 .970
.983 .979 .979 .979 .903 902 .980 .979 .979 .980
.982 .97i .981 .900 .977 .976 .977
.908 .982 .981 .980 .980 .9so .985 989 .985 .982 981 .980 .981 .901
1.004 .99s .990 .982 .90; .903 983 .982 .984 I.004 .991 .907 .984 .982 .982 : 982 .982 .907 1.008 .997 990 906 .904 .903 .983 .983 .985
1.066 1.028 1.003 .99i .98i .984 .988 .906 .991 .986 .909 1.061 1.018 1.002 .993 .980 .986 .985 .985 .985 .985 .992 1.050 1.028 1.009 .998 .992 .988 .907 .986 .987 .988 .990
.834 .OOO 1.067 1.030 1.008 .998 .997 ,988 .993 .994 .990 .990 .988
.844 .OOO 1.061 1.022 1.005 .997 .992 ,990 -989 .989 .990 .991 .999
.826 .ooo 1.059 1.029 1.012 1.002 996 993 .992 992 993 995 .999 1.065 .s49 .832 . 000 1;075 1.033 1.018 .99i 1.00; . 998 .99; .99i’ .99ii 1.006 1.007 1.075 .051 .844 .OOO 1.064 1.026 1.010 1.003 .999 .997 .997 .997 .999 1.001 1.010 1.068 .853 .027 .OOO 1.062 1.034 1.017 1.008 1.004 1.002 1.001 1.001 1.003 1.006 1.013
.976 1.014 1.060 .851 .037 .OOO 1.083 1.045 1.031 1.017 1.013 1.010 1.012 1.011 1.015 1.013 1.023 ,992 1.023 1.075 .854 .847 .OOO 1.071 1.034 1.020 1.013 1.010 1.009 1.009 1.010 1.012 1.016 1.028 .989 1.023 1.070 .855 .829 .OOO 1.067 1.041 1.027 1.020 1.016 1.015 1.015 1.016 1.019 1.023 1.032
.956 .958 . 904 1.022 1.072 .854 .040 .OOO 1.102 1.066 1.056 1.034 1.028 1.025 1.025 1.032 1.041 1.043 1.053
.963 .970 . 991 1.027 1.081 .060 .851 .OOO 1.081 1.047 1.037 1.032 1.030 1.029 1.030 1.031 1.034 1.039 1.053
.957 .968 .990 1.027 1.076 .860 .833 .OOO 1.075 1.053 1.043 1.030 1.036 1.035 1.036 1.037 1.041 1.047 1.050 .950 .942 .957 964 . 990 1.032 1.091 .068 .847 .OOO 1.132 1.118 1.107 1.067 1.067 1.066 1.065 1.070 1.071 1.079 1.085 .954 .954 .961 : 973 ..996 1.037 1.093 .068 .859 ,000 1.099 1.001 1.074 1.070 1.069 1.069 1.070 1.072 1.076 1.081 1.099
947 951 .950 .972 .997 1.038 1.088 .868 . 038 ,000 1.086 1.074 1.068 1.065 1.064 1.064 1.065 1.067 1.071 1.077 1.007 .942 .94; .94; . 950 .962 .972 1.008 1.058 1.103 .879 .855 .ooo .ooo .ooo .ooo .ooo .ooo .ooo .ooo .ooo .ooo .ooo . 000 .901 .955 .959 .962 .970 .986 1.015 1.063 1.118 .084 .876 ,000 . 000 . 000 . 000 . 000 .ooo . 000 .ooo .ooo .ooo .ooo .ooo .946 .946 .948 .953 .962 .980 1.011 1.050 1.107 .878 .842 .ooo .ooo .ooo .ooo .ooo . 000 .ooo .ooo . 000 .ooo .ooo .ooo
52
Page 56
Fig. 3.27. Power distribution. V14. Sl. Burnup = 40 MWd/kg
CONKEMO .970 HELIOS .902 TVS-M .970
.970 -982 .978
1979 971 .976 .975 .977 .980 .979 .978 .970
.973 .977 .974 .970 .981
.901 .977 .977 .976 .981
.902 .980 .979 .979 .979 .985 .904 .904 .975 .977 .970 .983 .987 .980 .979 .978 .977 .977 .982 .909 .985 .902 .981 .980 ,900 .981
1:003 996 .992 .990 .985 .903 .907 .902 : 900 977 .979 .982 .979 .979 -903 .979 .981 .904 1.008 .997 .990 .986 .983 .982 982 .983 .904
1.066 1.024 1.002 .994 .980 .984 .986 .90; .904 . 983 .981 1.058 1.016 1.001 .992 .907 .984 .982 .981 .981 .981 .987 1.049 1.025 1.009 .998 .992 .908 986 .985 ,906 907 .989
.060 .ooo 1.066 1.021 1.005 .997 .993 .99i . 985 .993 .986 .985 .993
.871 .OOO 1.058 1.019 1.003 .995 .990 .987 .906 .985 .986 .986 .993
.048 .OOO 1.050 1.027 1.011 1.001 996 .992 .991 .991 991 .993 .997 1.063 .871 .058 .ooo 1:070 1.033 1.014 .99s .991 .994 .989 .99il .999 1.001 1.005 1.071 .874 .871 _ 000 1.060 1.022 1.007 .999 .995 .993 ,992 .992 992 . 994 1.002 1.062 .071 .848 .OOO 1.052 1.030 1.015 1.007 1.002 .999 .999 .999 1:000 1.003 1.008
1.015 1.042 1.060 .078 .859 .OOO 1.072 1.037 1.023 1.009 1.008 1.002 1,005 .990 1.006 1.009 1.015 1.025 1.046 1.070 .876 _ 873 .OOO 1.064 1.027 1.014 1.007 1.004 1.002 1.001 1.002 1.003 1.005 1.015 1.015 1.040 1.063 .872 .830 .OOO 1.055 1.035 1.022 1.016 1.012 1.010 1.010 1.011 1.013 1.017 1.023
.990 . 999 1.016 1.049 1.060 .802 .867 .OOO 1.005 1.053 1.041 1.021 1.019 1.012 1.010 1.017 1.020 1.025 1.036
.999 1.006 1.024 1.050 1.074 .880 .076 .OOO 1.069 1.035 1.025 1.020 1.017 1.016 1.016 1.017 1.019 1.022 1.033
.986 . 998 1.017 1.044 1.068 .876 .853 .OOO 1.060 1.043 1.034 1.029 1.026 1.025 1.025 1.027 1.029 1.034 1.041 .902 .981 . 995 1.009 1.025 1.057 1.070 .888 .868 .OOO 1.106 1.084 1.077 1.047 1.030 1.037 1.035 1.040 1.043 1.055 1.053 .991 .991 . 997 1.009 1.029 1.057 1.081 .885 .882 .OOO 1.000 1.062 1.055 1.051 1.049 1.048 1.048 1.049 1.052 1.056 1.070 . 977 .900 . 907 1.001 1.023 1.052 1.075 .85? 1.040 1.053 1.058 .881 .OOO 1.065 1.055 1.049 1.045 1.044 1,043 1.044 1.045
.973 .976 .976 .992 . 992 1.016 1.036 1.060 1.076 .885 .874 .ooo .ooo . 000 .ooo . 000 .ooo .ooo .ooo .ooo .ooo . 000 .ooo 1.015 .991 .994 . 998 1.006 1.020 1.044 1.074 1.090 .096 .898 . 000 . 000 . 000 . 000 . 000 .ooo .ooo .ooo .ooo .ooo .ooo .ooo
.974 .975 .977 .982 .992 1.009 1.034 1.064 1.081 .885 .860 .ooo .ooo .ooo .ooo .ooo .ooo .ooo .ooo .ooo .ooo .ooo .ooo
53
Page 57
Fig. 3.28. Power distribution. V14. Sl. Burnup = 50 MWdkg
CONKEMO .976 AELIOS .900
.TvS-M .978
.976
.900
.978 .977 .977 -969 .977 .973 .970 .970 .978 .978
.982 .974 .980 .977 .973
.979 .975 .975 .974 .979
.902 .980 .979 978 .979 .902 .901 .978 .977 .97i .982 .974
: 989 985 .979 .985 .977 .902 .976 . 980 -975 -980 .975 .980 .979 .980
l:ooo 996 .991 .980 .990 .984 .985 .980 .975 .970 .970 .977 -976 .976 .978 . 976 .979 .981 1.006 996 .990 .906 .903 .982 .981 .982 .903
1.053 1.017 1.00; 996 .986 .9s7 .977 .974 .974 .975 .973 1.051 1.011 .998 :990 .985 .902 .980 .979 .978 .970 .984 1.038 1.020 1.007 .997 .991 .988 _ 986 .905 .905 .905 .987
.894 .OOO 1.057 1.023 1.003 .989 .985 .986 .904 .982 .984 .980 .983
.906 .OOO 1.051 1.014 1.000 .992 .987 .984 -902 .902 .981 .982 .988
.879 .OOO 1.038 1.021 1.008 1.000 .994 991 .989 ,989 .989 .991 .994 1.061 .902 .894 .OOO 1.055 1.025 1.007 1.005 .99; .980 .990 .905 .992 .988 .987 1.064 .902 .905 .OOO 1.052 1.016 1.002 .995 .991 .980 .987 .986 .986 .987 .995
1.056 .896 .880 .OOO 1.039 1.023 1.011 1.004 999 .997 .996 .995 .996 999 1.003 1.052 1.056 1.057 .907 .a97 .OOO 1.064 1.027 1.015 1.00; .993 .993 .990 .994 .996 .998 .996 1.050 1.060 1.063 ,904 .907 .OOO 1.053 1.018 1.006 1.000 .996 .994 .993 .993 .994 .995 1.003 1.037 1.055 1.056 .897 ..802 .OOO 1.041 1.026 1.016 1.010 1.006 1.005 1.004 1.004 1.006 1.009 1.014
1.010 1.031 1.044 1~060 1.064 .PiO .096 . 000 1.067 1.044 1.020 1.009 1.004 1.002 1.004 1.006 1.002 1.004 1.013 1.031 1.036 1.049 1.063 1.065 .907 .909 .OOO 1.055 1.023 1.014 1.009 1.006 1.004 1.003 1.004 1.005 1,007 1.016 1.014 1.024 1.039 1.054 1.059 .900 .084 .OOO 1.043 1.031 1.023 1.019 1.016 1.015 1.015 1.015 1.017 1.020 1.025
1.010 1.000 1.020 1.037 1.051 1.071 1.066 .911 .907 .OOO 1.083 1.062 1.052 1.030 1.029 1.027 1.024 1.027 1.026 1.032 1.042 1.023 1.023 1.029 1.039 1.053 1.060 1.067 .9o9 .913 .OOO 1.063 1.045 1.038 1.035 1.032 1.031 1.031 1.031 1.033 1.035 1.047 1.004 1.008 1.015 1.027 1.043 1.059 1.062 .903 .887 . 000 1.045 1.037 1.031 1.020 1.026 1.025 1.025 1.026 1.028 1.031 1.034
1.020 1.011 1.018 1.021 1.024 1.039 1.055 1.076 1.064 .911 .915 .OOO .ooo .ooo .ooo . 000 .ooo .ooo .ooo .ooo .ooo .ooo .ooo 1.045 1.023 1.026 1.030 1.037 1.049 1.064 1.076 1.067 .910 .929 . 000 . 000 .ooo .ooo .ooo . 000 . 000 . 000 .ooo .ooo .ooo .ooo 1.002 1.003 1.005 1.010 1.019 1.033 1.051 1.065 1.059 .905 .889 .ooo .ooo .ooo .ooo . 000 .ooo .ooo .ooo . 000 .ooo .ooo .ooo
54
Page 58
Fig. 3.29. Power distribution. V14. Sl. Burnup = 60 MWd/kg
CONKEMO .964 AELIOS .979 TVS-M .977
.964
.979
.977 .974 .966 .965 .975 .971 .976
970 .977 .977 _ 976 .97; .971 .975 .967 .977 .973 .973 .972 .976 .981 .979 978 .978 978
,905 .980 .975 .97; .974 .97i .970 .983 .977 976 .974 .973 .972 .977 .980 .984 :981 .980 .979 .979 .979
.999 .992 .985 .977 .974 .974 .976 .972 .974
.997 .9S6 .982 .978 .976 .975 .974 .973 .978 1.003 .994 .988 .985 982 .981 .980 .981 .982
1.037 1.012 .996 .991 .PPl .98; .974 .900 .982 .976 .973 1.045 1.006 .995 .987 .982 .979 .977 .976 .975 .975 .980 1.027 1.014 1.003 .995 .990 .906 .904 .983 .983 .904 985
.926 .OOO 1.042 1.013 .994 .994 .987 .978 .983 .901 .975 .978 984
.941 .OOO 1.045 1.008 .996 .988 .984 .981 .979 .978 .977 .977 : 903
.914 .OOO 1.027 1.014 1.004 .997 .992 .989 .987 ,987 .907 .988 .990 1.051 .932 .926 .OOO 1.050 1.012 1.007 .996 .982 .979 .981 .982 .905 .981 .985 1.059 .931 .940 .ooo 1.045 1.009 .996 .990 .906 .983 .982 .901 .981 .981 .907 1.050 .925 . 915 .OOO 1.028 1.016 1.006 1.000 996 .993 .992 .991 .992 .994 .996
1.066 1.073 1.055 .935 .927 .OOO 1.052 1.015 1.009 .99; .995 .995 .991 .990 .909 .999 1.000 1.067 1.067 1.057 .933 .941 .ooo 1.045 1.010 .999 .993 .990 .988 .986 .986 .986 .986 .993
1.053 1.050 1.051 .926 ..916 .OOO 1.028 1.017 1.009 1.004 1.001 .999 .998 .990 .999 1.001 1.004 1.050 1.063 1.069 1.071 1.057 .938 .933 .OOO 1.050 1.020 1.012 1.000 .999 1.000 .991 .994 . 994 1.000 1.001 1.055 1.058 1.066 1.069 1.050 .934 .943 .OOO 1.045 1.012 1.004 .999 .996 .994 .993 .993 .993 .994 1.002 1.037 1.045 1.054 1.060 1.052 .927 .918 .OOO 1.029 1.020 1.013 1.009 1.007 1.005 1.005 1.005 1.006 1.000 1.011
1.042 1.056 1.050 1.055 1.074 1.076 1.060 .939 .934 .OOO 1.062 1.046 1.040 1.015 1.021 1.013 1.010 1.013 1.019 1.019'1.036 1.048 1.048 1.054 1.060 1.068 1.070 1.057 .936 .946 .OOO 1.051 1.033 1.027 1.024 1.021 1.020 1.019 1.019 1.019 1.020 1.032 1.029 1.032 1.030 1.047 1.057 1.062 1.052 .929 .92b .OOO 1.029 1.022 1.018 1.014 1.012 1.011 1.011 1.012 1.013 1.015 1.016
1.057 1.041 1.038 1.044 1.057 1.061 1.081 1.067 1.046 .930 .942 .ooo .ooo .ooo .ooo .ooo . 000 .ooo .ooo .ooo .ooo .ooo .ooo 1.070 1.040 1.052 1.055 1.061 1.068 1.075 1.073 1.053 .943 .963 ,000 .ooo .ooo .ooo .ooo .ooo .ooo .ooo .ooo .ooo .ooo .ooo 1.027 1.028 1.030 1.034 1.042 1.052 1.061 1.062 1.045 .930 .923 .ooo .ooo .ooo .ooo .ooo .ooo ,000 .ooo .ooo .ooo .ooo .ooo
5s
Page 59
Fig. 3.30. Discrepancies. V14. Sl. Burnup = 0 MWd/kg
1 6
-;:2 1 1 1
-1.2 -1.2 -1.1 -1.3 -1.1 -1.4
1 1 1 1 1 -.6 -.P -1.0 -.7 -.7 -. -. 6 9 -1.0 -.7 -1.0
1 1 1 1 1 1 1 -1.0 7 -. -. 6 8 0 -1.1 -.5
-. 9 I:5 -.6 -.8 I:8 -1.-l -.a 7 1 1 1 1 1 1 1 1
-. 9 -.8 -1.2 -.a -.9 -.7 -.7 -1.3 -.6 -. 4 -.3 -.9 -.6 -.8 -.7 -.6. -1.2 -.8
5 6 7 1 1 1 1 1 1 1 1 -1.0 -.P -.a -1.1 8 -. 6 -.8 -.5 -.7 -1.0 -1.3
.6 .l -.2 -.6 I:5 -.4 -.6 -.4 -.6 -.9 -1.5 14 10 5 6 7 1 1 1 1 1 1 1 1
3.0 .O -1.5 -.P 7 -1.0 -1.0 -.6 8 -. 0 -1.0 -1.0 -1.4 3.1 .o .3 .O I:1 -.6 -.7 -.4 ::6 -.7 -.9 -.P -1.5
16 15 14 10 5 6 7 7 7 7 7 7 7 7 7 2.6 3.0 3.4 .O -1.6 9
Cl -1.1 -1.0 -1.1 -.6 -.0 -.0 -1.2 -1.3 -1.5
1.8 3.0 2.3 .O .3 -.6 -.7 -.9 -.5 -.7 -.7 -1.1 -1.1 -1.7 13 17 16 15 14 10 5 6 6 6 6 6 6 6 6 6 6
3.8 2.5 2.1 3.8 4.4 .O -1.6 -.7 -.5 6 5 -.s -1.2 -1.0 -1.1 -1.2 -.a 3.2 2.6 1.0 3.1 3.1 .O .l -.3 -.3 1:s 114 -.7 -1.1 -.9 -1.0 -1.1 -1.0
11 11 13 17 16 15 14 10 5 5 5 5 5 5 5 5 5 5 5 2.8 3.0 3.0 2.1 1.9 3.8 3.6 .O -1.1 -.4 -.4 0
-.6 -.7 -;:O -. 3 -.3 -.6 9
A:1 -1.1 -1.0 -1.1
2.1 2.8 2.9 2.2 1.5 3.0 2.4 .O -.2 -.6 -.5 -.7 -1.3 -1.1 -1.2 11 11 11 11 13 17 16 15 14 10 2 4 4 4 4 4 4 4 4 4 3
2.3 2.1 2.6 2.2 2.1 2.8 2.3 4.3 4.0 .O -.5 -.5 -1.2 -1.1 -.8 -1.1 -1.1 -1.5 -1.1 -1.3 -1.5 1.9 2.1 2.5 2.2 2.3 3.0 2.0 3.5 2.3 .O -.8 -1.3 -1.5 -1.2 -.8 -1.1 -.8 -1.2 -.9 -1.0 -1.4
11 11 11 11 11 11 13 17 16 15 12 10 10 10 10 10 10 10 10 10 10 10 IO 6.3 2.3 3.5 4.1 3.9 3.7 2.5 3.3 3.3 5.3 4.3 .o .o .o .o .O .O .O .O .O .O .O .O 1.5 1.7 2.5 3.1 3.0 2.9 1.7 2.6 1.0 3.1 1.4 .O .O .O .O .O .O .O .O .O .O .O .O
maxhel: Pu 6.3 1 1 ; U -1.6 5 5 maxtvs: Pu 3.5 2 8; U -1.7 5 15
____-_______________----------------------------------------- -------------------------------------------------------------------------------
ran 11 12 13 14 15 16 17 1 2 3 4 5 6 7 he1 2.9 3.0 4.3 4.3 2.7 2.8 3.9 3.9 3.9 4.0 2.3 2.3 2.6 2.6 -.9 .9 -.5 .5 -1.5 1.5 -1.1 1.1 -.9 1.0 -.8 .9 -1.0 1.0 tvs 2.4 2.5 1.4 1.4 2.5 2.6 2.6 2.6 3.1 3.1 1.8 1.8 2.6 2.6 -.0 .0 -.8 .a -1.4 1.4 -1.1 1.1 -.5 .8 -.5 .7 -.7 .8 sum 7.6 .5 3.0 4.5 4.5 4.0 3.5 34.8 1.0 .5 9.0 14.0 12.5 11.0
56
Page 60
Fig. 3.31. Discrepancies. V14. Sl. Burnup = 10 MWd/kg
.3 -.9
1 1 1 .l -.3 .3
-. 6 -. 7 -, 6 1 1 1 1 1
-1.2 -.3 5 -.l .l -1.7 -.7 -20 -.5 -.8
1 1 1 1 1 1 1 -.5 -.5 -.2 -.2 4 .O .3 -.7 -.6 -.6 -.6 I:* -.5 -.6
7 1 1 1 1 1. 1 1 1 -.5 -1.0 -.5 -.4 -.2 -.4 -.l .l .4 -.2 -.8 -.5 -.6 -.5 -.8 -.5 -.3 -.4
5 6 7 1 1 1 1 1 '1 1 1 -.7 -.6 -.9 -.6 -.P -.7 -.6 5 -. 3 -. 6 -.5
.2 .3 -.4 -.4 -1.0 -.8 -.P ::9 -.7 -.P -1.3 14 10 5 6 7 1 1 1 1 1 1 1 1
1.2 .O -1.5 -.6 -.3 -.a -.5 -.4 7 .O -.2 -.3 .9 1.2 .o -.5 .l .l -.7 -.6 -.6 -Lo -.3 -.6 -.6 .2
16 15 14 10 5 6 7 7 7 7 7 7 7 7 7 1.3 6 .9 .O -.7 -.7 -.3 -.9 -.5 6 -.3 -.3 .l -.2 .4 1.7 1:9 .7 .o .3 -.l .O -.8 -.6 I:8 -.6 -.6 -.2 -.4 -.3
13 17 16 15 14 10 5 6 6 6 6 6 6 6 6 6 6 .4 .8 .9 1.0 1.2 0 -.5 -.3 -.5 -.2 3 -. 4 -.l 4 .l -.2 .2
1.5 2.4 1.5 1.9 .P :o .3 .l -.4 -.2 114 -.6 -.4 117 -.2 -.5 -.4 11 11 13 17 16 15 14 10 5 5 5 5 5 5 5 5 5 5 5 .6 .0 .6 1.1 1.2 .8 1.5 .O -.4 -.I .O .l .l .O -.2 1 .3 .l .l
1.5 2.3 2.0 2.6 1.8 1.5 1.2 .O -.2 -.l -.2 -.2 -.2 -.4 -.7 I:6 -.l -.3 -.5 11 11 11 11 13 17 16 15 14 10 2 4 4 4 4 4 4 4 4 4 3
1.7 .3 1.6 .5 .8 .6 .0 .3 1.1 .O 4 .2 .4 .l 2 3 1 .O 4 -.2 .3 2.9 1.0 3.0 2.0 2.4 2.4 1.4 .9 .3 .O -;:3 -.6 -.4 -.5 I:8 -Lo -17 -.6 -;:O -.9 -.8
11 11 11 11 11 11 13 17 16 15 12 10 10 10 10 10 10 10 10 10 10 10 10 4.4 1.4 1.0 1.4 1.8 1.2 1.4 1.0 1.4 1.7 2.1 .O .O .O .O .o .o. .o .O .O .O .O .O 1.7 2.2 1.7 2.0 2.5 2.0 2.4 1.8 .8 1.0 -.2 .O .O .O .O .O .O .O .o .o .O .O .O
maxhel: Pu 4.4 1 1; u -1.5 6 3 maxtvs: Pu 3.0 2 3: U -1.7 10 1
________________________________________----------------------------------------------------------------------------------------------------
20" 11 12 13 14 15 16 17 1 2 3 4 5 6 7 he1 1.1 1.2 2.1 2.1 .7 .8 1.2 1.2 .8 .9 1.1 1.1' .9 .P -.3 .5 -.4 .4 .3 .3 .o .2 -.2 .5 -.3 .4 -.4 .5 tvs 2.2 2.2 -.2 .2 2.1 2.1 .a . 9 1.5 1.6 1.5 1.5 2.4 2.4 -.7 . 7 -1.3 1.3 -.8 .0 -.7 .7 -.2 .3 -.2 .4 -.4 .5 sum 7.6 ..5 3.0 4.5 4.5 4.0 3.5 34.8 1.0 .5 9.0 14.0 12.5 11.0
51
Page 61
Fig. 3.32. Discrepancies. V14. Sl. Burnup = 20 MWd/kg
1.: .4
1 1 1 .5 .2 .7 .l .l .O
1 1 1 1 1 .3 1 .5 .3 .3 .O ::2 .2 .l -.3
1 1 1 1 1 1 1 : -.4 -.3 .2 .2 .l .O .6
-.4 -.2 .l .l -.l -.2 .O 7 1 1 1 1 1 1 1 1
-. 8 -.3 .l .l .a -.l -.l -.2 .3 .5 -. 5 .2 .2 .l -.2 -.2 -.3 .2 .O
5 6 7 1 1 1 1 1 1 1 1
I:6 8 -1.1 -.2 -14 9 -.5 -.2 -.2 .O .3 .4 .3 .3 .l .2 .l .2 :1 2 .0 .4 14 10 5 6 7 1 1 1 1 1 1 1 1 .O .O -.8 -1.2 -.a .l -.2 .O .l .3 .O .2 .3
-1.2 .O -.5 -.5 -.3 .4 .O .l .l .3 .o .3 .O 16 15 14 10 5 6 7 7 7 7 7 7 7 7 7
1.0 -.5 .7 .O -1.0 -1.0 -.8 -.3 .2 -.7 4 -. 2 .4 .l .8 .0 .4 -.5 .O -.7 -.4 -.3 .l .4 -.6 -:3 -.l .5 .3 .7
13 17 16 15 14 10 5 6 6 6 6 6 6 6 6 6 6 1.1 .3 .Ef. .l 1.1 .O -1.7 -1.6 -1.1 -.3 -.l 3 .O .3
.2 I:1 .2 .5 .4 .3 .4
1.3 1.0 .7 .7 -.l .O -1.7 -1.1 -.7 .O .7 .6 .3 11 11 13 17 16 15 14 10 5 5 5 5 5 5 5 5 5 5
1.6 .4 .7 .5 1.1 .l 1.2 .O -1.9 -2.0 -2.2 .3 .3 -.2 -.2 .7 1.0 .3 1.6 1.0 1.4 1.2 .P .6 -.l .O -2.2 -1.7 -2.1 .4 .4 -.l -.l .8 1.2 .6
11 11 11 11 13 17 16 15 14 10 2 4 4 4 4 4 4 4 4 4 1.7 .4 1.5 1.5 1.1 .3 .a -.2 1.9 .O -3.3 -3.3 -4.0 .5 .2 .l .2 .6 .4 .5 1.7 .P 2.0 2.2 1.9 1.1 .6 .l .2 .o -4.3 -4.0 -4.5 -.l -.3 -.5 -.4 .l -.2 -.l
11 11 11 11 11 11 13 17 16 15 12 10 10 10 10 10 10 10 10 10 10 6.5 1.9 1.5 1.1 1.9 1.3 1.7 .7 1.4 -.l 2.8 .O .O .O .O .O .O .O .O .O .O 3.3 1.7 1.2 .9 1.7 1.3 1.9 .8 .3 -.6 -.2 .o .O .O .O .O .O .O .O .O .O
5 .6 .6
3 .4
-. 7 10 10 .O .O .O .O
maxhel: Pu 6.5 1 1 : U -4.0 2 13 maxtvs: Pu 3.3 1 1; U -4.5 2 13
____________________----------------------- _______-___--__----------------------------------------------------------------------------------
zon 11 12 13 14 15 16 17 1 2 3 4 5 6 7 he1 1.3 1.5 2.8 2.8 1.1 1.1 1.1 1.2 -.l .3 1.0 1.0 .4 .4 .l .3 -3.3 3.3 .4 .4 -.5 1.7 -.5 1.2 -.4 .a -.3 .6 tVS 1.5 1.6 -.2 .2 1.6 1.6 :.2 .5 .3 .5 .7 .7 1.1 1.1 .l .2 -4.3 4.3 -.7 . 7 -1.1 2.0 -.4 1.1 -.l .5 -.l .4 sum 7.6 .5 .3.0 4.5 4.5 4.0 3.5 34.8 1.0 .5 9.0 14.0 12.5 11.0
58
Page 62
Fig. 3.33. Discrepancies. V14. Sl. Burnup = 30 MWd/kg
1 .9 .2
1 1 1 .l .l .4
-. 1 .2 .O 1 1 1 1 1
.9 -.l .3 .O .5
.0 .O .3 .o .2 1 1 1 1 1 1 1
.6 .3 .O .O .3 .4 .S
.7 . 6 .l .l .3 .5 .4 7 1 1 1 1 1 1 1 1
.O 8 -. 3 .2 -.l -.l -.l .O .3
.4 -:2 .O .4 .l .O .O .l .l 5 6 7 1 1 1 1 1 1 1 1
-.5 -1.0 -.l .2 .O .2 -.3 -.l -.6 -.l .3 -.a .O .6 .7 .4 .4 -.l .O -.4 .2 .l
14 10 5 6 7 1 1 1 1 1 1 1 1 1.2 .O -.6 -.8 -.3 -.l -.5 .2 -.4 -.5 .o .l 1.1
-1.0 .o -.7 -.l .4 .4 -.l .5 -.I -.2 .3 .5 1.1 16 15 14 10 5 6 7 7 7 7 7 7 7 7 7 .P .2 1.4 .O -1.0 -.7 8 .4 -.5 -.l -.2 -.2 .3 -.5 .3 .3 .5 -.6 .O -1.2 .l ::1 .9 .O .4 .2 .2 ; 7 .O .6
13 17 16 15 14 10 5 6 6 6 6 6 6 6 6 6 6 1.6 .9 .7 .4 1.2 .O -1.1 -1.1 -1.1 -.4 -.3 -.l -.3 -.l -.3 .3 .5 1.3 .9 .2 .5 -1.0 .o -1.5 -.4 -.4 .3 .3 .5 .3 .5 .4 1.0 9
11 11 13 17 16 15 14 10 5 5 5 5 5 5 5 5 5 5' 5 .7 1.3 .7 .5 .a .7 1.3 .O -1.9 -1.0 -1.8 -.2 .2 .4 .5 -.l -.7 -.4 .O .l 1.0 .6 .5 .4 .7 -.a .O -2.5 -1.2 -1.2 .4 .8 1.0 1.1 .5 .o .4 .5
11 11 11 11 13 17 16 15 14 10 2 4 4 4 4 4 4 4 4 4 3 .4 1.3 .4 .9 .6 .5 .2 .O 1.4 .O -2.9 -3.3 -3.0 .3 .2 .3 .5 .2 .5 .2 1.3
-.3 1.0 ' 1 .0 .7 .6 -.3 .O -1.1 .O -4.1 -3.9 -3.5 -.2 -.3 -.2 .O -.3 .O -.2 .2 11 11 11 11 11 11 13 17 16 15 12 10 10 10 10 10 10 10 10 10 10 10 10
4.1 .8 1.9 1.3 .S 1.4 .7 .5 1.4 .6 2.5 .O .O .O .O .O' .o. .o .O .O .O .O .O .4 -.I .7 .3 .O .i3 .3 .o .4 -.l -1.5 .O .O .O .O .O .O .O .O .O .O .O .O
maxhe1: Pu 4.1 1 1: U -3.3 2 12 maxtvs : Pu -1.5 1 11 ; U -4.1 2 11
________________________________________----------------------------------------------------------------------------------------------------
zon 11 12 13 14 15 16 17 1 2 3 4 5 6 7 he1 1.0 1.2 2.5 2.5 .8 .P 1.3 1.3 .4 .4 .7 .8' .6 .6 .o .4 -2.9 2.9 1.3 1.3 -.5 1.5 -.6 1.0 -.4 .6 -.2 .4 tvs .5 .7 -1.5 1.5 .7 .8 -.P .9 .4 .5 .2 .3 .6 .6 .2 .4 -4.1 4.1 .2 .2 -1.0 1.8 -.3 1.1 .2 .5 .3 .5 sum 7.6 .5 3.0 4.5 4.5 4.0 3.5 34.8 1.0 .5 9.0 14.0 12.5 11.0
59
Page 63
Fig. 3.34. Discrepancies. V14. Sl. Burnup = 40 MWdkg
1 1.2
.0 1 1 1
.8 -.l .3
.0 .2 .l 1 1 1 1 1
.0 .O .3 -.2 .O -* 9 .3 .5 .l -.2
1 1 1 1 1 1 1 .2 -.4 5 .3 .o -.l -.l .4 .l I:2 .6 .3 .2 -.2
7 1 1 1 1 1 1 1 1
1:2 7 -. 2 5 .2 .7 -.5 -.l .3 .6 -.3 .O .o .3 -.4 .o 5 6 7' 1 1 1 1 1 1 1
.3 .3 1
-.8 -.0 -.l -.2 -.l .o -.4 -.2 -.3 -.2 .6 -1.6 .l .7 .4 .4 .4 .O .2 .2 .4 .8
14 10 5 6 7 1 1 1 1 1 1 1 1 .3 .O -.8 -.2 -.2 -.2 -.3 -.4 .l -.a .O .l .O
-2.3 .O -1.5 .6 .6 .4 .3 .l .6 -.2 .5 .0 .4 16 15 14 10 5 6 7 7 7 7 7 7 7 7 7 .0 .3 1.5 .O -.9 -1.1 -.7 .O .4 -.l .3 .2 -.7 -.7 -.3
-. 1 .O -1.2 .O -1.7 -.3 .l .0 1.1 .5 1.0 .9 .l .2 .3 13 17 16 15 14 10 5 6 6 6 6 6 6 6 6 6 6
1.0 .4 .9 -.2 1.6 .O -.7 -1.0 9 -:1
-.2 -.4 .o -.4 .4 -.3 - 4 .O .o -.2 .3 -.7 -1.0 .O -1.6 -.2 7 .4 .a .5 1.3 .7 8 .0
11 11 13 17 16 15 14 10 5 5 5' 5 5 5 5 5 5 5 5 .9 .7 .0 .l .6 -.2 1.0 .O -1.5 -1.7 -1.5 -.l -.2 .4 .6 .o -.l -.3 -.3
-.4 -.l .l -.5 .o -.7 -1.6 .O -2.3 -.9 -.7 .8 .7 1.3 1.5 1.0 .P .9 .5 11 11 11 11 13 17 16 '15 14 10 2 4 4 4 4 4 4 4 4 4 3 .9 1.0 .2 .O 4
-:2 .O .3 3
-.5 -.l -.8 -.a. -.5 -.3 I:* 1.6 .O -2.4 -2.0 -2.0 .4 1.1 1.1 1.3 .l 9 .l 1.6
-1.3 .o -3.7 -2.7 -2.6 -.2 .6 .6 .9 -.3 5 -. 2 .5 11 11 11 11 11 11 13 17 16 15 12 10 10 10 10 10 10 10 10 10 10 lo lo
4.3 1.5 1.0 .6 1.4 .4 .a 1.3 1.3 1.2 2.7 .O .O .O .O .o .o .o .o .o .o .o .o .l -.l .l -1.0 .O -.7 -.2 .4 .5 .O -1.6 .O .O .O .O .O .O .O .O .O .O .O .O
maxhel: pu 4.3 1 1: U -2.4 2 11 maxtvs: Pu -2.3 6 1; U -3.7 2 11
________________________________________--------------------------- -------------------------------------------------------------------------
son 11 12 13 14 15 16 17 1 2 3 4 5 6 7 he1 .0 1.0 2.7 2.7 7. 7 1.3 1.4 .o .5 .7 .a .3 .5 -.l .3 -2.4 2.4 1.6 1.6 .l 1.2 -.5 .9 -.4 .6 -.l .4 tVS -.a 5 -1.6 1.6
7:6 -:1 .l -1.4 1.4 -.5 .6 .O .3 -.3 .4 .3 .4 -3.7 3.7 .5 .5 -.4 1.3 -.2 1.3 .5 .6 .6 .7
sum .5 3.0. 4.5 4.5 4.0 3.5 34.8 1.0 .5 9.0 14.0 12.5 11.0
60
Page 64
Fig. 3.35. Discrepancies. V14. Sl. Burnup = 50 MWd/kg
1 .4 .2
1 1 1 .O -.4 .9 .l .l 9
1 1 1 1' 1 -.3 .l -.5 -.3 .6
.O .6 -.l .l .6 1 1 1 1 1 1 1
.3 -.2 -.l -.l .l 7 .5
.7 .4 .4 .3 .6 ::2 .6 7 1 1 1 1 1 1 1 1
.4 -.3 -.6 -.5 .3 -.l .o -.2 .2 1.0 .5 .O .l .8 .4 .5 .4 .4
5 6 7 1 1 1 1 1 1 1 1 -.2 -.6 -1.0 -.6 -.l -.5 .3 .5 .4 .3 1.1
-1.4 .3 -.l .l .5 .l .9 1.1 1.1 1.0 1.4 14 10 5 6 7 1 1 1 1 1 1 1 1
1.3 .O -.6 -.9 -.3 .3 .2 -.2 -.2 .o -.3 .2 .5 -1.7 .O -1.8 -.2 .5 1.1 .9 .5 .5 .7 .5 1.1 1.1
16 15 14 10 5 6 7 7 7 7 7 7 7 7 .3 .O 1.2 .o -.3 -.9 -.5 -1.0 -.3 .o -.3 1 -.6 1
-.5 -.7 -1.6 .O -1.5 -.2 .4 -.l .5 .P .6 1 0 .4 ;:l 1 13 17 16 15 14 10 5 6 6 6 6 6 6 6 6 6
-.2 .4 .6 -.3 1.1 .O -1.0 -.9 -.9 .O 3 .l .3 1 2 -.3 -1.4 -.4 -.l -1.1 -1.7 .o -2.2 -.l 1
5' 5 1.0 1 3 1.2 1.4 20 Lo 1.1
11 11 13 17 16 15 14 10 5 5 5 5 5 5 5 2.1 .5 .5 .3 .l -.3 1.5 .o -1.1 -2.0 -.6 .O .2 .2 - 1 -.2 .3
.4 -.7 -.5 -.6 -.5 -1.1 -1.3 .O -2.2 -1.2 .3 1.0 1.2 1.3 1 1 .9 1.5 1 11 11 11 11 13 17 16 15 14 10 2 4 4 4 4 4 .4 4 4
1.3 1.5 .9 .2 .2 -.3 .l -.2 .7 .o -1.0 -1.6 -1.3 5 .3 .4 .7 .4 .7 -.6 .O -.5 -1.0 -.a -1.1 -.4 -.P -2.2 .O -3.5 -2.4 -2.0 -.2 -.3 -.2 .l -.l .2 -.l -.8
11 11 11 11 11 11 13 17 16 15 12 10 10 10 10 10 10 10 10 10 10 10 10 2.5 1.2 .8 .P 1.3 1.0 .g .o .3 .a 1.5 .o .o .o .o .o .o .o .o .o .o .o .o
-1.0 -.8 -1.3 -1.1 -.5 -.6 -.4 -1.0 -.5 -.7 -2.0 .O .O .O .o .o .O .O .o .o .o .O .O
7 8 6
6 .7
1.8 5 5 3 .3 6 1.2
4 3 .3 .5
maxhel: Pu 2.5 1 1 ; U -2.0 3 10 maxtvs: Pu -2.0 1 11 ; U -3.5 2 11
____________________----------------------------------------------- -------------------------------------------------------------------------
SO" 11 12 13 14 15 16 17 1 2 3 4 5 6 7 he1 1.0 1.1 1.5 1.5 .3 .5 1.1 1.2 -.l .4 .3 .3 .l .3 .o .4 -1.8 1.8 .5 .5 .O .8 -.3 .7 -.3 .6 -.3 .5 tvs -.6 . 7 -2.0 2.8 -.7 .a -1.7 1.7 -.9 .9 -.4 .4 -.7 .8 .5 .7 -3.5 3.5 -.0 .8 -.5 1.0 .O 1.5 .7 .P .6 .7 sum 7.6 .5 3.0 4.5 4.5 4.0 3.5 34.8 1.0 .5 9.0 14.0 12.5 11.0
61 '
Page 65
Fig. 3.36. Discrepancies. V14. Sl. Burnup = 60 MWdlkg
1 1.6 1.3
1 1 1 .l .5 1.1 .4 1.1 1.2
1 1 1 1 1 .l -.4 .2 -.3 .9 .5 .2 .7 .3 1.1
1 1 1 1 1 1 1 -.2 -.3 .I .l -.l -.3 .7
.3 .4 .6 .7 .5 .4 .9 7 1 1 1 1 1 1 1 1
-. 2 -.6 -.3 .l .2 .l -.2 .l .4 .4 .2 .3 .0 .8 .7 .4 .P .8
5 6 7 1 1 1 1 1 1 1 1 .8 -.6 -.l -.4 -.9 -.4 .3 -.4 -.7 -.l .7
-1.0 .2 .7 .4 -.l .3 1.0 .3 .l .a 1.2 14 10 5 6 7 1 1 1 1 1 1 1 1
1.6 .O .3 -.5 .2 -.6 -.3 .3 -.4 -.3 .2 1 -1.3 .O -1.4 .l 1.0 .3 .5 1.1 .4 .6 1.2 ;:O
-. 1 .6
16 15 14 10 5 6 7 7 7 7 7 7 7 7 7 .0 1 1.5 .O -.5 -.3 -1.1 -.6 .4 .4 .l -.l -.4
-.l I:* -1.2 .o -2.1 .4 -.l .4 1.4 1.4 1.1 .9 .7 .O .2
1.3 1.1 13 17 16 15 14 19 5 6 6 6 6 6 6 6 6 6 6 .l -.6 .2 -.2 1.5 .o -.7 -.5 -1.0 .2 -.5 -.7 -.5 -.4 3
-1.2 -1.4 -.4 -1.0 -1.2 .o -2.3 .2 .O 1.3 .6 .4 .7 .8 Lo -1.3 -.7
.2 .4 11 11 13 17 16 15 14 10 5 5 5 5 5 5 5 5 5 5 5 .5 -.5 -.3 -.2 .l 4 1.1 .O -.5 -.8 -.a -.l -.3 -.6 .2 1
-1.2 -1.7 -1.4 -1.0 -.5 A:2 -1.6 .O -2.0 .o .l .9 .8 .5 1.4 Cl 1 -.6 .l
;:2 .8 1.0 11 11 11 11 13 17 16 15 14 10 2 4 4 4 4 4 4 4 4 4 3 .6 -.8 .4 .5 -.6 -.6 3 -.3 1.3 .O -1.0 -1.2 -1.3 .9 .o .7 .l .6
-1.2 -2.3 -1.1 -.8 -1.6 -1.3 I:8 -1.1 -1.5 .o -3.1 -2.3 -2.1 -.l -.9 -.2 -.7 -.l .O .l -.4
-.6 -.4 -1.9 11 11 11 11 11 11 13 17 16 15 12 10 10 10 10 10 10 10 10 10 10 10 10
1.2 7 1.3 1.1 .4 .7 -.6 .6 .7 1.4 2.2 .o .o .O .O .O :0 .O .O .O .O 'i 0 .O -2.0 -1:2 -.8 -1.0 -1.4 -.8 -1.9 -.5 -.l .o -2.0 .O .O .O .O .O .O .O .O .O .O .O .O
maxhel: Pu 2.2 1 11 ; U 1.6 12 1 maxtvs: Pu -2.8 1 1: U -3.1 2 11
__-_________________----------------------------------- -----------------------------------------------------------------------------------~~
ton 11 12 13 14 15 16 17 1 2 3 4 5 6 7 he1 .3 .7 2.2 2.2 -.4 .4 1.4 1.4 -.l .5 .2 .4 -.3 .5 -.l .4 -1.0 1.0 -.4 .4 .o .7 -.3 .5 -.5 .6 -.l .4 tvs -1.3 1.4 -2.0 2.0 -1.5 1.5 -1.4 1.4 -.P .9 -.4 . 5 -1.1 1.2 .6 .7 -3.1 3.1 -1.9 1.9 -.a 1.1 -.l 1.3 .5 .6 .P'.l.O sum 7.6 .5 3.0 4.5 4.5 4.0 3.5 34.8 1.0 -5 9.0 14.0 12.5 11.0
62
Page 66
3.5. The Statistical Error Estimate on Power Distribution Calculation by CONKEMO Code
Figs. 3.37 and 3.38 present discrepancy of power distributions in Variants 13 and
14 at the beginning of burnup obtained by the TVS-M and CONKEM. codes. Two
discrepancies are given for every calculational points: when power distribution is
normalized to the average value over (1) the whole calculated region and (2) each
isolated zone. The figures also give arithmetic mean and root-mean-square deviations in
the zones for distributions normalized to the whole calculated region (tvso) and to the
isolated zone (tvs).
Statistical error using the CONKEMO complex occurs due to the KEN0 code
based on Monte Carlo method for neutron flux calculations. Statistical error is absent
in the TVS-M code calculations. Because of this, the discrepancies between the TVS-M
and KEN0 calculations comprise statistical error of the KEN0 calculations and bias
error. A bias error can be reduced by distribution normalization to the own average
values over the separated zones. Shift of one distribution in each zone with relation to
another one is excluded in so doing. However, the discrepancies related with different
space dependences of the distributions within the zones and statistical error still remain.
Thus, root-mean-square deviations (tvs) in the zones with rather large points may be
considered as upper estimate of statistical error.
The Figs. 3.37 and 3.38 show that in both variants the root-mean- square
deviations in the zones (tvs) do not exceed 0.6 ‘1’0. From the above, it follows that this
value is an upper estimate of statistical error in pin-by-pin power distribution using the
KEN0 code calculations with about 7.106 histories involved.
63
Page 67
Fig. 3.37. Discrepancies. V13. Sl. Burnup = 0 MWd&g
On normalization to mean value: l over the whole calculated region l over the calculated zone
I. 1 .4
1 1.1
.4
1 1 1 .6 .7 .7
-. 1 .O .O
1 1 1 1 1 1.1 .7 .a .9 .9
.4 .O .l .2 .2
1 1 1 1 1 1 1
.7 .6 .9 .7 .3 1.0 1.2
.o -.l .2 .O -.4 .3 .5
7 1 1 1 1 1 1 1 1 -.3 .2 .e .5 .8 .6 .8 .9 .9 -. -. 9 5 .l -.2 .l -.l :l .2 .2
5 6 7 1 1 1 1 1 1 1 1 .2 .l .4 .6 1.0 .5 .6 .7 .6 .5 .8
-.6 -.5 -.2 -.l .3 -.2 -.l .o -.l -.2 .l
15 10 5 6 7 1 1 1 1 1 1 1 1 -.9 .O .3 .l .2 .l .5 .8 .7 .3 .6 .7 .6
.e .o -.5 -.5 -.4 -.6 -.2 .l .o -.4 -.l .O -.l
17 16 15 10 5 6 7 1 1 1 1 1 1 1 1 -1.8 -2.1 -1.4 .o .l .3 .3 .6 .7 .5 .9 .6 .e .5 .4
.4 .4 .3 .o -.7 -.3 -.3 -.l .o -.2 .2 -.l .l -.2 -.3
11 11 17 16 15 10 5 6 7 7 7 7 7 7 7 7 7 -2.0 -2.4 -2.3 -2.6 -1.8 .O -.3 ' .o .6 .7 .e .6 .9 .5 .9 .9 .e
.4 .O .O -.l -.l .O -1.1 -.6 .O .l .2 .O .3 -.l .3 .3 .3
11 11 11 11 17 16 15 10 5 6 6 6 6 6 6 6 6 6 6 -2.3 -2.9 -2.4 -2.2 -2.1 -2.6 71. 8 .O -.l .6 .8 .7 .9 .e .7 .9 1.3 .9 .7
.l -.5 .O .2 .l -.l -.l .O -.9 -.l .l .O .3 .2 .O .3 .7 .3 .l
11 11 11 11 11 11 17 16 15 lo 4 5 5 5 5 5 5 5 5 5 4 -2.1 -2.6 -2.2 -2.4 -2.4 -2.3 -2.6 -2.8 -2.0 .O 1.0 1.5 1.3 1.5 1.2 .7. 1.2 .4 1.0 .s 1.1
.3 -.2 .2 .O .o .l -.3 -.3 -,.4 .O .O .7 .6 .7 .5 -.l .5 -.3 .3 .2 .O
11 11 11 11 11 11 11 11 '17 16 14 10 10 10 10 10 10 10 10 10 10 10 lo -2.6 -2.6 -2.5 -2.2 -2.2 -2.3 -2.5 -2.8 -2.3 -2.4 '-1.4 .O .O .O .O .O .o .o .O .O .O .O .O
-. -. 2 2 -.l .2 .2 .l -.l -.4 .O .l .O .O .O .O .O .O .O .o .O .O .O .O .O
maxtvso: Pu -2.9 3 2; U 1.5 2 14 maxtvs : Pu .B 6 1; U -1.1 4 7 -__-__-__--__-__----____________L_r ______________--___--------------------------------------------------------------------------------------
zon 11 12 13 14 15 16 17 1 2 3 4 5 6 7 tvs0 -2.4 2.42 .O .oo ..o .oo-1.4 1.42-1.6 1.66-2.5 2.53-2.3 2.27 .7 .70 .O .oo .o .OO 1.1 1.06 .7 .95 .6 .73 .6 .64
tvs .O .21 .o .oo .o .oo .o .OO .O .36 .O .26 ,.O .23 .O .22 .O .oo .o .oo .o .02 .O .60 .O .37 .O .29 sum 14.083 .ooo .ooo .500 4.500 4.500 4.000 42.250 .ooo .ooo 1.500 13.500 13.5
64
Page 68
000 .
.
NC
XlO
I w
orn B
A-IV
-IW
. .
. .
I I
I m
nm
. .
WI-S
W *
. I
I
v)Wd
. .
I l-l
-9-w
-@i
. I
Page 69
3.6. Calculation Results Obtained by the TRIANG-PWR Code
Tlie purpose of calculations by the TRIANG-PWR code is to choose the
calculational model of given multiassembly structure for using it in the following pin-
by-pin power distribution calculations in reactor. Using the few-groups approach
realized now in the TRIANG code, the macroconstant preparation during burnup is
needed. As noted in section 2, this preparation is. made with the use of the
WIMS-ABBN calculations and the following approximation of macroscopic cross-
sections as a function of variables that describe the reactor state.
When preparatin g the constants for pin-by-pin calculation it is important to
. choose an adequate model of fuel cell or supercell (fuel cell and its surroundings). To do
this requires to keep the neutron spectrum in fuel and, hence, the behaviour of nuclide
composition during burnup. This problem was working out with the use of the
CONKEMO calculation results as the benchmarks. In so doing, the calculational
region was devided into zones with the same spectrum for every point. Each zone was
modelled by the own supercell.
Table 3.5 presents the calculation results of Keu during burnup for Variants 13 and
14 obtained by the TRIANG as compared with similar results obtained by the
CONKEMO complex.
: Table 3.5 Dependence of & value on the burnup
obtained by the TRIANG atid CONKEMO codes at state S 1
0 I .0553 1.0554 1.2589 1.2646 10 0.9629 0.9630 1.1529 1.1553 20 0.895 1 0.8950 1.0717 1.0764 30 0.8392 0.8407 1.0068 1.0072 30 0.790 1 0.7913 0.9499 0.9468 50 0.7473 0.7488 0.8996 0.8940 60 0.7111 0.7118 0.8562 0.8483
It is seen from Table 3.5, that Ksjy values obtained by the TRIANG-PWR code are
in reasonably good agreement with those obtained by the CONKEMO code.
66
Page 70
Table 3.6 shows the maximum discrepancies in power distributions obtained by
the TRIANG and CONKEMO codes.
Variant 13
0 2.9 -2.2 10 4.6 -3.5 20 3.9 -2.0 30 3.7 -2.3 40 3.6 -1.9 50 2.6 -2.0
Table 3.6 Maximum discrepancies
in pin-by-pin power distributions
Variant 14
60 4.1 -2.2
2.8 -1.6 3.3 -2.0 4.5 -3.7 3.6 3.8 4.0 4.6 2.9 3.6 _I 1 I)_
Figs. 3.39 and 3.41 demonstrate the calculational power distributions obtained by
the TRIANG and CONKEMO codes for Variant 13 at 0 and 60 MWd/kg burnups.
Figs. 3.40 and 3.42 present discrepancies in power distributions. Similar information for.
Variant 14 is given on Figs. 3.43e3.46.
From the results presented in Table 3.6 it is seen that maximum discrepancy in
power distributions calculated with the use of the TRIANG code and’the benchmark
CONKEMO code in Variants 13 and 14 does not exceed 5 O o for all burnup steps. By
this is meant that the approximation burnup model used in the WIMS-ABBN and the
TRIANG-PWR codes is adequate, and it is possible to use this model for calculation of
pin-by-pin power distribution in MOX-fuelled core of VVER reactors.
67
Page 71
Fig. 3.39. Power distribution. V13. Sl. Burnup = 0 MWd/kg
CONKEiMO .995 TRIANG 1.003
995 1:003
.990 .991 .991 1.001 1.002 1.003
.996 .991 .992 .994 .994
.996 . 999 1.001 1.002 1.003
.992 .991 .994 .992 ,989 .996 .999
.907 .992 .996 . 999 1.001 1.003 1.003
.977 ,906 .993 .991 .995 .993 .996 .998 1.000 ,975 .981 .988 .993 . 997 1.000 1.002 1.004 1.004
,967 ,974 .905 .992 .998 .994 .996 ,990 .999 . 999 1.005 .955 .968 .976 .902 .990 .995 .999 1.002 1.004 1.006 1.007
1.174 .OOO .969 .977 ,987 .991 .998 1.003 1.004 1.001 1.006 1.010 1.013 1.158 .OOO .956 .970 .979 .986 . 994 1.000 1.004 1.007 1.009 1.010 1.012
.884 . 962 1.170 .ooo .973 .9e5 . 995 1.005 1.010 1.010 1.016 1.015 1.020 1.021 1.028
.a93 .984 1.159 .OOO .961 .976 .986 . 998 1.006 1.012 1.016 1.019 1.021 1.023 1.026
.830 .a45 .881 .960 1.173 .OOO .980 . 995 1.013 1.022 1.028 1.029 1.035 1.033 1.041 1.048 1.060
.825 .a45 .a94 .987 1.166 . 000 .970 .987 1.006 1.020 1.029 1.035 1.039 1.041 1.043 1.046 1.051
.815 .815 .828 .848 .887 . 968 1.189 .OOO 1.003 1.025 1.043 1.053 1.062 1.064 1.066 1.072 1.0132 1.087 1.104
.a14 .818 .826 .047 .89B . 995 1.181 ,000 . 987 1.020 1.043 1.057 1.06f 1.073.1.077 1.079 1.082 1.085 1.093
.813 .811 .817 .a20 .a31 .852 .893 . 986 1.222 .OOO 1.055 1.092 1.112 1.126 1.129 1.128 1.138 l.i34 1.148 1.159 1.188
.811 .812 .a14 .819 .828 .852 . 908 1.014 1.215 .OOO 1.032 1.071 1.097 1.113 1.123 1.129 1.132 1.135 1.138 1.142 1.168
.808 .808 .810 .815 .818 .825 .836 .861 . 922 1.044 1.336 .ooo .ooo .ooo .ooo . 000 .ooo .ooo .ooo .ooo .ooo .ooo .ooo
.a10 .810 .a11 .813 .816 .a22 .a34 .B65 .934.1.063 1.313 . 000 .ooo . 000 . 000 . 000 . 000 .ooo . 000 . 000 . 000 . 000 . 000
68
Page 72
Fig. 3.40. Discrepancies. V13. Sl. Burnup = 0 MWd/kg
1 .e
1 1 1
1.1 1.1 1.2
1 1 1 1 1 .O .e .9 .e .9
1 1 1 1 1 1 1 -. 5 .l .2 .7 1.5 .7 .4
7 1 1 1 1 1 1 1 1 -.2 -.5 -.5 .2 .2 .7 .6 .6 .4
5 6 7 1 1 1 1 1 1 1 1 -1.2 -.6 -.9 -1.0 -.8 .l .3 .4 .5 .7 .2
15 10 5 6 7 1 1 1 1 1 1 1 1 -1.3 .O -1.3 -.7 -.8 -.5 -.4 -.3 .O .6 .3 .O -.l
17 16 15 10 5 6 7 1 1 1 1 1 1 1 1 1.0 2.3 -.9 .O -1.2 -.9 -.9 -.7 -.4 .2 .O .4 .l .2 -.2
11 11 17 16 15 10 5 6 7 7 7 7 7 7 7 7 7 -.6 .o 1.5 2.8 -.6 .O -1.0 -.8 -.7 -.2 .1 .6 .4 .e .2 -.2 -.e
11 11 11 11 17 16 15 10 5 6 6 6 6 6 6 6 6 6 6 -.2 .3 -.3 -.l 1.2 2.6 -.6 .O -1.6 -.5 .o .4 .5 .9 1.1 .7 .O -.2 -1.0
11 11 11 11 11 11 17 16 15 10 4 5 5 5 5 5 5 5 5 5 4 -.3 .l -.4 -.2 -.4 .o 1.7 2.9 -.6 .O -2.2 -1.9 -1.3 -1.1 -.5 .l -.5 .l -.8 -1.4 -1.6
11 11 11 11 11 11 11 11 17 16 14 10 10 10 10 10 10 10 10 10 10 '10 10 .2 .2 .1 -.3 -.3 -.4 -.3 .4 1.3 1.8 -1.7 .o .O .O .O .O .o .o .O .O .O .O .O
maxerr : Pu 2.9 2 8 ; u -2.2 2 11 __________________-_------------------------------ ____-____-__--___-______________________--------------------------------------------------
2or-l 11 12 13 14 15 16 17 1 2 3 4 5 6 7 err -.l .3 .o .o .o .o -1.7 1.7 -.a . 8 2.6 2.6. 1.4 1.4 .2 .6 .O .O .O .o -2.0 2.0 -1.0 1.1 .o .7 -.2 6 S"lll 14.1 .O .O .5 4.5 4.5 4.0 42.3 .O .O 1.5 13.5 13.5 12:o
69
Page 73
Fig. 3.41. Power distribution. V13. Sl. Burnup = 60 MWd/kg
CONKEMO .986 TFUANG .907
.986
.987
.986 .990 .986
.907 .987 .987
.990 .992 .994 .990 -:990
.988 .907 .907 . 987 .907
1.001 .994 .993 .992 .996 .987 .907 .994 .990 .900 .908 .988 .988 .988
1.012 1.000 1.003 .992 .991 .992 .992 .991 .994 1.007 1.002 .994 .991 .990 .989 .989 .989 .989
1.052 1.024 1.010 1.005 1.000 .994 .992 .995 .997 994 .998 1.029 1.011 1.008 1.004 .997 .994 .993 .992 .992 :993 . 994
,991 ,000 1.052 1.022 1.010 1.010 .998 .992 .997 .997 .992 1.005 .995 .956 .ooo 1.030 1.013 1.011 1.009 1.003 1.001 1.000 1.000 1.000 1.001 1.003
.974 .974 .9BB .OOO 1.054 1.021 1.019 1.006 1.001 .997 .995 .999 .99B 1.002 1.006
.965 .962 .957 .ooo 1.033 1.018 1.019 1.009 1.005 1.004 1.003 1.003 1.003 1.005 1.009
.955 .960 .960 .974 .907 .OOO 1.055 1.021 1.014 1.007 1.008 1.007 1.006 1.006 1.006 1.007 1.006
.994 .973 .966 .964 .959 .OOO 1.038 1.027 1.013 1.007 1.004 1.003 1.003 1.003 1.004 1.006 1.013
.955 .956 .$63 .973 .974 .979 ,983 .OOO 1.060 1.021 1.020 1.022 1.016 1.011 1.007 1.013 1.011 1.015 1.023
.974 .981 .995 .975 .969 .968 .963 .OOO 1.048 1.027 1.019 1.015 1.014 1.014 1.013 1.014 1.015 1.018 1.027
.956 .958 .958 .954 .964 ,972 .977 .975 .907 .OOO 1.060 1.039 1.041 1.036 1.037 1.036 1.031 1.030 1.031 1.039 1.043
.969 .971 .974 .902 .999 .981 .976 ,975 .970 .OOO 1.046 1.038 1.035 1.033 1.032 1.032 1.032 1.033 1.034 1.038 1.054
.976 .952 .956 .959 .957 .955 .970 .982 .979 .980 .983 .ooo .ooo .ooo . 000 .ooo .ooo .ooo .ooo .ooo .ooo .ooo .ooo
.968 .969 .969 .972 .977 . 987 1.008 .994 .991 .990 .984 .ooo .ooo .ooo .ooo . 000 .ooo .ooo .ooo .ooo .ooo .ooo .ooo
70 .
Page 74
Fig. 3.42. Discrepancies. V13. Sl. Burnup = 60 MWd/kg
1 .l
1 1 1
.l -. 3 .l
1 1 1 1 1 -1.0 -.5 -.7 -.3 -.3
1 1 1 1 1 1 1 -. 7 -. 4 -.5 -.4 -.8 .l .l
7 1 1 1 1 1 1 1 1 -.5 .2 -.9 -.l -.l -.3 -.3 -.2 -.5
5 6 7 1 1 1 1 1 1 1 1 -2.2 -1.2 -.2 -.l -.3 .O .l -.3 -.5 -.l -.4
15 10 5 6 7 1 1 1 1 1 1 1 1 -3.5 .o -2.1 -.9 .l -.l .5 .9 .3 .3 .8 -.4 .8
17 16 15 10 5 6 7 1 1 1 1 1 1 1 1 -.9 -1.2 -3.1 .o -2.0 -.3 .O .3 .4 .7 .8 .4 .5 .3 .3
11 11 17 16 15 10 5 6 7 7 7 7 7 7 7 7 7 4.1 .5 -.2 -1.0 -2.8 .o -1.6 .6 -.l .O -.4 -.4 -.3 -.3 -.2 -.l .7
11 11 11 11 17 16 15 10 5 6 6 6 6 6 6 6 6 6 6 2.0 2.6 3.3 .2 -.5 -1.1 -2.0 .o -1.1 .6 -.l -.7 -.2 .3 .6 .l .4 .3 .4
11 11 11 11 11 11 17 16 15 10 4 5 5 5 5 5 5 5 5 5 4 1.4 1.4 1.7 3.0 3.7 .9 -.l .O -1.7 .o -1.3 -.l -.6 -.3 -.5 -.4 .l .3 .3 -.l 1.1
11 11 11 11 11 11 11 11 17 16 14 10 10 10 10 10 10' 10 10 lo 10 io 10 -.8 1.8 1.4 1.4 2.1 3.4 3.9 1.2 1.2 1.0 .l .o .o .O .O .O .O .O .O .O .O .O .O .
maxerr : Pu 4.1 4 1 ; U -2.2 7 1 _______--______-____--------------------- ______________-___-_-------------------------------------------------------------------------------
zon 11 12 13 14 15 16 17 1 2 3 4 5 6 7 err 2.0 2.3 .O .O .O .O .1 .l -2.5 2.6 -.6 1.0. -.l .6 .O .5 .O .O .O .O -.5 1.2 -.7 1.1 .O .6 -.l .3 sum 14.1 .O .O .5 4.5 4.5 4.0 42.3 .O .O 1.5 13.5 13.5 12.0
71
Page 75
Fig. 3.43. Power distribution. V14. Sl. Burnup = 0 MWd/kg
CONKEMO .996 TRIANG .987
.996
.987
.998 .996 .999
.986 .987 .987
.992 .994 .995 .992 '.996
.985 .986 .987 .987 .988
.997 .992 .992 .994 .994 .998 .996
.983 .985 .986 .987 .988 .989 .990
.995 .993 ,998 .994 .996 .995 .995 1.002 1.000
.984 . 983 .984 .986 .988 .989 .990 .992 .993
: 999 999 .993 .991 .994 .986 .998 .985 .996 .987 .995 .989 .998 .991 .996 .993 .PPP .994 1.004 .996 1.013 .999
.904 .ooo 1.004 .997 . 997 1.002 1.004 1.001 1.004 1.006 1.009 1.012 1.023
.917 . 000 1.001 .995 .990 .990 .993 .995 .997 .PPP 1.002 1.004 1.008
1.031 .832 .913 .OOO 1.010 1.005 1.010 1.012 1.015 1.012 1.015 1.017 1.023 1.028 1.042 1.050 .849 . 919 .ooo 1.008 1.002 . 999 1.003 1.006 1.009 1.011 1.014 1.016 1.020 1.026
.863 . 913 1.034 .835 ..913 -000 1.024 1.019 1.021 1.026 1.027 1.032 1.038 1.038 1.043 1.051 1.062
.882 . 926 1.052 .854 .927 .OOO 1.021 1.017 1.023 1.027 1.031 1.034 1.037 1.040 1.044 1.050 1.060
.844 .a47 .867 . 921 1.045 .847 ,934 .OOO 1.047 1.046 1.054 1.063 1.061 1.063 1.068 1.075 1.082 1.089 1.110
.a49 .857 .883 . 930 1.061 .865 .944 .OOO 1.044 1.055 1.062 1.068 1.072 1.075 1.079 1.083 1.089 1.099 1.116
.839 .839 .841 .854 .878 .924 1.063 .868 .964 .OOO 1.092 1.110 1.125 1.128 1.128 1.134 1.135 1.144 1.147 1.161 1.193
.843 .845 .850 .a59 .889 . 941 1.084 .892 .976 .OOO 1.100 1.105 1.113 1.118 1.123 1.127 1.131 1.138 1.148 1.165 1.193
.840 .840 .834 .a33 .841 .855 .897 .960 1.134 .937 1.043 .ooo .ooo .ooo .ooo .ooo .ooo .ooo .ooo .ooo .ooo .ooo .ooo
.842 .842 .843 .846 .853 .865 .903 .972 1.149, .956 1.054 .OOO .ooo .ooo .ooo .ooo .ooo .ooo .ooo .ooo .ooo .ooo .ooo
72
Page 76
Fig. 3.44. Discrepancies. V14. Sl. Burnup = 0 MWd/kg
1 -. 9
1 1 1 -1.2 -.9 -1.2
1 1 1 1 1 -. -. 7 8 -.8 -.5 -.8
1 1 1 1 1 1 1 -1.4 -.7 -.6 -.7 -.6 -.9 -.6
7 1 1 1 1 1 1 1 1 -1.1 -1.0 -1.4 -.8 -.8 -.6 -.5 -1.0 -.7
5 6 7 1 1 1 1 1 1 1 1 .O -.2 -.8 -1.3 -.P -.6 -.7 -.3 -.5 -.8 -1.4
14 10 5 6 7 1 1 1 1 1 1 1 1 1.4 .o -.3 -.2 -.7 -1.2 -1.1 -.6 -.7 -.7 -.7 -.8 -1.5
16 15 14 10 5 6 7 7 7 7 7 7 7 7 7 1.8 2.1 .6 .O -.2 -.3 -1.1 -.9 -.9 -.3 -.4 -.3 -.7 -.8 -1.6
13 17 16 15 14 10 5 6 6 6 6 6 6 6 6 6 6 2.3 1.4 1.7 2.3 1.5 .o -.3 -.2 .2 .l .4 .2 -.l .2 .l -.l -.2
11 11 13 17 16 15 14 10 5 5 5 5 5 5 5 5 5 5 5 .6 1.2 1.9 .9 1.5 2.2 1.0 .O -.3 .8 .7 .4 1.0 1.1 1.0 .7 .6 .9 .5
11 11 11 11 13 17 16 15 14 10 2 4 4 4 4 4 4 4 4 4 3 .5 .8 1.1 .6 1.3 1.8 2.0 2.8 1.2 .O .7 -.5 -1.1 -.P -.5 -.6 -.4 -.5 .l .3 .O
11 11 11 11 11 11 13 17 16 15 12 10 10 10 10 10 10 10 10 10 lo lo lo .3 .3 1.1 1.6 1.5 1.2 .7 1.2 1.3 2.0 1.0 .o .O .O .O .O .o .o .O .O .O .o .o
maxerr: Pu 2.8 2 8; U -1.6 5 15 ___________-_______------------------------ ___-___--_------____-----------------------------------------------------------------------------
son 11 12 13 14 15 16 17 1 2 3 4 5 6 7 err .9 1.0 1.0 1.0 1.6 1.6 1.1 1.2 2.3 2.3 1.7 1.7 1.3 1.4 -.9 .9 .7 .7 .o .o -.4 .6 .5 .7 .O .2 -.8 .8 sum 7.6 .5 3.0 4.5 4.5 4.0 3.5 34.8 1.0 .5 9.0 14.0 12.5 11.0
73
Page 77
Fig. 3.45. Power distribution. V14. Sl. Burnup = 60 MWd/kg
CONKEMO .964 TRIANG .965
.964
.965
.974 .966 .965
.967 .966 .966
.976 .977 971 .975 .967
.970 .968 1967 .966 .966
.985 .980 .975 .973 .974 .975 .970
.981 .974 .971 .969 .968 .968 .968
.999 .992 985 .977 .974 .974 .976 .972 .974 1.000 . 992 :981 . 976 .973 .971 .970 .970 .971
1.037 1.012 .996 .991 .991 .903 .974 .980 .982 .976 .973 1.030 1.009 1.001 .994 .984 .979 .977 ,976 .975 .976 .978
,926 .OOO 1.042 1.013 .994 .994 .907 .978 .903 .981 .975 .978 .984 .903 .ooo 1.031 1.011 1.005 1.000 .991 .987 .985 .984 .984 .986 .PPO
1.051 .932 .926 .OOO 1.050 1.012 1.007 .996 .902 .979 .981 .982 .985 .901 .985 1.024 .904 .905 .ooo 1.035 1.017 1.014 1.001 .994 .PPl .989 .989 .PPO .993 1.000
1.066 1.073 1.055 .935 .627 .OOO 1.052 1.015 1.009 .991 .995 .995 .991 .990 909 .999 1.000 1.052 1.052 1.025 .900 .PlO .ooo 1.044 1.030 1.011 1.001 .996 .993 ,992 .993 1995 1.000 1.010
1.050 1.063 1.069 1.071 1.057 .938 .933 .OOo 1.050 1.020 1.012 1.000 .999 1.000 .991 994 . 994 1.000 1.001 1.044 1.060 1.054 1.056 1.030 .916 .920 . 000 1.059 1.032 1.018 1.011 1.007 1.005 1.005 1:006 1.010 1.018 1.033
1.042 1.056 1.050 1.055 1.074 1.076 1.660 .939 .934 .OOO 1.062 1.046 1.040 1.015 1.021 1.013 1.018 1.013 1.019 1.019 1.036 1.033 1.037 1.046 1.064 1.061 1.065 1.039 .931 ..939 .OOO 1.062 1.042 1.032 1.026 1.023 1.022 1.023 1.026 1.033 1.045 1.066
1.057 1.041 1.038 1.044 1.057 1.061 1.081 1.067 1.046 .930 .942 .ooo .ooo .ooo .ooo .ooo .ooo .ooo .ooo .ooo .ooo .ooo .ooo 1.031 1.032 1.034 1.039 1.051 1.074 1.076 1.085 1.054 .959 ,923 . 000 .ooo ,000 .ooo .ooo .ooo .ooo .ooo .ooo .ooo .ooo .ooo
74
Page 78
Fig. 3.46. Discrepancies. V14. S1. Burnup = 60 MWdkg
1 .l
1 1 1 -.7 .O .l
1 1 1 1 1 -. 6 -. 9 -.4 -.P -.l
1 1 1 1 1 1 1 -.4 -.6 -.4 -.4 -.6 -.7 -.2
7 1 1 1 1 1 1 1 1 .l .o -.4 -.l -.l -.3 -.6 -.2 -.3
5 6 7 1 1 1 1 1 1 1 1 -. 7 -.3 .5 .3 -.7 -.4 .3 -.4 -.7 .O .5
14 10 5 6 7 1 1 1 1 1 1 1 1 -2.5 .O -1.1 -.2 1.1 .b .4 .9 .2 .3 .9 .0 .6
16 15 14 10 5 6 7 7 7 7 7 7 7 7 7 -2.6 -3.0 -2.3 .O -1.4 .5 .7 .5 1.2 1.2 .8 .7 .5 1.2 1.5
13 17 16 15 14 10 5 6 6 6 6 6 6 6 6 6 6 -1.3 -2.0 -2.9 -2.9 -1.8 .O -.8 1.5 .2 1.0 .l -.2 .l .3 .6 .l 1.0
11 11 13 17 16 15 14 10 5 5 5 5 5 5 5 5 5 5 5 -.6 -.3 -1.4 -1.4 -2.6 -2.4 -1.4 .O .8 1.2 .6 1.1 .8 .5 1.4 1.2 1.6 1.8 3.2
11 11 11 11 13 17 16 15 14 10 2 4 4 4 4 4 4 4 4 4 3 -.P -1.8 -.4 .8 -1.2 -1.0 -2.0 -.P .5 .O .o -.4 -.0 1.1 .2 .9 .5 1.3 1.4 2.5 2.9
11 11 11 11 11 11 13 17 16 15 12 10 10 10 10 10 10. 10 10 10 10 10 lo -2.5 -.9 -.4 -.5 -.6 1.2 -.5 1.7 .8 3.1 -2.0 .o .o .O .O .O .o .o .O .O .O .O .O
nlaxecr: Pu 3.1 1 10;' u 3.2 3 19 ________________________________________----------------------------------------------------------------------------------------------------
zon 11 12 13 14 15 16 17 1 2 3 4 5 6 7 err -.4 . g -2.0 2.0 -1.2 1.2 -1.4 1.8 -1.7 2.5 -2.1 2.4 -1.0 1.5 -.l 5
3418 .o .o 2.9 2.9 .7 1.2 .6 1.3 .3 .6 .8 .9
sum 7.6 .5 3.0 4.5 4.5 4.0 3.5 1.0 .5 9.0 14.0 12.5 11.0
7s
Page 79
CONCLUSION
The consideration of calculation results for multi-assembly structures (nonzonned
and zonned MOX fuel assemblies surrounded by fuel assemblies with UOZ fuel) allows
us to make the following conclusion:
1. The Ktfl values at the beginning of burnup at operation and cold states obtained by
MCU, CONKEMO, TVS-M and HELIOS codes are in a good agreement. The
maximum discrepancies of corresponding values do not exceed 0.5 00.
Burnup reactivity shift and reactivity shift caused by fuel and moderator
temperature change from operation state to cold one are in a good agreement as well.
Maximum discrepancies of results are 6 O,b for burnup reactivity shift and 4 O.0 for
reactivity related with going from operation state to cold one.
2. Comparison of the calculation results obtained by the benchmark MCU and
CONKEMO codes shows that the most distinctions in pin-by-pin power
distributions an about 3 O/O and 5 0.0 for MOX fuel assembly and uranium one,
respectively. This level of agreement can be considered as satisfactory.
3. Maximum discrepancies in pin-by-pin power distributions for all. burnup steps
obtained by TVS-M and CONKEMO codes in variant with nonionned MOX fuel
assembly are 4.2 O o in MOX fuel assembly and -2.3 O o in uranium fuel assembly. In
variant with zonned MOX fuel assembly the similar discrepancies are equal to 3.5 O.0
and -4.5 OO, respectively. By this is meant that pin-by-pin power distributions
obtained by the TVS-M code and the benchmark CONKEMO code are in a good
agreement for all burnup steps.
Maximum discrepancies between calculation results obtained by the HBLIOS
and the CONKEMO codes agree closely with the similar values obtained by the
TVS-M code.
4. Maximum discrepancy in pin-by-pin power distributions calculated with the use of
the few-groups diffusion TRIANG code and the benchmark CONKEMO code for
both variants considered does not exceed 5 90 for all burnup steps. By this is meant
that the approximation burnup model used in the WIMS-ABBN and the
TRIANG-PWR codes is adequate, and it is possible to use this model for calculation
of pin-by-pin power distribution in MOX-fuelled core of VVER reactors.
Page 80
REFERENCES
1. n.H. AGarxH, A.E. ~JIYLIIKOB, M.C. K)AKeBw. 16ki6nHOTeKa RAepHbrx AaHHbIx
DLC/MCUDAT-2.1. OTreT PHH KH. PIHB. J% 32/l -35-398 OT 25.08.98.
2. M.C. K)AKeskir. HporpaMMa BURNUP AIR pacveTa mMeHeHm H~OTO~IHO~O
CocTaBa pearc-ropa B npouecceKaMnaHm.OTYeT PHHKM. MHB.NQ 32/l-36-398 OT
25.08.98.
3. b>eAepaJIbHb!ii HaA3Op POCCUH l-IO EIAepHOii II. paAlfaUHOHHOti 6e30llaCHOCTll.
ATTeCTaUUOHHbIii naCnOpT IlpOrpaMMHOrO CpeACTBa: “HporpaMMa MCU/RFFI/A
C 6u6nsoTeKoti KOHCTaHT DLC/MCUDAT-1.0". PeIWCTpaLWiOHHbIti HOMep
nacnopTa aT’recraunn 61 OT 17.10.96.
4. E.A. Gomin, L.V. Maiorov. “The MCU-RFFI Monte Carlo Code for Reactor
Design Applications”, Proc. of Int. Conf. on Math. and Comp., Reactor Phys. and
Envir. Anal., April 29:May 4 1995, Portland, Oregon, USA, (1995).
5. V.D. Sidorenko et. al. Spectral Code TVS-M for Calculation of Characteristics of
Cell, Supercells and Fuel Assemblies of VVER-Type Reactors. 5:th Symposium of
the AER, Dobogoko, Hungary, October 15-20, 1995.
6. Eduardo A. Villarino et. al., “HELIOS: Angularly Dependent Collision
Probabilities”, Nucl. Sci. & Eng., V: 112, pp. 16-3 1.
7. Juan J. Casal, et. al., “HELIOS: Geometric Capability of New Fuel-Assembly
Diagram”, Proceedings of the Internationale Topical Meeting on Advances in
Mathematics, Computations, and Reactor Physics, April 28-May 2, 1991,
Pittsburgh, PA, p. 10.21-l.
8. Askew J.R., Fayers E.J., Kernshell P.B. A General Description of the Lattice Code
WIMS; J. Brit. Nucl. Energy Sot., 5, 564(1966).
17
Page 81
9. MaHTypoB F.H., HHKOJIaeB M.H., 4uGyna A.M. “CHCTeMa rpynnOBbIX KOHCTaHT
BHAB-93. ~epSl@lKalUiOHHbl~ OTYeT NQ 1. PeKOMeHAOBaHHbIe CnpaBOYHbIe
AaHHbXe”, MocKsa 19%.
10. D.F. Hollenbach, L.M. Petrie, N.F. Landers. KENO-VI: A General Quadratic
Version of the KEN0 Program. SCALE4.3, Vol. 2.2, Section F17, 1995.
11. O.W. Hermann, R.M. Westfall. ORIGEN-S: SCALE System Module to Calculate
Fuel Depletion, Actinide Transmutation, Fission Product Buildup and Decay, and
Association Source Terms. SCALE4.3, Vol. 2, Section F7, 1995.
12. KoseTKoB AJI. “HporpaMMa CARE - pacYeT .mo~On~Oii KklHeTHKZI,
paAPiaLUiOHHbIi? Pi 3KOJIOl-HYeCKHti XapaKTep IIJ(epHOrc? TOnJlMBa npl4 er0 o6inyYeHaw
u BbIAep>KKe”. npenpkIHT @3kI 243 1, 19%.
13. Yigal Ronen, ed., CRC Handbook of Nuclear Reactor Calculations, Volume III,
CRC Press, Inc., 1986, p. 278.
14. BOPOHKOB A.B. Pi Ap. “npOI-paMMbI MHOl-OMepHbIX paCYeTOB XAepHbIX peaKTOpOB. “
B c6. “npOI-paMMbI Pi MeTOAbI @Pf3MYWKOI-0 paCYeTa 6bIcTpbIX peaKTOpOB”.
&iMBTpOBl-pa& 1974.
15. M. Nikolaev, A. Tsiboulia, G. Gerdev, E. Rozhikhin, V. Koscheev. Updating.
Supplementing and Validation of the WIMS-D4 Group Constant Set. S&T Report,
French-Russian Seminar. Obninsk, April 24-25, 1995.
78
Page 82
1-5. B. B. Bevard 6. J. J. Carbajo 7. E. D. Collins 8. B. S. Cowell 9. M. D. DeHart
10. F. C. Difilippo 11-15. J. C. Gehin
16. S. R. Greene 17. T. W. Horning 18. D. T. Ingersoll 19. H. T. Kerr 20. M. A. Kuliasha 21. G. T. Mays
40. N. Abdurrahman, College of Engineering, Dept. of Mechanical Engineering, University of Texas, Austin, Texas 78712
41. M. L. Adams, Department of Nuclear Engineering, Texas A&M University, Zachry 129, College Station, TX 77843
42. H. Akkurt, College of Engineering, Dept. of Mechanical Engineering, University of Texas, Austin, Texas 78712
43. 44.
D. Alberstein, Los Alamos National Laboratory, MS-E502, P.O. Box 1663, Los Alamos, NM 87545 J. Baker,.Office of Fissile Materials Disposition, U. S. Department of Energy, MD-3, 1000 Independence Avenue SW, Washington, DC 20585
45.
46.
47. 48. 49. 50. 51.
H. R. Canter, Office of Fissile Materials Disposition, U. S. Department of Energy, MD- l/2, 1000 Independence Avenue SW, Washington DC 20585 A. Caponiti, Office of Fissile Materials Disposition, U. S. Department of Energy, MD-3, 1000 Independence Avenue SW, Washington DC 20585 K. Chidester, Los Alamos National Laboratory, MS-E502, P.O. Box 1663, Los Alamos, NM 87545 W. Danker, U. S. Department of Energy, MD-3, 1000 Independence Avenue SW, Washington DC 20585 T. Gould, Lawrence Livermore National Laboratory, P.O. Box 808, MS-L1 86, Livermore, CA 9455 1 L. Jardine, Lawrence Livermore National Laboratory, P.O. Box 808, MS-L166, Livermore, CA 9455 1 Dr. Alexander Kalashnikov, Institute of Physics and Power Engineering, 1 Bondarenko Square, Obninsk, Kaluga Region, Russia 249020
52-57.
5%.
59. 60-65.
66.
67. 68.
69.
70.
71.
D. E. Klein, Associate Vice Chancellor for Special Engineering Programs, The University of Texas System, 210 West Sixth Street, Austin, TX 78701 J. 0. Nulton, Office of Fissile Materials Disposition, U.S. Department of Energy, MD-3, 1000 Independence Avenue SW, Washington, DC 20585 S. L. Passman, Sandia National Laboratories, 1401 Wilson Blvd., Suite 1050, Arlington, VA 22209 Dr. Alexander Pavlovitchev, Russian Research Center “Kurchatov Institute”, Institute of Nuclear Reactors VVER Division, VVER Physics Department, 123182, Kurchatov Square, I, Moscow, Russia K. L. Peddicord, Associate Vice Chancellor, Texas A&M University, 120 Zachry, College Station, TX 77843-3133 G. Radulescu, Framatom Cogema Fuels, 1261 Town Center Drive, MS-423, Las Vegas. Nevada 89143 W. D. Reece, Texas A&M University, Department of Nuclear Engineering, Zachry 129, College Station, TX 77843-3 133 P. T. Rhoads, Office of Fissile Materials Disposition, U.S. Department of Energy, MD-4, 1000 Independence Avenue SW, Washington, DC 20585 J. Thompson, Office of Fissile Materials Disposition, U.S. Department of Energy, MD-4, 1000 Independence Avenue SW, Washington, DC 20585 M. Yavuz, 7201 Wood Hollow Drive, #475, Austin, TX 78731
OFtNL/SUB/98-85B99398V-3
INTERNAL DISTRIBUTION
22. G. E. Michaels 23. B. D. Murphy 24. D. L. Moses 25. C. V. Parks
26-30. R. T. Primm, III 31. I. Remet 32. C. C. Southmayd 33. B. A. Worley 34. B. S. Yarborough 35. G. L. Yoder, Jr. 36. Central Research Library
37-38. ORNL Laboratory Records (OSTI) 39. ORNL Laboratory Records-RC
EXTERNAL DISTRIBUTION