Verification of Performance of the Mariner 9 Television Cameras T. E. Thorpe The large volume of picture data produced by the Mariner 9 Television Experiment, in addition to pro- viding a description of the planet Mars, emphasizes the need for in situ verification of camera perfor- mance. Such data provide the basis for initial quantitative image interpretation by confirmation of the relevance of preflight measurement. This information must be the result of planned calibration se- quences rather than extraction from nominal mission photography. A lack of sufficient numbers of frames restricted Mariner camera verifications to only limited operational modes under optimal condi- tions and required significant extrapolation over the duration of the mission. The evidence does suggest that measurable photometric changes other parameters. 1. Introduction Having successfully completed its landmark mis- sion, the Mariner 9 spacecraft transmitted to earth the last of more than 7300 pictures on 17 October 1972. These observations will yield a quantitative, as well as a qualitative, description of the planet Mars, provided the reliability of camera performance is assessed. As with its predecessors (Mariners 6 and 7), Mariner 9 television cameras received exten- sive preflight calibration. These data permit remov- al of the instrument signature from the telemetry by correcting nonlinearities measured months earlier. Significant geometric and photometric distortions may consequently be corrected once the applicability of preflight measurements to flight conditions has been verified. The extended operational lifetime of this mission has emphasized the need for frequent health checks and the difficulties in obtaining rele- vant photography. It is evident that future deep space exploration must incorporate scheduled verifi- cation sequences to utilize calibration values. The Mariner 9 television experiment has been de- scribed previously. 1 The cameras, similar to those used on Mariner 6 and 7,2 consist of two slow-scan vidicons with identical picture formats and electron- ics (see Table I). Two sets of optics of differing focal lengths (10:1) were used to photograph Mars from orbital altitudes of 1200-5000 km twice each day (sixty frames). After 4 months of operations in orbit (15 November 1971 to 20 March 1972), photography The author is with Jet Propulsion Laboratory, California Insti- tute of Technology, Pasadena, California 91103. Received 15 February 1973. occurred, whereas agreement with preflight data is observed for was curtailed because of passage of the spacecraft through the Martian umbra (April-May 1972) and solar conjunction (August-September 1972). During the months of June, July, and October, however, several hundred additional pictures were obtained to complement the standard mission. Table II summa- rizes camera operation. The Mariner preflight television calibration effort consisted primarily of fourteen camera performance tests: five at room temperature (bench) and nine environmental, producing a total of more than 7000 pictures. 3 These data are categorized in Table III with various planning, operations, and decalibration uses. Inflight verification began with playback of cali- bration pictures tape recorded before launch on 29 September 1972. The significant verification events that followed consisted of four types of photography. Scan calibrations (scan calibrations I and II) were special picture-taking sequences designed to deter- mine the accuracy with which the Mariner science instruments could be directed toward specific tar- gets. 4 Photography of star fields provided this infor- mation and, in addition to permitting an evaluation of camera pointing accuracy, also gave an early as- sessment of focus, system noise interference, and re- sidual image. Saturn calibration followed shortly thereafter and produced images of Saturn at several shutter speeds and locations within the field of view. These data indicated the camera's ability to produce a response proportional to illuminance, regardless of signal strength. This light transfer characteristic evaluation (analog of the film H and D curve) was especially valuable, because the data source was in- dependent of the future Mars photography. Mars calibrations (Mars calibrations I and II) were similar sequences directed toward Mars, while the planet August 1973 / Vol. 12, No. 8 / APPLIED OPTICS 1775
Transcript
Verification of Performance of the Mariner 9 TelevisionCamerasT. E. Thorpe
The large volume of picture data produced by the Mariner 9 Television Experiment, in addition to pro-viding a description of the planet Mars, emphasizes the need for in situ verification of camera perfor-mance. Such data provide the basis for initial quantitative image interpretation by confirmation of therelevance of preflight measurement. This information must be the result of planned calibration se-quences rather than extraction from nominal mission photography. A lack of sufficient numbers offrames restricted Mariner camera verifications to only limited operational modes under optimal condi-tions and required significant extrapolation over the duration of the mission. The evidence does suggestthat measurable photometric changesother parameters.
1. Introduction
Having successfully completed its landmark mis-sion, the Mariner 9 spacecraft transmitted to earththe last of more than 7300 pictures on 17 October1972. These observations will yield a quantitative,as well as a qualitative, description of the planetMars, provided the reliability of camera performanceis assessed. As with its predecessors (Mariners 6and 7), Mariner 9 television cameras received exten-sive preflight calibration. These data permit remov-al of the instrument signature from the telemetry bycorrecting nonlinearities measured months earlier.Significant geometric and photometric distortionsmay consequently be corrected once the applicabilityof preflight measurements to flight conditions hasbeen verified. The extended operational lifetime ofthis mission has emphasized the need for frequenthealth checks and the difficulties in obtaining rele-vant photography. It is evident that future deepspace exploration must incorporate scheduled verifi-cation sequences to utilize calibration values.
The Mariner 9 television experiment has been de-scribed previously.1 The cameras, similar to thoseused on Mariner 6 and 7,2 consist of two slow-scanvidicons with identical picture formats and electron-ics (see Table I). Two sets of optics of differing focallengths (10:1) were used to photograph Mars fromorbital altitudes of 1200-5000 km twice each day(sixty frames). After 4 months of operations in orbit(15 November 1971 to 20 March 1972), photography
The author is with Jet Propulsion Laboratory, California Insti-tute of Technology, Pasadena, California 91103.
Received 15 February 1973.
occurred, whereas agreement with preflight data is observed for
was curtailed because of passage of the spacecraftthrough the Martian umbra (April-May 1972) andsolar conjunction (August-September 1972). Duringthe months of June, July, and October, however,several hundred additional pictures were obtained tocomplement the standard mission. Table II summa-rizes camera operation.
The Mariner preflight television calibration effortconsisted primarily of fourteen camera performancetests: five at room temperature (bench) and nineenvironmental, producing a total of more than 7000pictures.3 These data are categorized in Table IIIwith various planning, operations, and decalibrationuses.
Inflight verification began with playback of cali-bration pictures tape recorded before launch on 29September 1972. The significant verification eventsthat followed consisted of four types of photography.Scan calibrations (scan calibrations I and II) werespecial picture-taking sequences designed to deter-mine the accuracy with which the Mariner scienceinstruments could be directed toward specific tar-gets.4 Photography of star fields provided this infor-mation and, in addition to permitting an evaluationof camera pointing accuracy, also gave an early as-sessment of focus, system noise interference, and re-sidual image. Saturn calibration followed shortlythereafter and produced images of Saturn at severalshutter speeds and locations within the field of view.These data indicated the camera's ability to producea response proportional to illuminance, regardless ofsignal strength. This light transfer characteristicevaluation (analog of the film H and D curve) wasespecially valuable, because the data source was in-dependent of the future Mars photography. Marscalibrations (Mars calibrations I and II) were similarsequences directed toward Mars, while the planet
Focal length, mm 52.267 500.636f/number 4.0 2.35T/number 4.46 3.55Field of view, deg 13.47 X 10.45 1.41 X 1.09Target size, mm 9.6 X 12.5 9.6 X 12.5Number of scan lines 700 700Number of samples/line 832 832Readout time, sec 42 42Shutter speeds, sec 0.003-6.144 0.003-6.144Filters (effective wavelength)a
still appeared small in size. These data were in-tended to complete the comparison link betweenMariner Saturn and Mars orbital photography andearth-based observations of both planets. Finally,during orbital operations, several instances of re-peated photography of isolated regions on Mars gaveadditional information concerning light transfer andspectral and modulation transfer camera properties.These sequences are summarized in Table IV.
Although these sequences provided a total of 270frames, verification of performance is limited by thefollowing considerations:
(1) Almost 70% of this picture subset was takenprior to orbit insertion. When the Martian duststorm had cleared sufficiently to permit mapping ofthe planet, the priority of observing topography pre-vented additional verification sequences. Conse-quentl-y, little information exists to describe quanti-tatively camera operation as a function of missiondate or camera usage in flight.
(2) The number of pictures taken does not reflectthe extent of the data available to verify a given cali-bration parameter, i.e., all preinsertion data pro-duced images that represent a very small fraction ofthe field of view, and hence significant spatial ex-trapolation is necessary over the vidicon format.
(3) Many of the calibration parameters requirelarge numbers of frames per image location, e.g., asingle light transfer verification at five points withinthe field of view (using four light levels) necessitatestwenty pictures per camera and filter position.Hence, only limited operational modes under opti-mal conditions could be checked.
II. Geometric Distortions
The ability of a television camera to reproduceimage locations with the same geometric relationshipas exists in object space is of vital importance toMartian cartography. Geometric distortions weremeasurable in both Mariner cameras by locating areference pattern on flight photographs and compar-ing its appearance with calibration pictures. Starimages also provided geometric consistency checks atselected locations within the field of view. No ap-parent change from the preflight calibration of geo-metric behavior has been observed in flight data foreither camera to a measurable accuracy of one pixel(picture element).
A. Reseau Measurement
To provide geometric reference, a pattern of reseaumarks has been deposited on the photoconductingsurface of each vidicon. This array of 111 points(wide-angle camera) and sixty-three points (narrow-angle camera) was measured to a positional accuracyof 10-3 mm and hence reveal any nonlinearities inthe electronic readout scan. Distortion correctionrequires recognition of these points in flight data byautomated computer programs. Successful decali-bration has verified their consistent appearancethroughout the mission.
A raster shift, occurring as a consequence of leav-ing the earth's magnetic field, was observed by com-paring reseau positions with preflight calibration atequivalent light levels. The displacement measuredin television lines and pixels is given in Table V.
Table IV. Calibration Verification Sequences
Numberof pic-
Sequence Date Description tures
AFETR playback 9/29/71 Telemetry test 30Scan calibration I 10/1/71 Narrow-angle camera calibration 31
a Displacements measured in television lines and pictureelements.
Figures 1 and 2 display the change in reseau pat-tern exhibited by these flight data.
During the ground calibrations of Mariners 6, 7,and 9, these reseau positions were also found to bedependent upon exposure. A shift of about three
Fig. 3. Reseau locations vs light level for the wide-angle-camera.Displacements are exaggerated OX.
Fig. 1. Wide-angle-camera raster shift. More distinct marks arereseau locations measured during preflight bench calibrations.Less distinct marks are reseau locations of a typical flight pic-
ture.
Fig. 2. Narrow-angle-camera raster shift. More distinct marksare reseau locations of a typical inflight picture. Less distinctmarks are locations measured during preflight bench calibrations.
Fig. 4. Reseau locations vs light level for the narrow-anglecamera. Displacements are exaggerated OX.
pixels to higher line values occurs during the transi-tion from threshold to saturation light levels andprobably is due to a residual charge on the vidicontarget bending the read beam. Inflight photographyreveals a similar displacement. Figures 3 and 4 showwide- and narrow-angle-camera reseau displace-ments (magnified 1OX) at four signal levels (datanumbers 30, 100, 280, 380), as observed on revolu-tions 2, 76, 200, and 225. As a result, it has beenpossible to remove all remaining geometric distor-tions in the process of decalibration to an accuracy of1 pixel.
B. Star Field Verification
The star field photography provided by scan cali-brations I and II was also useful in revealing geomet-
Fig. 5. Wide-angle camera star image-angleimage profiles.
10 11
camera star
ric distortions. Star images provide the inverse ap-pearance to a reseau pattern and may be used forlow light-level measurement. Unfortunately, be-cause of partial image erasure by adjacent readoutscanning and convolution effects within the readbeam, even faint stars appear asymmetrical and sev-eral pixels in size.5 A minimum dispersion of onepixel eists in the measurement of the separation ofthe centers of any two star images, and no residualdistortion was consequently evident.
An additional geometric distortion is produced bydeflection of read beam electrons in the presence of alarge target charge discontinuity. This phenomenonwas especially noticeable on star pictures containingimages well above saturation (+4.0 magnitude),until extended image characteristics become evident(+1.0 magnitude). The asymmetrical appearance oftypical star profiles imaged by the narrow-anglecamera (Fig. 5) suggests the following vertical bias:
displacement (lines) = (B/B saturation)"/3
where 13 = image brightness. As a consequence, re-sidual star images on subsequent pictures were dis-placed from the original picture location.
The establishment of accurate locations within thecamera field of view permits the determination oforbit-surface geometry required to rephotograph se-lected targets. Before entering the Mars gravita-tional field and following the initial star photographyto verify spacecraft trajectory, pointing accuracy wasas follows4 :
Once in orbit, however, surface feature photographywas subject to a combination of effects caused byorbit residuals, Mars rotational period uncertainty,timing constraints, platform stepping increments,and limit cycle. After 6 months of orbital photogra-phy, pointing control was about 40.8' rms.
111. Photometric Performance
Photometric performance may be described withrespect to both consistency with preflight calibrationand the accuracy in representing a realistic lumi-nance environment. The ability of the televisionsubsystem to produce a consistent signal output as afunction of light level or position within the field ofview will be defined as the relative light transfer re-sponse. Inflight performance agreement with pre-flight measurement, therefore, indicates the degree ofsimilarity in transfer curve shape across the field ofview or the expectation that a given signal outputbears the same relation to input luminance, as wasmeasured in preflight tests. Absolute photometryrefers to the accuracy with which this signal can beinterpreted as source radiance information. Suchperformance implies frame-to-frame fidelity, knowl-edge of spectral sensitivity, and a predictable signal/flux efficiency.
A. Relative Light Transfer ResponseMariner 9 television inflight response appears con-
sistent to within 25% of preflight measurement forthe wide-angle camera and to within 15% for thenarrow-angle camera over the dynamic range of eachsystem.
Five areas across the field of view of each camerawere analyzed (center and four corners) using severalphotographic sequences. Successive overlappingpictures taken far from periapsis were used to placea feature of constant luminance geometry at thesepositions. For example, pictures taken in successionon revolutions 119 through 125 show a given surface
1,000i
CENTER OFl FIELD OF VIEW
100 CALIBRATION OSERVED /
$100NARROW-ANGLE WIDE-ANGLE
CAMERA CAMERA
| // ' CENTER OFCALIBRATION FIELD OF VIEW
- | OBSERVED (FILTER POSITION 2)
10 I , , ,10 100 1,000 10,000
LUMINANCE PROPORTIONAL DATA NUMBER
Fig. 6. Light transfer response of wide- and narrow-angle cam-eras.
Fig. 7. Light transfer response of wide-angle camera, filter posi-tion 5.
feature moving diagonally from left to right acrossthe field of view and on revolutions 250 through 262from right to left, with little change in viewing ge-ometry. Mars calibration II also provided a con-stant scene with which to check preflight light-trans-fer calibration at several light levels.
Figure 6 displays the current best estimate of in-flight wide-angle camera response through filter posi-tion 2(X = 0.610 ,um) and narrow-angle camera re-sponse (center of field of view). Because of the loss offilter wheel control on revolution 118, a similar set ofmeasurements was made for all filter positions and re-vealed a lockup in position 5 (polarizing 60°). Thelack of temperature calibration for this filter, how-ever, has resulted in decalibration using bench data(Fig. 7). It may be seen that the effect of equivalentenvironmental temperature on a similar filter givesbetter agreement with observations and suggeststhat decalibration without temperature data for thisfilter yields luminosities 29% too low. At intermedi-ate signal levels, the response near the corners of pic-tures taken by this camera has also changed (shad-ing). Generally speaking, the right side of the vidi-con appears somewhat less sensitive than the leftside. This wedge-shaped response may be a nonuni-form target charge buildup as a consequence of thetypical photographic mode, which always placed theright side of the picture closest to the Martian termi-nator.
Confirmation of relative photometric performanceis provided independently by analysis of a dust speckshadow.6 Use of preflight light transfer calibrationto convert wide-angle camera data to intensity pro-portional numbers results in a shadow contrast vari-ation from 4% to 8%. The ratio of apparent contrastto true contrast is a derivative of the function relat-ing the signal to a linear photometric scale. As theapparent contrast is a minimum near midscale, thecalibration light transfer curve should be shifted to agreater data number (DN) at high and low raw DNlevels,
Star sequences also gave an indication of the cam-
era's consistent light transfer response performancewith light level for point sources. 5 Figure 8 shows,however, that image motion (20 December data re-vealed three pixels of smear), and the read beam in-teraction with small charge distributions produces alarge data dispersion, making applicability to Marsdata uncertain.
B. Absolute Photometry
The relation of decalibrated signal to luminosity,in addition to being of value to science interpreta-tion, provides verification of exposure times, frame-to-frame photometric consistency, and filter factors.
Absolute photometry requires precise knowledge ofall transmitting and responding elements as a func-tion of radiance, wavelength, and temperature. Theconvolution of many small error sources, e.g., cali-bration source radiance vs lifetime, may produceuncertainties as large as the in situ spacecrafthealth.
Both frame-to-frame signal consistency andrepeatability over the three star-photography se-quences suggest small operational variance at expo-sures of 6.144 sec. The data scatter indicates a pho-ton efficiency,
[(S/N)out2/(SN)in 2I of 4 X 10⁻⁴
at midscale (fifth magnitude). At the 5%-of-satura-tion level (7 DN above dark current), limiting mag-nitudes correspond to +4.0 (wide-angle) and +8.6(narrow-angle).
Although Saturn presents an image larger thanstars on narrow-angle pictures, its ring system addsan unknown contribution to the integrated response.Using the average of the two largest image DN yieldsdecalibrated DN/ft-l conversion factor of 1.722 (vs1.859 predicted). Similar values to 410% rms areobtained over the range of 96-768-msec shutterspeeds. However, large discrepancies may exist atspeeds more typical of Mars photography (6-24msec).
Verification of absolute performance using Marsitself implies knowledge of the planet radiance at aspecific viewing geometry. This requirement was
500
200
a: /{ 5/ 8 OCTOBER 1
v 100 _ _vS5 >a * OCTOBER 8z 0 DECEMBER 20
20
10 I I IB.0 7.0 6.0 5.0 4.0 3.0 2.0
VISUAL MAGNITUDE
Fig, 8. Maximum amplitude response (6.144 sec) of narrow-
difficult to satisfy because of the added brightnesscontributed by the dust storm to what is, at best, apoorly known photometric function. Correcting allthe above photometric nonlinearities in the Marinerdata yields luminosity measurements to within4-11% rms of the predicted Mars's brightness fol-lowing revolution 100 at phase angles observablefrom earth.
These three measurements suggest consistentcamera performance in spite of calibration sourcedifferences. Using data presented in this document,Mariner 9 photometric measurements of Mars haveachieved 15% (lo) accuracy under limited condi-tions. These include optimization of signal strength(200-2'75 DN), location within ±200 pixels of cameraline of sight, use of standard shutter speeds, andnominal operational temperatures (wide-angle cam-era, 7.20C; narrow-angle camera, 10'C).
C. Spectral Response
The relative response differences through each ofthe medium bandpass filters (filter positions 2, 4, 6,and 8) of the wide-angle camera have been comparedwith prediction based on telescopic spectral observa-tions of Mars. 7 A survey of wide-angle orbital pic-tures through revolution 130 was made to selectsamples with viewing parameters constant to withina few degrees. The decalibrated data numbers weredivided by the camera response to the spectral lumi-nance of a calibration 13-cm (5-in.) light source andnormalized to filter position 2 (orange filter) photog-raphy. Evaluation of the response using filter posi-tions 3, 5, and 7 (polarizing filters) was less extensivebecause of lack of inflight photography and sparsecalibration data. Only a few polarizing pictureshave been taken at viewing geometries comparableto spectral photography. (Table VI summarizesthese results.) Nevertheless, with the exception of
filter position 8, the preflight camera spectral re-sponse has been verified to within the observable ac-curacy (see Table VI). Filter position 8 (violet fil-ter) produced a long-term change in response in thevacuum environment. This observation has beenduplicated in calibration tests and appears to be achange in filter transmission at the shortest wave-lengths.
D. Shutter Speed
A change in shutter speed will produce an appar-ent difference in camera sensitivity. Using flightdata, it is difficult to differentiate this occurrencefrom a possible change in vidicon sensitivity. Se-quences that involve photography of the same sceneunder comparable lighting conditions at two or moreshutter speeds create two widely different signal lev-
Fig. 9. Veiling glare picture of Mars and Phobos taken by thenarrow-angle camera.
els. Hence, a change in the predicted signal ratio ofimages photographed at 6 msec and 12 msec may, infact, be a consequence of vidicon light transferchanges.
If a consistent difference is present at all shutterspeeds (e.g., +Y2 msec), however, the change is mostevident at the shorter exposures. Comparison thenmay be made between a scene photographed at 6msec and 12 msec and subsequently rephotographedat lower luminosity such that a 12-msec and 24-msecpicture pair produce the same signal levels. Anychange will be a consequence of shutter variation,provided that camera parameters and surface reflec-tance have remained constant during the interval.A consistent ratio was obtained with either shutterspeed combination to 4Y2%. Previous life testing ofthe shutter type being used on Mariner 9 has shownthat the expected number of shutter actuationswould be more than 150,000 with 50% reliability.Through testing and flight operations, Mariner 9television shutter actuations were approximately42,000 per camera, with 100% reliability.
1.0 I I
0.9
0.8
0.7- o~~~~N0 0.6 -
POLE CAP0.5 -~ ~~~~~NCONTI00.4
E. Veiling Glare and Stray Light
Veiling glare in the presence of strong illuminationwas apparent in several preorbital narrow-angle pic-tures and in early limb pictures (wide-angle). How-ever, because optical scattering amounts to only afew percent, images of the limb of Mars at severaltimes saturation intensity were required to produce ameasurable loss of contrast with background space.
Narrow-angle camera veiling glare was measuredon a picture selected from preorbital photography ofthe Martian satellites. Figures 9 and 10 show animage of the Martian terminator at 1ox saturationwith adjacent brightness contours at 16-DN inter-vals. The calculated intensity indicated a maxi-mum glare of 3.0% clearly discernible from atmo-spheric reflectance.
F. Blooming
Overexposure produces some charge spreading onthe inner target surface of most television cameras.Such transfer is minimized in vidicons, however,owing to the high surface resistivity (1016 -cm).Preflight camera measurements indicated that apoint source image will increase in size proportionalto the one-quarter power of the brightness-to-satura-tion brightness ratio.5 Inflight pictures taken withthe narrow-angle camera of both stars (0-45X satu-ration) and Deimos (32X saturation) confirm thisprediction.
G. Modulation Transfer Function
The modulation transfer of each camera was eval-uated using Fourier transforms of edge tracingsacross moderate- and high-contrast features (wide-angle camera) and point source images (narrow-angle camera).
Response of the wide-angle camera was measuredinitially with preorbital limb profiles on picturestaken at distances such that a 30-km atmospherewould subtend an angle of less than 0.1 pixel. Thesedata were combined with polar-cap-edge traces toyield contrasts more typical of calibration targets.Figure 11 indicates good agreement with bench cal-ibration in both filter positions 2 and 8.
S1 FP 2
Fig. 11. Modulation transfer function of wide-CH 2 2.5:1 FP 2- angle camera.
Fig. 13. Noise power spectra of wide-angle camera.
The modulation transfer function of the narrow-angle camera at intermediate light levels also ap-pears consistent with prediction (Fig. 12). Abovemidscale signal to noise, a loss of image modulationrapidly occurs. This light-level dependency was firstobserved in bench testing and is apparent in bothmapping pictures and star photography. Both setsof measurements indicate, to the accuracy of avail-able data, that no change in either optical or elec-tronic focus has occurred through 14 months of mis-sion operations.
IV. Electronic Performance
A. Dark Current
The vidicons were closely monitored during themission; small variations in dark current, observedthrough- the use of the average video telemetry, havebeen noted along with the cathode current telemetrydata. Visual inspection of typical picture DN list-ings showing black space reveals a background DNlevel of 14 (wide angle) and 17 (narrow angle).However, the dark currents decreased some by theend of the mission (wide-angle camera = 27.1%; nar-row-angle camera = 31.1%).
B. Noise
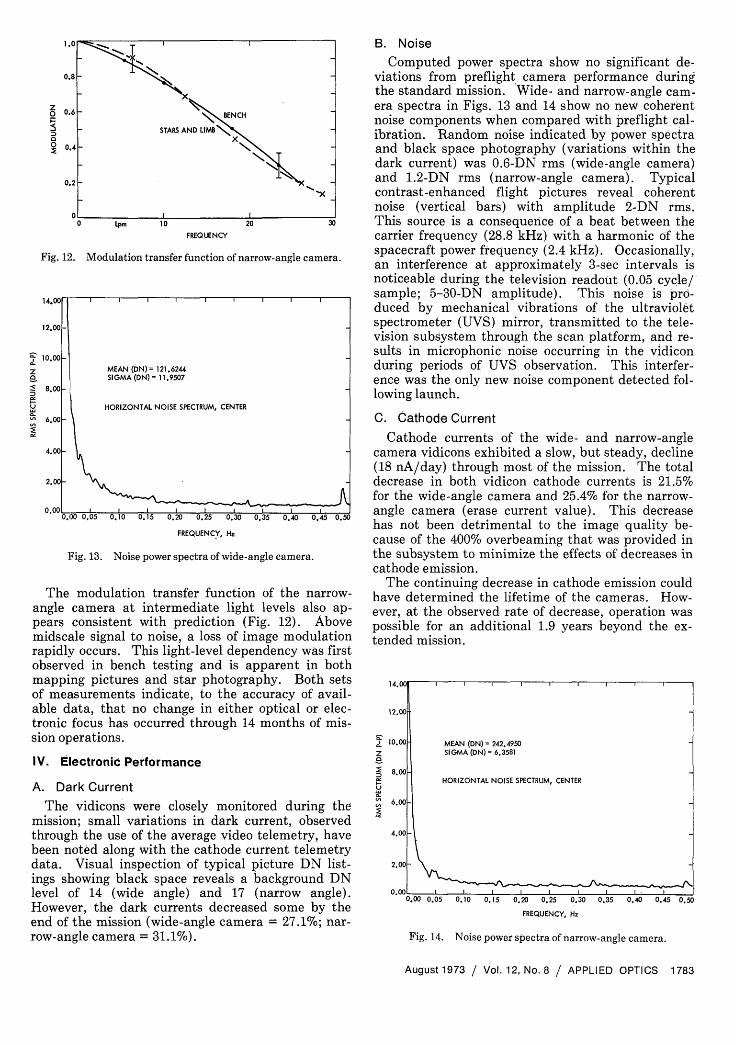
Computed power spectra show no significant de-viations from preflight camera performance duringthe standard mission. Wide- and narrow-angle cam-era spectra in Figs. 13 and 14 show no new coherentnoise components when compared with preflight cal-ibration. Random noise indicated by power spectraand black space photography (variations within thedark current) was 0.6-DN rms (wide-angle camera)and 1.2-DN rms (narrow-angle camera). Typicalcontrast-enhanced flight pictures reveal coherentnoise (vertical bars) with amplitude 2-DN rms.This source is a consequence of a beat between thecarrier frequency (28.8 kHz) with a harmonic of thespacecraft power frequency (2.4 kHz). Occasionally,an interference at approximately 3-sec intervals isnoticeable during the television readout (0.05 cycle/sample; 5-30-DN amplitude). This noise is pro-duced by mechanical vibrations of the ultravioletspectrometer (UVS) mirror, transmitted to the tele-vision subsystem through the scan platform, and re-sults in microphonic noise occurring in the vidiconduring periods of UVS observation. This interfer-ence was the only new noise component detected fol-lowing launch.
C. Cathode Current
Cathode currents of the wide- and narrow-anglecamera vidicons exhibited a slow, but steady, decline(18 nA/day) through most of the mission. The totaldecrease in both vidicon cathode currents is 21.5%for the wide-angle camera and 25.4% for the narrow-angle camera (erase current value). This decreasehas not been detrimental to the image quality be-cause of the 400% overbeaming that was provided inthe subsystem to minimize the effects of decreases incathode emission.
The continuing decrease in cathode emission couldhave determined the lifetime of the cameras. How-ever, at the observed rate of decrease, operation waspossible for an additional 1.9 years beyond the ex-
V. ConclusionsBased on limited data, the Mariner 9 performance
appears consistent throughout its mission. Severalcorrections have been provided by inflight verifica-tion sequences. A change in photometric response,which will impair precise photometric analysis, hasbeen observed. Hence, only qualified photometricmeasurement appears feasible under limited condi-tions. Conversely, certain geometric and electronicparameters appear both measurable and congruentwith preflight prediction. The role of inflight verifi-cation has been emphasized by these data to assessthe in situ camera health and to promote efficientdata analysis and interpretation. Future missions ofextended duration should consequently devote a sig-nificant fraction of mission photography to verifycritical imaging parameters.
The measurements presented in this article are theresult of efforts made by many people. Much of thedata analysis was possible only through special dataprocessing provided by JPL's Image Processing Lab-oratory. In addition, the following persons contrib-
uted important information: R. Becker, W. Green,J. Kreznar, L. Simmons, G. Smith, and W. Sleigh.
References
1. H. Masursky, R. Batson, W. Borgeson, M. Carr, J. McCauley,D. Milton, R. Wildey, D. Wilhelms, B. Murray, N. Horowitz,R. Leighton, R. Sharp, W. Thompson, G. Briggs, P. Chandeys-son, E. Shipley, C. Sagan, J. Pollack, J. Lederberg, E. Levin-thal, W. Hartmann, T. McCord, B. Smith, M. Davies, G. deVaucouleurs, and C. Leovy, Icarus, 12, 10 (1970).
2. G. E. Danielson and D. R. Montgomery, J. Geophys. Res. 76,418 (1971).
3. L. M. Snyder, Mariner 9 TV Subsystem Calibration Report,Document 610-202 (Internal Document, Jet Propulsion Labora-tory, Pasadena, Calif., 1971).
4. W. F. Havens, Scan Pointing Calibration for the Mariner Mars1971 Spacecraft, TM 33-556 (Jet Propulsion Laboratory, Pasa-dena, Calif., 1972).
5. T. E. Thorpe, Mariner 9 star photography, Appl. Opt. 12, 359(1973).
6. A. T. Young, Jet Propulsion Laboratory; private communica-tion.
7. T. B. McCord and J. A. Westphal, Astrophys. J. 168, 141 (1971).
OPTICAL SENSORS AND THEIR APPLICATIONS
The University of Wisconsin will present a two-dayinstitute entitled "Optical Sensors and Their Applications"on December 17-18, 1973. It will cover the various types of
optical sensors being manufactured by industries.
Some discussion will be giventhese optical sensors and problemsIt will be an intensive institute
people dealing in sensors up-datedthem.
to the applications of
associated with their use.that will provide thoseinformation concerning
Program: OPTICAL SENSORS AND THEIR APPLICATIONS
December 17-18, 1973
University of WisconsinMadison, Wisconsin
$100
Donald E. Baxa
Department of EngineeringUniversity of Wisconsin--Extension4.32 North Lake StreetMadison, WI 53706