Verification of RIS data using DICOM data for the purpose of patient dose audit IPEM MPEC, Oct 2012 Charnock P 1 , Couch T 1 , Dunn AF 1 , Fazakerley J 1 , Graham S 1 , Jones R 1 , Moores BM 1 , Murphy J 1 , Wilde R 1 , 1 IRS Limited, Liverpool
Transcript
Verification of RIS data using DICOM data for the purpose of
patient dose audit
IPEM MPEC, Oct 2012
Charnock P1, Couch T1, Dunn AF1, Fazakerley J1, Graham S1, Jones R1, Moores BM1, Murphy J1, Wilde R1,
1IRS Limited, Liverpool
Why use RIS data?
• Patient dose audits are used to ensure that doses are ALARP.
• Previously, these have been calculated using a small, hand-written sample (≈20 records).
• RIS contains computerised data for all examinations, it’s readily available and easy to import into excel.
Methodology for Patient Dose Audit
• Data may contain kV, mAs and DAP for each examination in each room
• FFD (&/or FSD) has to be assumed based on technique and standard patient*
• kV & mAs combined with results of level B physics tests to calculate ESD including backscatter*
• *It would be relatively simple to incorporate this data to improve accuracy
Why can’t we rely on RIS data?
• Large number of ‘zero’ or blank values in kV/mAs/DAP.
• Impossible dose values frequently occur i.e. mAs of >500 or kV >150 are unlikely.
• DAP not given any units, could be µGym2 or Gycm2 for example
• If they are wrong, what are the real values?
DICOM!
Characteristics of DICOM Data
• Generated by the system so no chance of human error.
• Contains much more data about image acquisition parameters.
But...
• It is difficult to gather dose data quickly en masse.
• Study labelling errors remain.
Types of Error in RIS Data
• Digits typed in the wrong order i.e. 789 instead of 897.
• Wrong digits entered e.g. 228 instead of 558
• Omission of digits i.e. 119 instead of 1119.
• Insertion of digits i.e. 13690 instead of 1369.
• Errors where the user appears to have entered the ‘default’ parameters
• Transpose of data, e.g. kV value in the mAs field (& vice versa)
0%
2%
4%
6%
8%
10%
12%
20
0
35
0
50
0
65
0
80
0
95
0
11
00
12
50
14
00
15
50
17
00
18
50
20
00
21
50
23
00
24
50
35
00
50
00
Re
lati
ve F
req
ue
ncy
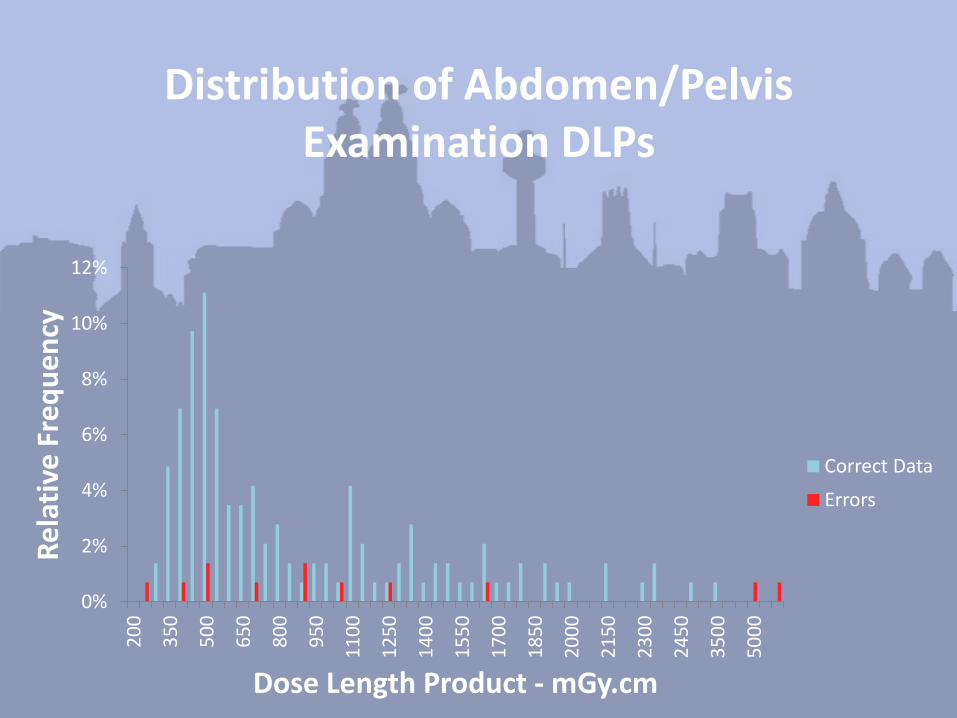
Dose Length Product - mGy.cm
Correct Data
Errors
Distribution of Abdomen/Pelvis Examination DLPs
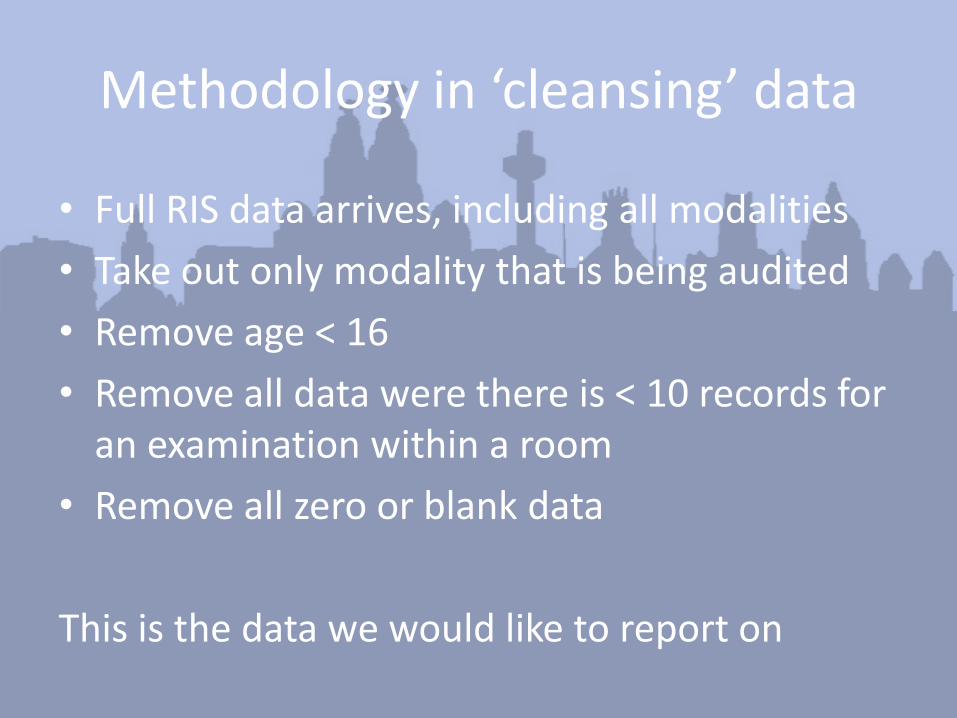
Methodology in ‘cleansing’ data
• Full RIS data arrives, including all modalities
• Take out only modality that is being audited
• Remove age < 16
• Remove all data were there is < 10 records for an examination within a room
• Remove all zero or blank data
This is the data we would like to report on
Methodology in ‘calibrating’ data
• For a room that we have equivalent DICOM data, take a random sample of about 1,500 records from the 4 most common examination in that room & calculate ESD
• Using accession number, find equivalent DICOM records, record and calculate ESD
• Compare statistical profile
XR Abdomen XR C Spine
RIS DICOM RIS DICOM
N 169 169 183 183
Mean 4.204 4.104 0.891 0.891
Std Dev 5.335 3.506 0.657 0.659
MIN 0.191 0.500 0.434 0.434
1st Quartile 1.850 1.850 0.546 0.546
Median 3.298 3.319 0.613 0.613
3rd Quartile 4.893 5.153 1.239 1.239
MAX 59.460 20.858 6.321 6.321
Example
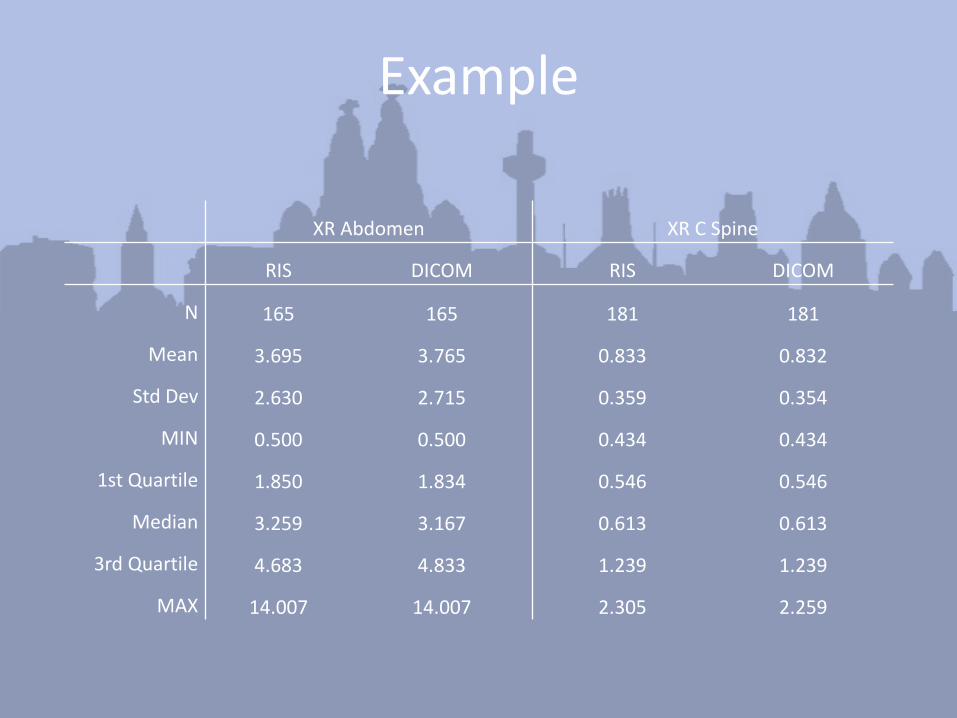
XR Abdomen XR C Spine
RIS DICOM RIS DICOM
N 165 165 181 181
Mean 3.695 3.765 0.833 0.832
Std Dev 2.630 2.715 0.359 0.354
MIN 0.500 0.500 0.434 0.434
1st Quartile 1.850 1.834 0.546 0.546
Median 3.259 3.167 0.613 0.613
3rd Quartile 4.683 4.833 1.239 1.239
MAX 14.007 14.007 2.305 2.259
Example
Limitations
• DICOM only available where site has DR rooms – would need a different method of calibration for non-DR sites
• Currently collecting DICOM is still manual – takes about a day to collect c.300 records
Conclusions
• RIS data can be used for patient dose audit
• Recommend it is calibrated regularly against known data set such as DICOM
• Results of calibration can be fed back to departments, number of records removed can be set as KPI