Lang. Soc. 9,43-70. Printed in the United States of America.
Vernacular language loyalty and social network1
LESLEY MILROY AND SUE MARGRAIN
Northern Ireland Polytechnic
INTRODUCTION
Several urban language studies over the past fifteen years have convincinglyestablished the links between a speaker's language and her or his age, sex, andsocial class, yet very much more remains to be said about individualdifferences within these variable groups. Several linguists (e.g., Gumperz1976; Russell 1977; Bickerton 1975) have made observations similar to LePage (1968) that "the individual creates his system of verbal behaviour so asto resemble those common to the group or groups with which he wishes fromtime to time to be identified". This hypothesis is strikingly similar to Giles &Powesland's (1975) proposals for applying accommodation theory to explainlinguistic code-switching.
Labov (1966) notes considerable variation within social groups defined onthe basis of age, class, or sex, and he argues convincingly that studies of the"idiolect" are unlikely to reveal sociolinguistic structure as clearly as studiesof the speech of whole social groups. The consistent patterns he himselfuncovers are observable only on this basis; the size of Labov's sample in NewYork City, together with his method of aggregating data from all theindividuals in the group, ensures that considerable variation between individ-ual idiolects does not obscure more regular patterns of variation in thecommunity as a whole. We should note here that Labov is not suggesting thatindividuals reveal only unstructured variations; he is showing specifically thatthe idiolect-based approach characteristic of earlier scholars (e.g. Bloch 1948;Hockett 1958) is inadequate. Bloch and Hockett hoped that the idiolect wouldbe revealed as a tightly structured, self-consistent system, valid also for thewider community, except perhaps for minor differences of detail.
For many years now, sociolinguistics has shown us that this deterministicapproach is unprofitable. Nevertheless, as long as we do not expect to find inthe language of the individual a perfect replica in miniature of his or her
[1] The work reported in this paper has been partially supported by a research grant from theSSRC (no. HR 3771). We would like to acknowledge the help and support of our co-workerson the project, particularly James Milroy. The first author is also particularly grateful toWilliam Labov for a large number of constructive comments and criticisms of previous workwhich have been extremely helpful in planning this paper. Of course, the authors are solelyresponsible for its defects.
dialect grammar, there is no reason why a speaker's output should be viewedas unstructured and unworthy of study. In fact, Bickerton, Le Page andGumperz all take the individual as the basis of their descriptions of variation,principally because of the difficulty of defining corporate group boundaries.Le Page is additionally anxious to emphasise the individual's freedom ofchoice to use language as a means of identifying with different groups atdifferent times. Although this approach may be more obviously attractive to acreolist than a sociolinguist working in a monoglot situation, we have found itstrikingly apposite to our own observations of intra-group variation inBelfast.
The analysis in this paper focusses on the individual, not necessarily forreasons of difficulty in defining group boundaries (although that is sometimesa problem); rather, we would agree with Mitchell (1973) and Russell (1977)that the network of relationships within which an individual is embedded andthe corporate social groups to which he or she can be said to belong arephenomena at different levels of abstraction. In studying linguistic variation,it seems reasonable initially to adopt Boissevain's (1974) view that persons arecapable of interacting meaningfully with each other and that their behaviourdoes not depend entirely upon their position in an abstract society. Theconcept of social network has been developed by Mitchell, Boissevain andothers as a result of this conviction that behaviour can often be explained bystudying individual interactions. Attempts to explain it exclusively in terms ofcorporate group membership, culture, and systems of values may sometimesbe less satisfactory.
The behaviour we are attempting to explain here is the linguistic behaviourof forty-six working-class Belfast speakers from three comparable working-class communities. As a result of regularities in the data, we formed thehypothesis that closeness to vernacular speech norms correlated positivelywith the level of individual integration into local community networks. To testthis, we looked at a number of phonological variables against a new,combined measure of multiplexity and density in individual relationships.Thus, we are attempting to make a quantitative statement of the extent towhich individual network structure predicts linguistic behaviour.
It should be noted here that the link between individual use of a vernacularlanguage code and integration into a localised, relatively closed network hasbeen pointed out before, particularly by Labov (1972b) and Gumperz (1972with Blom; 1976a, 1976b). However, no systematic quantitive measure of thisintegration has been devised.2 To be integrated into the local community - or
[2] Although of course Labov's study of the Harlem gangs (reported in Labov 1972b) is highlysystematic, its method is applicable only to groups or quasi-groups with a fairly clearmembership. The kind of network study to which we are here referring does not postulategroup boundaries of any kind and so (in theory at least) any individual can be studied in thisway whether she or he belongs to a self-conscious group or not.
44
VERNACULAR LANGUAGE LOYALTY AND SOCIAL NETWORK
'local team', to borrow Blom and Gumperz' expressive phrase - is to havecontracted sets of relationships and adopted sets of values which mark out the'local team' as an entity separate from the wider provincial or nationalcommunity. In this wider community, explicitly codified and institutionallyaccepted sets of values, which may directly contradict local norms (Littlejohn1976; Labov 1972b), are acknowledged. Blom and Gumperz make the samedistinction between the 'local team' values of some Hemnes people and themore cosmopolitan, pan-Norwegian values of the professionals in the town.They point out the language/network link in Hemnes, expressing it as atendency for speakers who use most dialect to be members of closed networks,while standardized speakers have open personal networks.
This paper gives an account of the basis and testing of the hypothesis thatloyalty to vernacular norms correlates with level of integration into thelocalised network. It is structured as follows: (1) a brief account of the Belfastcommunities where the data was collected; (2) the concept of social networkand its application in empirical studies by a number of scholars; (3) theconstruction of the Network Strength Scale as a means of measuringintegration into the local community; (4) the statistical analyses carried out inmeasuring linguistic scores against NSS scores for forty-six speakers; (5) abrief discussion of the implications of these relationships for sociolinguistictheory.
THE COMMUNITIES
A fuller account of the social characteristics and socialisation patterns in thethree Belfast inner-city communities may be found elsewhere (Milroy 1976;Milroy and Milroy 1977). In brief, Ballymacarrett (East Belfast), theClonard and the Hammer (both West Belfast) are all self-contained commu-nities located in the heart of traditional working-class areas now sufferingseverely from social malaise (Boal 1978) and considered in Belfast to be'rough' areas. They are the kind of areas the British national press is fond ofdescribing as 'ghettos'. Their vernacular-speaking inhabitants correspondmore or less to the lower-working class group in Trudgill's (1974) Norwichsurvey. In Belfast, as in other cities, the more highly-skilled working-classfamilies have, on the whole, moved out to the suburbs, leaving the mostvulnerable and exploited members of the community concentrated in increas-ingly decaying and blighted areas of the inner city. We may consider ourinformants in this study to be victims of the process of 'pauperization'described by Pahl (1975: 167). Pahl refers to structural changes which resultin a tendency for the lower working class to become relatively poorer associety becomes more skilled and the services of the unskilled or semi-skilledworker are consequently less in demand. The communities we studied seemed
45
LESLEY MILROY AND SUE MARGRAIN
TABLE i. Scores for nine phonological variables
Index scores Percentages
Hannah McK 1.4 1.05 1.2 o o o 66.7 25.00 20.00Paula C. 2.4 2.63 2.5 1 58.34 70.48 100 47.83 50.00
1-3 are index scores; 4-9 represent percentages. A higher score indicates a relatively closeapproximation to vernacular norms (see Milroy & Milroy 1977b for details of the variables).
to be isolated from the mainstream of upwardly mobile Belfast society,3 inthat they maintained different, sometimes opposing, sets of values to thosepublicly acknowledged in the media and the educational system. Nor was itclear that they held in common with the rest of the Belfast community ashared set of linguistic norms (see Milroy & Milroy 1977a; Maclaran 1976).We may note that Trudgill in Norwich describes this group as isolated fromchanges which affect the rest of the speech community, revealing very muchless clear sociolinguistic patterning in their speech than higher-status socialgroups.
Using classic sociolinguistic methods of analysis, it is possible to demon-strate clear age and sex grading in the language of the Belfast speakers(Milroy & Milroy 1977b). Yet sometimes dramatic differences betweenspeakers of the same age, sex and social background are evident. We mayillustrate the extent and consistency of these differences prior to a systematicanalysis by referring to the contrast between Paula C. and Hannah McK. (seeTable 1).
Paula shows perfectly consistently a closer approximation to the vernacularthan Hannah; yet both are middle-aged women from the Clonard, married tounskilled workers. Neither seemed particularly dissatisfied with life in theClonard or ambitious of upward mobility - in fact, both expressed considera-ble satisfaction in the warmth and friendliness of the community." Thedifference in their language is consistent enough to invite some explanation -
[3] There is an intriguing parallel to this very underprivileged group in Latin American cities.Individuals there who are outside the normal industrial structure, in that they have no jobsecurity or union membership, and in that their sporadic employment typically is of little directrelevance to industrial production, are known as marginals. They may remain marginals forgenerations, without showing any sign of upward mobHity (L. A. Lomnitz, Networks andMarginality. Academic Press, 1977). Although it is, of course, dangerous to compare the classor economic structure of developed and underdeveloped countries, our informants had much incommon with the marginals; the main points were that they had insecure jobs with littlerelevance to industrial production and showed little sign of ever attaining security or mobilityby becoming employed in important jobs protected by powerful unions.
[4] The variable of local satisfaction is often found to be important in analysing behaviour inworking-class communities. Fried (1973) discusses its importance at some length.
46
VERNACULAR LANGUAGE LOYALTY AND SOCIAL NETWORK
indeed, intra-group differences are, in very many cases, consistent over alarge number of variables.
It is difficult to see how variation of this kind can in any way be explainedby correlating linguistic scores with external social factors. A complex socialclass index of very great delicacy could no doubt be constructed, taking intoaccount such factors as family size, quality of furniture, condition of house,and a great number of other possible factors. This did not seem eitherpracticable or reasonable. A much simpler approach, based on the structureof each individual's relationship with others in the community, was possible.
THE CONCEPT OF SOCIAL NETWORK
This concept has been developed to examine individual (mainly informal)relationships between people and so offers a set of procedures for looking atthe vague but important notion of 'integration into the community', discussedin the introductory section. Network analysis has also been found useful forexamining unstable social situations of the kind found in cities, wheremobility is the norm; this is because the procedure does not compel theanalyst to postulate corporate group boundaries. Further, although theconcept presents a set of procedures rather than a fully-fledged theory,several researchers have found that it has a powerful capacity to explainsocial behaviour, rather than simply to describe correlations between networktype and behaviour. It should be noted that, in general, urban sociolinguisticstudies tend to correlate linguistic and extra-linguistic variables, rather thanto use one set of variables to explain the other in any specific way. Since weshall be focussing ultimately on the extent to which an individual's personalnetwork structure may be said to explain her or his linguistic behaviour, it ishelpful at this stage to consider in some detail the use one scholar has made ofthe concept as an explanatory device.
Elizabeth Bott's (1957) study of twenty London families is now a classic ofthe anthropological literature. Initially she set out to describe patterns ofvariation in the way husband and wife shared household tasks in terms ofsocial class and neighbourhood (corporate group factors), but she was forcedto look for a more effective explanation. Applying the concept of socialnetwork, as developed by Barnes (1954), she found that clear separation ofeach spouse's area of responsibility and their degree of independence of eachother corresponded to the structure of their personal networks. Where thelevel of segregation was high and responsibility for tasks rigidly allocated(these conditions went together), each spouse tended to have contractedlong-standing relationships with people who also knew each other. Wherespouses were dependent on each other and did not allocate areas of responsi-bility as clearly, their personal networks were less 'dense'; that is, theircontacts did not normally know each other. Bott further commented that
47
LESLEY MILROY AND SUE MARGRAIN
where the networks were dense, role relationships were usually multiplex;that is, individuals interacted with each other in more than one capacity - aperson's neighbour might also be a kinsman and a fellow employee.
At first sight it is difficult to see why there should be a link between maritalsegregation and network structure, but Bott argues convincingly that networkstructure is the causal factor. Dense, multiplex network ties have, she argues,been contracted prior to marriage, and such a network forms in effect abounded group capable of imposing normative consensus on its members.Marriage partners are therefore kept relatively independent of each other andmore dependent on individuals in their own network. Absence of pressuresapplied by a dense multiplex network results in greater interdependencebetween spouses and a sharing of tasks and responsibilities. Thus, level ofmarital segregation is explained in terms of the capacity of a particular kindof network to act as a norm enforcement mechanism; some kinds of personalnetwork have a more powerful capacity to influence behaviour than others.As we shall see, it is possible to argue in a similar manner that the more denseand multiplex an individual's network, the greater is its capacity to impose onhim or her its own norms of linguistic behaviour. These norms may bedifferent from any institutionally acknowledged set of prestige norms.
Bott further pointed out the links between network type and social class;only in traditional working class areas, where there is little turnover ofpopulation and people work together in the same occupation, are extremelydense, multiplex networks likely to be found. The classic studies of working-class communities (e.g. Fried 1973; Young and Wilmott 1962; Dennis,Henriques and Slaughter 1956; Wiener 1976) have all confirmed severalrecurrent patterns. Relationships are multiplex; sex roles are clear and malesolidarity strong; there are many overlapping kinship links within the area;network density is high; and territorial loyalty is always strong. Frankenberg(1969) and Southall (1973) have used the concepts of network density andmultiplexity to characterise a number of different types of communityranging from Irish and Welsh mountain settlements, through traditionalworking class areas, to newly settled working- and middle-class surburbanestates.
Although important modifications have been made to her original analysis,and both terminology and quantification procedures have been considerablyrefined, a number of Bott's observations have become accepted by scholarsapplying the network concept. It is now agreed that density and multiplexityusually go together, that dense, multiplex networks act as norm-enforcementmechanisms (Mayer 1963; Kapferer 1969; Boissevain 1974; Cubitt 1973), andthat a variable closely related to network density is geographical mobility(Turner 1967). On the whole, networks in rural areas tend towards densityand multiplexity and in urban areas to uniplexity and spareness. Theexceptions to this generalisation are, of course, the old, established working-
48
VERNACULAR LANGUAGE LOYALTY AND SOCIAL NETWORK
class areas, such as those described by Young and Wilmott (1962), Hannerz(1974), Fried (1973), and Wiener (1976). In these areas, often described as'urban villages', personal networks tend to multiplexity and density.
All three Belfast areas studies are of this type, but only Ballymacarrettretains the characteristic traditional source of male employment. Men in theHammer and Clonard are forced to seek work away from their areas becauseof the recession of the linen industry on which they were once dependent.
We may further note that when people are forced to move from theirtraditional neighbourhoods, their networks become less dense and less multi-plex. One man from Bethnal Green (Young and Wilmott 1962), who wascompulsorily rehoused in a suburban housing estate, summed up the distastemany working-class people feel when their traditional neighbourhoods aredestroyed. When asked about contacts with his neighbours, he replied that hehad not grown up among them; they were different kinds of people and didnot mix. The Bethnal Green women suffered particularly by being cut offfrom their kin and their work. Frankenberg suggests than when networksbecome less dense, people are more anxious to achieve a higher social status;'the less the personal respect received in small group relationships, the greateris the striving for the kind of impersonal respect embodied in a statusjudgment' (1969: 232). Several studies point out a concern with upwardmobility and adequate education of children as characteristic of working-class people whose network structures have been disrupted.
One important modification to Bott's original view of network density as anorm-enforcement mechanism should be noted here. Cubitt's (1973) study ofthe networks of working- and middle-class Edinburgh families suggests thatdensity in key sectors or clusters of the network - that is, compartmentsassociated with specific fields of activity - is a more important means ofcompelling normative consensus than overall density. In practice, it isextremely hard to measure overall density in a network of several hundred (ormore) relationships; and where it is possible, Cubitt suggests that density isnearly always low. Specific clusters are isolated as being particularly impor-tant here and varying significantly in density from one personal network toanother, 'those of kinship, neighbourhood, work situation (both husband's andwife's) and voluntary association'. (1973: 81). In fact, the literature ontraditional working-class communities, including the relevant parts of Bott'swork, tends to support this view. In practice, most comment focusses on ties ofkinship, neighbourhood, work and friendship.
CONSTRUCTING THE NETWORK STRENGTH SCALE
We may infer from this extensive literature that density and multiplexity areexcellent indicators of the pressures a person is under to adopt the norms andvalues - including linguistic norms and values - of the 'local team'. It may
49
LESLEY MILROY AND SUE MARGRAIN
also be noted that several other structural and content characteristics of apersonal network may be good indicators of the same phenomenon. Forexample, degree of connection (number of contacts within a given time);centrality of position; intensity (affective value placed on relationships): allare apposite to any attempt to explain behaviour. (See Mitchell (1969) andBoissevain (1974) for a discussion of these terms.) However, most studiesutilising the network concept have in fact found that either density of one ormore of the clusters specified by Cubitt or level of multiplexity offerspowerful means of explaining various behaviours (e.g. side-taking in a fight(Kapferer 1973) or patterns of gift exchange (Trouwborst 1973)). To someextent these two subsume other, less easily measurable variables. For exam-ple, one of our informants set a low affective value on her relationships withher neighbours and appeared to reject 'local team' values. Devising a reliablemeasure for these attitudes would have been difficult and was in any eventunnecessary; the low level of multiplexity in her personal network ties formeda kind of objective correlative to her subjective attitudes. She seemed to avoidmultiplex ties with local people as far as possible in that she did not interactwith her neighbours on a friendly basis and avoided working with a cluster ofneighbourhood women who were employed as domestics in a local school. Herkin ties in the area were not strong.
Taking into account the significance of high multiplexity and densityscores as indicators of level of integration into the community, two criteriahave been considered in selecting the specific indicators to be used inconstructing the Network Strength Scale.
1. They must reflect the conditions which have repeatedly been foundimportant in predicting the extent to which normative pressures are appliedby the local community; it is specifically the capacity of some kinds ofnetwork to enforce consensus which interests us here.2. They must be recoverable from the data collected in Belfast, and easilyverifiable. (For this second reason, affective measures are unlikely to bereliable.) All informants were extensively questioned about kin, place ofwork, corporate and informal group membership, and territorial loyalties.Their behaviour was also closely observed over a period of about five weeks(in each area).
The implications of the second condition are important; if we accept it, wecannot use multiplexity and density scores directly. Both can, indeed, becomputed mathematically; density can be expressed as a proportion of actualrelationships within a personal network to possible relationships. Multiplexitycan be expressed as a proportion of multiplex relationships to all relevantrelationships. But these calculations clearly require a quantitative statementof the size of a total personal network which we are not in a position toprovide. For our purposes then, multiplexity and density will be expressed
50
VERNACULAR LANGUAGE LOYALTY AND SOCIAL NETWORK
indirectly by five indicators which are readily verifiable from the data, andreflect recurrent observations from the extensive literature discussed in theprevious section.
Each informant is assigned a score on a scale ranging from 0-5. One pointis assigned for each of the following conditions he or she fulfills:
1. Membership of a high density, territorially based cluster.2. Having substantial ties of kinship in the neighbourhood. (More than onehousehold, in addition to her or his own nuclear family).3. Working at the same place as at least two others from the same area.4. The same place of work as at least two others of the same sex from thearea.5. Voluntary association with work mates in leisure hours. This applies inpractice only when conditions three and four are satisfied.
Condition One is designed as an indicator of density, and to reflect Cubitt'sinsistence on the importance of density of specific clusters in norm enforce-ment. A cluster is defined as a portion of a personal network whererelationships are denser internally than externally. The Jets, Cobras andT-Birds described by Labov (1972b) form clusters; many of the young menwe studied belonged to similar clusters; some of the middle-aged womenbelonged to clusters of six or seven individuals who met frequently to drinktea, play cards and chat. Some individuals avoided association with any groupof this kind.
Conditions Two, Three, Four and Five are all indicators of multiplexity; ifthey are all satisfied, the proportion of ego's interactions which are withmembers of the local community is very high. Three and Four are intended toreflect the particular capacity of an area of homogeneous employment toencourage the development of dense, multiplex networks; Four also reflectsthe fact that polarisation of the sexes usually occurs when there is a largenumber of solidary relationships in a specific neighbourhood. The densest,most multiplex networks are in fact found in areas where men are employedin such occupations as mining, shipbuilding, or steelworking. In Ashton, forexample, Dennis et al. (1956) observed that many of the miners were both kinand neighbours. Male solidarity was strong, and the level of sex segregationhigh. They took their recreation together in pubs and working men's clubs,ensuring that a high proportion of any individual's interactions took placewithin an almost closed network. The shipyard men in Ballymacarrett behavein a similar way; and in fact multiplex ties of the kind found in the conditionsspecified above are usually contracted by men, who might therefore beexpected to score higher on the NSS. It should, however, be noted here thatboth the Hammer and the Clonard were areas of high male unemployment;consequently, women frequently scored as high as or higher than men.
51
LESLEY MILROY AND SUE MARGRAIN
The scale is capable of differentiating individuals quite sharply; scoresrange from zero for someone who fulfills none of the conditions (although azero score is rare) to 5 for several informants who fulfill them all. Suchindividuals must be considered extremely closely integrated into the commu-nity in the sense that their kin, work and friendship ties are all contractedwithin it; additionally, they have formed particularly close ties with acorporate or informal group in the neighbourhood. (A positive score is givenunder one for membership in either an informal group or a corporate groupbased in the area, such as the local football fans' club). Conditions One andTwo further reflect the defined territorial base associated with the kind ofnetwork structure which interests us. As we have noted in Bethnal Green andin the Hammer area of Belfast, geographical mobility has the capacity todestroy the structure of long established networks.
STATISTICAL ANALYSIS METHODS
The most important consideration in choosing methods of analysis was to findmeans of testing and using the NSS as an explanatory device to account forinterpersonal differences in linguistic variable scores. A further possibilitywas the use of the NSS as a tool of sociolinguistic analysis to look atdifferences in network structures and language in more detail in each areaand in age and sex subgroups in the areas. A third useful focus for analysis ofparticular interest to the sociolinguist is the investigation of similarities ordifferences in the distribution of the linguistic variables (LVs) themselves andwhether they differ according to area, sex, or age. It will be clear in the courseof this paper that the network data are more illuminating if the relationshipbetween language and these other important extra-linguistic variables istaken fully into account.
The statistical techniques used in the analysis are explained below, andfreely discussed throughout the paper as results are reported.
Correlation. Our basic hypothesis is that differences in NSS scores may beassociated with variations in linguistic variable scores, i.e. that increasingNSS scores are related to increasing linguistic variable scores. The statisticaltest which measures and gives a mathematical value to relationships of thiskind is correlation. Since one cannot assume that the LVs are distributedfairly equally (normally) around their means, a correlation test based on therank ordering of scores was used (the Spearman Rank Order Correlation).This test estimates how far the rank order of scores for each individual on onefactor (NSS) are similar to the rank order of scores on another (LV). Astatistic r is produced which reflects how closely the rank orders for eachfactor for all individuals match. The value of the correlation r is influenced bythe number of individuals in a sample tested. It is important to test how much
52
VERNACULAR LANGUAGE LOYALTY AND SOCIAL NETWORK
reliance can be placed on r in terms of whether or not there is indeed arelationship at any given level of r. The nearer r approaches i .o (a one-to-onerelationship between rankings) the greater the relationship and more certainone can be that the r is not a result of chance variation in the sample. Thesmaller the sample, the more stringent the test for significance againstchance. To test the value (significance) one can put on r, another statisticaltest (the / test) is carried out. If there is a probability that a particular r scoreis only likely to have occurred by chance 5% of the time, r is said to show asignificant relationship between variables. It is possible to determine bymeans of the t test and the use of statistical tables whether the r for any givensize of sample is significant - that is, whether a real and reliable relationshipexists. This means that the probability (p) of r occurring by chance is lessthan .05 (p < .05). A more significant result is a / score which indicates that rwould occur only 1% of the time by chance (p < .01). These two levels ofsignificance will be indicated against each result. If p > .05, r would haveoccurred more often than 5% of the time by chance, it could be concluded thatthe variables tested did not stand in a significant (real or reliable) relationshipto each other. If the t score is close to one which would give a significantresult, it is reasonable to discuss the results in terms of a tendency for the firstvariable to correlate with the second.
Analysis of variance. The correlation tests reported below examine therelationship between increasing linguistic variable scores and increasing NSSscores. This is a test of the usefulness of the NSS, involving as it does everypoint on the six-point scale. In cases where the correlation is not significantbut a marked tendency (or trend) is noted, it is possible to divide the NSSscores into high and low scoring groups (omitting the median score NSS = 3)and test for the significance of the difference between linguistic variablescores of high and low NSS scorers. Thus the value of the network conceptcan be assessed in terms of high and low scores rather than by using acontinuous scale. A statistical analysis which can do this is the analysis ofvariance. At the same time it can test separately for both the significance ofthe difference between the linguistic variable scores of various sub-groups(i.e. informants grouped by sex, age, and area in this study), and in relation tohigh and low NSS scores. Thus, analysis of variance and correlation arepowerful tools of sociolinguistic analysis; they can together show a quantita-tive relationship between linguistic and extra-linguistic variables, and theycan also indicate how extra-linguistic variables may be related to each otherin their capacity to influence linguistic performance.
The analysis of variance tests the significance of the difference betweenmeans of each group, taking account of the deviation of each score round themean. Thus it automatically incorporates a test for the homogeneity of groupswith respect to a particular variable. The same analysis can also measure the
53
LESLEY MILROY AND SUE MARGRAIN
extent to which variation between subgroups in respect of one variable isinfluenced by variation between subgroups in respect of another (interactionof variables). Consider, for example, the variables of age and network: if theeffect of age on a linguistic score is parallel in high and low NSS scoringgroups, it could be concluded that there was no interaction between thosevariables. If, on the other hand, linguistic scores are higher in the older groupsthan in the younger for low NSS scorers but are lower than the youngergroup's score for high NSS scorers, one would conclude that the variables ofnetwork and age interact with each other in influencing this particularlinguistic score. This is important if we want to assess which extra-linguisticfactor best explains the patterning of a linguistic variable; as we have seen,the sexes have characteristically different network structures. Clearly, it is ofinterest to be able to state here whether sex and network structure interactsignificantly in their effect on language.
The analysis of variance test gives a ratio statistic (F) for the degree ofinteraction, as it also does for differences between group means for allvariables. F is then tested for significance in the same way as r in thecorrelation tests, taking into account the number of people in each group.Chance probabilities of F are given as a measure of the reality of (a)differences between groups or (b) of interaction between extra-linguistic vari-ables.
The linguistic variables.5 The linguistic scores discussed in this paper areobtained from counts of the occurrences of the variables (a), (ai), (i), (th),(A1), (A2), («'), and («2) in the speech of the Belfast informants. The data forall variables is drawn from the same parts of the tape. Two styles weresampled for each speaker - an interview style where she or he is talking to thefield worker in response to direct questioning, and a spontaneous style,usually where he or she is talking to friends or family or occasionally to thefield worker (i.e. not responding directly to the field worker's elicitation).Thus, the scores represent samples from at least two different points in thetapes collected for each speaker (Milroy & Milroy 1977a).
The scores were computed using the now-classic methods described byLabov (1966). Where possible, the variables are treated as binaries and apercentage score is given; in fact most of the variables are scored aspercentages, with a high score indicating relative closeness to the vernacular.The vowel variables (a), (ai), and (1) were not treated as binaries, as it waspossible to score several points on a phonetic continuum with one end of the
[5] A full analysis of the distribution of each linguistic variable by age, sex and area appear inMilroy 1980. The results of the analysis are referred to at various points throughout thispaper.
54
VERNACULAR LANGUAGE LOYALTY AND SOCIAL NETWORK
continuum lying closest to vernacular norms and the other furthest away. Thescores referred to for these three variables are therefore index scores.
Where possible, the total number of tokens for each individual is between60 and 80. This was achieved for all variables except those with a limitedphonological or lexical distribution - (th) and (A2) in this study. The scoresfor (th) are based on only 16-20 tokens per speaker, those for (A2) slightlymore. The total number of tokens scores for (A2) was 1,500 (compared with856 for (th)). The phonetic realizations coded for each of the eight variablesare described briefly below.
1. (a) An extremely phonologically complex variable. Index scoresmeasure degree of retraction and backing to [a] and [0] in items such ashat, man, grass. Items with a following velar are excluded since backing isprevented in this environment. A five-point scale is used, ranging from zerofor [a] to 4 for [0]2. (ai) Index scores measure on a three point scale degree of fronting andraising of the first element of the diphthong in items, such as pipe, line,life. Scores range from o for [ai] to 2 for [ei]3. (1) Index scores measure on a three point scale degree of lowering andcentralisation to [i ~ X] in items such as hit, kill, tin. Scores range from 0for [1] to 2 for [« ~X]4. (th) Scores measure variable deletion of intervocalic [9] in a smalllexical set: e.g. mother, bother.5. (A1 ) Scores measure lip-rounded variant [5] in items such as hut, mud.6. (A2) Like (th) this variable has a restricted lexical distribution, butunlike (th), membership of the lexical class is not phonologically predict-able. It is a variable occurring in items such as would, pull, took (but notwood, wool, book) which alternate between [A] and [«] realisations. Thereis evidence that the membership of the class of items which can alternate inthis way has declined in Belfast over the last century (Maclaran 1976;Patterson i860). The figures refer to the occurrence of the [A] variant.7. (e1) The figures refer to a low vowel as opposed to a mid vowel in itemssuch as bet, peck, rent, else. The analysis is restricted to monosyllablesclosed by a voiceless stop, or by a voiceless obstruent preceded by a liquid ornasal.8. (e2) These scores measure the same low vowel in di- and polysyllables.It is necessary to treat these environments separately from those in which(«') occurs, as they have a different distribution phonologically and acrossthe community: this distribution is masked by the levelling effect ofconsidering (t1) and (e2) as a single sociolinguistic variable. (See Milroyand Milroy 1978 for a fuller discussion of the complexities of the /«/vowel).
55
LESLEY MILROY AND SUE MARGRAIN
TABLE i. Correlations between network score andlinguistic variable score for all subjects.
Variable
(a)(th)(A2)
<«')
r
0.5290.485o-3'70.2550.321
t
3.6923-591
2.142
1.7092.200
N
3744434444
level of significance
p < .01p < .01P < o sP < 05P<-°5
N refers to the number of subjects tested for a given variable.
STATISTICAL ANALYSIS — LANGUAGE AND NETWORK
The statistical analysis showed an overall positive and significant relationshipbetween the NSS and five of the eight linguistic variables studied ((a), (th),(A2), (e1), and (t2)). For the purposes of discussion these will be handledseparately from (ai), (1) and (A1) which did not show an overall significantrelationship but showed some significant relationships when subjects weredivided into subgroups. The correlation results will be presented first,followed by those from the analysis of variance. Discussion of the implicationsof the results will be deferred until all the statistical data have beenconsidered.
Several correlation tests were carried out for each linguistic variable. Allsubjects were tested together and then divided according to sex, age, area, andage by sex. Clearly the number of subjects is small if the total N (46 max.)6 isdivided by 3 or 4. It should be noted that the smaller the N, the higher thecorrelation must be before a significant relationship can be demonstrated.Although the statistic r may sometimes be similar for a small and a large N, itmay not be sufficient to indicate a real relationship for the smaller Nalthough it does so for the larger.
[6] Because our original analysis was not designed to focus on individuals, the number ofinformants varies a little depending on the linguistic variable we are studying. The low N for(a) and (th) reflects an early interest in direct comparison of Clonard and Ballymacarrettscores; we analysed only a few Hammer speakers because of the apparently chaotic sociolin-guistic patterning which we felt reflected the chaotic social conditions there. However, theapplication of the t test ensures that variation in N's does not reduce the reliability of theresults reported in this paper. As soon as we developed means of dealing with individual scores,we felt we could deal with the apparent absence of pattern in the Hammer and analysedHammer data as fully as the data from the other areas. In fact, many more than 46 speakerswere recorded and analysed; some, however, fell outside the age groups, and we could notexamine more than about 30 tokens for other speakers on some variables because of pressure oftime. All the speakers included in this analysis have been analysed in the manner reported insection 5 of this paper, where the number of tokens is specified.
56
VERNACULAR LANGUAGE LOYALTY AND SOCIAL NETWORK
TABLE 2. Correlations between network and linguistic scores calculatedseparately for male and female subjects
Variable
(a)
(th)
(A2)
(«')
(<!)
sex
MFMFMFMFMF
r
0.4850.683
0.4060-5390.4110.1710.2920.085
0.2760.210
t
2.2873-74'
'•9352-9321.9660-7771.3680.381
1.2830.963
N
'918
21
23
2322
22
22
22
22
level of significance
P< 05p < .01
P< 05p < .01
P<-°5P> °5P> -05P> 05
P> 05P> 05
The variables (a), (th), (*?), (e2), and (t2): correlations
The results in Table 1 show that there is in fact a real and reliable relationshipbetween a speaker's language and the structure of his or her social network.As scores on the network scale increase, so do linguistic scores. The relation-ship is strongest for the variables (a) and (th).
The results in Table 2 give further insight into the scores in Table 1. Thevariables (a) and (th) are shown to be as sensitive to network for both sexes asthey are overall. However, the level of significance is greater for women thanfor men.
Scores for (A2) indicate, in contrast with (a) and (th), a correlation withmen's NSS scores. Since the result for women is not significant, the overallsignificant result is dependent on the just significant r for men. Since neithersex shows a significant r between either (c1) or (e2) scores and NSS scores, itis now clear that the significant overall result (Table 1) for these LV's isattributable to a larger N. However, higher r's for men on both these LV'sindicate a trend towards a relationship with network. This trend is mostclearly absent from women's («') scores. In other words, women show notendency whatever to use (e1) as a symbol of community loyalty.
The most revealing fact to emerge from the Table 3 data is the strikinglyclose correlation between linguistic and network variables in Ballymacarrett.There are no significant results in either of the other areas. Thus, the overallcorrelations in Table 1 are the result of the high Ballymacarrett r. The onlyvariable in Table 3 which does not yield a significant result in this area is (A2).However, the Ballymacarrett r does show a clear tendency to increase withthe linguistic variables score; in fact the Ballymacarrett r for (A2) is greaterthan the r for all subjects. A significant result is not achieved here because the
57
LESLEY MILROY AND SUE MARGRAIN
TABLE 3. Correlations between NSS scores and LV scores calculatedseparately for three areas
TABLE 4. Correlations between NSS scores and LV scores calculatedseparately for 2 age groups 40-55 and 18-25
Variable
(a)
(th)
(A2)
(«')
4O-5518-25
4O-5518-25
40-5518-25
4O-5518-25
4O-5518-25
r
0.6230.474
0.3660-3520.3660.248
0.268O-4"30.2020.444
t
3-i882.223
1-7581.680
1.712
• • ' 4 5
1.2142.078
0.8972.268
N
18
'92222
2122
21
2321
23
level of significance
p < .01P < 0 5
P < 0 5p>.05
P> 05P > 0 5
p>.O5P < 0 5
p>.O5p>.O5
small size of the sample requires a more stringent t test. The very high r for(a) should be noted here: this is the highest r found in the entire investigation(0.930), representing an extremely close relationship (nearly a 1:1 correla-tion) between network and language scores.
The results in Table14 reveal that the variables (a), (th) and (A2) are moreclosely correlated with increasing NSS scores in the older age group than the
58
VERNACULAR LANGUAGE LOYALTY AND SOCIAL NETWORK
TABLE 5. Significant correlations between NSS scores and scores calculatedseparately for 2 age groups and both sexes
Variable
(a)(th)
(«')
sub-group
F40-55F40-55F18-25M40-55M18-25
r
•738•556.631
0.5860.658
t
2.1142.4422.2842.767
N
912
11
12
12
level of significance
P < 0 5P<-°5P < ° 5P < ° 5p < .01
younger: this may reflect either on interactions between network and agestructures, or on the varying values attached to specific phones by differentage groups. Together, (e1) and (t2) show a contrasting increase. We shouldnote that the (A2) r for the older age group approaches significance: it is infact the same as the r for (th). Since the N for this group is one less than theN for the group tested for (th), a more stringent t test means that the (A2) rdoes not quite meet the .05 level of significance.
Correlations for sub-groups divided according to sex and age (4 cells)
In these tests, few significant results were obtained, and only significantresults are presented below. We would consider them to be important,however, as an extremely close relationship is needed to achieve significancewhere the N is so small. Table 2 results (p. 57 above) showed that women'slinguistic scores correlated more closely than men's with network scores onthe variables (a) and (th) which in turn showed the most significant overallcorrelations of all the variables tested. Table 5 further reveals that it is theolder female group with whom this strong network/language relationship isparticularly associated. This confirms the results for this variable reported inboth Table 2 and Table 3, where the older age group is revealed as more likelyto show a correlation than the younger.
The variables (e1) and («2), on the other hand, are seen in Table 5 to beparticularly linked with male network structures - («2) shows a highly signifi-cant correlation despite the low N with young men's NSS scores, while («') issignificant for the older group at the .05 level.
It should be noted that, in general, the results of these tests pointconvincingly to a strong link between sociolinguistic structure and networkstructure - the central concern of this paper. However, many further lines ofenquiry emerge when subjects are divided into groups according to age, sexand area and tested for a relationship between LV scores and NSS scores.The information obtained from analysis of variance is relevant to furtherdiscussion of the data reported above. When all the statistical results are
59
LESLEY MILROY AND SUE MARGRAIN
considered together, we shall be in a better position to assess the manner inwhich sex, age, geographical location and personal network structure worktogether in influencing linguistic performance.
The variables (a), (th), (A2), (('), and (t2): analysis of variance.
In this subsection we discuss the results on the analysis of variance testswhich measure the extent to which variation between sub-groups on onevariable is influenced by variation between sub-groups on another. Ourinterest is in assessing whether the variables of age, sex, and area interactsignificantly with network (see p. 53 above) in their effect on linguistic scores.For the purpose of the analysis, NSS scores were divided into high and lowscoring groups, and both NSS and LV means were computed for allsub-groups. Two-way analyses of variance for unequal groups were carriedout, measuring the interaction between sex and network, area and network,and age and network in producing variable linguistic scores. Only where thereare significant interactions are results presented here. Other results arediscussed briefly without detailed reference to the statistical tables whichappear in Milroy 1980.
(i) Sex and network. None of the LV scores showed an interaction betweensex and network: the effect of high and low network scores on language wasthe same for both sexes. We may conclude that both sexes use these LV's in aparallel fashion as network markers. Additionally, there were significant orhighly significant differences between means for the two sexes on four of thevariables - (a), (th), (e1), and (e2) - indicating that they function simulta-neously as sex markers. Thus, although the sexes use these LV's as networkmarkers in a parallel way, their second function as sex markers results in theirbeing used at different levels, with the men scoring higher (see Milroy &Milroy 1978).
(ii) Area and network. Only one LV - (a) - showed any significant inter-action between network and area (F = 7.2402; p < .01). As we would expectfrom the correlation results, there is a significant difference between (a)scores for high and low NSS scorers. This difference varies by area as follows:the (a) scores are higher in the high NSS scoring group than in the lowscoring group in Ballymacarrett (means: 3.3475; 1.9700). A similar patternappears in the Clonard with a smaller difference between means (2.5767;2.2100). However, in the Hammer the pattern is reversed with the mean (a)score slightly higher for the low NSS scoring group (2.4800; 2.6800).Therefore, (a) seems to function most strongly as a network marker inBallymacarrett, less clearly in the Clonard, and cannot be said to have thisfunction at all in the Hammer. These analysis of variance results confirm thecorrelation results in linking (a) as a network marker firmly to Ballymacar-
60
VERNACULAR LANGUAGE LOYALTY AND SOCIAL NETWORK
rett. Interestingly, the means for (a) do not vary significantly according toarea, and so it would not be possible to link this LV to Ballymacarrett simplyby comparing mean scores for all subjects from each area. The analysis ofvariance reveals why this should be so when the correlation tests have alreadyshown a clear link between (a) and Ballymacarrett; the interaction betweennetwork and area, in controlling LV scores, levels out mean area differences.
(Hi) Age and network. No significant age by network interactions wererevealed for any of these linguistic variables; however, a tendency for oldersubjects to have a larger gap between high and low NSS scores for (e') shouldbe noted, as there is almost no difference for the younger group. This confirmsthe correlation results for (e1) - only in the older group is there a significantrelationship between this variable and network structure. Thus, (e1) seemsclearly to function as a mark of community loyalty only for the older group.
The variables (A' ) , (ai), and (i): correlation and analysis of variance.
Since the main interest of these variables is that social meaning seems to beattached to them by limited sub-groups only, results of both tests arepresented together. Only significant relationships and differences arediscussed; none of these LV's shows an overall correlation with NSS scores.
The (A1 ) scores show a significant relationship to NSS scores for the olderage group only: r = 0.474, t = 2.349, N = 21, p < .05 (but see Milroy 1980 fora discussion of the changing social functions of this variable).
(ai) scores show a significant relationship to NSS scores in Ballymacarrettonly: r = .557, / = 2.322, N = 14, p < .05. In contrast with (a), the/-for (ai)is only just significant in this area, and there is no tendency for (ai) to berelated to network in the other areas. The analysis of variance tests revealno significant differences or interactions.(l) scores show a significant relationship to NSS scores only in theHammer: r = 0.528, / = 2.327, N = 16, p < .05. The analysis of variancetests confirm this result and provide further information. The probabilitylevel for the area ratio is below the .05 and only just above the .01 level,revealing a significant difference between area means. The difference liesbetween the Hammer means (2.2000) and both the Clonard and Ballyma-carrett means together (1.8333; 2.0104). Thus, (1) seems to be a sociallymeaningful variable associated particularly with the Hammer.
These results show that even in a single speech community - and it wouldbe plausible to describe Belfast vernacular speakers in that way - there aremany differences in the manner in which speakers take hold of 'pieces' of thelanguage and use them as symbols of community loyalty. Some variables -(a) and (th) - function more clearly as network markers for women than formen; some function in this way in one community but not in others - (ai) and
61
LESLEY MILROY AND SUE MARGRAIN
(i) -while others- (e12) and (A1) -appear to be linked to age structure intheir capacity to indicate vernacular loyalty. Sometimes a simple comparisonof mean LV scores for sub-groups cannot reveal these relationships; thespecial function of (a) in Ballymacarrett can be shown only by correlationtests and analysis of variance.
We have also noted in passing that there are differences in the LV meansfor the sexes on a number of variables, always, as might be expected, withmen scoring higher. Consequently, although this analysis has revealed a greatdeal about sociolinguistic structure at the micro level, often confirming thefindings of earlier work (Labov 1972a, 1972b), it has raised a number offurther questions. The most obvious and pressing of these concerns the kind ofnetwork structure associated with different sexes, areas and age groups.
Can it be said that men score significantly higher on most vernacularvariables because of their higher NSS scores? Is the Ballymacarrett networkstructure different from that in the other areas? For it is in Ballymacarrettthat the strongest relationships between language and network are to befound.
To answer some of these questions, the final section of the analysisexamines the distribution of NSS scores across areas, sexes and age groups.
STATISTICAL ANALYSIS: ANALYSIS OF VARIANCE SHOWINGDISTRIBUTION OF NSS SCORES ACROSS AREA, SEX, AND AGE SUBGROUPS
This analysis tests for any significant difference in the distribution of NSSscores between areas, sex and age groups, and also reveals any significantinteractions - i.e. whether any of the sub-groups NSS scores vary acrosssub-groups of the other groups.
The analysis (a three-way analysis of variance for unequal groups) showsthat since many of the chance probability levels are below .01, there are manysignificant differences and interactions between the NSS scores sampled ineach of the sub-groups. These differences would not necessarily be found in alarger controlled random sampling within the total population of Ballymacar-rett, the Clonard and the Hammer. We can say no more than that they applyto the three partial networks studied, which are well established within theareas. Although, as we have seen, network studies have the capacity toexamine sociolinguistic structure in great depth, they will lack generality inthis way until some means is found of determining the personal networkcharacteristics of a larger number of randomly sampled informants. Mean-time, variations in NSS distribution must be taken into consideration beforeconclusions can be drawn from the correlation and analysis of variance testscarried out on each linguistic variable.
62
VERNACULAR LANGUAGE LOYALTY AND SOCIAL NETWORK
Sex differences
The NSS analysis of variance (summarised in Table 8) indicates a significantdifference between male and female NSS's (F = 9.0964; p < .01). This wasconfirmed at .05 level in a Mann Whitney U Non-Parametric Test. The menscore significantly higher on the NSS than the women on a scale ranging fromzero to five (means = 2.9444; 2.0248). The sex by age interaction is notsignificant; i.e. the sex difference is of the same order for both age groups.However, there is a significant sex by area interaction: the means for sex andarea sub-groups indicate little or no difference between the sexes for two ofthe areas (Hammer and Clonard respectively) but a substantial difference ofover 2.5 on the NSS between men and women in Ballymacarrett (3.9583;1-3333)- Ballymacarrett women's NSS scores are substantially lower thanany of the sub-groups, and the same areas NSS scores for men are substan-tially higher than in any other sub-group.
The area by sex by age interaction is also significant, so that we canconclude that differences for sub-groups within each of these groups varywith each of the other groups: in other words, area, sex and age interact incontrolling NSS scores. If we are considering the variable of sex, this meansthat male and female NSS scores vary between area samples with each agegroup. The three-way mean table shows that the young Ballymacarrettwomen have the lowest NSS scores, and yet the young Clonard women havethe highest overall scores and are the only female group that have substan-tially higher NSS scores than males in the same age group. We can now seethat the similarity of male and female overall scores in the Clonard is due tothe interaction effect for age in the Clonard; the older group shows that theoverall trend for males is to score higher on the NSS than females (2.5000;1.0000) while in the younger Clonard age group the females have signifi-cantly higher NSS scores (3.0000; 4.7500). The largest difference betweenmale and female NSS scores occurs by way of contrast in the youngBallymacarrett sample (.6667; 4.2500) while in the Hammer the sex differ-ence is small for both age groups.
Area. The p > .05 for area indicates not quite significant differencesbetween areas. We should, however, note that the Hammer has a substan-tially lower mean NSS than the other areas, which are more nearly compara-ble. The means and interaction between area and sex have already beenconsidered. The results also show a significant interaction between area andage.
The higher NSS scores for the younger age groups for Clonard andHammer are reversed for Ballymacarrett, where the older age group has thehigher NSS. This difference is small, however, compared to the reverse
63
LESLEY MILROY AND SUE MARGRAIN
difference for Hammer and Clonard. Further, both young male and femalegroups in all areas have higher NSS scores than their older counterparts (seebelow) except for the women in Ballymacarrett, where the older women havehigher NSS scores.
We should note in a general way that areal differences in network structureseem to show up when significant interactions of variables are considered andare not revealed simply by comparison of area NSS means.
Age. As has already been noted, the younger group scores significantlyhigher on the NSS overall than does the older group. The level and differencebetween old and young scorer's is similar to the difference between the sexes(1.9028; 3.0694). The difference between the age groups is greater for womenthan for men, but not enough to produce a significant sex by age interaction.
It is tempting to relate some of these sex, age, and area differences andinteractions in the NSS scores to different social conditions in the communi-ties (see L. Milroy 1976) and also Boissevain (1974) for a general account ofhow many social variables may influence network structure). Only in Bally-macarrett are traditional sex roles retained in the form familiar fromdescriptions in the literature on working class communities. The men arelocally employed in a traditional and homogeneous form of employment (theshipyard) and contract solidary relationships associated with their work. Thewomen are employed more diffusely, have fewer solidary relationships asso-ciated with work, but may contract multiplex relationships with kin andneighbours. The Clonard area, on the other hand, was experiencing severemale unemployment at the time of the interviews. (Both the Clonard and theHammer had in the past been dependent on the now-receding linen indus-try).
In the Clonard, the young women emerged as the only group who workedtogether and spent their leisure time together, contracting the kind of solidaryrelationships usually associated with working-class men. The Hammer areasuffered similar unemployment, but was principally notable for the geograph-ical mobility of most of its inhabitants: as a consequence of urban re-development, many had been moved to houses several miles from theHammer, and although much of their social life centred there, they hadsuffered a severe disruption of all the important sectors of their personalnetworks (Wiener 1976). The regular sex/network relationships found inBallymacarrett, where there are big differences between male (high) andfemale (low) NSS scores, seem characteristic of a traditional working-classsociety. We can say with assurance that this sex/network equivalence (withmen scoring high and women scoring low) co-occurs over several LV's with ahigher r between network and language than it is possible to demonstrate inareas without a sex/network equivalance; there, only a trend is indicated.Thus, we may say that network and sex conspire with each other to some
64
VERNACULAR LANGUAGE LOYALTY AND SOCIAL NETWORK
extent in producing variable linguistic scores. The direct effect of thissex/network equivalence pattern on language is rather more problematic. Aswe have seen, age, area and network interaction effects are complex and makea blunt statement about sex and network relations to linguistic scores verydifficult. However, if we consider the variables (a) and (th) (which show thehighest /-'s to network in the entire investigation) we see here at least that asex/network equivalence seems to be associated with sharper sex grading inlanguage than is found in the Hammer, where there is less difference bothbetween men's and women's linguistic scores and also between their NSSscores. Where there is a sex by age by area interaction, as in the Clonard, withyoung women scoring as high as men on the NSS, the sharp patterns of sexdifferentiation which occur in LV scores for Ballymacarrett seem likewise tobe blurred or confused. If we examine the distribution of (a) by sex, age andarea (see Milroy 1980), we find that it corresponds closely to the NSSdistribution, with the same interaction effect observable in the Clonard. It isthis which blurs the sex grading in the linguistic scores, and we can say withassurance (of this important LV at least) that it is network structure ratherthan sex which seems to control linguistic variable scores.
CONCLUSION
We can argue convincingly at this point that it is possible to devise a measureof a speaker's 'degree of integration' into her or his immediate community,and using statistical techniques, to show that language is related to thatelusive but important variable. The concept of social network, as developed byBarnes, Mitchell, Boissevain and others, has provided a starting point for theconstruction of a quantitative measure of community integration - theNetwork Strength Scale - which is capable of statistical treatment. Individu-als can be given a rating on the NSS which may then be correlated with theirlinguistic scores. Clearly significant relationships emerged for eight linguisticvariables.7 Further correlation tests carried out on data from speakers dividedaccording to age, sex, and area (but still considered individually) succeeded inisolating those sections of the population who showed the strongest relation-ship between NSS scores and a particular linguistic variable. Ballymacarrettwas revealed as the area where in general the closest relationships were foundbetween linguistic structure and network structure; but otherwise differentlinguistic variables could be shown to have a network significance for
[7] The linguistic and network scores for each individual are given in Milroy 1980. Scores for afurther variable (o) (the vowel in items like shop, hot is variably unrounded before voicelessstops) are also included. However, although this variable will undoubtedly be interesting whenhigher social groups are studied, its distribution here makes it unsuitable for statisticalanalysis. There are too many speakers using only the unrounded form.
65
LESLEY MILROY AND SUE MARGRAIN
different groups. The variables (a) and (th) correlated with network moreclosely for women than for men; (A2) more closely for men than for women;(e1), («2), and (A1), on the other hand, were associated with different agegroups. Thus we find, not unexpectedly, that sociolinguistic structure iswoven in a complex way throughout the community, with different phonologi-cal elements being associated with various social groups.
The analysis of variance showed in considerable detail the distribution ofboth linguistic and network scores through the community and isolatedsignificant differences in the scores of some groups of subjects. For example,(a) showed a network by area interaction, which meant that high NSS scorersdid not use it at a comparable level in all areas. We were also able to show anetwork by sex by area interaction in the Clonard, which is reflected byunexpectedly high NSS scores for the young women there. This interactioncorresponds in fact exactly to the distributional pattern for (a), suggestingthat network loyalty, rather than sex, controls linguistic scores for thisvariable. On the whole, however, these results suggest that many factors worktogether in controlling linguistic scores, and that we should be cautious ofattributing too much importance to any single extra-linguistic variable.
We noted in the final section of the analysis that network structure variedsignificantly according to area. The main point was that Ballymacarrettshowed the biggest difference between high and low NSS scorers, with themen on the whole scoring high and the women scoring low. This network/sexequivalence pattern was not clearly observable in the other areas; and wesuggested that it was this pattern which was responsible for producing theclear correlation between language and network - and so between languageand sex to some extent - observable in Ballymacarrett.
The implications of this point are very far-reaching. It may well be thatchanges in social structure, resulting in the break-up of close-knit networks(which are commonplace in modern cities - the Hammer is very typical inthis respect), produce a breakdown of sex- and network-linked vernacularnorms. We are referring here to linguistic norms; but we have already noted(Frankenberg 1969) that other behavioural norms change as network struc-ture changes. This process was carefully documented in Bethnal Green, andlinguistic norms are unlikely to be exempted from it; if we accept the generalthesis that a dense, multiplex network structure supports intact vernacularnorms, we may consider changes in network structure to be responsible forsome linguistic changes. This may or may not involve a movement towards aprestige variety of the language, although it will involve a change in thevernacular: we have noted that (A1 ), (e1), and (e2) are all linked with age andnetwork structures and are very probably changing. The variants used by theyounger group, however, are not particularly near any prestige standard. Weshould note in the case of (A' ) that the movement seems to be away from therounding of / A / in words such as cup, hut, rub. This rounding is in fact anIrish rural stereotype and the younger group may be seen as moving away
66
VERNACULAR LANGUAGE LOYALTY AND SOCIAL NETWORK
from rural speech as they continue to form their own norms, rather thanmoving towards any specific prestige model.8
Less speculatively, however, we can say that the breakup of the localHammer network seems to have had the linguistic consequences of blurringsex-grading in language. It would be difficult to identify vernacular norms bya study of the Hammer alone, although this could be accomplished inBallymacarrett.
The network concept also gives us a good deal of insight into the manner inwhich alternative sets of sociolinguistic norms are maintained. We know thatinstitutional prestige norms are maintained through public speakers, theeducational system and the media. We also know that equally powerfulvernacular norms exist - this has been demonstrated most convincingly byLabov in Harlem and by Trudgill in Norwich. Taking into account thenetwork studies carried out by a completely different group of scholars, wenote that the function of dense, multiplex networks as norm-enforcementmechanisms is now widely accepted. We would suggest, therefore, that inshowing this close correlation between vernacular usage and network, wehave revealed the characteristic rural and working-class network structure tobe an important mechanism for the maintenance of vernacular norms. Itseems plausible to suggest that speakers become more susceptible to influencefrom the standard as their network structures become less dense and multi-plex, probably because their personal networks no longer have the power toexert counter-institutional pressures on their behaviour.
This thesis (which we advance cautiously for the moment) fits well withsociolinguistic fact. A less dense, more uniplex network structure is associatedwith the urban middle classes, and all the urban studies in the UK and UShave shown a movement away from the vernacular in these social groups.Perhaps the sharp manner in which Labov's lower middle class avoids thevernacular is linked to a conscious attempt to escape from the grip of thenetworks characteristic of the social group immediately below them. Wefound that some of our less vernacular working-class speakers consciouslyavoided too much local interaction: people are generally quite conscious ofnetwork pressures. Women too appear consistently to approximate less closelyto the vernacular than men; again their network structures (as we have found)are less inclined to multiplexity and density than men's are. As we have seen
[8] We would suggest that the norm of rounding the vowel observable in the older group was(and is in the Ulster countryside) maintained by rural networks (the older group are firstgeneration city dwellers). The younger urban group stigmatized this rural stereotype (seeLabov 1972a: 299) which could no longer be maintained because the networks of the originalmigrants had been disrupted. The newly formed urban networks in turn provide mechanismsfor the maintenance of emerging vernacular norms. The manner of their emergence is thesubject of another study: rural/urban vernacular differences are discussed in Milroy andMilroy (1977b) and also elsewhere in this volume. Certainly the stigmatization of rural formstogether with the internal 'economy' of the vowel system seem to be important in determiningthe form an urban vernacular will take.
67
LESLEY MILROY AND SUE MARGRAIN
with the young Clonard women, linguistic behaviour may not follow theexpected female pattern if their network structure does not do so.
Network structure also varies with age: our analysis reveals significantlyhigher NSS scores for the younger age group. Again, urban linguistic studieshave repeatedly looked for their most extreme examples of vernacular speechin younger people. Thus, it would appear that a dense, multiplex networkstructure is often associated with strongly vernacular speakers well outsideworking class Belfast. We would suggest that this happens because thisparticular network structure can function powerfully to maintain vernacularnorms.
Closer examination of some of the linguistic variables provides furtherinsight into the effect of social network on linguistic behaviour. It is extremelydifficult to be categorical here, as we have seen that many LV's are associatedin a complex way simultaneously with different age, sex and area groups.However, we may consider the variables (a) and (th) which show thestrongest overall relationship to network structure (p < .01). We also notethat they both function strongly overall as sex markers with men scoring verysignificantly higher than women (but see p. 60 above). However, if weexamine the correlation data, we find that women have a stronger relation-ship between their network structures and these variables than men. Whatthis seems to mean is that the men, even to some extent the low NSS scorers,use a high level of these vernacular variables (although there is still aprobability level of p < .05 for the men's r). However, there is a much closer'f i t ' - p < .01-between women's network structure and their language.Thus, speakers who use a high level of a vernacular variable do not necessarilyshow the closest correlation with network. Ballymacarrett, which consistentlyshows a close language/network relationship, also has some of the lowestscorers in the entire investigation. The Hammer, on the other hand shows aninsignificant language network relationship; but the highest scores for some ofthe vernacular variables are found there.
We would conclude by suggesting that a network analysis of this kind couldbe replicated in other working-class communities. The results of statisticalanalysis show that the five indicators used in the NSS scale are reliableindicators of network structure (otherwise it would have been impossibleconsistently to demonstrate so many highly significant relationships.9
[9] Much more remains to be done on refining the NSS as an analytic tool. For example, itshould be possible to work out which of the five indicators is the most powerful in predictinglinguistic scores: it may be that we could show an even sharper differentation between high andlow network scores. It may also be possible to include questions based on the NSS in alinguistic survey to test the wider validity of the concept. The most serious problem with theprocedure is the difficulty of applying it outside working class areas. We know thatmiddle-class networks are usually differently structured; it may be that the concept is notuseful in studying the speech of socially and geographically mobile individuals.
68
VERNACULAR LANGUAGE LOYALTY AND SOCIAL NETWORK
Furthermore, the network studies discussed in this paper suggest that thekind of network structure we have described here, and is most clearlyobservable in Ballymacarrett, is \n fact generally characteristic of vernacularspeakers in large cities. One scholar (Lewis 1973) has pointed out that thiskind of network structure has been reported as characteristic of the urbanpoor in Africa, the Americas and Europe. He suggests that it is universalbecause its basis is economic; the maintenance of strong solidary relationshipsis necessary for survival. It should certainly be possible to test out theseresults by replicating the study in other speech communities; an approachbased on the network patterns of the individual seems likely to contribute toour knowledge of how speakers use language to express various socialidentities. Network studies also seem capable of casting light on the processesof vernacular change and vernacular maintenance.
REFERENCES
Barnes, J. A. (1954). Class and committees in a Norwegian island parish. Human Relations 7.(1).
Bell, C. & H. Newby (1974). Readings in sociology of community. London: Cassell.Bickcrton, D. (1975). Dynamics of a Creole system. Cambridge: Cambridge University Press.Bloch, B. (1948). A set of postulates for phonemic analysis. Language 24. 3-46.Blom, J. P. & J. Gumperz (1972). Social meaning in linguistic structures: Code-switching in
Norway. In Gumperz & Hymes (eds.), 407-434.Boal, F. W., P. Doherty, & D. G. Pringle (1978). Social problems in the Belfast urban area.
Occasional Paper 12, Department of Geography, Queen Mary College, London.Boissevain, J. (1974). Friends of friends: Networks, manipulators and coalitions. London:
Blackwell.Boissevain, J. & J. C. Mitchell (eds.) (1973). Network analysis: Studies in human interaction.
The Hague: Mouton.Bott, E. (1971). Family and social network (rev. ed). London: Tavistock.Butterworth, E. & D. Weir (eds.) (1976). The sociology of modern Britain (rev. ed). London:
Fontana.Cubitt, T. (1973). Network density among urban families. In Boissevain & Mitchell (eds.),
67-82.Dennis, N., M. Henriques & C. Slaughter (1957). Coal is our life. London: Eyre and
Spottiswood.Frankenberg, R. (1969). Communities in Britain. Harmondsworth: Penguin.Fried, M. (1973). The world of the urban working class. Cambridge, Mass.: Harvard University
Press.Giles, H. & P. F. Powesland (1975). Speech style and social evaluation. New York and London:
Academic Press.Gumperz, J. & D. Hymes (1972). Directions in sociolinguistics. New York: Holt Rinehart and
Winston.Gumperz, J. (1967a). Social network and language shift. Working Paper 46, Language Behavior
Research Laboratory, Berkeley: University of California.(1976b). The sociolinguistic significance of conversational code-switching. Working
Paper 46, Language Behavior Research Laboratory, Berkeley: University of California.Trudgill, P. (ed.) (1978). Sociolinguistic patterns in British English. London: Arnold.Hannerz, U. (1974). Black ghetto culture and community. In Bell and Newby (eds.), 149-174.Hockett, C. F. (1958). A course in modern linguistics. New York: MacMillan.Kapfere, B. (1969). Norms and the manipulation and relationships in a work context. In Mitchell
(ed.), 181-244.
69
LESLEY MILROY AND SUE MARGRAIN
Labov, W. (1966). The social stratification of English in New York City. Washington, D.C.:Center for Applied Linguistics.
(1972a). Sociolinguisticpatterns. Philadelphia: University of Pennsylvania Press.(1972b). Language in the inner city. Philadelphia: University of Pennsylvania Press.
Le Page, R. B. (1968). Problems of description in multilingual communities. Transactions of thePhilological Society, 189-212.
Lewis, O. (1973). Some perspectives on urbanisation with special reference to Mexico City. InSouthall (ed.), 123-138.
Littlejohn, J. (1976). Local class structure. In Butterworth and Weir (eds.), 356-362.Maclaran, R. (1976). The variable ( ): A relic form with social correlates. Belfast Working
Papers 1, 45-68.Mayer, P. (1963). Townsmen or tribesmen: Conservatism and the process of urbanisation in a
South African city. Cape Town: Oxford University Press.Milroy, L. (1976). Investigating linguistic variation in three Belfast working class communities.
In Proceedings of the Third Annual Conference. Belfast: Sociological Association of Ireland.(1980). Language and social networks. Oxford: Blackwell.& J. Milroy (1977a). Speech and context in an urban setting. Belfast Working Papers 1.
(•)•Milroy, J. & L. Milroy (19776). Speech community and language variety in Belfast. Report to
the'SSRC.(1978). Belfast: Change and variation in an urban vernacular. In Trudgill (ed.), 19—36.
Mitchell, J. C. (ed.) (1969). Social networks in urban situations. Manchester: ManchesterUniversity Press.
(1973)- Networks, norms, and institutions. In Boissevain & Mitchell (eds.) (1973).Network analysis: Studies in human interaction. The Hague: Mouton. 15-35.
Pahl, R. E. (1975). Whosecity? London: Penguin.Patterson, D. (i860). Provincialisms of Belfast.Russell, J. (1977). Networks and sociolinguistic variation in an African urban setting. Mimeo,
University of York.Southall, A. (1973). The density of role relationships as a universal index of urbanisation. In
Southall (ed.) Urban anthropology. London: Oxford University Press. 71-106.Trouwborst, A. (1973). Two types of partial network in Burundi. In Boissevain & Mitchell (eds.)
Network analysis. The Hague: Mouton. 111-25.Trudgill, P. (1974). The social differentiation of English in Norwich. Cambridge: Cambridge
University Press.Turner, C. (1967). Conjugal roles and social networks. Human Relations 20. 121-30.Wiener, R. (1976). The rape and plunder of the Shankill. Belfast: Notaems.Young, M. & Wilmott, P. (1962). Family and kinship in East London. London: Penguin.
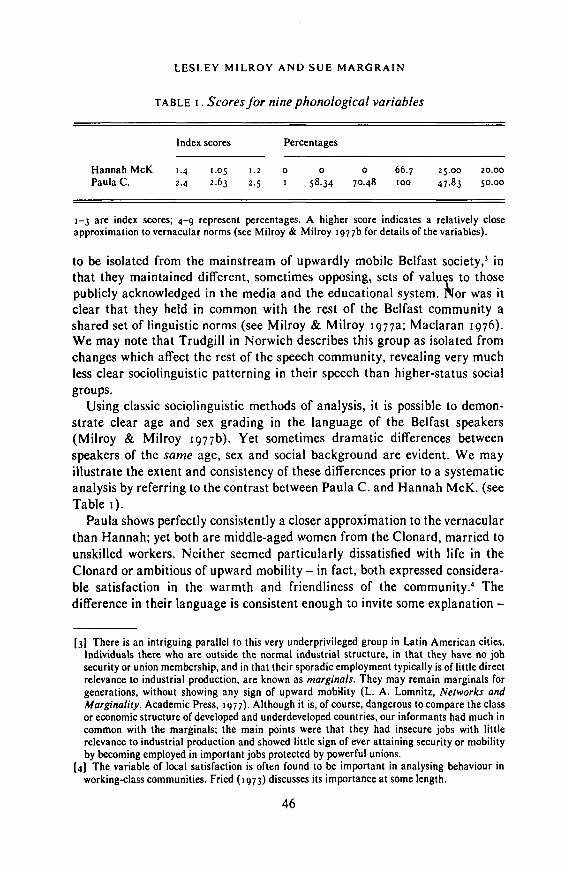
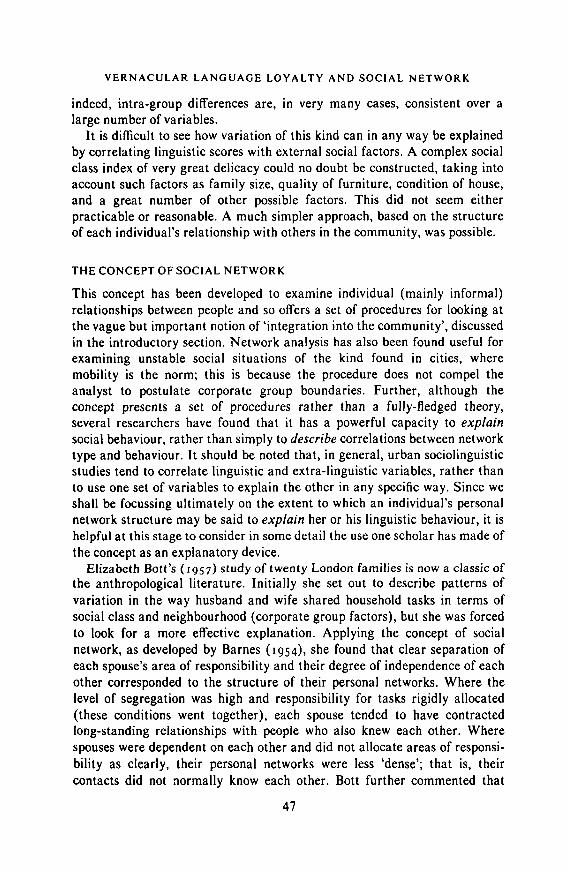
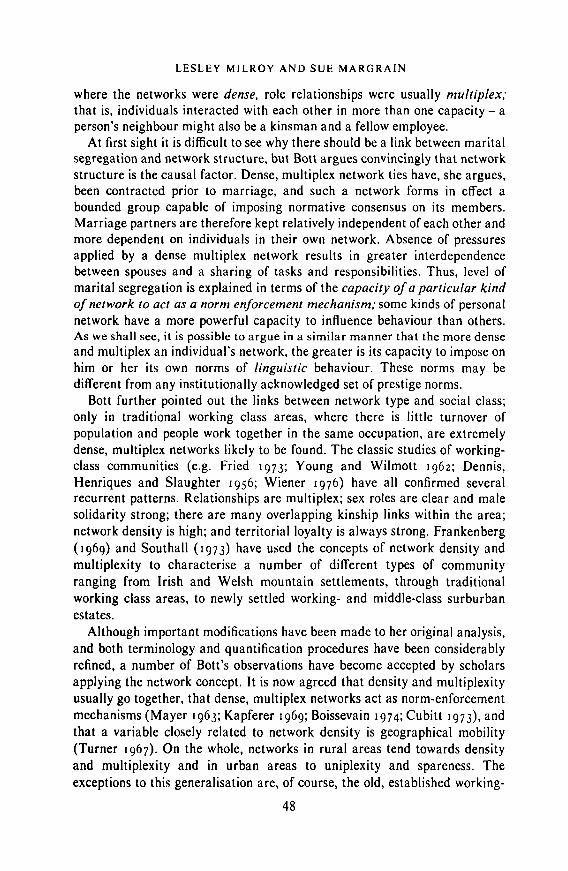
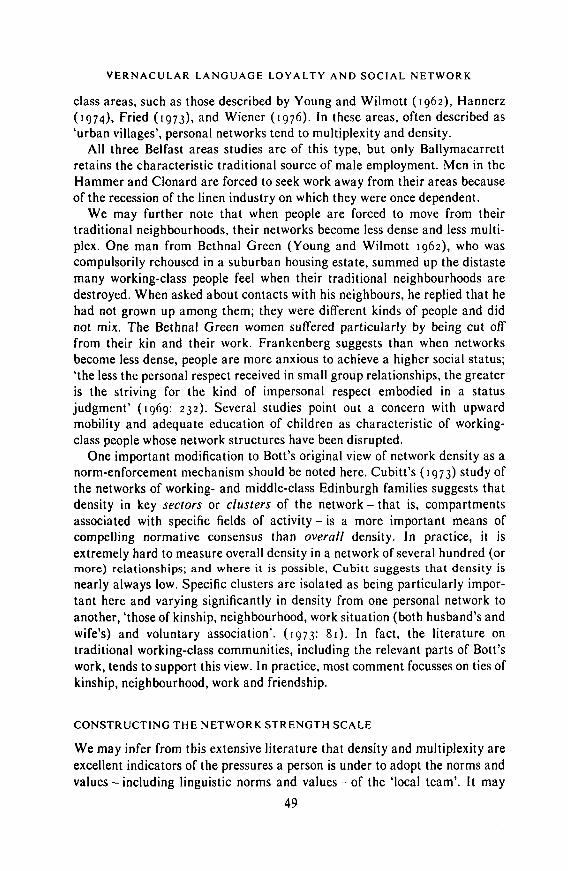
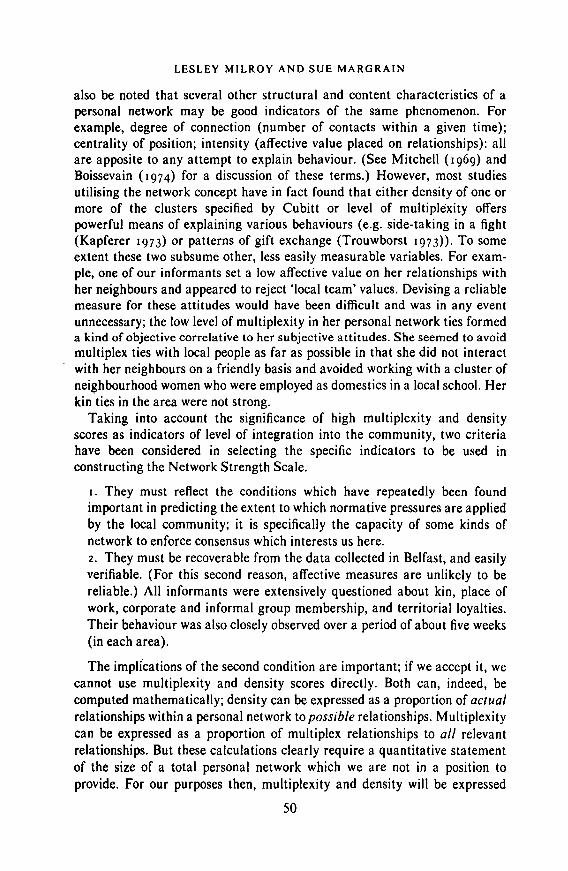
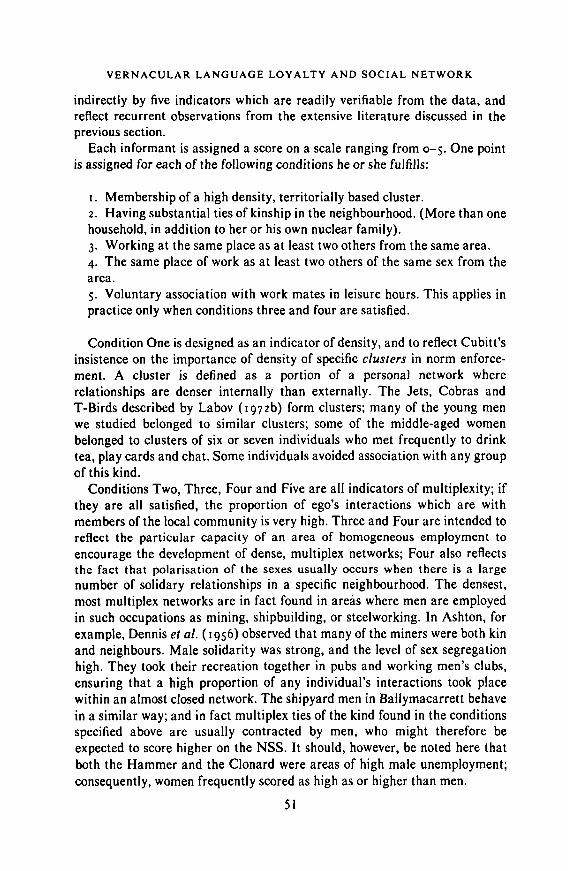
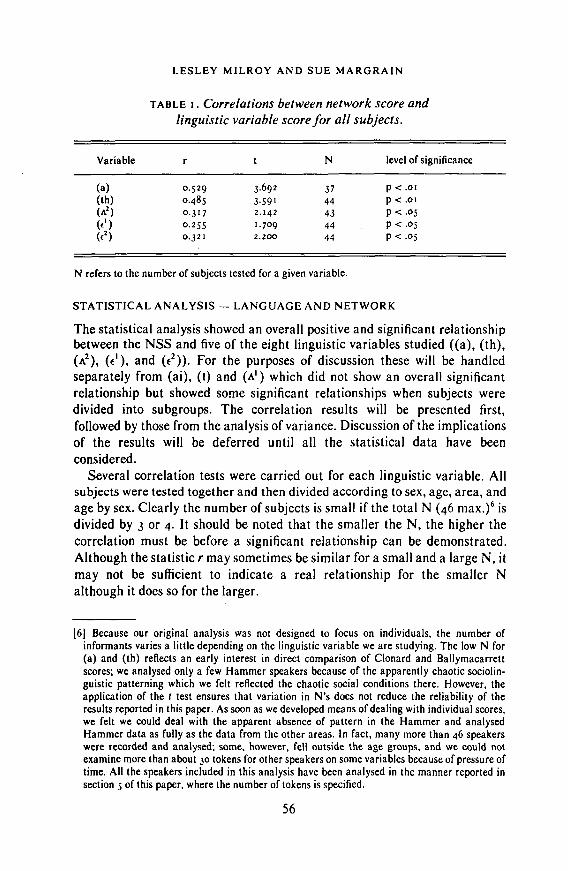
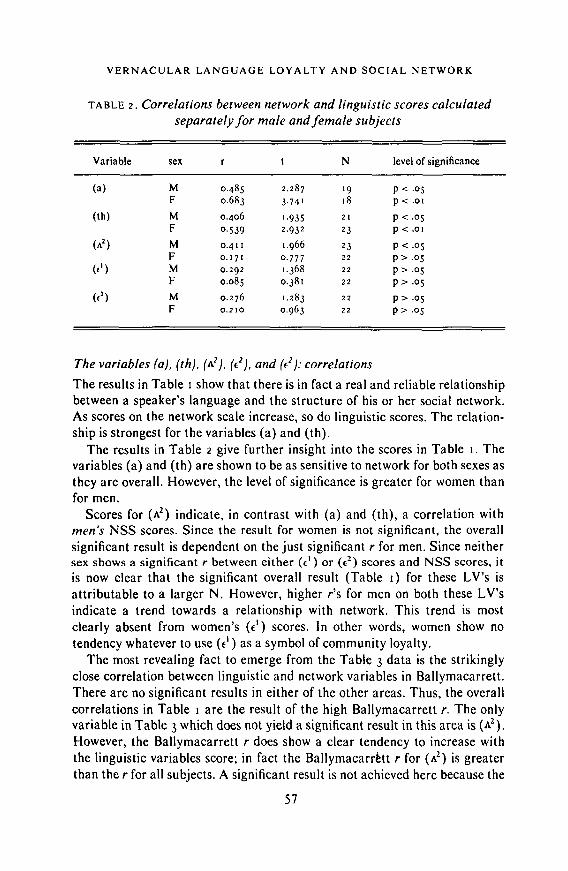
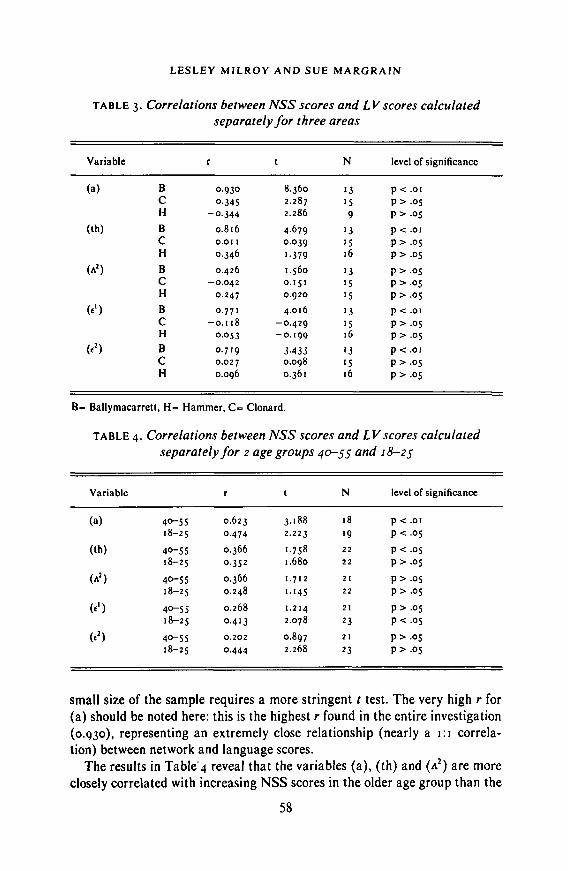
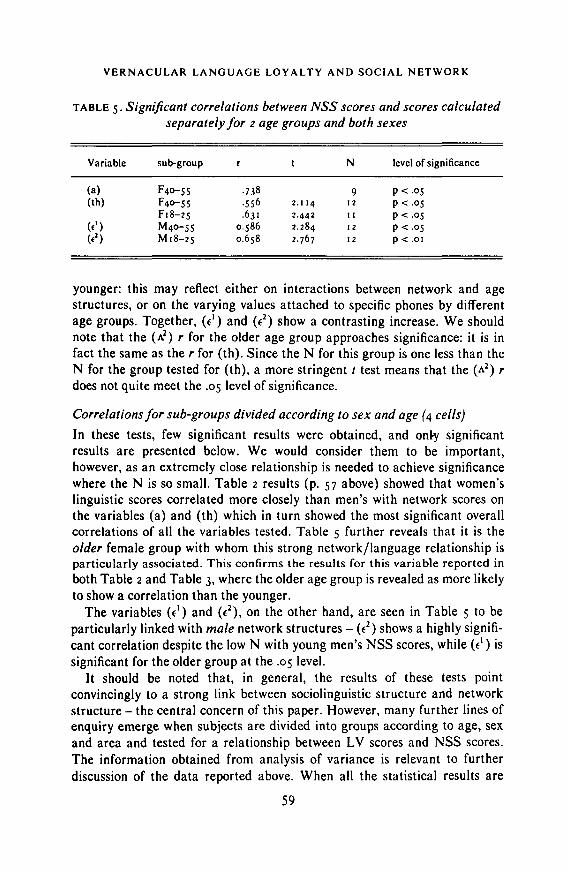
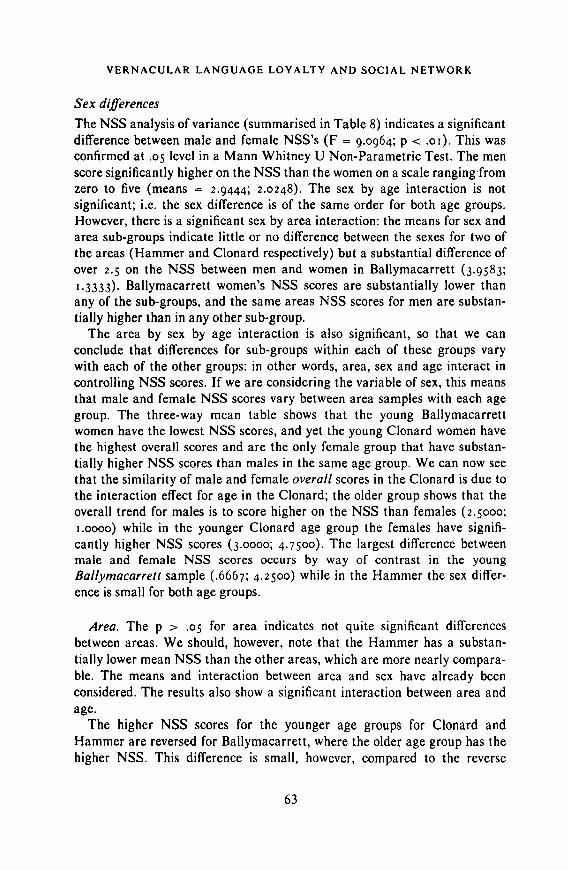
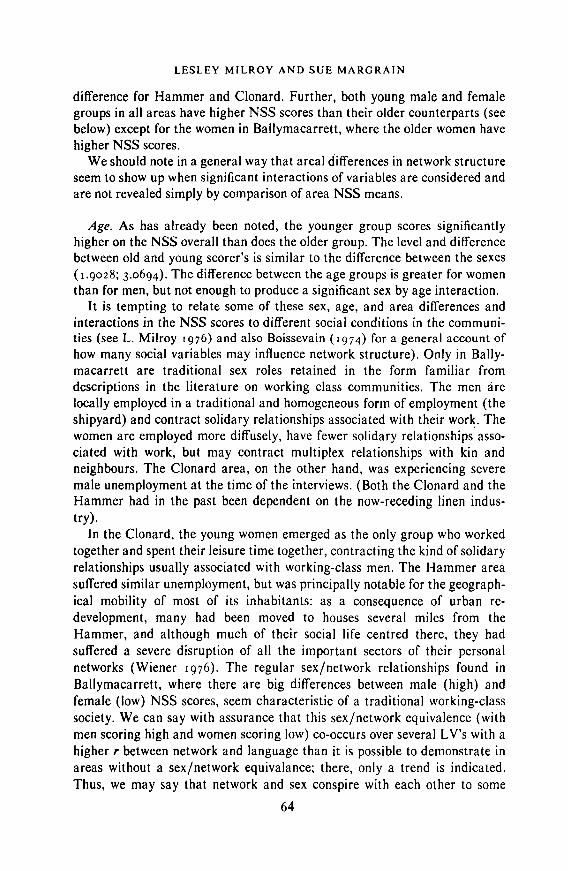
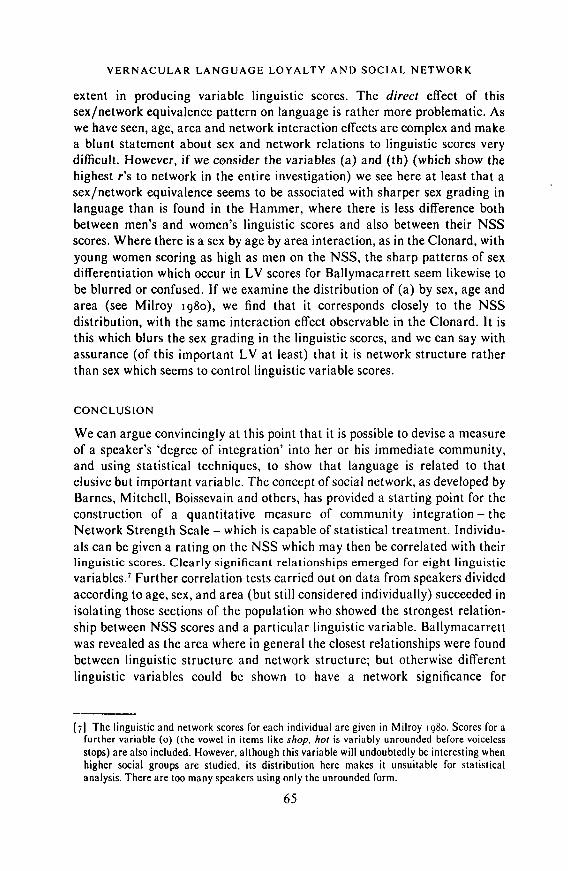
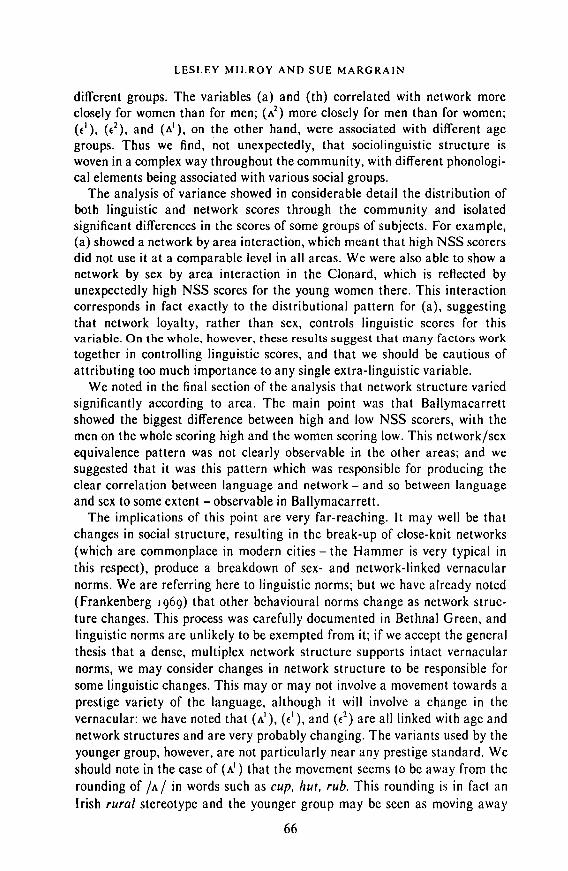


![[Lesley Milroy and Pieter Muysken] One Speaker, Two Languages](https://static.documents.pub/doc/80x56/56d6be8d1a28ab3016929a79/lesley-milroy-and-pieter-muysken-one-speaker-two-languages.jpg)


