D5.1 Methodology for the planning of decentralised biowaste management 2018-03-26 Version 2 689229 This project has received funding from the European Union’s Horizon 2020 research and innovation program under grant agreement No 689229.
Transcript
D5.1
Methodology for the planning of decentralised biowaste management
2018-03-26 Version 2 689229
This project has received funding from the European Union’s Horizon 2020 research and innovation program under grant agreement No 689229.
D.5.1. Methodology for the planning of decentralised biowaste management 2
A Decentralised Management Scheme for Innovative Valorisation of Urban Biowaste
D5.1 - Methodology for the planning of decentralised biowaste management
Grant Agreement N° 6689229
Acronym DECISIVE
Full Title A Decentralised Management Scheme for Innovative Valorisation of Urban Biowaste
Work Package (WP) 5
Document Type Report
Document Title D5.1 - Methodology for the planning of decentralised biowaste management
Dissemination Level (marked with an «X» in the column to the far right)
CO Confidential, only for partners of the Consortium (including the Commission’s Services)
PU Public X
PP Restricted to other programme participants (including the Commission Services)
RE Restricted to a group specified by the Consortium (including the Commission Services)
DOCUMENT HISTORY
Version Date Editor Modification
Draft 01 15/09/2017 Veronica Martinez Sanchez
Initial version of D5.1 to get partners’ input
Draft 02 19/12/2017 Veronica Martinez Sanchez
Milestone 11 – First Draft of methodological procedures that will be delivered in D5.1
Draft 03 07/02/2017 Veronica Martinez Sanchez
For last feedback from contributors
Draft 04 16/02/2017 Veronica Martinez Sanchez
For approval by reviewing Team leaders
Release 01 23/02/2018 Veronica Martinez Sanchez
First release for approval by coordinator
Submitted 28/02/2017 Submitted to the European Commission
Distributed Distributed to the Team Leaders after final approval by the Coordinator
This project has received funding from the European Union’s Horizon 2020 research and innovation program under grant agreement No 689229.
D.5.1. Methodology for the planning of decentralised biowaste management 3
D.5.1. Methodology for the planning of decentralised biowaste management 4
PREFACE
The present document is meant to describe the methodology for the planning of decentralised biowaste management behind the Decision Support Tool of DECISIVE. The methodology includes preliminary learnings of the DECISIVE demonstration sites reported in Deliverable 6.1, some terminology from Deliverable 3.5 as well as the preliminary work that will be later published in Deliverables 3.1, 3.3, 3.6, 3.7, 3.8 and 3.9. Please, note that this report is not supposed to be the user-manual of such tool. The latter will be in Deliverable 5.3.The application of the methodology in different cases studies (the two demonstrations sites of the project and a set of theoretical sites) will be included in Deliverable 6.4.
D.5.1. Methodology for the planning of decentralised biowaste management 5
5. Working Flow ....................................................................................................................................... 22
5.1 Definition of the Study Zone ....................................................................................................... 23
D.5.1. Methodology for the planning of decentralised biowaste management 6
D.5.1. Methodology for the planning of decentralised biowaste management 7
ABBREVIATIONS AND ACRONYMS
AD Anaerobic Digestion
BNERI Biowaste Net Energy Recovery Index
BNERI Biowaste Net Material Recovery Index
BP Background Process
CAPEX Capital Expenditures
CI Characterised Impacts
CF Characterisation Factor
CHP Combined Heat and Power
D Deliverable
DST Decision Support Tool
GHG Greenhouse Gas
GIS Geographic Information System
LCA Life Cycle Assessment
LCC Life Cycle Costing
mAD Micro Anaerobic Digestion
MRF Material Recovery Facility
MSW Municipal Solid Waste
NA Network Analysis
NRI Net recovery index
OPEX Operational Expenditures
OSM OpenStreetMap
SSF Solid State Fermentation
TII Transport intensity index
VFA Volitale Fatty Acids
W_Input Waste Input
WFD Waste Framework Directive
WP Work Package
D.5.1. Methodology for the planning of decentralised biowaste management 8
Executive Summary
The present document aims at developing and describing the methodology for the planning of decentralised biowaste management behind the Decision Support Tool of the DECISIVE project. The target users of the Decisition Support Tool (DST) will be competent authorities, consulting firms and waste operators. The main aim of the DST is providing a first assessment, based on the data available, of decentralised systems of valorisation of municipal biowaste in comparison with other treatment options in a specific study zone in urban areas. In addition, the secondary objective of the DST is estimating the possible location of the DECISIVE facilities (micro-anaerobic digestion and solid state fermentation) in the specific study zone, if appropriate data is available.
To perform comparative assessments of different biowaste management systems, all the options compared should provide the same service. In the DST, all the scenarios (technological pathways to handle the biowaste) compared within a study will manage the annual biowaste generated within the study zone by the selected biowaste generators (e.g. households, restaurants, etc). The DST will take into account the impacts associated with all the stages of the biowaste management system as well as the production of the resources consumed (e.g. electricity, fuel, machinery, etc.) within the system and the avoided productions of the goods (material and energy) substituted by the outputs generated in the biowaste management system (bio-based products and energy), such as mineral fertilizers and fossil energy.
The overall geographical scope of the tool is Europe but each case study will have its specific geographical scope that will depend on the competence level of the user of the tool (e.g. waste authorities can have competences at a local, regional or national level, while a waste operator will have only competence in its working area). Although the tool does not have a temporal scope, each case study assessed with the tool will have it. The temporal scope of each case study will be linked to the year of reference of the data used in the modelling. The performance of the different biowaste management systems will be assessed using a set of indicators (assessment criteria) classified into five parts: 1) network analysis, 2) environmental assessment, 3) economic assessment, 4) social assessment and 5) regulatory and legislative assessment.
The conceptual model of the DST (and consequently of the method behind the tool) includes:
The database that describes the different types of datasets included in the tool and their relations to each other,
The working flow that describes the different steps to be taken by the user to carry out the assessment,
The assessment algorithm that includes the main calculations that will be done by the tool to estimate the assessment criteria.
The database is divided into three parts:
Background Process Database: the background processes are external processes (for the biowaste management system) producing materials, resources and energy that are consumed in biowaste management systems or substituted by the recovered products, such as energy and fertilizer products.
Waste Database: it includes key chemical properties of the different biowaste sub-fractions (plant-derived food waste, animal-derived food waste, green waste and woody waste) and macro-impurities. The latter are non-biowaste fractions (such a paper, plastic and metals) that are discarded in a wrong way into the biowaste bin, such as paper, plastic, metals, etc.
Waste Processes Database: it includes processes that represent specific waste facilities or activities of the biowaste management. All the waste processes (excluding generation waste processes) will be defined per tonne (metric ton) of input waste (in wet weight) and their definition includes the following information: type of facility and annual capacity, type of waste handled, distribution ratios of the input waste into the different outputs of the process, materials and energy consumed in the process, labour and space used in the process, direct emissions and capital goods used in the process. Each waste process will include links to the background processes producing energy, materials and resources consumed in it. There are two main types of waste processes. The first one originates from the collection chain database Deliverable 3.5, and the second one from the waste treatment inventories (Deliverable 3.1). The collection chain database
D.5.1. Methodology for the planning of decentralised biowaste management 9
(Section 4.4.1) includes all the activities before the biowaste reaches the first waste treatment facility. The waste treatment database (Section 4.4.2) includes all the activities after collection.
The working flow of the DST tool includes five steps:
Definition of the Study Zone where the user defines the main information to characterise the study zone of the project, i.e. the area in which the user wants to assess different biowaste management options,
Scenario Definition in which the user of the DST defines the biowaste management system to be assessed, i.e. biowaste technological pathway from generation to final disposal going through collection and material and energy recovery processes,
Spatial Inventory and Analysis includes four main parts (geo-localisation of biowaste sources, geo-localisation of existing waste facilities, geo-localisation of potential new DECISIVE facilities, and estimation of collection distances),
Mass Flow Calculation
Assessment in which the results, i.e. the values of the assessment criteria for the specific scenario in the defined study zone, are calculated by the tool.
While the initial step, “Definition of the Study Zone”, is common to all the scenarios being compared in a project, the rest of the steps from “Scenario Definition” to the “Assessment” are done individually for each scenario included in a case study.
The DST estimates the results of the assessment (output of the “Assessment” step) for a specific biowaste management scenario (output of the second working flow step) in a specific study zone (output of the “Definition of the Study Zone” step) by applying different “assessment algorithms” that are described in Section 6 and taking into account the output of the “Spatial Inventory and Analysis” step. The basic idea behind the calculations carried out by the tool is that all the waste processes in the databases are described per tonne input (wet weight). These intensive inventories (per tonne input) are used to calculate the intensive results of the assessment for each waste process (per tonne input waste) involved in the scenario. Then, the DST combines the mass flows (output of the “Mass Flow Calculation” step) and the intensive results of each waste process involved in the scenario to estimate the results of the assessment of the scenario for a specific study zone. This is a first version of the methodology behind the tool that will be applied to the two demonstration sites of the DECISIVE project (in Catalonia and in Lyon), as well as in a set of theoretical sites in order to test its applicability. After such application, it is possible that the methodology will be upgraded based on the learning lessons adquired through such application as well as the development of other deliverables.
D.5.1. Methodology for the planning of decentralised biowaste management 10
1. Introduction
The DECISIVE project aims at increasing the recovery of energy, nutrients and materials embedded in the biowaste generated in cities. For that to happen, the project proposes two holistic changes in the current waste management in European cities. Firstly, moving from a linear production-consumption-disposal flow towards a circular one in which organic matter and nutrients are fed back into their agricultural soil in the form of high quality bio-based products by minimizing the presence of micro-pollutants. Secondly, by moving from large centralised production/recovery units towards smaller decentralised ones, more flexible and adaptable to local needs contributing to more resilient and lower environmental footprint urban areas.
To achieve the above mentioned goals, the project will develop: 1) a novel, eco-designed and marketable technology-package including a micro-scale anaerobic digestion treatment process (mAD), a solid-state fermentation (SSF) process to produce valuable bio-based products such as bio-pesticides and bio-fertilisers from the digestate, as well as a Stirling Engine to produce electricity and heat from biogas, 2) a Decision Support Tool (DST) for planning and reporting of decentralised systems for specific urban areas, 3) communication and training material to inform and engage urban biowaste generators (households and commercial activities) in the concept of the project and 4) two demonstration sites where the new technologies of the project (micro-AD and SSF) as well as the methods and tools developed during the project will be implemented and tested; one in Lyon (France) and another in Catalonia (Spain).
The purpose of the present deliverable is to develop and describe the methodology behind the DST. The DST will allow an informed discussion among stakeholders to support the selection of the most appropriate solution or combination of solutions for the management of the biowaste. The DST takes into account data on a biowaste management system (generation, collection, treatment and disposal) in a certain location with specific conditions (input data), and assesses its sustainability (output data). The methodology includes not only the technological pathways developed under DECISIVE, i.e. mAD + SSF + Stirling engine, but also other decentralised systems, such as home composting, and centralised treatments (e.g. centralised AD and composting plants). This broader scope increases the usability of the method behind the DST, without relying only on DECISIVE technologies that are not yet on the market.
The DST includes learnings reported in different deliverables of the DECISIVE project. Firstly, it considers a set of sustainability indicators, such as the climate change, energy and material recovery, and economic costs that are a simplified version of the indicators that will be reported in Deliverables 3.1, 3.2, 3.3, 7.3 and 7.4. Secondly, it includes technical and organisational aspects of the different stages of the biowaste management based on the learnings reported in Deliverables 4.1, 4.2, 3.5 and 6.1 and future deliverables 4.2, 3.6, 3.7 and 6.2. Thirdly, it uses a simplified version of the network analysis that will be reported in Deliverable 3.1 and the geographical dispersion of the biowaste generation and management based on the method reported in Deliverable 3.3.
The target users of the DST will be competent authorities, consulting firms and waste operators. The DST will take form as a web based tool, which will be easy to use and open to registered users at no cost. The DST will require input data and will display the results in a clear, synthetic format, exportable into a portable format, such as pdf or excel. Overall, the DST should be as simple as possible and as comprehensive as necessary to satisfy the needs of the three types of users and the required format as a web-tool. In addition, the input data required from the user (and not available a priori in the tool) should be easily available for the different types of users.
The privacy of the data added by the DST users will be guaranteed. The intellectual property of the DST will be agreed on between the DECISIVE partners in a later stage of the project as well as the features that will be completely disclosed at no cost and which may be offered for purchase, based on an initial proposal from ENT, as leader of the tool workpackage.
D.5.1. Methodology for the planning of decentralised biowaste management 11
2. Goal & Scope of the Decision Support Tool
2.1 Goal of the DST
The main aim of the DST is assessing decentralised systems of valorisation of municipal biowaste in comparison with other treatment options in a specific study zone in urban areas. The latter is defined as the area where the assessment is wanted to be carried out. It can have different geographical scales, from a country to a small piece of a municipality. The tool has also as a secondary objective, if appropriate data are available, to estimate the possible location of DECISIVE facilities (mAD+SSF) in the specific study zone.
It should be mentioned, however, that the DST is intended to provide a first assessment based on the data available. Simple assumptions and simplifications of the real biowaste management system were necessary when developing the method and will be also necessary when considering the uncertainties of the results.
2.2 Functional Unit of the DST
To perform comparative assessments of different biowaste management systems, all the options compared should provide the same service; such service is called “functional unit”, common terminology used in Life Cycle Assessment (LCA) and is defined as the service or function the system being investigated delivers to the user of the service (JRC; 2011).
In the DST, the functional unit is the management of the annual biowaste generated within the study zone by the selected biowaste generators (e.g. households, restaurants, etc). The functional unit is common to all the scenarios (technological pathways to handle the biowaste) compared within a study.
2.3 System boundaries of the DST
The DST takes into account the impacts associated with all the stages of the biowaste management system as well as the production of the resources consumed (e.g. electricity, fuel, machinery, etc.) within the system and the avoided productions of the goods (material and energy) substituted by the outputs generated in the biowaste management system (bio-based products and energy), such as mineral fertilizers (Figure 1).
The impacts are classified as direct and indirect. Direct impacts are produced in the biowaste management itself (e.g. due to an emission loss of methane in the AD or combustion emissions in the biogas utilitzation). The indirect impacts occur upstream, i.e. during the production of the goods that are either consumed in the biowaste management system or substituted by the outputs of the biowaste management system (i.e. bio-based products and energy). The latter are called background processes and represent all the external processes used to produce goods that are consumed in biowaste management systems or substituted by the outputs of the biowaste management system, such as energy and fertilizer products. Even if the background processes are beyond the system boundaries of waste management system (grey box of Figure 1), their products are consumed within the study zone and their productions can be affected by the introduction of new biowaste facilities (DECISIVE systems and others) and therefore, as shown in Figure 1, are included in the system boundaries of the tool.
The system boundaries include only the biowaste management and exclude the management of the non-biowaste waste generated in the study zone (e.g. paper, packaging, etc.). However, it includes the management of the macro-impurities that are thrown away together with the source separated biowaste.
D.5.1. Methodology for the planning of decentralised biowaste management 12
Figure 1: System boundary included in the tool.
In Figure 1 the box Generation of biowaste represents the stage in which the biowaste is produced as a result of food preparation, food consumption, pruning, grass cutting, etc. This stage corresponds to the “Biowaste level” in Deliverable 3.5
1 on collection systems. Point 4 of Article 3 of the Waste Framework
Directive (WFD) defines Biowaste as the biodegradable garden and park waste, food and kitchen waste from households, restaurants, catering and retail premises and comparable waste from food processing plants. Biowaste does not include waste paper or cardboard (e.g. newspapers) neither waste wood (e.g. pieces of furniture), unlike the definition of “biodegradable waste” provided in Article 2 of the Landfill Directive
5. At this stage different biowaste sub-fractions are generated:
Food waste: According to FUSIONS (2014), Food waste is any food, and inedible parts of food, removed from the food supply chain to be recovered or disposed of (including composting, crops ploughed in/not harvested, anaerobic digestion, bio-energy production, co-generation, incineration, disposal to sewer, landfill or discarding to sea). Food waste can be classified according to different properties, e.g. edible and inedible parts (e.g. bones, banana peels), mainly animal-derived food waste (eggs, dairy products, meat, fish, etc.) and mainly plant-derived food waste (vegetables, bakery products, rice, pasta, etc.) as well as food waste from meal preparation (e.g. peels from vegetables) and food waste from leftovers (e.g. what people leave in their plates in a restaurant). DECISIVE deals only with the food waste generated in the last stages of the food supply chain, i.e. retail, food preparation and consumption. This corresponds to municipal biowaste or similar.
Garden waste: The biowaste definition of the WFD includes biodegradable garden waste that is generated in gardens, parks and other locations (cemeteries, road sides, dykes etc.). Garden waste is also called landscaping waste in Germany when generated in locations different to gardens such as cemeteries and road sites. Garden waste can be further divided into green waste, a part that is easily digestible by anaerobic microorganisms and woody waste, which is the difficult to digest part (woody waste) under anaerobic conditions. Green waste (also named light garden waste): In the scope of DECISIVE, this term refers
exclusively to the soft, compactable and the most easily digestible part of the garden waste. It includes grass cuttings, leaves, flowers, herbs, etc. It should be noted that in some countries and publications, e.g. ACR+ (2016), the term “green waste” also includes “woody waste”.
Woody waste: The ligno-cellulosic (wood-rich) part of the garden waste which includes twigs, branches, etc. and is rigid, bulky and difficult to digest by anaerobic microorganisms without a previous special pre-treatment. Due to this, DECISIVE deals only with the green waste part of the garden waste.
D.5.1. Methodology for the planning of decentralised biowaste management 13
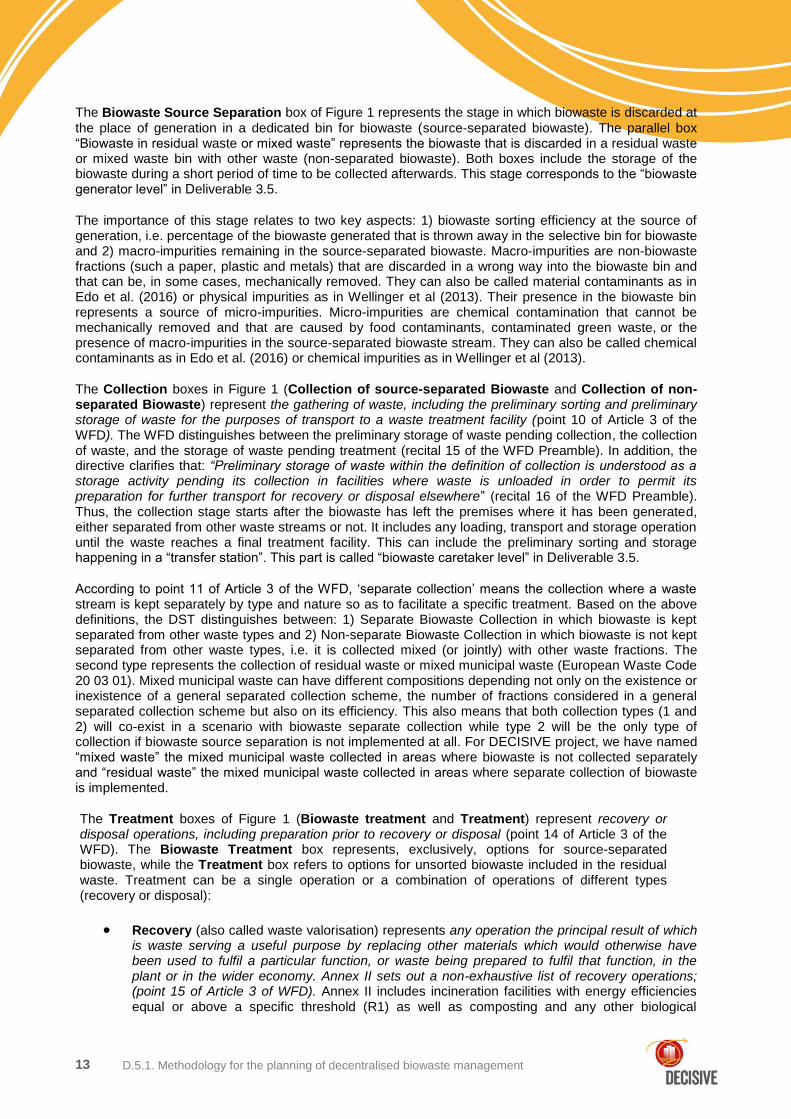
The Biowaste Source Separation box of Figure 1 represents the stage in which biowaste is discarded at
the place of generation in a dedicated bin for biowaste (source-separated biowaste). The parallel box “Biowaste in residual waste or mixed waste” represents the biowaste that is discarded in a residual waste or mixed waste bin with other waste (non-separated biowaste). Both boxes include the storage of the biowaste during a short period of time to be collected afterwards. This stage corresponds to the “biowaste generator level” in Deliverable 3.5.
The importance of this stage relates to two key aspects: 1) biowaste sorting efficiency at the source of generation, i.e. percentage of the biowaste generated that is thrown away in the selective bin for biowaste and 2) macro-impurities remaining in the source-separated biowaste. Macro-impurities are non-biowaste fractions (such a paper, plastic and metals) that are discarded in a wrong way into the biowaste bin and that can be, in some cases, mechanically removed. They can also be called material contaminants as in Edo et al. (2016) or physical impurities as in Wellinger et al (2013). Their presence in the biowaste bin represents a source of micro-impurities. Micro-impurities are chemical contamination that cannot be mechanically removed and that are caused by food contaminants, contaminated green waste, or the presence of macro-impurities in the source-separated biowaste stream. They can also be called chemical contaminants as in Edo et al. (2016) or chemical impurities as in Wellinger et al (2013).
The Collection boxes in Figure 1 (Collection of source-separated Biowaste and Collection of non-separated Biowaste) represent the gathering of waste, including the preliminary sorting and preliminary storage of waste for the purposes of transport to a waste treatment facility (point 10 of Article 3 of the WFD). The WFD distinguishes between the preliminary storage of waste pending collection, the collection of waste, and the storage of waste pending treatment (recital 15 of the WFD Preamble). In addition, the directive clarifies that: “Preliminary storage of waste within the definition of collection is understood as a storage activity pending its collection in facilities where waste is unloaded in order to permit its preparation for further transport for recovery or disposal elsewhere” (recital 16 of the WFD Preamble). Thus, the collection stage starts after the biowaste has left the premises where it has been generated, either separated from other waste streams or not. It includes any loading, transport and storage operation until the waste reaches a final treatment facility. This can include the preliminary sorting and storage happening in a “transfer station”. This part is called “biowaste caretaker level” in Deliverable 3.5.
According to point 11 of Article 3 of the WFD, ‘separate collection’ means the collection where a waste stream is kept separately by type and nature so as to facilitate a specific treatment. Based on the above definitions, the DST distinguishes between: 1) Separate Biowaste Collection in which biowaste is kept separated from other waste types and 2) Non-separate Biowaste Collection in which biowaste is not kept separated from other waste types, i.e. it is collected mixed (or jointly) with other waste fractions. The second type represents the collection of residual waste or mixed municipal waste (European Waste Code 20 03 01). Mixed municipal waste can have different compositions depending not only on the existence or inexistence of a general separated collection scheme, the number of fractions considered in a general separated collection scheme but also on its efficiency. This also means that both collection types (1 and 2) will co-exist in a scenario with biowaste separate collection while type 2 will be the only type of collection if biowaste source separation is not implemented at all. For DECISIVE project, we have named “mixed waste” the mixed municipal waste collected in areas where biowaste is not collected separately and “residual waste” the mixed municipal waste collected in areas where separate collection of biowaste is implemented.
The Treatment boxes of Figure 1 (Biowaste treatment and Treatment) represent recovery or disposal operations, including preparation prior to recovery or disposal (point 14 of Article 3 of the WFD). The Biowaste Treatment box represents, exclusively, options for source-separated biowaste, while the Treatment box refers to options for unsorted biowaste included in the residual waste. Treatment can be a single operation or a combination of operations of different types (recovery or disposal):
Recovery (also called waste valorisation) represents any operation the principal result of which is waste serving a useful purpose by replacing other materials which would otherwise have been used to fulfil a particular function, or waste being prepared to fulfil that function, in the plant or in the wider economy. Annex II sets out a non-exhaustive list of recovery operations; (point 15 of Article 3 of WFD). Annex II includes incineration facilities with energy efficiencies equal or above a specific threshold (R1) as well as composting and any other biological
D.5.1. Methodology for the planning of decentralised biowaste management 14
treatment (R3). Thus, recovery includes recycling (material recovery) and energy recovery operations: Recycling means any recovery operation by which waste materials are reprocessed into
products, materials or substances whether for the original or other purposes. It includes the reprocessing of organic material but does not include energy recovery and the reprocessing into materials that are to be used as fuels or for backfilling operations (point 17 of Article 3). Recycling includes, for example, bio-fertilizers and bio-pesticides production from biowaste.
Energy recovery means any recovery operation in which waste is converted into heat, electricity or fuel. While for Incineration Annex II of WFD establishes a clear threshold to discriminate between energy recovery and disposal, this is neither the case for anaerobic digestion, nor for landfills with gas recovery and utilisation. In the context of the DECISIVE project, energy recovery includes biogas utilisation for energy generation as well as incineration plant equipped with high energy recovery systems.
While some of the recovery activities can clearly be classified into “recycling” or “energy recovery” such as composting (recycling) and incineration (energy recovery only in case it fits the energy efficiencies threshold), others have both energy and material recovery, such as anaerobic digestion. Within the recovery operation, there are biological processes (aerobic or anaerobic digestion), thermal processes (incineration) and energy conversion processes (e.g. Stirling, CHP, etc.).
Disposal represents any operation which is not recovery even where the operation has as a secondary consequence the reclamation of substances or energy. Annex I sets out a non-exhaustive list of disposal operations; (point 19 of Article 3). Annex I includes landfill and incineration facilities with energy efficiencies lower than the threshold limits for recovery.
2.4 Geographical scope of the DST
The overall geographical scope of the tool is Europe but each case study will have its specific geographical scope that will depend on the competence level of the user of the tool (e.g. waste authorities can have competences at a local, regional or national level, while a waste operator will have only competence in its working area).
Ideally, the data used in the DST should match the spatial extent of the study zone (i.e. areas in which the analysis will be based on) and have a level of detail suitable for the analysis. This match will only be possible if the user of the tool has specific data for the study zone. If this is not the case, the user will have to use existing data, which could refer to other areas or less accurate data but available at country or UE levels. For example, this means that the user will have to rely on regional or national data when specific local data for the study does not exist. This is discussed further in the next section.
The data available in the DST will be based on national statistics but also on published regional and local data (general European data as well as national, regional and specific local data for few locations, mainly the demonstration sites of the project). Some of these values could be considered valid for an entire country, while others would be more site-specific. The idea is to “zoom out” when local data (for the specific study zone) are not available, so that, as worst case, national averages can be used as default values.
2.5 Temporal scope of the DST
Although the tool does not have a temporal scope, each case study assessed with the tool will have it. The temporal scope of each case study will be linked to the year of reference of the data used in the modelling. For this reason, all the datasets present in the DST (described in Sections 2.4 and 4) will include the year of data generation (i.e. when the specific inventory is developed).
It should be mentioned, however, that the user of the tool will be responsible for deciding whether the year of reference of the inventories used are able to represent the situation in the year of the study and generated new data when such inventories are not representative any longer. The tool will not make a prognosis for future trends. If the user wants to model a future scenario, the prognosis will have to be
D.5.1. Methodology for the planning of decentralised biowaste management 15
done outside the tool and then add in developed future inventories in the tool to do the assessment of such future scenario.
2.6 Assessment Criteria
The assessment criteria are defined by the indicators used to assess the performance of the biowaste management system (from generation until final disposal) and compare the different alternatives. It include five parts:
Three indices based on network analysis. These indices quantify the relative amount of matter and energy recovered, and the transport intensity of the biowaste management system. They are an adapted version of the indicators developed by Font-Vivanco et al. (2012).
The environmental assessment includes the impact on Climate Change of the biowaste management system as well as toxicity impacts associated with the micro-impurities present in the bio-based products that could bring future damage to human and ecosystem health (Thomsen et al., 2017 and Pizzol et al., 2014).
The economic assessment represents a simple Conventional Life Cycle Costing (LCC) (Martinez-Sanchez et al., 2014), which includes all the financial costs of the biowaste management. It includes Capital Expenses (CAPEX), Operational Expenses (OPEX), and Revenues obtained from the sale of recovered products.
The social assessment includes labour employed in all the stages of the biowaste management system, the space required to handle the biowaste (private space of the generator, public urban areas, and industrial areas) and the needed effort of the generator in the biowaste management system in terms of time needed for sorting activities at source.
The regulatory and legislative assessment of the criteria will check the compliance of different aspects of the biowaste scenario with various pieces of regulation: e.g the Landfill Directive, recycling targets of the WFD, and requirements of the recovered products to be sold as fertilizers (e.g. limit concentrations of micro-pollutants) based on the European and National Fertilizers Regulation (D4.1, Annex 1; European Parliament, 2017). The tool will take into consideration the updates on regulation occurring during the developing of the tool, such as the upcoming approval of new waste directives package (at the time of finalising this deliverable).
2.7 Data in the DST
The DST will include databases (described in Section 4) to be able to simulate different biowaste management scenarios in different study zones. The datasets included in the database will be mainly based on national statistics but also on published regional and local data, but also from the two real demonstration sites of the project (Lyon and Catalonia) that are reported in Deliverable 6.1, and the simulation sites that will be reported in D.6.2.
In addition, the users will always be able to add their own data. However, if the user does not have specific data for the case study, users can choose to either generate such data (and add it into the tool) or use the most appropriate data available in the tool for the specific study zone. Thus, the DST will be able to hold data generated during the project (available to users), as well as to allow for data addition by the user. The data added by users for their specific projects will not be accessible/visible to other users.
3. Conceptual Model
Figure 2 represents the conceptual model of the DST. The working flow of the DST describes the different steps to be taken by the user of the tool to carry out the assessment. The database describes the different types of datasets included in the tool and their relations to each other. The assessment algorithm describes the main calculations done by the tool to estimate the assessment criteria. The three parts of the concept model are described in detail in the following sections.
D.5.1. Methodology for the planning of decentralised biowaste management 16
Figure 2: Conceptual model of the DST
4. Database
The database is divided into three parts: 1) the Background Process Database, 2) the Waste Database and 3) Waste Process Database (see top-right purple part of Figure 2). Each waste, background and waste process stored in the databases has a documentation associated that includes a description of the data origin and calculations performed for their development. The users of the DST can use either the processes (background processes, waste fractions, and waste processes) available in the databases or create new ones that represent better their own case study. The processes built by a specific user will not be accessible/visible to other users.
4.1 Background process database
As mentioned previously, background processes are external processes (for the biowaste management system) producing materials, resources and energy that are consumed in biowaste management systems or substituted by the recovered products, such as energy and fertilizer products. The information available for each background process includes the emissions contributing to the different environmental criteria (e.g. emission of CO2 for climate change) and its market price per unit of background process. Figure 3 shows an example of the background process «Diesel, Production and Consumption, 1 litre» and the information that is included in its definition: the Greenhouse Gas (GHG) emissions per litre of diesel during production and consumption of the diesel, as well as its price. It was assumed that most of the background processes take place outside the study zone and their productions have neither effect on the social impact in the study zone nor on the regulatory targets.
Figure 3: Scheme representing the structure of the background process database in the DST.
4.2 Waste Database
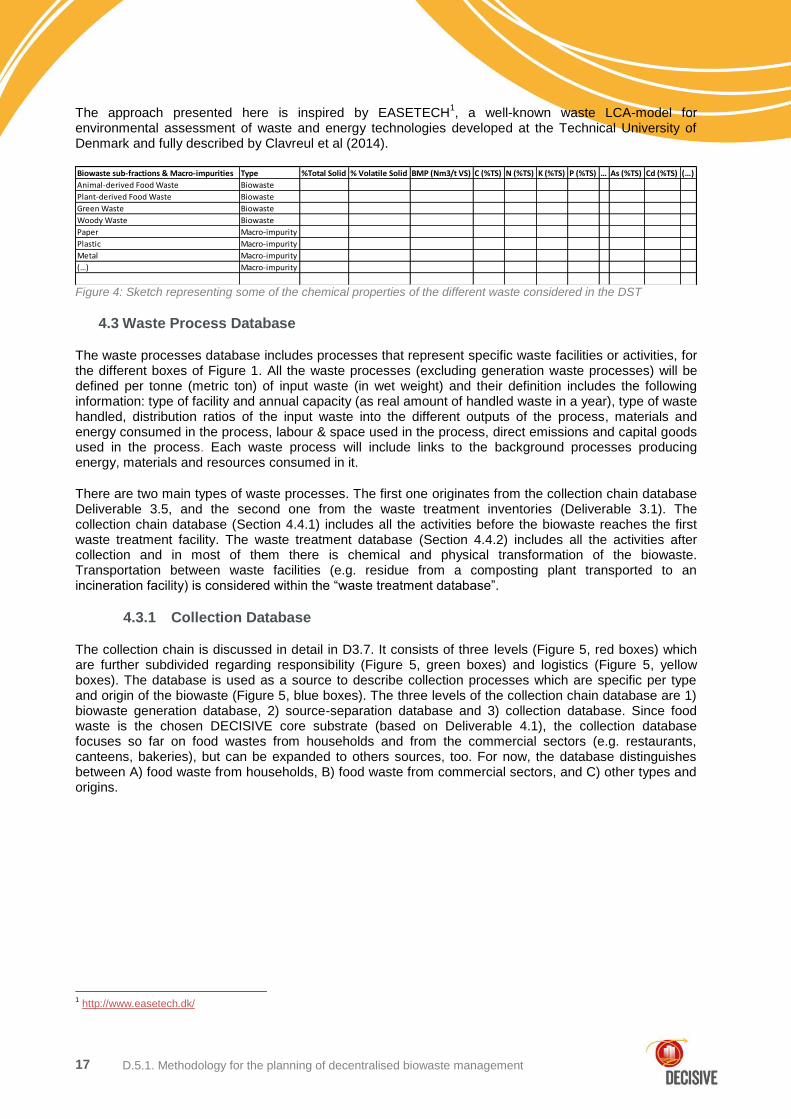
The waste database includes key chemical properties of the different sub-fractions of the biowaste (plant-derived food waste, animal-derived food waste, green waste and woody waste) and macro-impurities. The information given for each waste fraction of the waste database (see Figure 4) is used to estimate key parameters for the biowaste management system, such as the methane potential used to calculate the bio-methane generated in the AD.
In addition, it also allows the DST to estimate the chemical properties of different combinations of fractions to better represent the biowaste and macro-impurities in the study zone. The DST can follow such properties through the different biowaste management stages by knowing the physical or chemical transformation happening in each waste process, and finally include the impacts of such components (e.g. presence of micro-impurities in recovered products) for the whole biowaste management system.
Background Process (BP) Unit of BP
Emission of CO2
(kg/unit of BP)
Emission of NOx
(kg/unit of BP) (…)
Price
(€/unit of BP) Documentation
Diesel Production and Use for Transportation,… litre 3.5 XX … 1 Diesel_doc.pdf
D.5.1. Methodology for the planning of decentralised biowaste management 17
The approach presented here is inspired by EASETECH1, a well-known waste LCA-model for
environmental assessment of waste and energy technologies developed at the Technical University of Denmark and fully described by Clavreul et al (2014).
Figure 4: Sketch representing some of the chemical properties of the different waste considered in the DST
4.3 Waste Process Database
The waste processes database includes processes that represent specific waste facilities or activities, for the different boxes of Figure 1. All the waste processes (excluding generation waste processes) will be defined per tonne (metric ton) of input waste (in wet weight) and their definition includes the following information: type of facility and annual capacity (as real amount of handled waste in a year), type of waste handled, distribution ratios of the input waste into the different outputs of the process, materials and energy consumed in the process, labour & space used in the process, direct emissions and capital goods used in the process. Each waste process will include links to the background processes producing energy, materials and resources consumed in it.
There are two main types of waste processes. The first one originates from the collection chain database Deliverable 3.5, and the second one from the waste treatment inventories (Deliverable 3.1). The collection chain database (Section 4.4.1) includes all the activities before the biowaste reaches the first waste treatment facility. The waste treatment database (Section 4.4.2) includes all the activities after collection and in most of them there is chemical and physical transformation of the biowaste. Transportation between waste facilities (e.g. residue from a composting plant transported to an incineration facility) is considered within the “waste treatment database”.
4.3.1 Collection Database
The collection chain is discussed in detail in D3.7. It consists of three levels (Figure 5, red boxes) which are further subdivided regarding responsibility (Figure 5, green boxes) and logistics (Figure 5, yellow boxes). The database is used as a source to describe collection processes which are specific per type and origin of the biowaste (Figure 5, blue boxes). The three levels of the collection chain database are 1) biowaste generation database, 2) source-separation database and 3) collection database. Since food waste is the chosen DECISIVE core substrate (based on Deliverable 4.1), the collection database focuses so far on food wastes from households and from the commercial sectors (e.g. restaurants, canteens, bakeries), but can be expanded to others sources, too. For now, the database distinguishes between A) food waste from households, B) food waste from commercial sectors, and C) other types and origins.
1 http://www.easetech.dk/
Biowaste sub-fractions & Macro-impurities Type %Total Solid % Volatile Solid BMP (Nm3/t VS) C (%TS) N (%TS) K (%TS) P (%TS) … As (%TS) Cd (%TS) (…)
D.5.1. Methodology for the planning of decentralised biowaste management 18
Biowaste type and origin: Food waste from private households
Biowaste collectionBiowaste generation
Biowaste type and origin: Food waste from commercial sectors
2nd Storage
2nd Transport
Biowaste source separation
CollectorsGenerators
Biowaste type and origin: Other types and origins
1st Storage
1st Transport
Figure 5: Connection of the different sub-categories of the waste collection database
The Biowaste generation level includes different categories of food waste (Table 1). The biowaste generation is closely connected to its source (Figure 5, blue boxes). However, not all generated biowastes are source-separated or collected in a mixed way with other wastes, but some will remain (e.g. in the garden) or be used at the place of origin (e.g. as pet feed) or will be disposed of (e.g. in the sink or toilet). Therefore, for each waste category “generated biowaste” (considered in this level) and “collected biowaste” (considered in the next level) have to be distinguished. Each generation process represents a specific combination of source type (e.g. households from specific sizes, i.e. number of persons per household), location (e.g. Barcelona), year (e.g. 2016), and includes the amount (e.g. in kg/person/year or in kg/m²/year) and composition (e.g. % mainly animal-derived food waste, % mainly plant-derived food waste, % green waste, % woody waste) of the generated biowaste. This is the only database in which processes are not defined per tonne of waste input, but per source unit (e.g. one household or one restaurant).
The Biowaste source-separation level includes data about source-separated biowaste and about the remaining residual waste which may also contain a significant proportion of biowaste. Each source-separation process is also specific regarding source type, location, year, amounts and composition. And the level of source separation determines how much of the generated waste may be collected. Therefore, the amounts and composition are provided here in % of the collected waste. The differences between the “generated biowaste” and the “collected biowaste” determines the amount of biowaste which goes into unknown pathways. Beside the level of source-separation (e.g. the shares of food waste contained in biowaste and in residual waste), it includes data which describe the quality of source-separation (percentage of macro-impurities in the biowaste, composition of such macro-impurities). The outputs of this level are two waste streams in cases where separate collection of biowaste is offered; one stream of source separated biowaste, one stream that contains the biowaste that is thrown away with the residual waste (e.g. by mistake or convenience). When no separate collection of biowaste is offered, the output is only one waste stream, and all the biowaste is contained in a mixed waste. Furthermore, this level includes consumables needed to carry out the biowaste storage at the source (e.g. bins for the kitchen, compostable bags, water to clean the bins), the space required for biowaste storage at the source, the time and distance needed to reach the next storage place (e.g. outside the house). This refers to all outputs, the source separated biowaste and the non-separated biowaste.
The Biowaste collection level includes items to describe the storage of source separated and non-separated biowaste pending collection by a waste collector (e.g. waste management company) and the transport to the first waste treatment facility. The different collection practices are assigned to the type of collection points (door-to-door, bring points) as well as collection area specific data, type and properties of equipment (e.g. electric vehicles, diesel vehicles with lateral load, fuel demand) or labor required. In these processes, the waste input streams are the same as the waste output streams of the source separation stage.
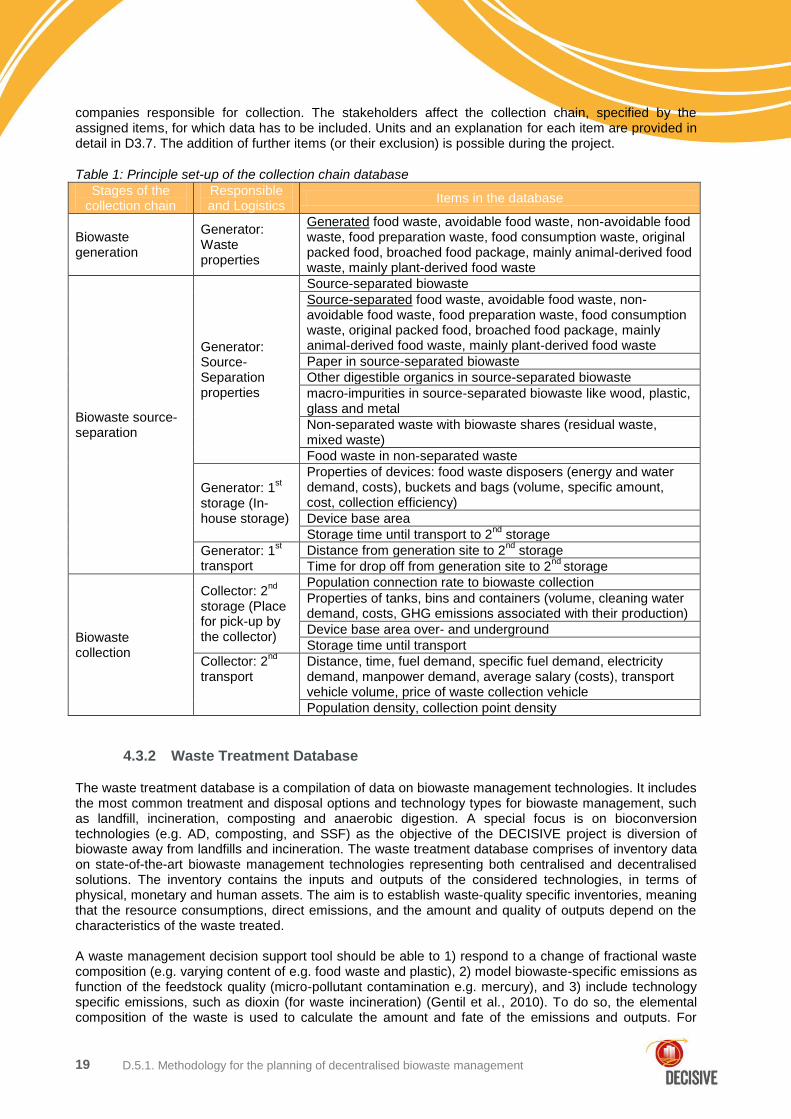
Table 1 presents the principle set-up of the database including assignments to the involved stakeholders. Waste generators are for example the citizens in households, while waste collectors are for example
D.5.1. Methodology for the planning of decentralised biowaste management 19
companies responsible for collection. The stakeholders affect the collection chain, specified by the assigned items, for which data has to be included. Units and an explanation for each item are provided in detail in D3.7. The addition of further items (or their exclusion) is possible during the project.
Table 1: Principle set-up of the collection chain database
Other digestible organics in source-separated biowaste
macro-impurities in source-separated biowaste like wood, plastic, glass and metal
Non-separated waste with biowaste shares (residual waste, mixed waste)
Food waste in non-separated waste
Generator: 1st
storage (In-house storage)
Properties of devices: food waste disposers (energy and water demand, costs), buckets and bags (volume, specific amount, cost, collection efficiency)
Device base area
Storage time until transport to 2nd
storage
Generator: 1st
transport Distance from generation site to 2
nd storage
Time for drop off from generation site to 2nd
storage
Biowaste collection
Collector: 2nd
storage (Place for pick-up by the collector)
Population connection rate to biowaste collection
Properties of tanks, bins and containers (volume, cleaning water demand, costs, GHG emissions associated with their production)
Device base area over- and underground
Storage time until transport
Collector: 2nd
transport
Distance, time, fuel demand, specific fuel demand, electricity demand, manpower demand, average salary (costs), transport vehicle volume, price of waste collection vehicle
Population density, collection point density
4.3.2 Waste Treatment Database
The waste treatment database is a compilation of data on biowaste management technologies. It includes the most common treatment and disposal options and technology types for biowaste management, such as landfill, incineration, composting and anaerobic digestion. A special focus is on bioconversion technologies (e.g. AD, composting, and SSF) as the objective of the DECISIVE project is diversion of biowaste away from landfills and incineration. The waste treatment database comprises of inventory data on state-of-the-art biowaste management technologies representing both centralised and decentralised solutions. The inventory contains the inputs and outputs of the considered technologies, in terms of physical, monetary and human assets. The aim is to establish waste-quality specific inventories, meaning that the resource consumptions, direct emissions, and the amount and quality of outputs depend on the characteristics of the waste treated. A waste management decision support tool should be able to 1) respond to a change of fractional waste composition (e.g. varying content of e.g. food waste and plastic), 2) model biowaste-specific emissions as function of the feedstock quality (micro-pollutant contamination e.g. mercury), and 3) include technology specific emissions, such as dioxin (for waste incineration) (Gentil et al., 2010). To do so, the elemental composition of the waste is used to calculate the amount and fate of the emissions and outputs. For
D.5.1. Methodology for the planning of decentralised biowaste management 20
example, transfer coefficients can be applied to the nitrogen loss to air or the remaining carbon and micro-pollutants in the digestate from AD. In DECISIVE, we consider such aspects when developing the
technology inventories. On a practical level, the DECISIVE waste treatment database provides a list of technologies (or combination of technologies) from which the user can choose the option that best represents their specific case. Each technology consists of different steps that can be customised if desired by the user. In the case of AD, this would include pre-treatment (e.g. mechanical separation and hygienisation), treatment (e.g. mesophilic/thermophilic AD), biogas valorisation (e.g. by combustion for CHP) and digestate valorisation (different post-treatment technologies). For every technological step, the inputs (resource consumption such as electricity) and outputs (emissions and amount and quality products such as fertiliser) will be calculated considering the characteristics of the input waste and chosen types of technologies (Figure 6).
Figure 6: Example of calculating energy consumption and emissions for a anaerobic digester technology considering the characteristics of the input waste
In DECISIVE, three types of waste- and technology-dependent relations are expected to be developed in the technology inventories: 1) amounts and quality of outputs, 2) direct emissions, 3) resource consumptions.
1) Waste quality and technology-specific amounts and quality of output products
As described in Section 5.4, for every waste management step the tool calculates a mass balance, such as material and key element flows contained in the waste, for instance N, P and Cd. This means that the technology inventories must include transfer coefficients determining the fate of the different elements entering and leaving each treatment process. The products obtained (e.g. the bio-methane generated in a specific type of AD) depend both on technology performance and input waste quality, as explained in Section 4.3. Hence, changing the characteristics of the waste input and/or process technology will result in a change in system performance and therefore a recalculation of process inputs (e.g. energy consumption) and outputs (emissions and products) based on the new specifications.
D.5.1. Methodology for the planning of decentralised biowaste management 21
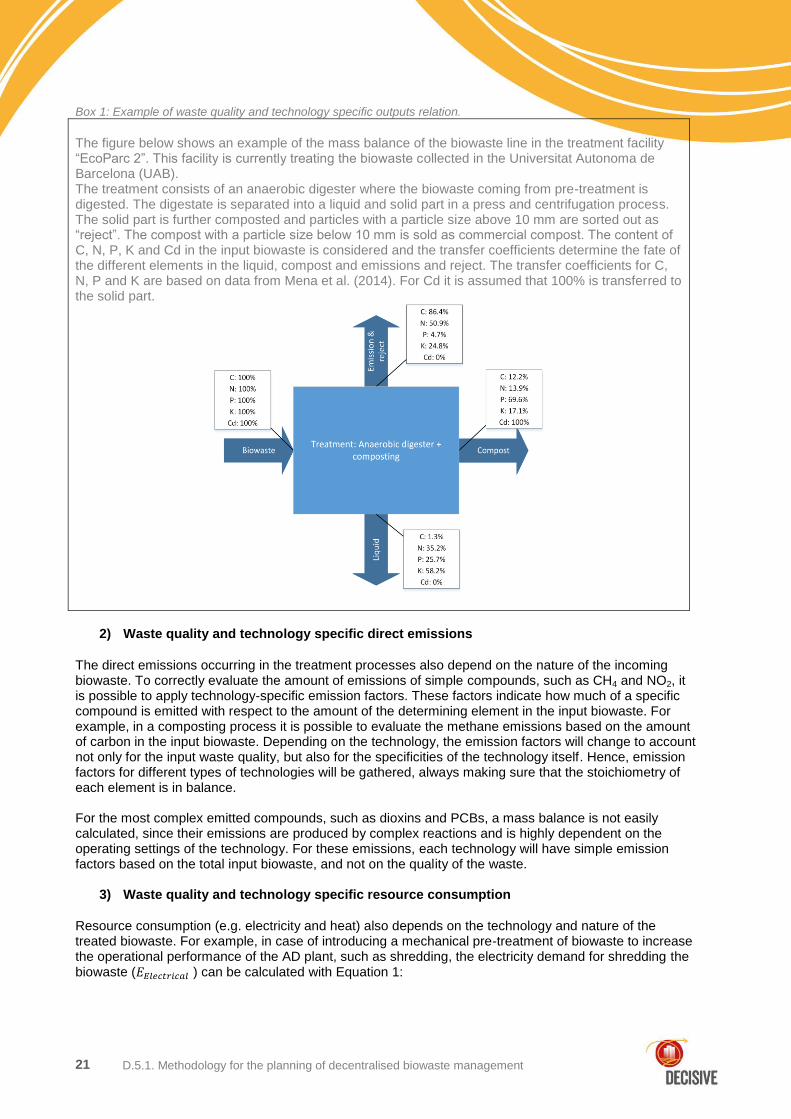
Box 1: Example of waste quality and technology specific outputs relation.
The figure below shows an example of the mass balance of the biowaste line in the treatment facility “EcoParc 2”. This facility is currently treating the biowaste collected in the Universitat Autonoma de Barcelona (UAB). The treatment consists of an anaerobic digester where the biowaste coming from pre-treatment is digested. The digestate is separated into a liquid and solid part in a press and centrifugation process. The solid part is further composted and particles with a particle size above 10 mm are sorted out as “reject”. The compost with a particle size below 10 mm is sold as commercial compost. The content of C, N, P, K and Cd in the input biowaste is considered and the transfer coefficients determine the fate of the different elements in the liquid, compost and emissions and reject. The transfer coefficients for C, N, P and K are based on data from Mena et al. (2014). For Cd it is assumed that 100% is transferred to the solid part.
2) Waste quality and technology specific direct emissions
The direct emissions occurring in the treatment processes also depend on the nature of the incoming biowaste. To correctly evaluate the amount of emissions of simple compounds, such as CH4 and NO2, it is possible to apply technology-specific emission factors. These factors indicate how much of a specific compound is emitted with respect to the amount of the determining element in the input biowaste. For example, in a composting process it is possible to evaluate the methane emissions based on the amount of carbon in the input biowaste. Depending on the technology, the emission factors will change to account not only for the input waste quality, but also for the specificities of the technology itself. Hence, emission factors for different types of technologies will be gathered, always making sure that the stoichiometry of each element is in balance. For the most complex emitted compounds, such as dioxins and PCBs, a mass balance is not easily calculated, since their emissions are produced by complex reactions and is highly dependent on the operating settings of the technology. For these emissions, each technology will have simple emission factors based on the total input biowaste, and not on the quality of the waste.
3) Waste quality and technology specific resource consumption
Resource consumption (e.g. electricity and heat) also depends on the technology and nature of the treated biowaste. For example, in case of introducing a mechanical pre-treatment of biowaste to increase the operational performance of the AD plant, such as shredding, the electricity demand for shredding the biowaste ( ) can be calculated with Equation 1:
D.5.1. Methodology for the planning of decentralised biowaste management 22
(1)
Where: Q_mechanical pretreatment is the capacity of e.g. the shredder (tonne/h), W is the power of the shredder (W), and m is the mass of input waste (tonne) The quality of the biowaste affects the electricity demand of the shredder in two ways. First of all, the presence of macro-impurities would increase the total amount of biowaste to be processed, i.e. m_biowaste is increased, while resulting in the introduction of impurities into the biobased production system. Secondly, the presence of impurities makes the biowaste more difficult to be shredded, requiring more energy for shredding reducing the performance and also damaging the equipment. In case of low quality biowaste, i.e. with a high content of macro-impurities, alternative mechanical pre-treatment technologies such as biopulp production may be preferable. For the DECISIVE micro-AD, the aim is not including pre-treatment, as CAPEX and energy consumption is expected to exceed any potential benefit. In fact, shredding may ease VFAs (volatile fatty acids) production/accumulation and cause rapid inhibition of digesters unless the shredded feedstock is properly co-digested with other substrates (Deliverable 4.1). In general, environmental and economic costs (e.g. expenses associated to health impacts and material consumption) and benefits (e.g. climate change mitigation by replacement of fossil energy consumption, productivity/revenue) of individual waste valorisation technologies will be reflected in the waste treatment database to the extent possible. Waste and technology characterisation data are therefore important for the DST to be able to quantify the overall environmental, energetic and economic performance of centralised and decentralised waste treatment system. Generally, the technologies included in the database will have resource consumption, emissions and outputs based on the characteristics of the technology itself and quality of the input biowaste. These relationships will be investigated further to have the best representation of every technology included in the database.
5. Working Flow
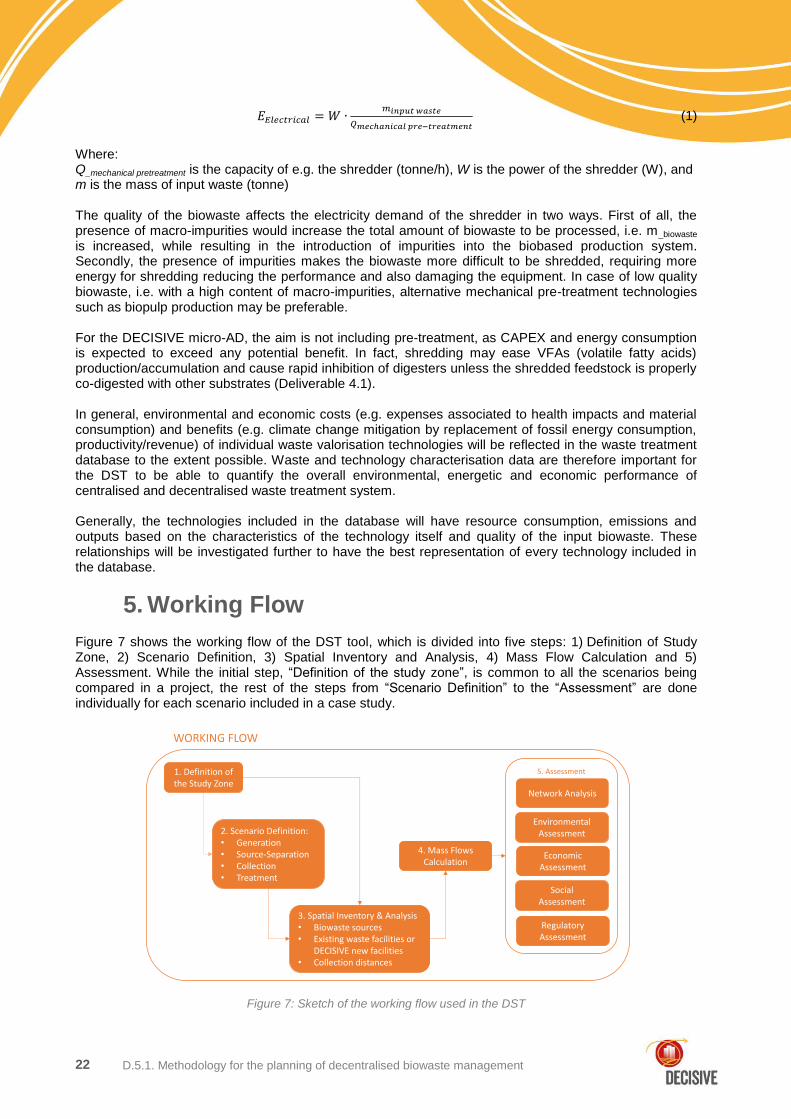
Figure 7 shows the working flow of the DST tool, which is divided into five steps: 1) Definition of Study Zone, 2) Scenario Definition, 3) Spatial Inventory and Analysis, 4) Mass Flow Calculation and 5) Assessment. While the initial step, “Definition of the study zone”, is common to all the scenarios being compared in a project, the rest of the steps from “Scenario Definition” to the “Assessment” are done individually for each scenario included in a case study.
Figure 7: Sketch of the working flow used in the DST
D.5.1. Methodology for the planning of decentralised biowaste management 23
5.1 Definition of the Study Zone
The first step is the definition of the study zone. Here is where the user defines the main information to characterise the study zone of the project, i.e. the area in which the user wants to assess different biowaste management options. The information requested from the user is the number of each type of biowaste source (e.g. number of households) and its average size (e.g. 2 persons per household). Generation units can be: inhabitant-related sources (e.g. food waste); area-related (e.g. lawn cuttings) and unit-related (e.g restaurants). The spatial distribution of the biowaste sources (e.g. surface of the considered area, average distances between biowaste generators, density of generators, etc.) in the study area is evaluated in the spatial inventory and analysis (3
rd step of the working flow, Section 5.3).
Box 2: Example of Study Zone Definition
The study zone for the demonstration site of Catalonia is delimited by the premises of the Bellaterra campus of the Universitat Autonoma de Barcelona. Within such premises, the biowaste generators included in the study are: student residences and restaurants. Deliverable 6.1 reports number of biowaste generators included in the case study and their average size. The table below summarises such amounts.
TYPE OF BIOWASTE SOURCE
Number of generation source in the Study Zone
Average size of the sources
References
Amount Unit Amount Unit Source
Student Residences:
- UAB Vila 1 1 residence 1359 residents/year Tables 20 and 21 of D6.1.
- UAB Vila 2 1 residence 355 residents/year Tables 20 and 21 of D6.1.
- UAB SERT 1 residence 166 residents/year Tables 20 and 21 of D6.1.
Restaurants:
- Rectorat 1 Bar-Restaurant 26400 meals/year Table 22 of D6.1 (assuming 220 working days/year)
- Veterinària 1 Bar-Restaurant 44000 meals/year Table 22 of D6.1 (assuming 220 working days/year)
- ETSE 1 Bar-Restaurant 12100 meals/year Table 22 of D6.1 (assuming 220 working days/year)
- Lletres i Psicologia 1 Bar-Restaurant 77000 meals/year Table 22 of D6.1 (assuming 220 working days/year)
- CC Comunicació 1 Bar-Restaurant 9900 meals/year Table 22 of D6.1 (assuming 220 working days/year)
- P. Cívica 1 Bar-Restaurant 99000 meals/year Table 22 of D6.1 (assuming 220 working days/year)
- Ciències i Biociències 1 Bar-Restaurant 70400 meals/year Table 22 of D6.1 (assuming 220 working days/year)
- Medicina 1 Bar-Restaurant 33000 meals/year Table 22 of D6.1 (assuming 220 working days/year)
- CC. Socials 1 Bar-Restaurant 11000 meals/year Table 22 of D6.1 (assuming 220 working days/year)
- CC. Educació FTI 1 Bar-Restaurant 33000 meals/year Table 22 of D6.1 (assuming 220 working days/year)
5.2 Biowaste Management Scenario Definition
The second step of the working flow is the scenario definition in which the user of the DST defines the biowaste management system to be assessed, i.e. biowaste technological pathway from generation to final disposal going through collection and material and energy recovery processes (i.e. all the boxes of Figure 1).
To build a scenario, the user has first to define the different “waste management zones”, i.e. sub-areas of the study zone with the same type of biowaste management systems, and then for each waste management zone of the scenario, the user has to select a waste process from the waste process database.
As mentioned previously, if the desired waste process is not available in the waste process database, the user can build a new waste process, by copying an existing one, modifying it and saving it with a new name or by building one from scratch. The user should take into account the technical and legal constraints of the study zone, as well as local needs/demands of valorisation products (e.g. if there is local heat demand or it is expected to exist in a near future) to build feasible scenarios for the specific study zone.
D.5.1. Methodology for the planning of decentralised biowaste management 24
Box 3: Example of Biowaste Management Scenario Definition representing the current biowaste management in the demonstration site of Catalonia
The current biowaste management in the study zone for the demonstration site of Catalonia is based on a bring-scheme collection system and both the source-separated biowaste as well as the residual waste (including biowaste) is treated in Ecoparc 2 where there are two treatment lines one for biowaste and another for residual waste.
All the biowaste generated in the study zone is handled in the same way. Thus the baseline scenario (representing current management) has only one waste management zone. Alternatively, if there were different biowaste management systems co-existing in the study zone, e.g. some restaurants carrying out home-composting, then the baseline scenario would have 2 waste management zones, e.g. one in which biowaste would be home-composted and another in which biowaste would be treated in Ecoparc 2.
The figure below shows the waste processes representing each stage of the baseline scenario of the study zone described in Box 1.
It should be noted that, in this case, the processes selected for the baseline scenario of the UAB were not yet in the waste process databases. They had to be created and saved in the database before selecting such process when building the scenario. These processes will be enabled for the future users of the tool, since they have been created during the DECISIVE project.
5.3 Spatial Inventory and Analysis
DST is designed to evaluate the relevance of a decentralised biowaste management system in a specific study zone compared with the existing system. In the frame of the DECISIVE project, a decentralised approach implies a great proximity between treatment units and biowaste sources. There is thus a need for a good understanding of the studied zone, with an accurate spatial inventory of the biowaste sources, their individual locations, and their waste production but also the identification of the potential location for micro-AD units.
To achieve this goal, the DST needs to be supported by GIS tools and data in this third step of the working flow. The methodology used for the spatial inventory and analysis in DST is a simplified version of the method developed in Deliverable D3.8 “Methodologies to geographically design an optimised network of micro-AD and SSF sites at the urban and peri-urban scale” and includes four main parts: 1) geo-localisation of biowaste generators/producers sources, 2) geo-localisation of existing waste facilities, 3) geo-localisation of potential new DECISIVE facilities and 4) estimation of collection distances and if it is technically feasible, the transportation distances for the bio-based products.
The user of the DST will have the option to skip the spatial inventory and analysis and carry out the assessment without knowing the specific locations of sources and facilities, but then the user will have to add average distances (between sources and from sources to waste facilities) manually.
5.3.1 Geo-localisation of biowaste sources
In the framework of the DECISIVE project, the biowaste sources targeted are the food waste from households, restaurants, canteens and health facilities. The aim of the geo-localisation of biowaste sources step is that each of these sources is accurately located and their annual production estimated. The method used for the geo-location of the sources of biowaste depends on their type of source (e.g. restaurants). There are, however, some regional heterogeneities between the databases available. It was
D.5.1. Methodology for the planning of decentralised biowaste management 25
thus decided to use dataset slightly less accurate but available at the scale of the EU, in particular, the free OpenStreetMap (OSM) data (a collaborative project to create a free editable map of the world) and high-resolution census data from the European statistical office Eurostat. The quality of the resulting inventory might be not as good as with specific databases, but it gives a common baseline for all countries involved in the project (France, Spain, Germany, Italy, Denmark and Belgium). The quantity of waste is then estimated by using standard ratios of production for each source that will come from the collection chain database (biowaste generation amount).
5.3.2 Geo-localisation of existing waste facilities
The location and characteristics of the existing waste facilities are extracted from national or regional databases, e.g. the database of the Catalan Government http://sig.gencat.cat/visors/hipermapa.html where all the existing municipal solid waste facilities in Catalonia are geo-referenced, see Figure 8.
Figure 8: Screenshot of the http://sig.gencat.cat/visors/hipermapa.html when selecting the data layer of municipal waste operators “gestors de residus municipals”.
5.3.3 Geo-localisation of potential new DECISIVE facilities
The location of potential new DECISIVE facilities needs to take into account the local regulation. For example in France, the micro-AD units fall under the regulation of the “Installation Classified for the Protection of the Environment (ICPE) heading 2781”. Their locations have to comply with a set of rules to minimise their potential environmental impacts. For example, they cannot be installed too close to rivers or habitations (e.g. 50 m from habitation in France). Moreover, their location has to take into account the urban planning rules that can set specific distances to monuments, a maximum height, etc. All the rules will be compiled and combined spatially to identify the potential areas suitable for mAD in different territories when data and legislation are clear/known. The user of the tool will be the one deciding the position of the new DECISIVE facilities to proceed with the assessment. For that, the user can use or not the suggestions given by the tool in this step of the working flow.
D.5.1. Methodology for the planning of decentralised biowaste management 26
5.3.4 Estimation of collection distances
Among other criteria, the centralised and the decentralised systems differ by the distances required for waste collection. Whereas the large treatment units are sometimes located outside dense urban areas and thus often far from the waste producer, the mAD network planned in DECISIVE is designed to lower the distance between generation sources and treatment units. Therefore, the average waste collection distances will be estimated to compare the two systems.
5.4 Mass Flows Calculation
Once the user defines the scenario (chooses the waste processes for each part of the biowaste management for each waste management zone) and performs the spatial inventory step (or assumes average collection distances), the DST calculates the mass flows between waste facilities, which are the basis for the assessment.
The starting point of the mass flow calculation is the “site definition” step, in which the amount, type and size of the biowaste sources are reported (see Box 1). Then, with the definition of the generation process, the amount and composition of the biowaste generated are estimated. Subsequently, as each waste process defines how the input waste is distributed between the different outputs (i.e. the mass balance for each process unit), see Section 4.4.2, the DST makes a complete mass balance of the whole scenario. This is not only done for the total amount of waste, but also for key chemical properties of the biowaste (such as Total Solids, Carbon, Nitrogen, Phosphorus, Potassium and Cadmium) and macro-impurity fractions (based on the chemical properties reported in the waste database, Section 4.3).
For this step it will be important to estimate the possible migration of micro-pollutants from macro-impurities to the biowaste since these will end up in the bio-based products. Even if in the pre-treatment units most macro-impurities are physically removed from the biowaste part, some of the micro-impurities initially present may migrate to the biowaste part. In addition, there will always be a percentage of macro-impurities present in the treated biowaste since the pre-treatment cannot be 100% efficient. Therefore, micro-impurities will always be present in the bio-based products. If these transfers of micro-impurities can be estimated based on literature studies or DECISIVE field work, then the DST would be able to track the micro-pollutants that pass to the bio-based products and later assess their environmental impacts as well as compliance with the fertilizers regulation applicable to the specific location of the study zone.
5.5 Assessment
The last step of the working flow is the calculation of the assessment criteria introduced in Section 2.3 and described in detail in Section 6. The results, i.e. the values of the assessment criteria for the specific scenario in the defined study zone, are shown in two levels of detail. The first level shows the aggregated value of each criterion waste process involved in the scenario (e.g. Climate change impact associated with collection in waste management zone 1). This level provides the contribution of each activity to the overall result of the scenario. The second level shows the disaggregated results of each waste process, i.e. the contribution of each emission and items (e.g. fuel) consumed/recovered in the waste process (e.g. collection) to the results of each life-cycle activity (e.g. collection) in the scenario.
The user of the tool will have the opportunity to perform two types of sensitivity analysis. One addressing the overall scenario assumptions (e.g. changing a waste process chosen in the scenario definition) and another addressing the importance of individual model parameters with perturbation analysis, i.e. increasing each parameter (e.g. biowaste sorting efficiency) by a specific percentage (e.g. increase of 10%) ‘‘one-at-a-time” while keeping all other parameters fixed at their initial value and calculating the variation in the results of the assessment (e.g. variation in the impact on climate change of the scenario being assessed) by each parameter variation, according to Clavreul et al. (2012).
A more advance uncertainty analysis could be done using confidence intervals/boundaries defined for real data (if available). For example, if we know that the average macro-impurity content in the biowaste is 15%, but it can range between two extremes that are 10% and 20%, then sensitivity analysis could be performed by randomly picking values within such interval (either assuming a uniform or a normal distribution around the mean value). This approach requires knowing confidence intervals of all the
D.5.1. Methodology for the planning of decentralised biowaste management 27
parameters assessed. In the absence of this information, sensitivity analysis could be performed with the perturbation analysis mentioned above.
This functionality of the DST will provide the user with an idea of which are the critical parameters or waste processes that most influence the results. With this information, the user can improve the data selection to get more representative results. In addition, the DST could show the results with specific parameter variations asked by the user. For example, if biowaste sorting efficiency ends up being a key parameter, the user could choose to get the results of the assessment with specific variations of such parameter, e.g. +10% and -10% sorting efficiency.
Section 6 describes in detail the calculations to estimate each criterion of the assessment criteria introduced in Section 2.6.
6. Assessment Algorithm
The DST estimates the assessment criteria of a specific scenario and study zone by applying different assessment algorithms that are described in the following subsections.
The basic idea behind such calculations is that all the waste processes in the DST are described per tonne input. These intensive inventories are used to calculate the intensive assessment criteria of each process involved in the scenario. Then, the DST combines the mass flows and the intensive criteria to estimate the assessment criteria of the scenario for a specific study zone.
To develop the intensive inventories of all the waste process in the DST, it was assumed they behave linearly, e.g. all tonnes with the same properties (e.g. macro-impurities content) treated within the annual capacity of the specific process have the same inventory associated (e.g. same cost), which represents an average inventory (e.g. average cost) per tonne when the facility works at a specific capacity (technical parameter). Although this is not completely true, it was found to be an appropriate assumption to get potential sustainability results (aimed at by the tool).
6.1 Network Analysis
The DST framework will apply network analysis without requiring additional data or information compared to what is needed for the other types of assessment. The nodes (i.e. agents) of the network are: 1. Generation sources (e.g. buildings, restaurants, canteens, health facilities and groceries); 2. Facilities involved in transference and treatment (e.g. transfer stations, biological treatment plants
such as composting and anaerobic digestion, and other material recovery treatment plants); 3. Disposal facilities (e.g. landfill); 4. Agents involved in product management (i.e. agents managing compost, digestate and bio-stabilised
material); 5. Actors outside the political boundaries of the area under investigation (i.e. agents receiving the
exported material or responsible for biowaste imports within the system’s borders).
Network connections (i.e. directed flows between the nodes) and their properties (i.e. quantity of different currencies exchanged) are defined according to what is described in Section 4.3. The objective is calculating three indicators inspired to the bio-waste net recovery index (NRI) and transport intensity index (TII) proposed by Font-Vivanco et al. (2012):
Biowaste Net Material Recovery Index - it quantifies the capacity of the biowaste management system to convert waste into material resources (i.e. it provides indications that are comparable to the ones of the Finn Cycling Index (Pizzol et al., 2013) for which, however, a larger amount of data would be required). It is an adimensional index calculated by dividing the amount of biowaste treated in recycling facilities (e.g. composting and anaerobic digestion plants where bio-based materials are produced) by the total amount of biowaste generated in the study zone; both quantities are expressed as wet weight (i.e. including the total solids and the water content of the biowaste). The denominator excludes biological treatments whose aim is only to biostabilise the material before landfilling even if it is used as covering material in the landfill.
D.5.1. Methodology for the planning of decentralised biowaste management 28
Biowaste Net Energy Recovery Index - it quantifies the capacity of the biowaste management system to convert waste into energy. It is an adimensional index calculated as the ratio between the energy recovered in the biowaste management system (e.g incineration and anaerobic digestion plants) and the primary energy of the biowaste generated in the study zone. The denominator excludes amounts of biowaste treated in incineration plants with energy efficiency lower than the threshold to be considered energy recovery activities based on the WFD.
Transport Intensity Index - it introduces a spatial characterisation of the biowaste management system by assessing how intensive the system is in terms of transport based on the distances travelled by the biowaste generated in the study zone during its management.
The information about the fraction of biowaste recycled (included in the Biowaste Net Material Recovery Index) should be complemented with details concerning the amounts of bio-based products generated and their qualitative properties. In addition, it should be also read together with details concerning the energy generated, i.e. together with the Biowaste Net Energy Recovery Index to allow a more comprehensive comparison between the efficiencies of different biowaste management systems.
The calculation of these indices (i.e. adapted versions of NRI and TII) will allow comparing (at least) the environmental sustainability of different schemes for the management and valorisation of biowaste (i.e. linear vs. circular structures). The idea would be to be able to do something for specific study areas, with an approach that is similar (but simpler) to what was presented by: (1) Pizzol et al. (2013) for the water management system of a Danish municipality; and (2) Font-Vivanco et al. (2012) for the biowaste generated in Catalonia.
6.2 Environmental Assessment
The calculations behind the environmental assessment of the DST are the same as in most LCA softwares. They follow the principles and guidelines provided by the international standards ISO 14040 and ISO 14044 as much as possible.
First, all the emissions of the waste processes are defined by a compound and an environmental compartment to which it is emitted, i.e. air, water, soil (e.g. methane, fossil CO2 to air). Then all the emissions are classified based on their environmental effect; e.g. (avoided) GHG emissions for their contribution to climate change (mitigation). Afterwards, each emission is multiplied by its corresponding Characterisation Factor (CF) for the specific impact category that represents its relative contribution to the environmental impact (e.g. the global warming potential of methane is 25 corresponding to a CF of 25 kg CO2 equivalent / kg of CH4). Then all the emissions contributing to the same environmental impact category can be added up, since they are all in the same unit (e.g. kg CO2 equivalent for Climate Change).
For each waste process j of a Scenario X (with m waste management zones), there are direct emissions and consumptions of background processes (both per tonne of waste input). Each background process k has associated emissions generated during its production (see Figure 3), such emissions should also be characterised and added up to obtain the characterised impact of each background process k for each
background process k has to be multiplied by the amount of the background process consumed in the
waste process j per tonne of waste input ( ). Afterwards, the characterised impacts of all the
background processes consumed within the waste process j (per tonne of waste input) are summed up to have the characterised impact of all the background processes of the waste process j per tonne of waste input.
The direct emissions of the waste process j per tonne of waste input are also characterised for each
environmental impact category,
.
Once the mass flow of a scenario is calculated (step 4 of working flow, Section 5.4), the waste input for each waste process j in each waste management zone i is estimated, , and the characterised
impact (for each impact categories, e.g. climate change) of a Scenario X, e.g.
is calculated
with Equation 2. The obtained value represents the environmental impact for treating the annual amount
D.5.1. Methodology for the planning of decentralised biowaste management 29
of biowaste generated in the study zone (functional unit of the study as described in Section 2.1) with the technologies chosen in the definition of the scenario X for each of the m waste management zones.
∑ ∑ [
∑
]
(2)
Where:
= characterised impact (for each of the 3 environmental impact categories, e.g.
climate change) of Scenario X.
i = a specific waste management zone of Scenario X
m = all the waste management zones of Scenario X
j = a specific waste process of Scenario X
n = all the waste processes of Scenario X
= the waste input amount of the waste process j in the waste management zone i, in
wet weight (tonne)
= characterised impact of the direct emissions of the waste process j
per tonne of input waste (characterised for each impact category such as climate change)
= amount of background process k consumed in the waste process j per tonne of
waste
= characterised impact of each background process k consumed in the waste
process j input
When a process has an output product that substitutes something in the market obtained from fossil resources, the avoided production is accounted as a negative impact (i.e. environmental saving). The environmental impacts related to the construction of the capital goods used in the biowaste management and associated with a tonne of waste input are assumed negligible compared to the impacts associated to the operation of the system and thus excluded from the environmental assessment. This is a common assumption in waste-LCAs (Brogaard et al., 2016).
6.3 Economic Assessment
The economic assessment represents the costs for the responsible of the provision of the waste management service, regardless of its legal nature. In most of the cases, the responsibility will lie with the competent authoritybut in other cases could be a private provider. The economic assessment of a Scenario X includes the Capital Expenses (CAPEX), Operational Expenses (OPEX) and Revenues of all the waste processes involved in Scenario X. In this case, the three economic indicators could be added up to estimate the net cost of the Scenario X, since they are all in the same unit (€/functional unit). See Section 2.2 for the definition of functional unit.
Each waste process j in the waste process database has an associated CAPEX and a technical
life time ( ). To estimate the CAPEX associated to one tonne of waste input ( ), the
is annualised by using its years of life time (LT) and interest rate (ir). Its annuity is divided by the annual
capacity of the specific waste process ( ), see Equation 3.
The CAPEX of a Scenario X ( ) results from the sum of the CAPEXs of all the waste processes involved in the scenario that results from the multiplication of the waste input ( )
times CAPEX associated to one tonne of waste ( ), see Equation 4.
[
]
(3)
∑ ∑ [ ]
(4)
The OPEX of a waste process j includes labour costs ( ), maintenance costs (
) and costs
associated with the p background processes consumed (e.g. electricity) per tonne of waste input. The OPEX of Scenario X ( ) results from the sum of all the OPEX of all the waste process involved in the scenario (see Equation 5).
D.5.1. Methodology for the planning of decentralised biowaste management 30
Each background process has a price associated per unit of background process ( ), e.g. 0.1
€/kWh of electricity, as it has emissions associated (see Figure 4). The prices of the background processes are assumed to include all the costs upstream (e.g. CAPEX, OPEX and revenues of producing a kWh of electricity are assumed to be included in the market prices of one kWh electricity).
The inventory of each waste process j includes the “person*hours” needed to handle one tonne of waste that it is then multiplied by the “average gross hourly salary” based on the location of the plant. It should be noted, however, that the labour here included (
) relates only to the employees of the waste
management system and excludes the labour associated with the production of the background processes consumed in the waste management system, e.g. the labour required for the collection will include the driver and “co-pilot” of the collection truck, but exclude the labour needed to produce the diesel consumed by the truck. The annual maintenance is assumed to be a percentage of the CAPEX (dependent of the type of technology) and is divided by the annual capacity of the plant to have the value allocated to one tonne of waste.
∑ ∑
[
∑
]
(5)
The revenues of a waste process j represents the sales of an output q, i.e. amount of output generated per tonne input (
) times the price of a unit of the output ( ) and it is accounted as a negative
value. Such prices will be estimated from literature studies such as Vea et al (2017). The Revenues of a Scenario X, , results from the sum of the revenues of all the processes involved in the scenario, see Equation 6.
∑ ∑
[∑
]
(6)
As can be seen in the equations within this subsection, the estimation of the cost of a scenario is based on the costs of all the items consumed/sold within the waste processes. Waste charges paid by citizens as could be used to validate total costs of scenarios, if they are known to cover costs, this is not always the case. In the same way, gate fees of the different waste treatment facilities could be used to validate total costs of different waste processes. If desired by the user, gate fees could also be used as aggregated cost figures (that will represent the net costs for the facility, i.e. including CAPEX, OPEX and Revenues) but in this case, the costs of individual items (within the specific waste facility such as electricity) should be excluded to avoid double-counting.
6.4 Social Assessment
The social assessment includes local labour, space required as well as the effort required from the biowaste generator. The social assessment focuses on the social aspects of the waste management system within the study zone and excludes the social aspects related to the production of the background processes consumed within (or substituted by the bio-based products of) the biowaste management system.
For the labour required, the assessment uses the same information as for the labour costs explained in Section 6.2, but in this case the unit is person*hour instead of €, i.e. it includes the amount of person*hour needed to handle one tonne of waste in a waste process j and adds up the labour needed in all the waste processes n in each of the m waste management zones of a Scenario X. The latter is calculated with the
product of the number of workers ( ) from literature such as Ferrer-Márquez & Pérez-Gómez (2015)
times annual amount of working hours ( ) divided by the annual capacity ( ) of a specific type and
size of waste facility, see Equation 7.
∑ ∑ [
]
(7)
For the space required, the assessment will distinguish between 3 types of areas: A) private space of the biowaste generator for source separation activities, B) urban area needed for the management of the biowaste, C) non-urban area needed for the management of the biowaste. The inventory of each waste process included in the waste process database includes the space of each type required per tonne of waste input. The latter is calculated with the space occupied of a specific type, A to C, by the equipment
D.5.1. Methodology for the planning of decentralised biowaste management 31
(e.g. bins at source separation) or facility (e.g. AD), , divided by the annual capacity handled, , see
Equation 8.
∑ ∑ [
]
(8)
The effort required from the biowaste generator is measured as dedication hours per person for the sorting of the waste at the place of generation, as well as bringing the biowaste to the storage place (e.g. bring-points) where it is picked up by the collection operator. The inventory of each source separation processes includes an estimation of the required time from each type of biowaste generator per tonne of waste input (
), see Equation 9.
∑ ∑
[ ]
(9)
6.5 Regulatory Assessment
The Regulatory Assessment checks the compliance of the scenario with different EU pieces of regulation using the Regulation Document of DECISIVE (Annex 1 of Deliverable 4.1) as well as the compliance with national and regional targets. The tool will also consider updates on regulation occurring during the developing of the tool.
The compliance of the scenario with the Landfill Directive (it required the diversion of biodegradable municipal waste from landfills to 75% in 2006, 50% in 2010 and 35% in 2016, considering the amount of bio-waste generated in 1995 as reference) is not straight forward because of the different waste targets. While the Directive focuses on biodegradable waste (i.e. biowaste, paper and cardboard), the DST focuses only on biowaste. However, it is still possible to evaluate its contribution to the target as the percentage of biowaste generated in the study area that ends up in a landfill in the specific scenario.
The compliance of the scenario with the Waste Framework Directive (overall minimum of 50% by weight of preparing for re-use and the recycling of waste materials such as at least paper, metal, plastic and glass from households and possibly from other origins as far as these waste streams are similar to waste from households by 2020)
2 cannot be checked directly because the Member
States target does not only include biowaste (sole target of the DECISIVE DST). Instead, this regulatory criterion estimates the contribution towards such target with the Net Biowaste Material Recovery Index described in Section 6.1.
The compliance of the bio-fertilizers generated in a scenario with different national fertilizers regulations (such as the Spanish Real Decreto 999/2017, de 24 de noviembre, por el que se modifica el Real Decreto 506/2013, de 28 de junio, sobre productos fertilizantes
3, or the German
Verordnung über die Verwertung von Bioabfällen auf landwirtschaftlich, forstwirtschaftlich und gärtnerisch genutzten Böden
4) could be checked if data from literature (such as Puig-Ventosa et
al. 2013) can be used to model the dependency between the biowaste input quality, the operation of the biological treatment and the quality of the bio-based output products.
D.5.1. Methodology for the planning of decentralised biowaste management 32
7. Conclusions and Outlook
A methodology for assessing decentralised systems of valorisation of urban biowaste in comparison with other treatment options in a specific study zone has been provided in the present report; such methodology will be implemented in a web-based DST that will allow for an informed discussion among stakeholders to support the selection of the most appropriate solution (or combination of solutions) for the management of the biowaste (including collection and treatment). The DST will be applied in a specific urban area with specific conditions, based on specific sustainability indicators and model assumptions.
The working flow of the DST consists of five main steps: 1) Study zone definition, 2) Scenario Definition, 3) Spatial Inventory and analysis, 4) Mass flow calculation and 5) Network Analysis, Environmental Assessment, Economic Assessment, Social Assessment, and Regulatory and Legislative assessment. While the first two steps are inputs from the user of the tool, the last three steps are outputs of the tool.
Overall, the method tries to be as simple as possible and as comprehensive as necessary to satisfy the needs of the three types of users (waste consultants, waste competent authority and waste operators). It aims at providing a first estimate of the comparisons within scenarios. The user can either use the default waste processes that will be available in the database of the tools or built their own waste processes. Waste processes created by users will not be accessible to other users.
The data that will be available in the tool will come mainly from Europe (based on interview, literature and own calculations) in the years of data generation, i.e. 2018-2020. However, users could apply the tool to other locations and years by adding their own data.
This is a first version of the methodology behind the tool that will be applied to the two demonstration sites of the DECISIVE project (in Catalonia and in Lyon), as well as in a set of theoretical sites in order to test its applicability. Deliverable 6.4 will report such simulation. After such application, it is possible that the methodology will be upgraded based on the learning lessons acquired through such application. Furthermore, parallel system level sustainability assessment of the demonstration and theoretical sites are performed in Deliverables 3.1, 3.2, 3.3, 7.3 and 7.4 supporting possible refinement of the DST.
As well as the upgrade of the presented methodology after the application of the method in the different sites (demonstration and theoretical ones), other potential improvements of the methodology are identified on the following aspects:
Prevention potential: This version of the methodology does not include how to consider and assess the prevention potential of a scenario. However, this is considered an important aspect by the DECISIVE consortium and it will be developed within the next months.
Recovery assessment: This version of the methodology only includes the recovery in mass of the biowaste, but the idea would be that in the future the tool could also present more specific results for various chemical elements (e.g. C, N, P, K and Cd) and their circular reuse in various scenarios. However, to implement such an extension we would need data on each type of treatment and details concerning the way these 5 elements are transferred from inputs to outputs.
Social assessment: The social criteria can be improved by using the quality odour emissions factors provided by Hénault-Ethier et al (2017) as well as an assessment of the resilience of the biowaste management system (e.g. what happens in case of maintenance or shut down of a treatment unit).
Data report: Due to the importance of the data used within the tool, when performing an assessment, the user could be able to get a report on the data used in the assessment, i.e. mention location and year of each process included in each scenario.
User contribution to the databases of the tool: It would be interesting to give the option to the users to share their own processes (i.e. background or waste processes built by themselves) with other users of the tool.
D.5.1. Methodology for the planning of decentralised biowaste management 33
Glossary
Term Definition Source of the definition
Anaerobic digestion (AD)
Waste treatment process taking place in absence of oxygen in which organic matter is degraded by a microbial population producing biogas (methane and carbon dioxide) and digestate.
Own elaboration
Assessment criteria
Set of indicators used to assess the performance of the biowaste management system in the DST tool. See complete definition in page 14
Own elaboration
Background process (BP)
External processes (for the Waste Management Systems) used to produce goods that are consumed in biowaste management systems or substituted by the outputs of the biowaste management system, such as energy and fertilizer products. See complete definition in pages 10 and 15.
Own elaboration
Bio-based product and energy
Product and energy produced from biowaste as main feedstock Own elaboration
Bio-fertilizers Fertilizer produced from biowaste as main feedstock. It is a type of bio-based product.
Own elaboration
Biogas Gas output of the anaerobic digestion process mainly made of methane and carbon dioxide.
Own elaboration
Bio-pesticides Pesticides produced from biowaste as main feedstock. It is a type of bio-based product.
Own elaboration
Biowaste
Biodegradable garden and park waste, food and kitchen waste from households, restaurants, catering and retail premises and comparable waste from food processing plants. See complete definition in page 11.
Point 4 of Article 3 of the WFD
Biowaste generator
Households, restaurants or any type of commercial activities that produce biowaste in their activities.
Own elaboration
Biowaste Net Energy Recovery Index (BNERI)
Index that quantifies the capacity of the biowaste management system to convert waste into material resources. It is one of the network analysis indicators included in the assessment criteria of the tool.
Own elaboration based on Font-Vivanco et al. (2012)
Biowaste Net Material Recovery Index (BNMRI)
Index that quantifies the capacity of the biowaste management system to convert waste into energy resources. It is one of the network analysis indicators included in the assessment criteria of the tool.
Own elaboration based on Font-Vivanco et al. (2012)
Biowaste sorting efficiency
Percentage of the biowaste generated that is thrown away in the selective bin for biowaste.
Own elaboration
Biowaste Source Separation
Waste management stage in which biowaste is discarded at the place of generation in a dedicated bin for biowaste. See complete definition in page 12
Own elaboration
Biowaste source
Same as biowaste generator
Biowaste sub-fractions
components of the biowaste such as plant-derived food waste, animal-derived food waste and green waste and woody waste
Own elaboration
Biowaste-specific emissions
Emissions that are mainly related to the elemental composition of the biowaste input in a specific waste treatment process. Note that several types of emissions are both technology-specific and biowaste-specific such as methane emissions in a composing process.
Own elaboration
D.5.1. Methodology for the planning of decentralised biowaste management 34
Term Definition Source of the definition
Biowaste Treatment
Biowaste Treatment represent recovery or disposal operations, including preparation prior to recovery or disposal (point 14 of Article 3 of the WFD) exclusively for source-separated biowaste. See complete definition in page 12
Own elaboration based on point 14 of Article 3 of the WFD
Capital Expenditure (CAPEX)
Money spends by an organization to purchase capital goods such as buildings, vehicles, equipment and land
Own elaboration
Capital Expenses Same as capital expenditure Own elaboration
Capital good Tangible asset to produce goods or services by an organization (e.g. buildings, equipment and machinery)
Own elaboration
Centralized system
Waste management system based on large-scale facilities that are often far from the waste generators.
Own elaboration
Characterisation Factor (CF)
Contribution of a specific type of emission (e.g. methane) to an environmental impact category (e.g. climate change)
Own elaboration
Chemical contaminat
same as micro-impurity
Chemical impurity same as micro-impurity
Climate Change Environmental impact category that represents the change in climate patterns mainly due to the increased levels of atmospheric greenhouse gases
Own elaboration
Collection chain It includes generation, source-separation and collection of waste Own elaboration
Collection of non-separated biowaste
Gathering of waste, including the preliminary sorting and preliminary storage of waste for the purposes of transport to a waste treatment facility (point 10 of Article 3 of the WFD) in which biowaste is not kept separated from other waste types. See complete definition in page 12.
Own elaboration based on the collection definition given in the WFD
Collection of source-separated biowaste
Gathering of waste, including the preliminary sorting and preliminary storage of waste for the purposes of transport to a waste treatment facility (point 10 of Article 3 of the WFD) in which biowaste is kept separated from other waste types. See complete definition in page 12.
Own elaboration based on the collection definition given in the WFD
Composting Waste treatment process in which a microbial population decomposed the organic matter in aerobic conditions (in presence of oxygen) to produce compost.
Own elaboration
Decentralized systems
Waste management system based on small-scale facilities that closer to waste generators than centralized systems.
Own elaboration
DECISIVE facilities
Term that includes micro-scale Anaerobic Digestion and Solid State Fermentation.
Own elaboration
Demonstration sites
Physical places in which the DECISIVE facilities and concept will be tested during the DECISIVE project. One of the demonstration site will be located in the premises of UAB (Catalonia) and the other in the premises of Refarmers (Lyon).
Own elaboration
Digestate Material remaining after degradation of the organic matter in the anaerobic digestion process.
Own elaboration
Direct emissions Emissions occurring in all the stages of the waste management system excluding the production of the background processes consumed in the waste management system
Own elaboration
D.5.1. Methodology for the planning of decentralised biowaste management 35
Term Definition Source of the definition
Disposal
Any operation which is not recovery even where the operation has as a secondary consequence the reclamation of substances or energy. Annex I sets out a non-exhaustive list of disposal operations. See complete definition in page 12
Point 19 of Article 3 of the WFD
Energy recovery
Any recovery operation in which waste is converted into heat, electricity or fuel. See complete definition in page 13
Wfd
Environmental compartment
Physical part of the global environment where a specific emission is emitted, e.g. air, water and soil
Own elaboration
Environmental Footprint
Impact on the environment. Own elaboration
Environmental Impact category
Type of impact on the environment. Own elaboration
Final disposal Same as Disposal
Food waste See definition in the 2nd parragraph of page 11.
Functional unit (FU)
According to FUSIONS (2014), food waste is any food, and inedible parts of food, removed from the food supply chain to be recovered or disposed of (including composting, crops ploughed in/not harvested, anaerobic digestion, bio-energy production, co-generation, incineration, disposal to sewer, landfill or discarding to sea) . DECISIVE deals only with the food waste generated in the last stages of the food supply chain, i.e. retail, food preparation and consumption. See complete definition in page 11.
Fusions (2014)
Garden waste
Waste generated in gardens, parks and other locations (cemeteries, road sides, dykes etc.). Garden waste can be further divided into green waste, a part that is easily digestible by anaerobic microorganisms and woody waste, which is the difficult to digest part (woody waste) under anaerobic conditions. See complete definition in page 11.
Own elaboration
Gate fees Also called tipping fee is a charge received at a waste treatment facility for handling a given amount of a specfic type of waste
Own elaboration
Generation of Biowaste
Waste management stage in which the biowaste is produced as a result of food preparation, food consumption, pruning, grass cutting, etc. See complete definition in page 11.
Own elaboration
Generation Sources
Same as biowaste generator.
Geo-locatisation
Geographic position of a specific object. Own elaboration
Green waste
In the scope of DECISIVE, this term refers exclusively to the soft, compactable and the most easily digestible part of the garden waste. It includes grass cuttings, leaves, flowers, herbs, etc. See complete definition in page 11.
Deliverable 3.5
Impurities General term that includes macro- and micro-impurities. Own elaboration
Incineration Waste treatment process that involves combustion of waste. There are many different types of incineration facilities and technologies.
Own elaboration
Indirect emissions
Emissions occurring in during the production and use of the background processes consumed in the waste management system
Own elaboration
Landfill Disposal site where waste is buried. There are different types of landfills.
Own elaboration
Life Cycle Assessment (LCA)
Method to assess the environmental impacts associated with all the life cycle of a product or service.
Own elaboration
Life Cycle Costing (LCC)
Method to assess the economic impacts associated with all the life cycle of a product or service.
Own elaboration
Term Definition Source of the
D.5.1. Methodology for the planning of decentralised biowaste management 36
definition
Macro-impurities
Macro-impurities are non-biowaste fractions (such a paper, plastic and metals) that are discarded in a wrong way into the biowaste bin and that can be, in some cases, mechanically removed.
Own elaboration
Material contaminant
Same as micro-impurity.
Material recovery
Same as recycling.
Mechanical separation
Waste treatment process in which waste is separated into different waste sub-fractions using a set of mechanical equipment.
Own elaboration
Micro-impurities
Micro-impurities are chemical contamination that cannot be mechanically removed and that are caused by food contaminants, contaminated green waste, or the presence of macro-impurities in the source-separated biowaste stream.
Own elaboration
Micro-pollutants Same as micro-impurity.
Micro-scale anaerobic digestion
Small scale anaerobic digestion. In the context of the DECISIVE project, the annual input capacity for a micro-scale anaerobic digestion is below 200 t/year
Own elaboration
Mixed waste For DECISIVE project, we have named “mixed waste” the mixed municipal waste collected in areas where biowaste is not collected separately.
Own elaboration
Operational Expenditures (OPEX)
Ongoing cost for an organization for running its activity. Own elaboration
Operation Expenses
Same as operational expenditures.
Organic Matter carbon-based compounds such as food waste or other materials made by compounds that contain carbon.
Own elaboration
Physical impurity
Same as macro-impurity.
Private space of the generator
Space in the premises of the waste generator. Own elaboration
Recovery Same as Material and Energy Recovery
Recycling
Any recovery operation by which waste materials are reprocessed into products, materials or substances whether for the original or other purposes. It includes the reprocessing of organic material but does not include energy recovery and the reprocessing into materials that are to be used as fuels or for backfilling operations
Point 17 of Article 3 of the WFD
Residual waste For DECISIVE project, we have named “residual waste” the mixed municipal waste collected in areas where separate collection of biowaste is implemented.
Own elaboration
Resilience Capacity of ability to recover from changes or perturbations
Own elaboration
Revenues Income of an organization to carry out its activity Own elaboration
Scenario Technological pathways to handle the biowaste
Own elaboration
Solid-state fermentation (SSF)
SSF is an emerging technology for the bioconversion of organic solids into value-added products such as bio-pesticides
Deliverable 4.2
Study Zone Area where the assessment is wanted to be carried out. It can have different geographical scales, from a country to a small piece of a municipality
Deliverable 4.1
Target users The intended users of the DST that are mainly competent waste authorities, waste consultants and waste operators.
Own elaboration
Technical life time
Period of time for which a piece of equipment or machinery can be used
Own elaboration
D.5.1. Methodology for the planning of decentralised biowaste management 37
Term Definition Source of the definition
Technology-specific emissions
Emissions that are exclusively related to the waste treatment technology, regardless of the input biowaste. Note that several types of emissions are both technology-specific and biowaste-specific such as methane emissions in a composing process.
Own elaboration
Transport Intensity Index
Index that estimates how intensive the system is in terms of transport based on the distances travelled by the biowaste generated in the study zone during its management. It is one of the network analysis indicators included in the assessment criteria of the tool.
Own elaboration based on Font-Vivanco et al. (2012)
Treatment recovery or disposal operations, including preparation prior to recovery or disposal . See complete definition in page 12
Point 14 of Article 3 of the WFD
Waste charges Fee paid by the waste generator for the service of managing its waste. It can include waste treatment charge and waste collection charge.
Own elaboration
Waste collectors
Organization (private or public) responsible for the collection of the waste
Own elaboration
Waste generators
Households, restaurants or any type of commercial activities that produce waste in their activities.
Own elaboration
Waste management system
Combination of activities necessary to handle waste Own elaboration
Waste management zone
Sub-areas of the study zone with the same type of biowaste management systems
Own elaboration
Waste valorisation
Same as Material and Energy Recovery Own elaboration
Woody waste
The ligno-cellulosic (wood-rich) part of the garden waste which includes twigs, branches, etc. and is rigid, bulky and difficult to digest by anaerobic microorganisms without a previous special pre-treatment. See complete definition in page 11
Deliverable 3.5
D.5.1. Methodology for the planning of decentralised biowaste management 38
Brogaard, L.K. & Christensen, T.H. (2016) Life cycle assessment of capital goods in waste management systems. Waste Management. Volume 56, October 2016, Pages 561-574.
Council Directive 1999/31/EC of 26 April 1999 on the landfill of waste (Landfill Directive)
Clavreul, J., Guyonnet, D., Christensen, T.H., 2012. Quantifying uncertainty in LCA modelling of waste management systems. Waste Manag. 32, 2482–2495.
Clavreul, J., Baumeister, H., Christensen, T. H. & Damgaard, A. (2014) An environmental assessment system for environmental technologies. Environmental Modelling & Software, 60, 18-30
Directive 2008/98/EC OF THE EUROPEAN PARLIAMENT AND OF THE COUNCIL of the 19 November 2008 on waste and repealing certain Directives. (Waste Framework Directive)
Edo, M., Björn, E., Persson, P. E. & Jansson S. (2016) Assessment of chemical and material contamination in waste wood fuels – A case study ranging over nine years. Waste Management 49 (2016) 311–319
European Parliament (2017) Scientific aspects underlying the regulatory framework in the area of fertilisers – state of play and future reforms. Directorate-General for Internal Policies. Policy Department A. Economic and Scientific Policy. http://www.europarl.europa.eu/RegData/etudes/IDAN/2016/595354/IPOL_IDA(2016)595354_EN.pdf
Ferrer-Márquez & Pérez-Gómez (2015) La generación de empleo en la gestión de la materia orgánica de residuos urbanos en el marco de la generalización de la recogida selectiva. http://www.ccoo.es/3a8ec124d7dca392a4646af2fe4070d2000001.pdf
FUSIONS (2014) Definitional Framework for Food Waste Full Report. http://www.eu-fusions.org/phocadownload/Publications/FUSIONS%20Definitional%20Framework%20for%20Food%20Waste%202014.pdf
Gentil, E. C. et al. (2010) ‘Models for waste life cycle assessment: Review of technical assumptions’, Waste Management. Elsevier Ltd, 30(12), pp. 2636–2648. doi: 10.1016/j.wasman.2010.06.004
Hénault-Ethier, L., Martin, J.F., & Housset, J. (2017) A dynamic model for organic waste management in Quebec (D-MOWIQ) as a tool to review environmental, societal and economic perspectives of a waste management policy. Waste Management Volume 66, August 2017, Pages 196-209
ISO 14040:2006 Preview Environmental management -- Life cycle assessment -- Principles and framework
ISO 14044:2006 Preview Environmental management -- Life cycle assessment -- Requirements and guidelines
JRC (2011) Supporting Environmentally Sound Decisions for Waste Management A technical guide to Life Cycle Thinking (LCT) and Life Cycle Assessment (LCA) for waste experts and LCA practitioners. Available: http://publications.jrc.ec.europa.eu/repository/bitstream/JRC65850/reqno_jrc65850_lb-na-24916-en-n%20_pdf_.pdf
Mena, M., Benmatí, A., Pujolà, M., Tàrraga, J. & Comas, J. (2014) Eficiencia en el proceso de tratamiento de la fracción orgánica de los residuos municipales (FORM): Estudio del caso Ecoparc 2 de Montcada I
Martínez, E., Iñarra, B., Ramos, S., González, N., Guinea de Salas, A., Vázquez, L., Zufía, J. (2017) Decision Making Supporting Tool Combining AHP Method with GIS for Implementing Food Waste Valorisation Strategies. Waste Biomass Valor (2017) 8:1555–1567
Martinez-Sanchez, V., Kromann Mikkel. A., Astrup, T.F., (2014) Life cycle costing of waste management systems: Overview, calculation principles and case studies. Waste Management 36 (2015) 343–355
Pizzol, M., Scotti, M., Thomsen, M., 2013. Network Analysis as a tool for assessing environmental sustainability: Applying the ecosystem perspective to a Danish Water Management System. Journal of Environmental Management 18, 21-31.
Pizzol, M, C.R. Smart, J & Thomsen, M (2014) External costs of cadmium emissions to soil: a drawback of phosphorus fertilizers' Journal of Cleaner Production, vol 84, s. 475-483., 10.1016/j.jclepro.2013.12.080
Puig-Ventosa, I., Freire-González, J. & Jofra-Sora, M. (2013) Determining factors for the presence of impurities in selectively collected biowaste. Waste Management & Research 31(5) 510–517
San Martin, D., Orive, M., Martínez, E., Iñarra, B., Ramos, S., González, N., Guinea de Salas, A., Vázquez, L., Zufía, J. (2017) Decision Making Supporting Tool Combining AHP Method with GIS for Implementing Food Waste Valorisation Strategies. Waste Biomass Valor (2017) 8:1555–1567
Thomsen, M., Seghetta, M., Mikkelsen, M.H., Gyldenkærne, S., Becker, T., Caro, D., Frederiksen, P., (2017) Comparative life cycle assessment of biowaste to resource management systems A Danish case study. Journal of Cleaner Production 142 (2017) 4050-4058
Vea, E.B., Romeo, D., Thomsen, M., 2017. Biowaste valorisation in a future circular bioeconomy. 25th CIRP Life Cycle Engineering (LCE) Conference, 30 April – 2 May 2018, Copenhagen, Denmark. Procedia CIRP 00 (2017) 000–000
Wellinger, A., Murphy, J. & Baxter, D. (2013) The Biogas Handbook. Chapter 12. 1st Edition. Science, Production and Applications
The content of this report does not reflect the official opinion of the European Union. Responsibility for the information and views expressed therein lies entirely with the authors.