87
Version 2.0

Version 2.0

Subernarekha Basin Report
www.india-wris.nrsc.gov.in
i
Preface
Optimal management of water resources is the necessity of time in the wake of development and
growing need of population of India. The National Water Policy of India (2002) recognizes that
development and management of water resources need to be governed by national perspectives in
order to develop and conserve the scarce water resources in an integrated and environmentally
sound basis. The policy emphasizes the need for effective management of water resources by
intensifying research efforts in use of remote sensing technology and developing an information
system. In this reference a Memorandum of Understanding (MoU) was signed on December 3, 2008
between the Central Water Commission (CWC) and National Remote Sensing Centre (NRSC), Indian
Space Research Organisation (ISRO) to execute the project “Generation of Database and
Implementation of Web enabled Water resources Information System in the Country” short named
as India-WRIS WebGIS.
India-WRIS WebGIS has been developed and is in public domain since December 2010 (www.india-
wris.nrsc.gov.in). It provides a ‘Single Window solution’ for all water resources data and information
in a standardized national GIS framework and allow users to search, access, visualize, understand
and analyze comprehensive and contextual water resources data and information for planning,
development and Integrated Water Resources Management (IWRM).
Basin is recognized as the ideal and practical unit of water resources management because it allows
the holistic understanding of upstream-downstream hydrological interactions and solutions for
management for all competing sectors of water demand. The practice of basin planning has
developed due to the changing demands on river systems and the changing conditions of rivers by
human interventions. The multiple uses of water and varying demands on a river basin require an
integrated approach to managing river basin.
Basin wise report generation is one the important deliverables of India-WRIS project. Report of
Subernarekha basin describes systematically the present status of water resources: major water
resources projects, hydro-meteorological observations, surface and ground water development
scenario, topographic characteristics, climatic variability, land use / land cover pattern & allied
natural resources along with socio-economic profile of the basin. The report contains valuable latest
information of the basin on all aspects of water resources and allied sectors and will be useful as
baseline information for the irrigation officials, hydrologists, agriculturalists, conservationists,
research organizations and all those involved in the development of Subernarekha basin.

Subernarekha Basin Report
www.india-wris.nrsc.gov.in
ii
Acknowledgements
The Subernarekha basin report is an outcome of the project “Generation of Database and
Implementation of Web enabled Water resources Information System in the Country” short named
as India-WRIS WebGIS jointly executed by the Central Water Commission (CWC) and National
Remote Sensing Centre (NRSC), Indian Space Research Organization (ISRO). This comprehensive
publication gives the present status of water resources assets, topographic features, climatic
variability, land use / land cover pattern & allied natural resources along with socio-economic
information of the basin.
We, on behalf of the authors and India-WRIS project team acknowledge; Shri Alok Rawat, Secretary,
Ministry of Water Resources; Mrs. Sudha Midha, Additional Secretary, Ministry of Water
Resources; Er. A. B. Pandya, Chairman, Central Water Commission; Dr. K. Radhakrishnan, Chairman,
Indian Space Research Organization and Secretary, Department of Space; Shri Sudarsanam
Srinivasan, Secretary to GOI and Member- Finance, Department of Space; Shri A. Vijay Anand,
Additional Secretary, Department of Space; Dr. V. Koteswara Rao, Scientific Secretary, ISRO; Dr. V.
Jayaraman, Ex-Director, NRSC for constant encouragement and guidance, technical discussions and
for evincing keen interest in India-WRIS project and this report.
Our foremost acknowledgement is towards India-WRIS project team who created and
organized large number of data sets and information in GIS format as seamless layers and attribute
data for the entire country which served as base for this report. Thanks are also due to all CWC and
NRSC / ISRO officials who carried out the quality assurance and shown their enthusiastic
involvement. Finally, our sincere thanks are to all divisions and officials of NRSC and CWC for their
valuable support during the preparation of this report.
The basin report includes the results generated through interpretation of latest satellite imageries as
well as compilation of huge information from voluminous records. This would not have been
possible without the countrywide support. We would like to thank all the organizations, institutes
and individuals who contributed either directly or indirectly in bringing out this publication.
Dr. J R Sharma Project Director, India-WRIS &
Chief General Manager, RCs/ NRSC/ ISRO, New Delhi
Er. Yogesh Paithankar Project In-charge, India-WRIS &
Director, CWC, New Delhi

Subernarekha Basin Report
www.india-wris.nrsc.gov.in
iii
Executive summary
This report provides valuable information related to the topographic, demographic, climatic, surface
and ground water resources, hydro-meteorological and water quality scenario of Subernarekha
basin. The Subernarekha basin extends over the states of Jharkhand, Odisha and comparatively
smaller part in West Bengal having a total geographically calculated area of 25792.15 Sq.km. The
basin spreads over 15 parliamentary constituencies (2009) comprising 7 of Jharkhand and 4 each of
Odisha and West Bengal and encompasses 12 districts (Census 2011) overall 7 of Jharkhand, 2 of
Odisha and 3 of West Bengal. Subernarekha has a total population of 7842314 and a nearly equal sex
ratio. The Subernarekha basin consists of 45 watersheds. The Subernarekha and the Burhabalang
forms the major river systems in the basin. The Subernarekha River and its tributaries are an inter-
state river system, flowing through the states of Jharkhand and Odisha. Its principal tributaries
joining from right are the Kanchi, the Karkari and the Kharkai. The basin has got rich mineral
resources spread over vast areas and houses many important industries.
The basin is generally influenced by the South-West monsoon, which onsets in the month of June
and extends up to October. Having average annual rainfall for the basin is around 1400 mm and
average annual maximum temperature as around 30° C, the climate in the sub-basin is tropical with
hot summer and mild winters. As per the assessment of land use/land cover (2005-06), the major
part of the basin is covered with agricultural land accounting to 53.76% of the total area, forests
covering 25% of the total basin area and around 2.39% of the basin is covered by water bodies. Clay,
sand and silt are predominant in the basin. The basin covers 3 agro-climatic zones, viz., Eastern
Plateau and Hills Region, Lower Gangetic Plain Region and East Coast Plains and Hills Region and 4
agro-ecological zones with major part of the basin falling under Hot subhumid ecoregion with red
and lateritic soils agro-ecological zone. Around 22.56% of total basin area lies in the elevation zone
of 200-300 m. Subernarekha basin consists of surface water bodies in the form of lakes, ponds,
reservoirs, tanks etc. Tanks are the most predominant with 15359 in number and forms about
69.14% of total water bodies in the basin. 38 Dams and 12 Barrages and 4 Weirs are constructed in
the basin. Around 83% dams are used for the purpose of irrigation. There are 3 major and 32
medium command areas in the basin. Subernarekha Irrigation Project and Kangsabati are the 2 AIBP
projects, being executed in Subernarekha basin. There are a total of 38 major/medium
irrigation/multi-purpose projects in the basin. There are 2 flood forecasting stations, 10 telemetry
stations and 12 hydrological observation stations are there in the basin measuring different
parameters. Also at 7 ground water quality observation wells in the basin ground water quality data
is monitored by Central Ground Water Board (CGWB). The basin also houses 12 hydro-
meteorological stations by Central Water Commission (CWC), 21 stations by Indian Meteorological
Department (IMD) and 24 Automated Weather Stations (AWS) by Indian Space Research
Organisation (ISRO) for the observation of various meteorological parameters. These stations are
maintained by MOSDAC.
Inland Waterways Authority of India (IWAI)’s National Waterway No. 5 falls in the Subernarekha
basin. Two important inter basin transfer links viz., the Subernarekha-Mahanadi Link and the Ganga-
Damodar-Subernarekha Link are also present in the basin. Four major tourist spots including one
National Park are present in this basin. The report is supported with a list of annexures which gives
tabular details of all data pertaining to different sections in the report.

Subernarekha Basin Report
www.india-wris.nrsc.gov.in
iv
Table of Contents
Preface ---------------------------------------------------------------------------------------------------------- i Acknowledgements ----------------------------------------------------------------------------------------- ii Executive summary ----------------------------------------------------------------------------------------- iii 1. Introduction ------------------------------------------------------------------------------------------------------------ 1
1.1 Overview of basin ---------------------------------------------------------------------------------------------------------- 2 1.2 Topography ------------------------------------------------------------------------------------------------------------------ 6 1.3 Climate ---------------------------------------------------------------------------------------------------------------------- 10
1.3.1 Rainfall -------------------------------------------------------------------------------------------------------- 10 1.3.2 Temperature ------------------------------------------------------------------------------------------------ 11 1.3.3 Trends and variability ------------------------------------------------------------------------------------- 13
1.4 Major rivers ---------------------------------------------------------------------------------------------------------------- 13 1.5 Land use/ land cover ---------------------------------------------------------------------------------------------------- 15 1.6 Soils -------------------------------------------------------------------------------------------------------------------------- 17 1.7 Agro climatic zones ------------------------------------------------------------------------------------------------------ 22 1.8 Agro ecological zones --------------------------------------------------------------------------------------------------- 23 1.9 Demography --------------------------------------------------------------------------------------------------------------- 24
2. Hydrological units --------------------------------------------------------------------------------------------------- 26 2.1 Sub basins ------------------------------------------------------------------------------------------------------------------ 26 2.2 Watersheds ---------------------------------------------------------------------------------------------------------------- 26
3. Surface water resources ------------------------------------------------------------------------------------------- 28 3.1 Surface waterbodies ----------------------------------------------------------------------------------------------------- 28 3.2. Water resource projects ----------------------------------------------------------------------------------------------- 29 3.2.1 Major and medium irrigation projects- ----------------------------------------------------------------- 29 3.2.2 Hydro Electric projects- ------------------------------------------------------------------------------------- 30 3.2.3 Dams, Barrages/Weirs/Anicuts-------------------------------------------------------------------------- 31
3.2.4 Command area and canal network ---------------------------------------------------------------------- 35 3.4.5 Multipurpose projects------------------------------------------------------------------------ ------------35
3.4.6 Interstate projects -------------------------------------------------------------------------------------------- 35
4. Ground water resources ------------------------------------------------------------------------------------------- 37 4.1 Ground water observation wells ------------------------------------------------------------------------------------- 37 4.2 Ground water level fluctuation --------------------------------------------------------------------------------------- 39 4.3 Litholog well locations -------------------------------------------------------------------------------------------------- 42
5. Hydro met observations ------------------------------------------------------------------------------------------- 44
5.1 Hydrological observation sites ---------------------------------------------------------------------------------------- 46 5.2 Flood forecasting sites -------------------------------------------------------------------------------------------------- 46 5.3 Meteorological stations ------------------------------------------------------------------------------------------------ 47
6. Water quality --------------------------------------------------------------------------------------------------------- 48 6.1 Surface water quality observations ---------------------------------------------------------------------------------- 48 6.2 Ground water quality observations --------------------------------------------------------------------------------- 49
7. Inter basin transfer links ------------------------------------------------------------------------------------------ 50 8. Inland navigation waterways ------------------------------------------------------------------------------------ 52 9. Water tourism sites ------------------------------------------------------------------------------------------------- 53 10. Conclusion ----------------------------------------------------------------------------------------------------------- 56 Annexure I: State, district and parliamentary constituency in the basin Annexure II : Climate – Rainfall (1971 2004) and Temperature (1969 2004) profile in the basin Annexure III : Population and drinking water facilities in the basin Annexure IV : Inventory of surface water resources Annexure V : Inventory of litholog well locations Annexure VI : Salient features of hydro meteorological stations Annexure VII : Inventory of water tourism sites
Acronyms References

Subernarekha Basin Report
www.india-wris.nrsc.gov.in
v
Authors
List of Tables
Table 1. Salient features of the basin 6 Table 2. Elevation zones 8 Table 3. Length of major rivers 14 Table 4. Land use/ land cover statistics (2005-06) 15 Table 5. Sub basin wise watersheds 26 Table 6. Number and size of waterbodies 28 Table 7. Number of water resources projects 31 Table 8. Sub basin wise number and type of water resources structures 30 Table 9. Sub basin wise number of ground water observation wells 37 Table 10. Hydrological observation sites of CWC 46 Table 11. Types of flood forecasting stations of CWC 47 Table 12. Meteorological stations 47 Table 13. Water tourism sites 54
List of Maps
Map 1. Index map 3 Map 2a. Satellite imagery of Subernarekha Basin 4 Map 2b. Subernarekha Basin- Drainage & Sub-basin 5 Map 3. Elevation zones 9 Map 4. Annual average rainfall 11 Map 5. Land use/ land cover (2005-06) 16 Map 6. Soil texture 18 Map 7. Soil erosion 19 Map 8. Soil slope 20 Map 9. Soil productivity 21 Map 10. Agro-climatic zones 22 Map 11. Agro-ecological zones 23 Map 12. Population density 25 Map 13. Subernarekha Sub-basin and watersheds 27 Map 14. Major water resources structures and projects 33 Map 15. Subernarekha Sub-basin wise water resources assets 34 Map 16. Command area and canal network 36 Map 17. Location of ground water observation wells 38 Map 18. Ground water level fluctuation (Recharge) 40 Map 19. Ground water level fluctuation (Draft) 41 Map 20. Litholog well locations 43 Map 21. Hydro observation and flood forecasting stations 45 Map 22. Inter basin transfer links 51 Map 23. Inland navigation waterways 53 Map 24. Water tourism sites 55
List of Figures
Figure 1. State wise area of basin 7 Figure 2. Monthly average temperature (1969-2004) 12 Figure 3. Trend of annual rainfall (1971-2004) 13 Figure 4. Type and number of waterbodies 29 Figure 5. Dam classification based on storage 32 Figure 6. Dam classification based on purpose 32

Subernarekha Basin Report
www.india-wris.nrsc.gov.in
1
1. Introduction
India, officially the Republic of India is seventh-largest country with geographical area 32, 87,263 km²
(2.45% of the World’s land resources) and the second-most populous country with over 1.2 billion
people (17.5% of the World’s population) and holds 4% of the world’s fresh water resources. Access
to water is a major factor in human development. Every year India gets 4,000 BCM of water, out of
which, the available account is 1869 BCM. Out of this total available water, the utilizable water from
surface water resources is 690 BCM and from ground water resources is 433 BCM adding upto only
1123 BCM. The total actual renewable water resources for India is 1700 cubic meter per capita per
year for the year 2005, which is sufficient as of now against the benchmark value of 1000 cubic
meter per capita per year which signifies ‘Water Stressed’ condition. In the shadow of continued
population growth, water availability projected for the year 2025 and 2050 is 1341 cubic meter per
capita per year and 1140 cubic meter per capita per year respectively.
Being an agrarian country a major part of water resources withdrawals goes for irrigation. Over the
years, India has made remarkable progress through high level of engineering expertise permitting
the storage and diversion of large capacities of water. As on July 2007, total live storage capacity of
all basins assessed is 282 BCM with 5125 large dams and 1894 number of Major and Medium
irrigation projects. All water resources projects of the basin should be considered for basin level
planning to achieve optimal development of the water resources. In the initial stages of
development, interactions between projects of different states were absent and each project could
be planned and implemented independently. As the demand for water has increased due to increase
in the developmental activities as well as increase in population, interactions between individual
projects have come into play and have called for integrated development of river basins.
The National Water Policy of India (2002) recognizes that development and management of water
resources need to be governed by national perspectives and aims to develop and conserve the water
resources in an integrated and environmentally sound basis. It emphasizes development of our
water resources by intensifying research efforts with use of space technology and developing an
information system.
Central Water Commission (CWC), an attached office of Ministry of Water Resources, Govt. of India,
and Indian Space Research Organization (ISRO), Department of Space, Govt. of India, joined hands
for development of Web enabled Water Resources Information System of India (India-WRIS).
Considering river basins as the basic hydrological units for water resources planning and
management, the country is divided into 25 basins and 101 sub basins under India-WRIS project
based on digital elevation model (SRTM DEM).

Subernarekha Basin Report
www.india-wris.nrsc.gov.in
2
1.1 Overview of basin
Situated in the north-east corner of the Peninsular India, the Subernarekha basin has a long sausage
shape. Subernarekha literally means golden line. According to legends, in ancient times, gold was
being extracted in the river’s bed close to its origination point near Piska village, close to Ranchi. In
Map 1, the location and size of the basin on map of India with Digital Elevation Model (DEM) in the
backdrop can be seen. Subernarekha basin extends over the states of Jharkhand, Odisha and
comparatively smaller part in West Bengal having a total reported area of 29,196 Sq.km and
geographically calculated area of 25,792.17 Sq.km with a maximum length and width of about 297
km and 119 km. The basin encompasses 12 districts overall (Census 2011) 7 of Jharkhand, 2 of
Odisha and 3 of West Bengal. The basin spreads over 15 parliamentary constituencies (2009)
comprising 7 of Jharkhand and 4 each of Odisha and West Bengal. Out of these only 9 parliamentary
constituencies are broadly covered under the basin. The rest 6 parliamentary constituencies have
negligible area of less than 3% falling under the basin. Figure 1 describes the percentage of the basin
area falling under each state it encompasses. Further details of these districts and parliamentary
constituencies are listed in Annexure I:A and B respectively.
The drainage of Subernarekha basin is formed by the river network present in it. Map 2b depicts the
detailed information of Subernarekha basin including major towns, state capitals, major dams,
Barrages/Weirs/Anicuts (BWA) constructed, the drainage in the basin and the some of the Hydro
Observation sites maintained by CWC located along the rivers in the basin. In the map the white
hillshade (90 m) background around the basin shows topographical details.
The basin has average water resources potential is 12.37 BCM out of which utilizable surface water
resources accounts for 6.8 BCM. Total live storage of the basin is 2322.21 MCM with average annual
runoff of 12368.00 MCM (as reported by CWC).
Table 1 lists some of the salient features of Subernarekha basin.

Subernarekha Basin Report
www.india-wris.nrsc.gov.in
3
Map 1. Index map

Subernarekha Basin Report
www.india-wris.nrsc.gov.in
4
Map 2a. Satellite imagery of Subernarekha Basin

Subernarekha Basin Report
www.india-wris.nrsc.gov.in
5
Map 2b. Subernarekha Basin- Drainage & Sub-basin

Subernarekha Basin Report
www.india-wris.nrsc.gov.in
6
Table 1. Salient features of the basin
S.no Features Description
1 Basin Extent 85° 8' to 87° 32' E 21° 15' to 23° 34' N
2 Area (Sq.km) 29,196 (as reported by CWC) 25,792.17 (Geographically calculated)
3 States in the basin Jharkhand (48.84%) Odisha (37.96%) and West Bengal (13.2%)
4 Districts (Census 2011) 9 (more than 15% of area falling in the basin) 3 (less than 15% of area falling in the basin) Total = 12
5 Parliamentary Constituencies (2009) 9 (more than 15% of area falling in the basin) 6 (less than 15% of area falling in the basin) Total = 15
6 Mean Annual Rainfall (mm) 1458.61 (0.5° grid for 1971-2005) 1383.35 (1° grid for 1969-2004)
7 Mean Maximum Temperature (°C) 31.46
8 Mean Minimum Temperature (°C) 20.50
9 Total Population 74,26,016
10 Number of villages 13353
11 Highest Elevation (m) 1166
12 Avg. Annual Water Potential (BCM) 12.37
13 Utilizable Surface Water (BCM) 6.80
14 Number of Sub Basins 1
15 Number of Watersheds 45
16 Number of water resources structures Dams – 38 Barrages – 4 Weirs – 12 Power houses - 3
17 Highest Dam Lower Purulia dam (PPSP) - 95 m
18 Longest Dam Jambhira dam - 7.36 km
19 Highest Barrage Galudih barrage -27.5 m
20 Longest Barrage Galudih barrage - 369 m
21 Number of Irrigation projects Major - 05 Medium - 34
22 Number of HE projects 1
23 Number of Ground water observation wells
166
24 Number of Hydro-Observation Sites 12
25 Number of Flood Forecasting Sites 2 (Level Forecast)
26 Water tourism sites 4 *as per data available under India-WRIS

Subernarekha Basin Report
www.india-wris.nrsc.gov.in
7
Figure 1. State wise area of basin
1.2 Topography
The Subernarekha basin is bounded by the Chhotanagpur plateau on the north and the west, by the
ridges separating it from Baitarani basin on the south, by the Bay of Bengal on the south-east and by
the Kasai Valley of Kangsabati River on the east.
The Subernarekha basin has two major topographical divisions in the basin, namely (i) the northern
plateau and (ii) the coastal plains. The plateau region covers the district of Purulia in West Bengal
and the Ranchi and Singhbhum districts in Jharkhand. Part of the Mayurbhanj district of Odisha lying
in the basin, is hilly and well-forested. The coastal plains cover parts of Baleshwar district in Odisha
and of the Purba Medinipur and Pashchim Medinipur districts of West Bengal lying in the basin.
The general slope of the basin is from north-west to south-east. The area covered under different
elevation zones of the basin is shown in Table 2 and Map 3. The highest peak with an elevation of
1166 m is located in Garhjat range near Udala tehsil, Mayurbhanj district in Odisha. More than 24%
of the area of the basin lies in the hilly region and dense forested area. Major area of the plain
region of the Subernarekha basin falls under the 100-300 m elevation zone.
The geological formations occurring in the basin are (i) Pre-Cambrian or Archean (ii) Tertiary and (iii)
Alluvium plains. Out of these, Pre-Cambrian formations mostly cover Jharkhand and West Bengal
regions and Tertiary and Alluvium plains cover the basin area in Odisha. The Archean formations
mostly comprise Geneiss, Micagenists, Phyllites, Dolomites and Granites. The underlying rock is
highly undulating. This region contains some of the richest coal and ore deposits like iron and
bauxite.

Subernarekha Basin Report
www.india-wris.nrsc.gov.in
8
Table 2. Elevation zones
Sl. No. Elevation (m) Area (Sq.km) % of Total Area
1 < 5 901.73609 3.08856
2 5-10 852.6612 2.920473
3 10-50 3838.8912 13.14869
4 50-100 4000.3303 13.70164
5 100-200 4636.8071 15.88165
6 200-300 6586.5204 22.55967
7 300-400 2904.8775 9.949574
8 400-500 1670.44 5.72
9 500-750 3255.08 11.15
10 750-1000 524.07 1.80
11 1000-1500 24.59 0.08

Subernarekha Basin Report
www.india-wris.nrsc.gov.in
9
Map 3. Elevation zones

Subernarekha Basin Report
www.india-wris.nrsc.gov.in
10
1.3 Climate
The basin is generally influenced by the South-West monsoon, which onsets in the month of June
and extends up to October. During monsoons, the basin may receive a spell of copious rainfall
followed by a long dry period. Of the rainfall, about 57% is lost by evapotranspiration and 15%
infiltrates into ground.
The average annual rainfall for the basin is around 1400 mm. The climate in the sub-basin is tropical
with hot summer and mild winters. The mean monthly temperature varies from 40.5°C (May) to
9.0°C (December). The highest temperature recorded is 47.2°C and the lowest is 2.8°C. Annual
average maximum and minimum temperatures vary from 32.4°C to 18.0°C.
1.3.1 Rainfall
Rainfall varies greatly, both annually and seasonally. The average annual rainfall for the years 1972-
2005 is 1444.53 mm according to the 0.5° grid data and 1385.75 mm for the years 1971-2004
according to the 1° grid data.
The rainfall in the basin gradually increases on moving from the upper part of the basin to the lower
part of the basin as depicted in Map 4.
Sub basin wise annual rainfall for the period of 1971-2004 is given in Annexure II-A.
However, 14 districts which are part of the basin are drought prone (MoRD, 2002).

Subernarekha Basin Report
www.india-wris.nrsc.gov.in
11
Map 4. Annual average rainfall
1,400 - 1,600
1,200 - 1,400 1,000 - 1,200
1,600 - 2,000
Rainfall in mm

Subernarekha Basin Report
www.india-wris.nrsc.gov.in
12
1.3.2 Temperature
The monthly average maximum, mean and minimum temperatures for a period of 36 years (1969-
2004) can be seen in Figure 2. April and May are the hottest months of the year throughout the
basin with the temperature rising to about 37°C. The minimum temperature is observed in the
months of December and January with temperature dipping to around 12°C. The average annual
maximum temperature recorded for 1969-2004 is 31.46°C for the basin. In the month of January, the
mean average temperature over the basin is around 18°C. In April, the mean temperature is about
30°C, whereas in the month of July it is about 28°C.
In the month of October, the basin shows mean minimum and mean maximum temperatures as
22°C and 31°C respectively. The month-wise mean maximum, minimum and average temperatures
in the basin for 36 years period (1969-2004) are further listed in Annexure II:B (Source: IMD. Analysis
done in India-WRIS). In the northern plateau of the basin, the variation of temperature during the
year is less marked than in the plains.
Figure 2. Monthly average temperature (1969-2004)

Subernarekha Basin Report
www.india-wris.nrsc.gov.in
13
1.3.3 Trends and variability
Subernarekha basin shows a variable rainfall over the last 34 years across the basin. Looking at the
histogram (Figure 3) for average annual rainfall, the trend line drawn shows a very slight decreasing
trend since 1971 to 2004. Year 1971 shows highest average annual rainfall of approximately 2050
mm of the basin and the least rainfall of the 34 years period is observed in the year 1979 with a
rainfall of 917.32 mm and 70 rainy days. (Source: IMD. Analysis done in India-WRIS)
Figure 3. Trend of annual rainfall (1971-2004)
1.4 Major rivers
Map 2 represents the river system of the entire basin. The Subernarekha and the Burhabalang Rivers
forms the major river systems in the basin.
The various river systems in the basin from north to south are:
(1) The Subernarekha.
(2) Two small streams (Jamira & Panchpara) between the Subernarekha and the Burhabalang.
(3) The Burhabalang.
(4) Two small streams (Mandagan & Kantiachara) between the Burhabalang and the Baitarani.

Subernarekha Basin Report
www.india-wris.nrsc.gov.in
14
The Subernarekha River rises near Nagri village in the Ranchi District of Jharkhand. It flows for a length of 448.36 km before outfalling into the Bay of Bengal. Its principal tributaries joining from right are the Kanchi, the Karkari and the Kharkai.
The Jamira rises west of Lakshman Nath village in the Baleshwar district and flows in a generally south-easterly direction. The Panchpara stream rises south-west of Gopiballabhpur village in the Medinipur district and runs in a generally south-easterly direction to join Bay of Bengal. The total area drained by these two streams is 2,418 Sq.km approximately.
The Burhabalang rises south of Simhpalgarh village in the Mayurbhanj district and flows first in a northerly and then in a south-easterly direction to join the Bay of Bengal. The Burhabalang drains a total area of 4,837 Sq.km approximately.
The Mandagan rises near Nilgiri village in the Baleshwar district and runs in a generally south-easterly direction to join the Bay of Bengal. The Kantiachara stream rises north of Dantur village in the Baleshwar district and runs in a generally south-easterly direction to join Bay of Bengal. The total are drained by these two streams is 2,645 Sq.km approximately.
Table 3 lists the geographically calculated lengths of some major rivers of the basin.
Table 3. Length of major rivers
1.5 Land use/ land cover
The land use pattern is an outcome of the interaction and interplay of the various physical
conditions of the area. It gives not only the land coverage but also an insight into the nature of
environmental degradation in the catchment area of the basins. Remote sensing technique has been
extensively used to map this ever changing phenomenon.
The distribution of land use / land cover in Subernarekha basin during 2005-06 is shown in Map 5. It
is found that nearly 24 land use / land cover classes exist in the basin area. Table 4 lists the land use
statistics. The major part of the basin is covered with agricultural land accounting to 53.76% of the
total area. The western part of the basin is particularly rich in forests with deciduous forest covering
25% of the total basin area. Around 2.39% of the basin is covered by water bodies. The lower
reaches of the basin has extensive agriculture due to presence of alluvial soil deposited by rivers
Sl. No. Principal Tributary name Length of River (km)
1 Subernarekha 448.36
2 Kanchi 86.16
3 Karkari 67.18
4 Kharkai 170.72
5 Jamira 87.4
6 Panchpara 33.65
7 Burhabalang 198.62
8 Mandagan 25.09
9 Kantiachara 24.65

Subernarekha Basin Report
www.india-wris.nrsc.gov.in
15
draining into Bay of Bengal. Central hilly terrain of the basin is though covered by forests which
accounts for 28.75% of the total basin area. 8.32% of the basin has built up land.
The other main categories of land use / land cover in the basin are fallow land, scrub land, scrub
forest, rural, urban mining, swamp/mangrove etc.
Table 4. Land use/ land cover statistics (2005-06)
Sl. No. Category Area (Sq. km) % of Total Area
1 Built Up land 2429.14 8.32
2 Agricultural land 15696.76 53.76
3 Forest 8394.62 28.75
4 Grassland 0.78 0.01
5 Wasteland 1977.39 6.77
6 Waterbodies 697.32 2.39

Subernarekha Basin Report
www.india-wris.nrsc.gov.in
16
Map 5. Land use/ land cover (2005-06)

Subernarekha Basin Report
www.india-wris.nrsc.gov.in
17
1.6 Soils
Information on the soil profile is also required for simulating the hydrological character of the basin.
Based on the soil profile depth, about 86.06 % falls under moderately shallow to deep (>50 cm)
followed by 12.25% as Very Shallow (10-25 cm).
The soil texture, erosion, slope and productivity maps of Subernarekha basin are shown in Map 6,
Map 7, Map 8 and Map 9 respectively.
The general data regarding the soils of the basin indicate that near about 80% of the basin comprises
of soils with fine and medium texture. Rocky and other types of soils constitute around 12% of the
basin. Severe soil erosion takes place in 23.74% of the basin area and approximately 1.4% of the
basin area poses very severe soil erosion.
The slope map (Map 8) shows that only 3% of the soil has steep slope. Around 43% is nearly levelled
and 40% is gently sloping. Out of the basin area for which data is available, around 20% which is
under deltaic area is highly productive and 17.21% of area is moderately productive. The areas near
Mayurbhanj district comprises of low productive soil. The major and medium canal command areas
are also shown in Map 9.

Subernarekha Basin Report
www.india-wris.nrsc.gov.in
18
Map 6. Soil texture

Subernarekha Basin Report
www.india-wris.nrsc.gov.in
19
Map 7. Soil erosion

Subernarekha Basin Report
www.india-wris.nrsc.gov.in
20
Map 8. Soil slope

Subernarekha Basin Report
www.india-wris.nrsc.gov.in
21
Map 9. Soil productivity

Subernarekha Basin Report
www.india-wris.nrsc.gov.in
22
1.7 Agro-climatic zones
India represents a large number of complex agro climatic situations. The planning commission after
examining the earlier studied at the regionalisation of the agricultural economy has recommended
that agricultural planning to be done on the basis of agro-climatic regions.
For resource development Subernarekha basin is classified into 3 agro-climatic zones (Map 10).
Major part of the basin falls in the Eastern Plateau and Hills Region. The other agro-climatic zones in
the basin are Lower Gangetic Plain Region and East Coast Plains and Hills Region. The Eastern
Plateau and Hills Region covers parts of Ranchi, Paschimi Singhbhum, Purbi Singhbhum districts and
a very small part of Bokaro district of Jharkhand, Mayurbhanj district of Odisha and Medinipur and
parts of Purulia districts of West Bengal. Major part of Baleshwar district of Odisha falls in Lower
Gangetic Plain region.
Map 10. Agro-climatic zones

Subernarekha Basin Report
www.india-wris.nrsc.gov.in
23
1.8 Agro-ecological zones
An agro-ecological region is the land unit on the earth’s surface carved out of agro-climatic region
when it is superimposed on landform and kinds of soils and soil conditions that act as modifiers of
climate and Length of Growing Period (LGP).
On the basis of agro-ecological zones, the Subernarekha basin is broadly divided into 4 zones (Map
11). The upper most part of Ranchi district (Jharkhand) falls under Hot subhumid ecoregion with red
and yellow soils zone. The major part of the basin comes under Hot subhumid ecoregion with red
and lateritic soils zone. The area near the coast in the lower reaches of the basin falls in Hot
subhumid to semi-arid ecoregion with coastal alluvium-derived soils. A small part in this basin is also
classified as Hot subhumid (moist) to humid (inclusion of perhumid) ecoregions with alluvial-derived
soils.
Map 11. Agro-ecological zones

Subernarekha Basin Report
www.india-wris.nrsc.gov.in
24
1.9 Demography
The basin spreads over 15 parliamentary constituencies (2009) comprising 7 of Jharkhand and 4 each
of Odisha and West Bengal. Out of these only 9 parliamentary constituencies are broadly covered
under the basin. The basin encompasses 12 districts (Census 2011) overall 7 of Jharkhand, 2 of
Odisha and 3 of West Bengal. According to Census Data 2001 report, Subernarekha basin is having a
total of 13353 villages with around 14.8 lakh households. The total population of the basin is
7426016 out of which 3654908 are females, thus showing equality in sex ratio in the basin. The
lower part of the basin is comparatively densely populated than the upper part of the basin (Map
12). Further details regarding male and female population are furnished in Annexure III:A.
The population density varies from region to region in the basin. The district-wise population density
of Subernarekha basin has been divided into two class ranges which are shown in Map 12. The most
densely populated districts of Medinipur and Purbi Singhbhum has 685 and 560 people per Sq.km
respectively.
The highest population density in the basin is found in the Medinipur district of West Bengal
followed by Baleshwar of Odisha and Purbi Singhbhum of Jharkhand. (Source: Census Data 2001)
Also Annexure III:B provides details about the drinking water facilities district wise in the basin.

Subernarekha Basin Report
www.india-wris.nrsc.gov.in
25
Map 12. Population density

Subernarekha Basin Report
www.india-wris.nrsc.gov.in
26
2. Hydrological units
2.1 Sub-basins
The basins can be divided further into small hydrological units. Under India-WRIS project, semi-
automated approach for delineation of hydrological units (basin, sub-basin and watershed) is used.
This approach uses SRTM DEM, topo maps on 1:50000 scale, IRS P6 LISS IV & CARTOSAT merged
data, drainage network, surface water bodies, rail/road network and other ancillary data. Drainage
divides from contour/ridge lines are used to demarcate the boundary of hydrological units. The
divide has been marked where flow is in opposite directions and Hydrological boundary has been
validated with reference to contours and drainage network. This approach is potentially more
objective, repeatable, cost-effective, and consistent than previously adopted manual delineation
methods.
Using the same approach and the parameters set for sub-basin, the Subernarekha does not give
further smaller hydrologic unit. Thus, it comprises of only one sub basin i.e. Subernarekha sub basin
spanning across parts of three states viz. Odisha, Jharkhand and West Bengal.
2.2 Watersheds
Hydrological unit wise assessment of water resources is a prerequisite for its proper management as
it is fast becoming scarce in India. Basins/sub-basins could be sub divided into smaller hydrological
units namely, watershed for water resources management at larger scale (micro level). Watershed is
a natural hydrological entity that covers a specific areal expanse of land surface from which rainfall
flows to a defined drain, channel, stream or river at any particular point. Watershed should be
delineated purely on the basis of hydrologic principles. Size of the watershed is governed by the size
of stream and its boundaries.
Map 13 shows watershed map of Subernarekha sub basin. The Subernarekha sub basin is thus
further divided into 45 watersheds. The white boundary within the basin represents delineated
watersheds. Each watershed is given an eight digit alphanumeric code for identification. Each letter
in the code has a description. For example if watershed code is C06SUB01, the first alphabet
(C06SUB 01) stands for the Water resource region (India-WRIS). Following 2 digits represents basin
code (C06SUB01). Next 3 letters (C06SUB01) represents sub basin name which is followed by
watershed number (C06SUB01).
The area covered by these watersheds and their minimum and maximum sizes found in the basin are
given in Table 5.
Table 5. Sub-basin wise watersheds
Note: Values calculated under India-WRIS
Sl. No. Sub Basin Area (Sq.km) Size Range of Watershed (Sq.km.)
No. of Watersheds
1 Subernarekha Sub Basin 25792.16 387.02 - 962.40 45

Subernarekha Basin Report
www.india-wris.nrsc.gov.in
27
Map 13. Subernarekha Sub-basin and watershed

Subernarekha Basin Report
www.india-wris.nrsc.gov.in
28
3. Surface water resources
The basin has average water resources potential is 12.37 BCM out of which utilizable surface water
resources accounts for 6.8 BCM. Total live storage of the basin is 2322.21 MCM with average annual
runoff of 12368.00 MCM (as reported by CWC).
3.1 Surface waterbodies
Surface water bodies have traditionally played an important role in the lives of common people in
India by way of irrigation, drinking water supply, ecology, tourism and domestic uses. Subernarekha
basin as on today possesses some major water reservoirs. The Getalsud and Chandil are largest
reservoirs in the basin having a spread of 2953.47 ha and 3109.75 ha. Khandakhal, Sunei, Bankabal
and Jambhira are some other major reservoirs.
Subernarekha basin consist a total of 22215 surface water bodies in the form of lakes, ponds,
reservoirs, tanks etc. (Table 6). Tanks are the most predominant with 15359 in number and forms
about 69.14% of total water bodies in the basin. Thirty reservoirs are located in the basin. Most of
the water bodies have a size range of 0-25 ha. Only one waterbody, Chandil is found to have a size
larger than 2500 ha. The classification of the waterbodies on the basis of their type is shown in
Figure 4.
Table 6. Number and size of waterbodies
Sl. No. Size Range (ha) No. of Waterbodies
1 0 - 25 22140
2 25 - 50 33
3 50 - 100 23
4 100 - 250 10
5 250 - 500 6
6 500 - 1000 1
7 1000 - 2500 1
8 More than 2500 1

Subernarekha Basin Report
www.india-wris.nrsc.gov.in
29
Figure 4. Type and number of waterbodies
3.2 Water resource projects
There are 40 major/medium projects in Subernarekha basin including reservoirs, irrigation projects,
barrages and weir schemes.
3.2.1 Major and medium irrigation projects
Subernarekha Multipurpose Project- Subernarekha Multipurpose project in East and West Singhbhum districts of Jharkhand envisages construction of two dams, one across river Subernarekha at Chandil and the other across river Kharkai at Icha, one barrage across Kharkai at Ganjia and another across Subernarekha at Galudih.
The project is a joint venture of Government of Jharkhand, Odisha and West Bengal. The culturable command area of Subernarekha Multipurpose Project is 154.8 Th ha and ultimate irrigation potential is 236.85 Th ha.
Subernarekha Irrigation Project- The Subernarekha Irrigation Project of Odisha has been planned to utilise the Odisha share of Subernarekha waters (which is an Inter-State river) to the extent of 1214 hm3 out of the State’s share of 1,480 hm3 at Kokpara as per the distribution made in the Tripartite Agreement -1978 (TPA) among the three co-basin States of Bihar (now Jharkhand), Odisha and West Bengal.
The barrage and headworks of the project are located on river Subernarekha at Galudih in Jharkhand.
Khadkhi Irr. Project- The project comprises of Khadkhai dam constructed on Kharkai river and has culturable command area of 7.99 Th ha with ultimate irrigation potential of 11.71 Th ha.

Subernarekha Basin Report
www.india-wris.nrsc.gov.in
30
Subernarekha Project- five water resouces structure are associated with this storage scheme project. Haladia Dam is located at Chipat Nalla, a tributary of the Burhabalang for irrigation of 3,643 ha in the Mayurbhanj district. Baura dam is located on Baura river which is s tributary of Jamira river. Jambhira dam is located on Jambhira river. Icha dam is located on Kharkai river and Galudih barrage is located on Subernarekha river.
The total culturable command area of the project is 109.62 Th ha and its ultimate irrigation potential is 187.46 Th ha.
Sunei Project- This is a major irrigation project. The associated structures with this project include Sunei Dam. The culturable command area is 10.96 Th ha with ultimate irrigation potential of 15.20 Th ha.
Further information of these projects is listed in Annexure IV:C.
Table 8. Number of water resources projects
Sl. No. Type of Projects Number of Projects
1 Major Irrigation Projects 5
2 Medium Irrigation Projects 34
3 ERM Projects 0
4 Hydro-Electric Projects 1
3.2.2 Hydro Electric projects
There is one hydroelectric project in the basin. Subernarekha HEP project comprises a 2,270.7 m
long 35.4 m high composite dam across the river Subernarekha at Getalsud, 30 km from Ranchi City.
Total three powerhouses are associated with the project. Power House-I and II are completed, while
powerhouse located at Chandil dam is under construction. Power House-I and II are located on
Getalsud dam. While third power house located on Chandil dam is under constructed and is made to
generate 8 MW of power.
Further information on these projects is available in Annexure IV:D
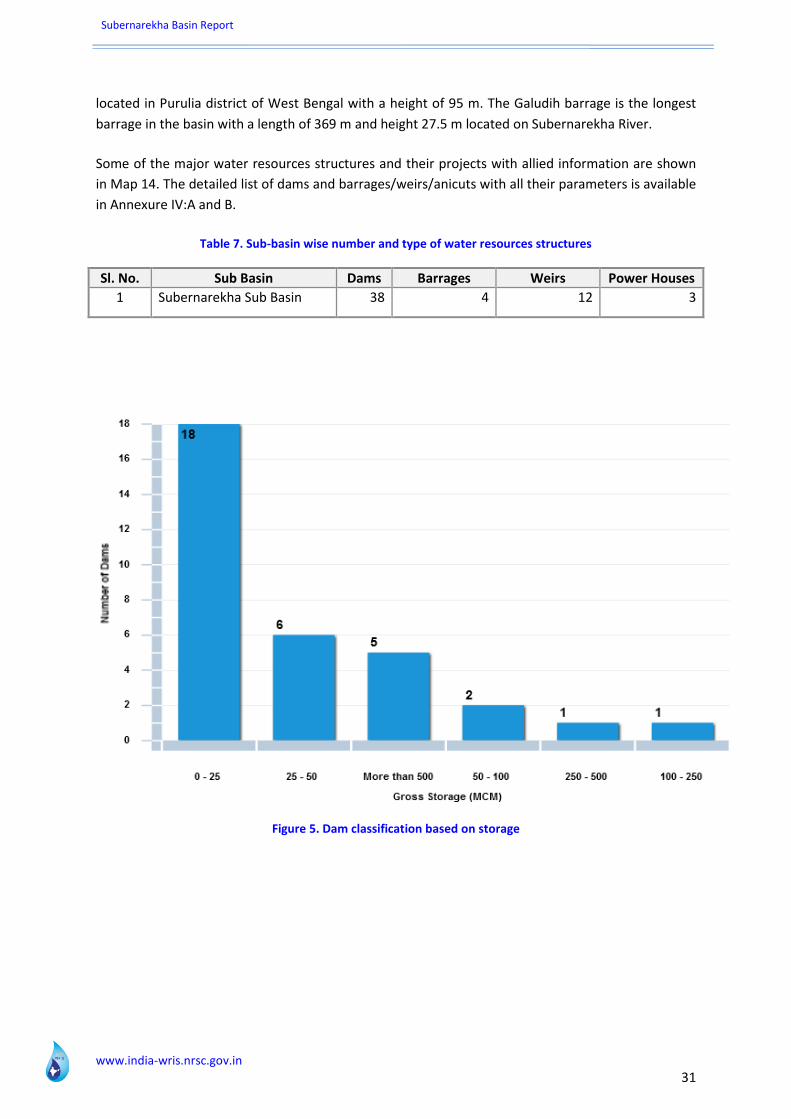
3.2.3 Dams, Barrages/Weirs/Anicuts
Water resources structures are manmade structures to store the water for hydropower, irrigation,
drinking water supply etc.
There are a total of 38 dams are situated in the Subernarekha basin. Four barrages and 12 weirs are
constructed in the basin (Table 7 & Map 16). Eighteen dams have gross storage capacity of 0-25
MCM (Figure 5). Based on the figures given it can be said that more than 80% of dams are used for
the purpose of irrigation (Figure 6).
The longest dam in the basin is Baura Dam located in Mayurbhanj district of Odisha with a total
length of 9.95 km. The highest dam in the basin is Lower Purulia Pumped Storage Project (PPSP) Dam
Subernarekha Basin Report
www.india-wris.nrsc.gov.in
31
located in Purulia district of West Bengal with a height of 95 m. The Galudih barrage is the longest
barrage in the basin with a length of 369 m and height 27.5 m located on Subernarekha River.
Some of the major water resources structures and their projects with allied information are shown
in Map 14. The detailed list of dams and barrages/weirs/anicuts with all their parameters is available
in Annexure IV:A and B.
Table 7. Sub-basin wise number and type of water resources structures
Sl. No. Sub Basin Dams Barrages Weirs Power Houses
1 Subernarekha Sub Basin 38 4 12 3
Figure 5. Dam classification based on storage

Subernarekha Basin Report
www.india-wris.nrsc.gov.in
32
Figure 6. Dam classification based on purpose

Subernarekha Basin Report
www.india-wris.nrsc.gov.in
33
Map 14. Major water resources structures and projects

Subernarekha Basin Report
www.india-wris.nrsc.gov.in
34
Map 15. Subernarekha Sub-basin wise water resources assets

Subernarekha Basin Report
www.india-wris.nrsc.gov.in
35
3.2.4 Command area and canal network
Odisha canal system uses waters of Subernarekha and Burhabalang mainly. Baldiha and Haladia
Projects were the only important irrigation project existing in the basin in the pre-plan period.
Subernarekha basin has 3 major command areas and 32 medium command areas. Kanchi Weir
Scheme, Kangsabati, Subernarekha are the major projects of the basin whose command areas are
depicted in Map 15.
The Subernarekha river basin includes 2 reservoirs, Chandil and Icha, and 2 barrages, Kharkai and
Galudih. Each reservoir and barrage has 2 canals, namely left bank canal (LBC) and right bank canal
(RBC). On the right bank canal of Galudih barrage (GRBC), there are 3 small command area reservoirs
(Haldia, Jambhira and Baura). This canal has 2 branch canals, namely, Betnoti branch canal (BBC),
and Subernarekha branch canal (SBC).
In upper reaches of the Subernarekha basin, Tajna barrage has small command in Khunti district.
Kanchi weir irrigates lower part of Ranchi district and goes up to upper northern part of Saraikela-
Kharsawan district. In Paschimi Singhbhum district, small dams and weirs irrigate the area.
Khadakhai dam and Bankabal are important canal systems in Mayurbhanj district. Mayurbhanj also
has good canal network in its lower part and is getting irrigated by Badjore Dam and Jambhira dam.
Sunei and Kalo dam irrigates southern part of Mayurbhanj.
Map 16 depicts the major and medium canal command areas and canal network in the basin and
Annexure IV: C provides further details about them.
A study was carried out jointly by CWC & ISRO to assess the existing status of the irrigation
commands. IRS P4 LISS III data of two different seasons namely, pre monsoon (2005) and post
monsoon (2004) were used for delineation of waterlogged and salt affected areas of major and
medium irrigation commands of Subernarekha basin. Total waterlogged area within these
occupies 0.06 sq. km. whereas salt affected area has been extended to 0.4 sq. km.
3.2.5 Multipurpose projects
Subernarekha project is the only multipurpose project in the basin. This project envisages CCA of
154.8 Th ha and generates 8 MW of hydropower through Chandil powerhouse.
3.2.6 Interstate projects
Subernarekha Multipurpose project is an interstate project between Jharkhand, Odisha and West
Bengal.

Subernarekha Basin Report
www.india-wris.nrsc.gov.in
36
Map 16. Command area and canal network

Subernarekha Basin Report
www.india-wris.nrsc.gov.in
37
4. Ground water resources
4.1 Ground water observation wells
Ground water level data is temporal and dynamic in nature. It is mainly controlled by rainfall pattern
in relation to the aquifer material. A large part of India’s irrigated agricultural depends on ground
water availability.
Subernarekha basin consists of 166 ground water observation wells (Table 9). The density of ground
water observation wells is high in the lower reaches of the basin (Map 17).
Table 9. Sub-basin wise number of ground water observation wells
Sl. No. Sub Basin No. of Observation Wells 1 Subernarekha Sub Basin 166

Subernarekha Basin Report
www.india-wris.nrsc.gov.in
38
Map 17. Location of ground water observation wells

Subernarekha Basin Report
www.india-wris.nrsc.gov.in
39
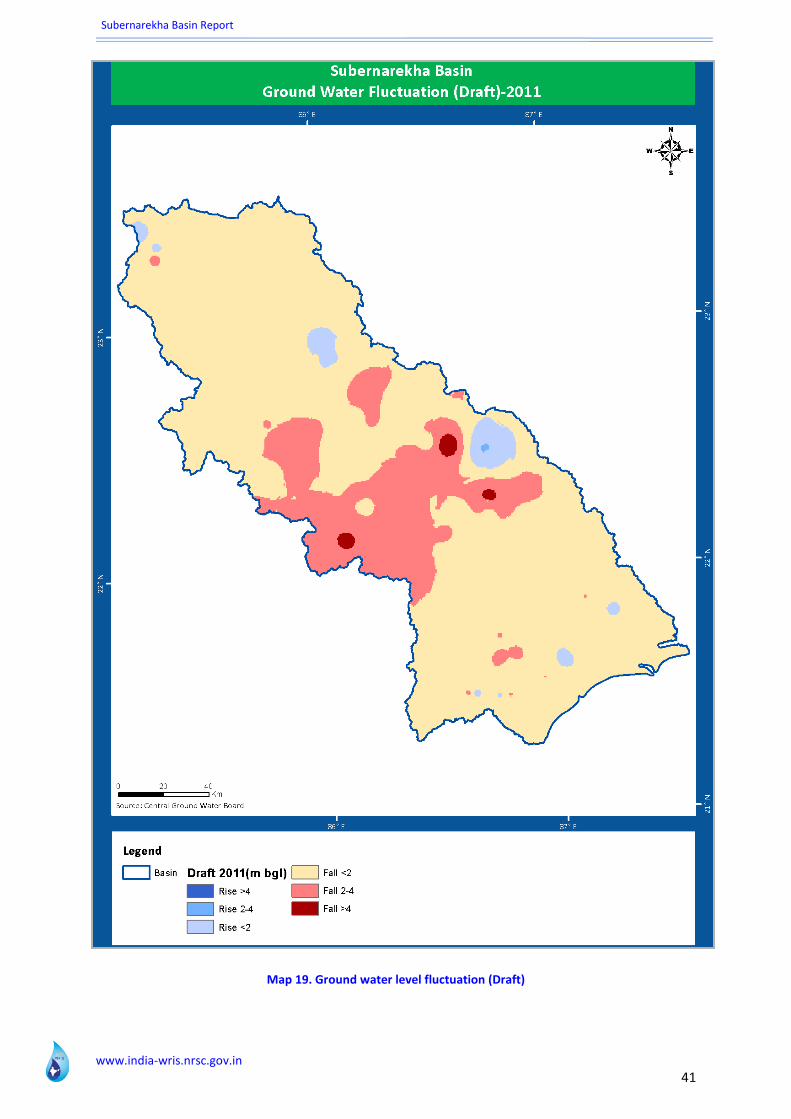
4.2 Ground water level fluctuation
Ground Water Fluctuation method provides an estimate of groundwater recharge by analysis of
water-level fluctuations in observation wells. The method is based on the assumption that a rise in
water-table elevation measured in shallow wells is caused by the addition of recharge across the
water table.
According to 2011 pre and post monsoon data the ground water fluctuation due to recharge and
due to draft in the basin are depicted through chloropleth maps in Map 18 and Map 19. The part of
the Subernarekha basin under the state of Jharkhand shows more than 4 m rise in Ground Water
level fluctuation due to recharge and fall of less than 2 m in most of its part. For the area of the basin
in Odisha state, the water level fluctuation due to recharge shows a rise of more than 2 m in most of
its part and a fall of less than 2 m due to draft. For the area of the basin falling in West Bengal, the
water level fluctuation due to recharge shows a rise of more than 4 m in most of its part and a fall of
less than 2 m due to draft.

Subernarekha Basin Report
www.india-wris.nrsc.gov.in
40
Map 18. Ground water level fluctuation (Recharge)
Subernarekha Basin Report
www.india-wris.nrsc.gov.in
41
Map 19. Ground water level fluctuation (Draft)

Subernarekha Basin Report
www.india-wris.nrsc.gov.in
42
4.3 Litholog well locations
An aquifer is an underground layer of water-bearing permeable rock or unconsolidated materials
(gravel, sand, or silt) from which groundwater can be extracted using water well. Related terms
include aquitard, which is a bed of low permeability along an aquifer and aquiclude (or aquifuge),
which is a solid, impermeable area underlying or overlying an aquifer. If the impermeable area
overlies the aquifer pressure could cause it to become a confined aquifer. Aquifers may occur at
various depths. Those closer to the surface are not only more likely to be used for water supply and
irrigation, but are also more likely to be topped up by the local rainfall. Many desert areas have
limestone hills or mountains within them or close to them that can be exploited as groundwater
resources.
The data is available only for the wells of West Bengal state in the basin. According to it, the aquifer
material in the region is of unconsolidated sediments of thickness varying from 1-35 m over the
region. The depth of first aquifer encountered/tapped falls in 50-90 m range below ground level
according to the data.
Map 20 shows the locations of these lithology wells in the basin available in the West Bengal region
and the further details are available in Annexure V:A.

Subernarekha Basin Report
www.india-wris.nrsc.gov.in
43
Map 20. Litholog well locations

Subernarekha Basin Report
www.india-wris.nrsc.gov.in
44
5. Hydro-met observations
Water resources planning require time series data on hydrological aspects. The hydrological
observation stations of CWC collect and process the basic hydrological data on gauge, discharge, silt,
and sedimentation and water quality on a regular basis for onward transmission to CWC regional
offices, who document it in the form of Water Year Book, Sediment Year Book and Water Quality
Year Book. River management is one of the key issues for political and economic affairs of the
country. For designing and execution of water resources projects in the country, planners and policy
makers require a comprehensive and reliable time series data on hydrological aspects.
Hydro-meteorological observations in the basin are carried out by the Central and State
Governments. The Central Water Commission maintains 12 gauge-discharge sites in the basin (Map
21 and Annexure VI:A). Sediment observations are also taken at 4 of the above sites. In addition, the
Central Water Commission operates 2 flood forecasting stations in the basin (Annexure VI:B).

Subernarekha Basin Report
www.india-wris.nrsc.gov.in
45
Map 21. Hydro observation and flood forecasting stations

Subernarekha Basin Report
www.india-wris.nrsc.gov.in
46
5.1 Hydrological observation sites
These stations carry out observations about various hydrological parameters. These stations are
categorized as ‘GDSQ’, where the abbreviation stands as: G-Gauge, D-Discharge, S-Sediment and Q-
Water Quality. RF stands for rainfall measuring station. Hydrological observations are carried out by
the Central as well as State Governments.
There are reportedly 5 Gauge (G) sites, 2 Gauge Discharge (GD) sites, one Gauge Discharge Quality
(GDQ) site and 4 Gauge Discharge Sediment Quality (GDSQ) sites being maintained by CWC for the
study of hydrological observations in Subernarekha basin (Map 21 and Table 10).
Annexure VI:A provides further details about these sites.
Table 10. Hydrological observation sites of CWC
Sl. No. Station Type Number of Stations
1 G 5
2 GQ 0
3 GD 2
4 GDQ 1
5 GDS 0
6 GDSQ 4
7 RF 0
8 Snow 0
5.2 Flood forecasting sites
Central Water Commission has set up a network of flood forecasting stations covering all important
flood prone rivers. Flood forecasting indicates the forecast or inflow level with its time of
occurrence. Two kinds of forecasts are issued based on the utility of the forecast. Inflow forecasts
assist in reservoir regulation (full reservoir level & maximum water level) and the level forecast is
used for predicting water level (warning level & danger level) well ahead of its occurrence.
The flood problems of the Subernarekha basin are mainly confined to their lower reaches. The
Subernarekha carries considerable discharges during the flood season. In this area, there is
widespread inundation by the Subernarekha owing to the incapacity of its natural section to carry
the discharge. The condition gets worse when heavy rainfall occurs simultaneously with high tides.
The river spills over both its banks in the delta region in Odisha and West Bengal. The other rivers in
the basin also spill over their banks during floods on account of inadequate carrying capacity.
Collectively they present a flood problem because they submerge areas in the lower reaches.
There are 2 flood forecasting stations in the basin (Table 11), one is NH5 Road Bridge on
Burhabalang River, and second is Rajghat on Subernarekha River. Both the stations are for level
forecasting.

Subernarekha Basin Report
www.india-wris.nrsc.gov.in
47
Annexure VI:B provides further details about these sites.
Table 11. Types of flood forecasting stations of CWC
Sl. No. Station Type Number of Stations
1 Level Forecast 2
2 Inflow Forecast 0
5.3 Meteorological stations
There are 3 main central organisations in our country which records meteorological parameters viz.,
India Meteorological Department (IMD), Central Water Commission (CWC) and ISRO (Automatic
Weather Stations).
CWC has established 12 hydro-meteorology stations in the basin as shown in Map 21. These stations
are established to understand the relationship between meteorological parameters related to
climate and river dynamics. The basin also has 21 stations by IMD. IMD stations measure data of
monthly average precipitation and potential evapotranspiration, average annual rainfall and
potential evapotranspiration. In addition they also measure weekly data of rainfall, maximum and
minimum temperature, wind speed, evaporation and sunshine hours. An integrated approach of
measuring meteorological parameters using Automated Weather Stations (AWS) is also helpful in
remote regions. The AWS stations require minimum maintenance and the data is generated on
temporal basis. Under the supervision of ISRO 24 AWS stations are established in the basin. These
stations are maintained by MOSDAC.
Different meteorological stations present in the basin are listed (Table 12) as follows:
Table 12. Meteorological stations
Sl. No. Organisation Number of Stations
1 CWC Observation Stations 12
2 IMD Stations 21
3 ISRO AWS Stations 24

Subernarekha Basin Report
www.india-wris.nrsc.gov.in
48
6. Water quality
Water quality is defined in terms of the chemical, physical and biological content of water. The water
quality of rivers and lakes changes with the seasons and geographic areas, even when there is no
pollution present.
6.1 Surface water quality observations
Surface water means water at or above the land's surface which is neither ground water nor
contained within the unsaturated zone. CWC stations carry out observations for testing the surface
water quality pertaining to sixty eight water quality parameters which are considered to be the
‘Standard Hydrology Project Water Quality Parameters’. All physical, chemical and biological water
quality parameters are categorized further under sub categories like field determinations, nutrients,
organic matter, alkalinity, hardness, other inorganics, major ions, coliforms and others.
The Bureau of India Standards has identified 42 water quality parameters and fixed tolerance limit
for each parameters. According to data given in ‘Integrated hydrological data 2012, CWC,’ the values
of pH (Negative logarithm of Hydrogen ion concentration) for Subernarekha basin have crossed the
tolerance limits during the summer season. The prominent parameters which have crossed the
tolerance limits frequently are Dissolved oxygen (DO) and Biochemical Oxygen Demand (BOD).
Apart from irrigation, vast quantities of water are used by industries and town in the basin. With the
rapid increase in population of the city, withdrawal of water for domestic needs has risen sharply
over the years. These industries and towns generate effluents, sewage wastes and considerable
quantities of wastewater which are discharged directly into the river. A drop in dissolved oxygen,
accompanied by decrease in plankton, has been reported below the discharge point. Due to natural
processes, river water recovers its quality further downstream. (Source: Hydrology and Water
Resources of India, 2007, S.K. Jain, P.K. Agarwal and V. P. Singh)
The decadal growth rates of population in basin range from 15% in Odisha to 23% in Jharkhand.
About 75 million people in these three states (mainly in Jharkhand) live below poverty line. An
emerging shortage of water, serious water-quality problems, and a lack of any policy and
institutional framework characterize this river basin. An increase in the quality and quantity of water
would contribute significantly to improving the quality of life in this region. (Source: Hydrology and
Water Resources of India, 2007, S.K. Jain, P.K. Agarwal and V. P. Singh)
Water Quality observations are taken at 5 sites of CWC, namely Adityapur, Ghatsila, Govindpur (NH5
Road Bridge), Jamshedpur and Muri. Map 21 shows their spatial location.

Subernarekha Basin Report
www.india-wris.nrsc.gov.in
49
6.2 Ground water quality observations
Ground water means the portion of water beneath the land surface that is within the saturated
zone. There are seven quality observations wells being maintained by Central Ground Water Board
(CGWB) in the Subernarekha basin. The main parameters monitored are pH, iron, TDS, sodium,
potassium, magnesium, chlorine, calcium, copper, SO4, nitrate (NO3), carbonate (CO3), hydrogen
carbonate (HCO3), SAR, RSC, fluorine, and EC. From the data available it is found that for the site
named Chakulia, a considerable increase in amounts of chlorine and sodium is seen. Chlorine has
amounted to 85.2 mg/L (in 2008) from 36 mg/L (in 2005) and Na has amounted to 39 mg/L (in 2008)
from 17 mg/L (in 2005).

Subernarekha Basin Report
www.india-wris.nrsc.gov.in
50
7. Inter basin transfer links
Inter basin transfer link proposes river water transfer from the region of surplus to deficit areas.
There are 2 important inter basin transfer links made/proposed in the basin viz. the Subernarekha-
Mahanadi Link and the Ganga-Damodar-Subernarekha Link. Both the links falls under Himalayan
component for which data is mostly classified.
The Subernarekha-Mahanadi Link is proposed to join Subernarekha River to Mahanadi River. A
stretch of about 124.5 km of the link canal falls in the Subernarekha basin.
The Ganga-Damodar-Subernarekha Link is proposed to join Ganga River to Subernarekha River. A
stretch of about 36.5 km of the link canal falls in the Subernarekha basin.
Both these links are shown in Map 22 with their allied information.

Subernarekha Basin Report
www.india-wris.nrsc.gov.in
51
Map 22. Inter basin transfer links

Subernarekha Basin Report
www.india-wris.nrsc.gov.in
52
8. Inland navigation waterways
The East Coast Canal stretch along with Brahmani and Mahanadi delta river system is declared as
National Waterway-5 (NW-5). Total length of NW-5 is 623 km and a stretch of about 89 km of the
falls in the Subernarekha basin.
It has 371 km of river portion and 217 km of canal portion. This waterway was declared on 25th
November 2008. Inland Waterways Authority of India (IWAI) is the owner of this waterway and
Central Inland Water Transport Corporation (CIWTC) is the operator of this waterway. The East
Coast Canal stretch falling in Subernarekha basin with its allied information is shown in Map 23. Coal
from Talcher to Dhamra and Paradip ports is the most important potential cargo for this waterway.

Subernarekha Basin Report
www.india-wris.nrsc.gov.in
53
Map 23. Inland navigation waterways

Subernarekha Basin Report
www.india-wris.nrsc.gov.in
54
9. Water tourism sites
Water tourism is term coined under India-WRIS to refer to places which are for tourist attraction for
the reason that some water asset is nearby. These tourism sites are categorized into many
categories which are given in Table 13. The details of these tourism sites are given in Annexure VII:A
and B.
The Subernarekha basin also houses 4 important tourism sites including 1 wildlife sanctuary, 2
waterfalls and 1 tourist spot (Map 24), which are described as follows:
Simlipal National Park is a national park and an elephant reserve situated in the Mayurbhanj.
Simlipal National Park derives its name from the abundance of Semul or red silk cotton trees that
bloom vividly. The major mammals include Tiger, Leopard, Asian elephant, Sambar, Barking deer,
Gaur, Jungle cat, Wild boar, Chausingha (four horned antelope), Giant squirrel and Common langur.
Two hundered thirty one species of birds nest in these forests. Red Junglefowl, Alexandrine
Parakeet, Crested Serpent Eagle include the list.
Digha is a very popular seaside resort .The place was discovered by Warren Hastings and was known
as Beercool at that time. It is girdled with Casuarina plantation.
Hundru Waterfall is located in Ranchi district (Jharkhand). It is the 34th highest waterfall in India.
Dassam Waterfall (also known as Dassam Ghagh) is a waterfall located near Taimara village in
Ranchi district. It is a natural cascade across the Kanchi River, a tributary of the Subernarekha River.
The water falls from a height of 44 m (144 ft). The water of the Dassam Falls is known to be very
clean and clear.
Table 13. Water tourism sites
Sl. No. Tourist Site Category No. of Places
1 Tourist Spot 1
2 Waterfall 2
3 Wildlife Sanctuary 1

Subernarekha Basin Report
www.india-wris.nrsc.gov.in
55
Map 24. Water tourism sites

Subernarekha Basin Report
www.india-wris.nrsc.gov.in
56
10. Conclusion
This report provides valuable information related to the topographic, demographic, climatic, surface
and ground water resources, hydro-meteorological and water quality scenario of Subernarekha
basin. The Subernarekha basin extending over the states of Jharkhand, Odisha and comparatively
smaller part in West Bengal have a total geographically calculated area of 25792.15 Sq.km. The basin
spreads over 15 parliamentary constituencies (2009) and 12 districts (Census 2011) overall of
Jharkhand, Odisha and West Bengal states. The Subernarekha basin consists of 45 watersheds. The
Subernarekha and the Burhabalang forms the major river systems in the basin. The Subernarekha
River and its tributaries are an inter-state river system, flowing through the states of Jharkhand and
Odisha. The basin has got rich mineral resources spread over vast areas and houses many important
industries.
The basin is generally influenced by the South-West monsoon, which onsets in the month of June
and extends up to October. Having average annual rainfall for the basin is around 1400 mm and
average annual maximum temperature as around 30° C, the climate in the sub-basin is tropical with
hot summer and mild winters. As per the assessment of land use/land cover (2005-06), the major
part of the basin is covered with agricultural land accounting to 53.76% of the total area, forests
covering 25% of the total basin area and around 2.39% of the basin is covered by water bodies. Clay,
sand and silt are predominant in the basin. The basin covers 3 agro-climatic zones and 4 agro-
ecological zones. Around 22.56% of total basin area lies in the elevation zone of 200-300 m.
Subernarekha basin consists of surface water bodies in the form of lakes, ponds, reservoirs, tanks
etc. Tanks are the most predominant in the basin. 38 Dams and 12 Barrages and 4 Weirs are
constructed in the basin. Around 83% dams are used for the purpose of irrigation. There are 3 major
and 32 medium command areas in the basin. There are a total of 38 major/medium irrigation/multi-
purpose projects in the basin. There are 2 flood forecasting stations, 10 telemetry stations and 12
hydrological observation stations are there in the basin measuring different parameters. Also at 7
ground water quality observation wells in the basin ground water quality data is monitored by
Central Ground Water Board (CGWB). The basin also houses 12 hydro-meteorology stations by
Central Water Commission (CWC), 21 stations by Indian Meteorological Department (IMD) and 24
Automated Weather Stations (AWS) by Indian Space Research Organisation (ISRO) for the
observation of various meteorological parameters.
Inland Waterways Authority of India (IWAI)’s National Waterway No. 5 falls in the Subernarekha
basin. Two important inter basin transfer links viz., the Subernarekha-Mahanadi Link and the Ganga-
Damodar-Subernarekha Link are also present in the basin. Four major tourist spots including one
National Park are also present Subernarekha basin.
The economy of the basin at present largely depends on agriculture, which, in view of the uneven
incidence of the rainfall, provides a low level of subsistence except in parts of the basin where
irrigation has been provided and where major industries have developed. Thus there is a keen
demand for the development of water resources in the basin.

Subernarekha Basin Report
www.india-wris.nrsc.gov.in
57
A. District Details
Sl.
No.
State Name District (2011) Population Total Area (Sq.
Km)
District Area in
Basin (Sq. Km)
% of District Area
in the Basin
1 Jharkhand Pashchimi Singhbhum
1,502,338 6941.29 2687.33 38.72
2 Jharkhand Ranchi 2,914,253 4743.84 2802.26 59.07
3 Jharkhand Ramgarh 949,443 1259.52 136.64 10.85
4 Jharkhand Purbi Singhbhum 2,293,919 3433.65 3119.28 90.84
5 Jharkhand Saraikela-kharsawan
1,065,056 2546.17 2536.09 99.60
6 Jharkhand Bokaro 2,062,330 2688.22 17.01 0.63
7 Jharkhand Khunti 531,885 2603.07 1297.28 49.84
8 Odisha Mayurbhanj 2,519,738 10035.64 7146.63 71.21
9 Odisha Baleshwar 2,320,529 3733.69 2644.77 70.84
10 West Bengal Pashchim Medinipur
5,913,457 9021.98 2387.68 26.47
11 West Bengal Purba Medinipur 5,095,875 3893.57 85.26 2.19
12 West Bengal Puruliya 2,930,115 6003.10 931.92 15.52
Source : Survey of India and Census Data 2011
B. Parliamentary Constituency Details
Sl. No. State Name Parliamentary
Constituencies (2009)
Total Area (Sq. Km) Area Falling in Basin
(Sq. Km)
% Area in the Basin
1 Jharkhand Singhbhum 7548.03 3294.08 43.64
2 Jharkhand Giridih 3771.89 17.01 0.45
Annexure I: State, district and parliamentary constituency in the basin

Subernarekha Basin Report
www.india-wris.nrsc.gov.in
58
Sl. No. State Name Parliamentary
Constituencies (2009)
Total Area (Sq. Km) Area Falling in Basin
(Sq. Km)
% Area in the Basin
3 Jharkhand Hazaribagh 5041.25 136.64 2.71
4 Jharkhand Ranchi 3823.03 3096.25 80.99
5 Jharkhand Lohardaga 7228.69 2.58 0.04
6 Jharkhand Khunti 8463.31 2930.15 34.62
7 Jharkhand Jamshedpur 3433.56 3119.19 90.84
8 Odisha Baleshwar 3336.27 3148.09 94.36
9 Odisha Kendujhar 9851.53 198.72 2.02
10 Odisha Bhadrak 3344.42 53.02 1.59
11 Odisha Mayurbhanj 7624.67 6391.57 83.83
12 West Bengal Kanthi 1964.40 56.40 2.87
13 West Bengal Puruliya 4444.18 793 17.84
14 West Bengal Jhargram 5271.39 2073.81 39.34
15 West Bengal Medinipur 2667.39 481.66 18.06
Source : Election Commission of India

Subernarekha Basin Report
www.india-wris.nrsc.gov.in
59
A. Sub-Basin Wise Annual Rainfall (mm) (1971-2004)
Sl. No. Year Subernarekha Sub Basin
1 1971 2047.63
2 1972 1233.79
3 1973 1678.34
4 1974 1400.2
5 1975 1482.51
6 1976 1154.86
7 1977 1637.88
8 1978 1719.36
9 1979 994.75
10 1980 1405.68
11 1981 1500.67
12 1982 1162.39
13 1983 1382.72
14 1984 1597.1
15 1985 1463.61
16 1986 1546.97
17 1987 1249.79
18 1988 1363.47
19 1989 1455.09
20 1990 1753.63
21 1991 1399.7
22 1992 1233.74
23 1993 1615.43
24 1994 1788.55
25 1995 1456.02
Annexure II : Climate – Rainfall (1971-2004) and Temperature (1969-2004) profile in the basin

Subernarekha Basin Report
www.india-wris.nrsc.gov.in
60
Sl. No. Year Subernarekha Sub Basin
26 1996 1232.99
27 1997 1486.49
28 1998 1376.27
29 1999 1651.97
30 2000 1357.23
31 2001 1652.75
32 2002 1325.02
33 2003 1511.15
34 2004 1373.32
B. Temperature profile in the basin (36 Years Average for the period 1969-2004)
Sl. No. Month Maximum Temperature (°C) Minimum Temperature (°C) Mean Temperature (°C)
1 January 25.65 12.21 18.93
2 February 30.43 17.58 24
3 March 33.39 19.77 26.58
4 April 36.69 23.62 30.16
5 May 37.03 25.28 31.16
6 June 34.51 25.57 30.04
7 July 31.86 25.04 28.45
8 August 31.37 24.9 28.13
9 September 31.61 24.44 28.02
10 October 31.32 22.01 26.67
11 November 29.1 17.21 23.16
12 December 26.17 12.64 19.41

Subernarekha Basin Report
www.india-wris.nrsc.gov.in
61
A. Demographic Details
Sl. No. No. of Districts No. Villages Total Population Male Population Female Population No. of Households
1 9 13353 7426016 3771108 3654908 1487536
Source : Census Data 2001
B. Drinking Water Facilities
Sl. No. District Wells Tubewells Handpumps
1 Puruliya 2340 2237 63
2 Ranchi - - -
3 Pashchimi Singhbhum - - -
4 Purbi Singhbhum - - -
5 Hazaribagh - - -
6 Medinipur 4199 7790 2791
7 Bokaro - - 0
8 Baleshwar 1030 - 2490
9 Mayurbhanj 3173 87 3471
Source : Census Data 2001
Annexure III : Population and drinking water facilities in the basin

Subernarekha Basin Report
www.india-wris.nrsc.gov.in
62
A. List of Dams with surrogate information
Sl. No.
Name of Dam
River Type of Dam
Year of
completion
Catchment Area
(Sq. Km.)
Length of dam (m)
Max height above founda
tion (m)
Gross storage capacity (MCM)
Live storage capacity (MCM)
Type of
spill-way
Submergence
Area (Th Ha)
Purpose
1 Dimu Dam Earthen 1989 841 12 926 677 IR
2 Kalo Dam Kalo Earthen 1980 153 2458 24.24 29.70 24.24 Ogee 0.54 IR
3 Nesa Dam Nesa Earthen 1978 25 730 18 7.80 6.58 Ogee 0.18 IR
4 Bamni Dam
5 Baura Dam 47 995 38 IR
6 Hatia Dam Subernarekha
Earthen 1963 4525 24 34.10 31.90 IR
7 Icha Dam kharkai Earthen/Gravity/Masonry
2849 1215.9 38.4 1043 839 OGEE HE,IR
8 Nakti Dam Bijay Earthen 2010 22.74 678 37.6 11 9.20 Chute 0.07 IR
9 Palna Dam Ranka Jhuria
Earthen 1985 29.78 381 28.65 12.42 11.35 Chute 0.16 IR
10 Raisa Dam Kanchi Earthen 45.32 1347.56 40.54 14.13 11.97 Chute 0.08 IR
11 Rupai Dam Earthen 1982 620 12 IR
12 Sonua Dam Sanjay Earthen 2009 115.20 640.24 39.41 49.22 43.66 Chute 0.35 IR
13 Sunei Dam Sunei River
Earthen 1990 227 2134 30 70 61.60 Chute 0.78 HE,IR
14 Tajna Dam Tajna Earthen 85.46 2073.17 19.89 27.51 23.44 Chute 0.60 IR
15 Arikul Dam Arikul Nala
Earthen 1986 34.20 976 16.8 2.52 2.32 IR
Annexure IV : Inventory of surface water resources
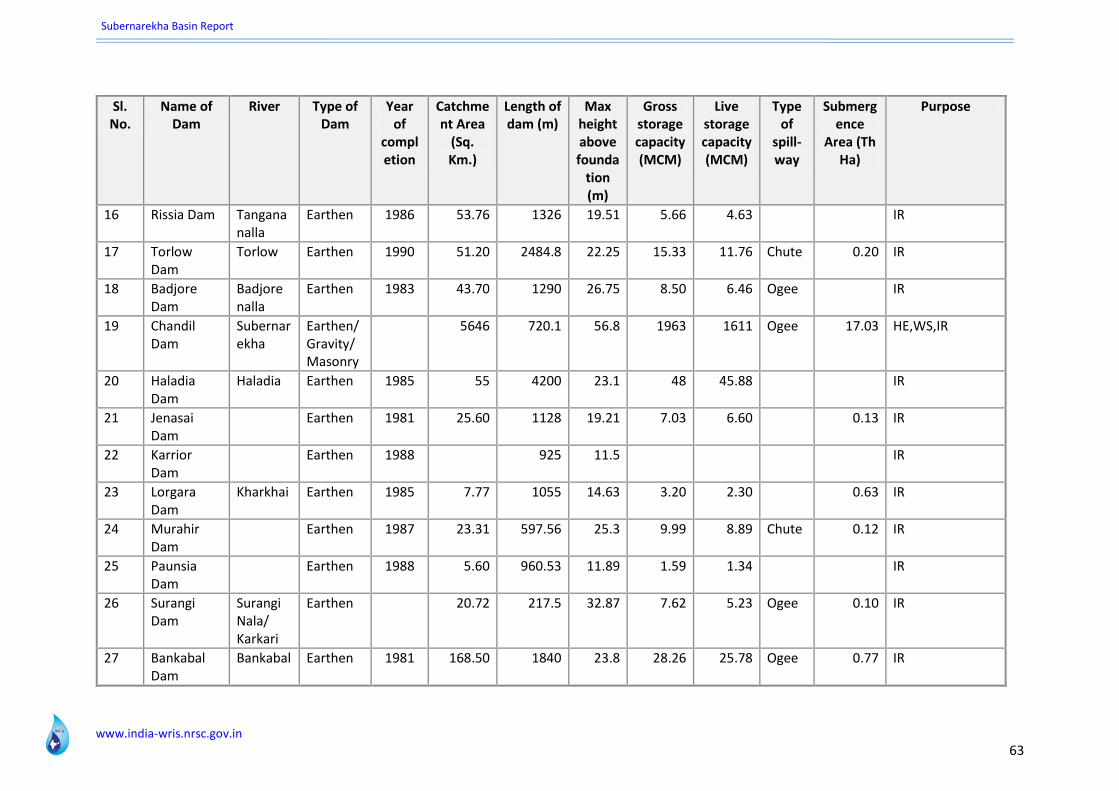
Subernarekha Basin Report
www.india-wris.nrsc.gov.in
63
Sl. No.
Name of Dam
River Type of Dam
Year of
completion
Catchment Area
(Sq. Km.)
Length of dam (m)
Max height above founda
tion (m)
Gross storage capacity (MCM)
Live storage capacity (MCM)
Type of
spill-way
Submergence
Area (Th Ha)
Purpose
16 Rissia Dam Tangana nalla
Earthen 1986 53.76 1326 19.51 5.66 4.63 IR
17 Torlow Dam
Torlow Earthen 1990 51.20 2484.8 22.25 15.33 11.76 Chute 0.20 IR
18 Badjore Dam
Badjore nalla
Earthen 1983 43.70 1290 26.75 8.50 6.46 Ogee IR
19 Chandil Dam
Subernarekha
Earthen/ Gravity/ Masonry
5646 720.1 56.8 1963 1611 Ogee 17.03 HE,WS,IR
20 Haladia Dam
Haladia Earthen 1985 55 4200 23.1 48 45.88 IR
21 Jenasai Dam
Earthen 1981 25.60 1128 19.21 7.03 6.60 0.13 IR
22 Karrior Dam
Earthen 1988 925 11.5 IR
23 Lorgara Dam
Kharkhai Earthen 1985 7.77 1055 14.63 3.20 2.30 0.63 IR
24 Murahir Dam
Earthen 1987 23.31 597.56 25.3 9.99 8.89 Chute 0.12 IR
25 Paunsia Dam
Earthen 1988 5.60 960.53 11.89 1.59 1.34 IR
26 Surangi Dam
Surangi Nala/ Karkari
Earthen 20.72 217.5 32.87 7.62 5.23 Ogee 0.10 IR
27 Bankabal Dam
Bankabal Earthen 1981 168.50 1840 23.8 28.26 25.78 Ogee 0.77 IR

Subernarekha Basin Report
www.india-wris.nrsc.gov.in
64
Sl. No.
Name of Dam
River Type of Dam
Year of
completion
Catchment Area
(Sq. Km.)
Length of dam (m)
Max height above founda
tion (m)
Gross storage capacity (MCM)
Live storage capacity (MCM)
Type of
spill-way
Submergence
Area (Th Ha)
Purpose
28 Getalsud Dam
Subernarekha
Earthen 1971 725 3800 36.1 288.76 230.76 Ogee 3.44 HE,WS,IR
29 Jambhira Dam
Jamira Earthen 1986 76.58 7360 30.4 216 214.10 Chute IR
30 Pokharia Dam
Pokharia Earthen 1983 13.73 183 15.81 1.47 1.10 IR
31 Jharjhara Dam
Bamini Nalla
Earthen 78 667.1 30.66 22.49 19.84 0.24 IR
32 Khadakhai Dam
Khadakhai
Earthen 1984 212.50 365.4 37 63.60 56.22 Ogee 0.98 IR
33 Kakudajodi Dam
Kukudajodi
Earthen 1976 12.90 853.44 15.04 1712 1480 IR
34 Khairabera Dam
Earthen 1989 371.95 21 5442 IR
35 Sitaram Pur Dam
Kharkai Earthen 1964 2043 16.77 8.83 8.09 IR
36 Lower : PPSP Dam
Rockfill 9.30 310 95 16 13 HE,IR
37 Upper : PPSP Dam
Rockfill 9.50 1505 71 16.50 13 HE,IR
38 Turga Irri. Scheme Dam
Turga Earthen 1990 890 21 IR

Subernarekha Basin Report
www.india-wris.nrsc.gov.in
65
B. List of BWA with surrogate information
Sl. No.
Name of B/W/A River Length (m) Height upto crest (m)
Catchment area (Th. ha)
Design flood discharge (Cumecs)
Purpose
1 Kita Weir Urangarha 37.57 4.16052 226.75 IR
2 Roro Weir Roro Gara 58.50 5.7912 1387.53 IR
3 Sona Weir Sona 31.10 5.1816 1602.73 IR
4 Sonua Weir Sanjay 66 4.05 1303 IR
5 Aradih Weir Kanchi 30.48 4.27 305.43 IR
6 Kanchi Weir Kanchi 230.95 1.98 2976.20 IR
7 Kokaro Weir Kokro 79.55 2.926 679.60 IR
8 Torlow Weir Torlo 0 0 IR
9 Lapasia Weir Lapasia 19.5070 1.603 82 IR
10 Rajbandh Weir 42.67 84.95 IR
11 Tajna Barrage Tajna 51.82 0 IR
12 Galudih Barrage Subernarekha 369 27.5 35430 HE,IR
13 Kharkai Barrage Kharkai 258 19824 IR
14 Karkhhai Barrage 0 0
15 Bijay / Vijay Weir Bijay 63.40 0.76 849.50 IR
16 Brahamani /Bamni Weir Bamni Nallah 61 566.09 IR
C. Major/Medium IR projects with surrogate information
Sl. No.
Name of Project Type River Tributary Status Year of completion
GCA (Th ha)
CCA (Th ha)
Ultimate IR Potential
District/s Benefitted
1 Subernarekha Multipurpose Project_Jharkhand
Major Subernarekha Ongoing 240.88 154.80 236.85 East Singhbhum

Subernarekha Basin Report
www.india-wris.nrsc.gov.in
66
Sl. No.
Name of Project Type River Tributary Status Year of completion
GCA (Th ha)
CCA (Th ha)
Ultimate IR Potential
District/s Benefitted
2 Subernarekha Multipurpose Project_West Bengal
Medium Subernarekha Ongoing 110.20 130
3 Subernarekha Major IR Project
Major Subernarekha Subernarekha Ongoing 170.26 109.63 187.46 Mayurbhanj, Baleshwar
4 Kanchi Major IR Project
Major Kanchi Completed 1970 34.20 17.80 18.08 Ranchi, Khunti, Saraikela
5 Sunei Major IR Project
Major Sunei Sunei River Completed 1992 12.50 10.96 15.20 Mayurbhanj, Baleshwar
6 Roro Medium IR Project
Medium Kharkhai Roro Gara Completed 1970 19.02 8.90 West Singhbhum
7 Khadkhai Medium IR Project
Medium Khadkai Completed 10.56 7.99 11.71 Mayurbhanj
8 Bankabahal Medium IR Project
Medium Mandavi Completed 7.20 10.37 Mayurbhanj
9 Sonua Medium IR Project
Medium Subanranrekha Ongoing 7.96 5.78 8.08 West Singhbhum
10 Sona Medium IR Project
Medium Sona Completed 1969 11.21 5.67 7.20 Saraikela, Kharsawan
11 Jharjhara Medium IR Project
Medium Bamini Nalla Ongoing 8.09 5.26 5.92 West Singhbhum
12 Basuki Medium IR Project
Medium South Koel Proposed 4.95 5.67 Ranchi
13 Kalo Medium IR Project
Medium Kalo Completed 7.16 4.80 6.97 Mayurbanj
14 Kokro IR Scheme Medium IR Project
Medium Subernarekha Raru Completed 1969 13.97 4.37 Ranchi
15 Baladiha Medium Medium Baladiha Baldiha Completed 1912 3.83 3.83 3.88 Mayurbanj

Subernarekha Basin Report
www.india-wris.nrsc.gov.in
67
Sl. No.
Name of Project Type River Tributary Status Year of completion
GCA (Th ha)
CCA (Th ha)
Ultimate IR Potential
District/s Benefitted
16 Kans Medium IR Project
Medium Ongoing 5.93 3.73 3.73 Ranchi
17 Tajna Barrage Medium IR Project
Medium Tajna Completed 3.26 4.70 Ranchi, Khunti
18 Torlow Medium IR Project
Medium Torlo Torlow Completed 1990 3.21 2.75 3.55 West Singhbhum , Chaibasa
19 Palna Medium IR Project
Medium Subernarekha Ranka Jhuria Completed 1985 3.51 2.75 2.75 Saraikela
20 Murahir Reservoir Scheme Medium IR Project
Medium Subanranrekha Lokjheria Nala
Completed 1987 3.88 2.31 2.46 East Singhbhum
21 Haladia Medium IR Project
Medium Haladia Completed 1912 2.27 2.27
22 Nakti Medium IR Project
Medium Sanjay Bijay Ongoing 2.51 2.26 2.26 West Singhbhum
23 Surangi Medium IR Project
Medium Surangi Nala\ Karkari
Ongoing 4.53 2.11 2.60 Ranchi, West Singhbhum
24 VIjay Medium IR Project
Medium Completed 4.04 1.60 2.80 Saraikela, Singhbhum
25 Jenasai Medium IR Project
Medium Sanjay Karala Completed 1981 2.59 1.60 2.11 West Singhbhum
26 Brahmani Medium IR Project
Medium Brahmani Bamni Completed 1961 3.44 1.35 1.50 West Singhbhum
27 Nesa Medium IR Project
Medium Nessa Completed 1981 1.60 1.20 1.60 Mayurbanj
28 Murumsona IR Scheme Medium IR Project
Medium Sana Completed 1970 1.13 Saraikela-Kharsawan

Subernarekha Basin Report
www.india-wris.nrsc.gov.in
68
Sl. No.
Name of Project Type River Tributary Status Year of completion
GCA (Th ha)
CCA (Th ha)
Ultimate IR Potential
District/s Benefitted
29 Aradih Weir Medium IR Project
Medium Subernarekha Completed 1955 2.11 1.02 1.02 Ranchi
30 Sonua Medium IR Project
Medium Sanjay Completed 1962 1.59 0.95 West Singhbhum
31 Raisa Medium IR Project
Medium Kanchi Kanchi Completed 1957 0.84 Ranchi, Khunti
32 Lorgara Medium IR Project
Medium Kharkhai Kharkhai Completed 1985 0.95 0.49 0.42 Saraikela
33 Rajbhandh Medium IR Project
Medium Subernarekha Completed 0.49 0.48 East Singhbhum
34 Nakti Nala Weir Scheme Medium IR Project
Medium Completed 0.99 0.40 Latehar
35 Desh Bandh Medium IR Project
Medium Completed 1970 0.38 0.38 East Singhbhum
36 Kita Medium IR Project
Medium Raru Urangarha Completed 1957 0.55 0.35 Ranchi
37 Kitanala Medium IR Project
Medium Kita Nala Completed 1961 0.22 0.26 East Singhbhum
38 Lapasia Medium IR Project
Medium Lapasia Completed 1954 0.73 0.21 Hazaribagh
39 Subernarekha Multipurpose Project_Odisha
Major Subernarekha Ongoing 0
40 Purulia Pumped Storage Project
0

Subernarekha Basin Report
www.india-wris.nrsc.gov.in
69
D. Power house and projects with surrogate information
Sl. No.
Power House Hydro Electric project
Type of Development
Position Altitude above
MSL (m)
No. of Turbines/
Units
Total Installed Capacity
(MW)
Minimum Draw Down
Level (m)
Number of Penstocks
1 Subernrekha-II Power House
Subernarekha Hydroelectric Project
Run of the river with small pondage
Canal Drop 310 1 65 579.50 1
2 Chandil Power House
Chandil Hydroelectric Project
Storage Dam Toe 2 8 2
3 Purulia Power House
Purulia Hydroelectric Project
Pumped Storage
Under Ground
4 900 494 2
A. Lithology in the Basin
Sl. No.
Location Depth Drilled
(m)
Major Lithology Depth to
bedrock (m)
Static water level (m)
Discharge (lps)
Draw down
(m)
No. of zones encountered/trapped
Total thickness of zones
(m)
Major rock group
1 Mohanpur 251.10 Quaternary/Tertiary Sediments
10.50 4 142 Un-consolidated Sediments (Quaternary -Recent)
2 Sarasankha 413.62 Tertiary sediments 44 17 6 141 Un-consolidated Sediments (Quaternary -
Annexure V : Inventory of litholog well locations

Subernarekha Basin Report
www.india-wris.nrsc.gov.in
70
Recent)
3 Asimulsuli 250.54 Quaternary Sediments
2 60 Un-consolidated Sediments (Quaternary -Recent)
4 Shaktinagar 252.22 Quaternary/Tertiary Sediments
11.07 5.83 5 5 209 Un-consolidated Sediments (Quaternary -Recent)
5 Dholkat Pukuria Bsas Pimary School
169.05 Quaternary/Tertiary Sediments
10.59 2.09 8 4 111 Un-consolidated Sediments (Quaternary -Recent)
6 Saptabanpalli 241.94 Quaternary/Tertiary Sediments
16.33 4.73 3 2 44 Un-consolidated Sediments (Quaternary -Recent)

Subernarekha Basin Report
www.india-wris.nrsc.gov.in
71
Sl. No.
Name Type River Regional office Division Section office Drainage area
(Sq.km)
Zero of Gauge
(m)
Bank Status
1 Adityapur GDSQ Subernarekha M & E RO, Bhubaneswar
E.E., Bhubaneswar
ADITYAPUR 6309 0 Left Existing
2 Balimunduli G Burhabalang M & E RO, Bhubaneswar
E.E., Bhubaneswar
BALIMUNDALI 190 0 Left Existing
3 Baripada G Burhabalang M & E RO, Bhubaneswar
E.E., Bhubaneswar
BARIPADA 1695 0 Left Existing
4 Chandanpur G Burhabalang M & E RO, Bhubaneswar
E.E., Bhubaneswar
CHANDANPUR 250 0 Left Existing
5 Ghatsila GDSQ Subernarekha M & E RO, Bhubaneswar
E.E., Bhubaneswar
GHATSHILA 14176 0 Left Existing
6 Govindpur (NH5 Road Bridge)
GDSQ Burhabalang M & E RO, Bhubaneswar
E.E., Bhubaneswar
N.H.V,Govindpur 4495 0 Left Existing
7 Jamshedpur GDSQ Subernarekha M & E RO, Bhubaneswar
E.E., Bhubaneswar
JAMSHEDPUR 12649 0 Right Existing
8 Jamsholaghat GD Subernarekha M & E RO, Bhubaneswar
E.E., Bhubaneswar
JAMSHOLAGHAT 16000 0 Right Existing
9 Muri GDQ Subernarekha M & E RO, Bhubaneswar
E.E., Bhubaneswar
MURI 1330 0 Right Existing
10 Jaypur G Burhabalang M & E RO, Bhubaneswar
E.E., Bhubaneswar
JAIPUR 1185 0 Left Existing
11 Rajghat G Subernarekha M & E RO, Bhubaneswar
E.E., Bhubaneswar
RAJGHAT 18260 0 Right Existing
12 Fekoghat GD Subernarekha M & E RO, Bhubaneswar
E.E., Bhubaneswar
FENKOGHAT 700 0 Left Existing
A. Salient features of Hydro- meteorological Stations
Annexure VI : Salient features of hydro- meteorological stations

Subernarekha Basin Report
www.india-wris.nrsc.gov.in
72
B. Salient features of Flood-Forecasting Stations
Sl. No
.
Site Name
Met Sub
Division
Independent river
Type of Forecast
Base Station-1
Travel Time Base
Station-1 (hrs)
Base Station-2 (hrs)
Travel Time Base
Station-2
Full Reservoir Level
(m)
Max Reservoir Level
(m)
Highest Flood Level (m)
Year of
H.F.L
Mode of Collectio
n
1 N H 5 Road Bridge
Odisha Burhabalang Level Forecast
Baripada 18-20 Jayapur 16-18 9.50 1973 Wireless
2 Rajghat Odisha Subernarekha
Level Forecast
Jamsaloghat
18-20 Fekoghat
6-9 12.69 2008 Wireless/ Telemetry

Subernarekha Basin Report
www.india-wris.nrsc.gov.in
73
A. Water Tourism Sites in the Basin
Sl.
No.
Name Type Waterbody WB Relation District State
1 Digha Tourist Spot Bay of Bengal On Medinipur West Bengal
2 Hundru Waterfall Waterfall Suwarnarekha River
On Ranchi Jharkhand
3 Dassam Waterfall Waterfall Kanchi River Near by Ranchi Jharkhand
B. Wildlife Sanctuaries / National Parks in the Basin
Sl.
No.
Name Type Waterbody WB
Relation
Nearest
City
District State Year of
Establishment
Mammals Birds Reptiles
1 Chandil Dalma Elephant Reserve
National Parks
Purbi Singhbhum
Jharkhand Elephants
Annexure VII : Inventory of water tourism sites

Subernarekha Basin Report
www.india-wris.nrsc.gov.in
74
Acronyms
AEZ Agro-Ecological Zones
AIA Annual Irrigated Area
AIBP Accelerated Irrigation Benefits Programme
APGCL Assam Power Generation Corporation Limited
AWS Automatic Weather Stations
B&BBO Brahmaputra and Barak Basin Organization
BB Brahmaputra Board
BCB Bansagar Control Board
BCM Billion Cubic Metre
BIS Bureau of Indian Standards
BOD Biological Oxygen Demand
BR Balancing Reservoir
BRB Betwa River Board
BWA Barrage Weir Anicut
C&SRO Cauvery and Southern Rivers Organization
CAZRI Central Arid Zone Research Institute
CBIP Central Board of Irrigation & Power
CCA Culturable Command Area
CEA Central Electricity Authority
CGWB Central Ground Water Board
Ch Chainage
CIWTC Central Inland Water Transport Corporation
CPCB Central Pollution Control Board
CSMRS Central Soil & Materials Research Station
cumec cubic metre per sec
cusec cubic foot per sec
CWC Central Water Commission
CWPRS Central Water and Power Research Station
D Discharge
DEM Digital Elevation Model
DOS Department of Space
DVC Damodar Valley Corporation
EC Electrical Conductivity
EFR East Flowing Rivers
ERM Extension, Renovation and Modernization
ETP Effluent Treatment Plant
EW Exploratory Well
FAO Food and Agriculture Organization
FC Flood Control
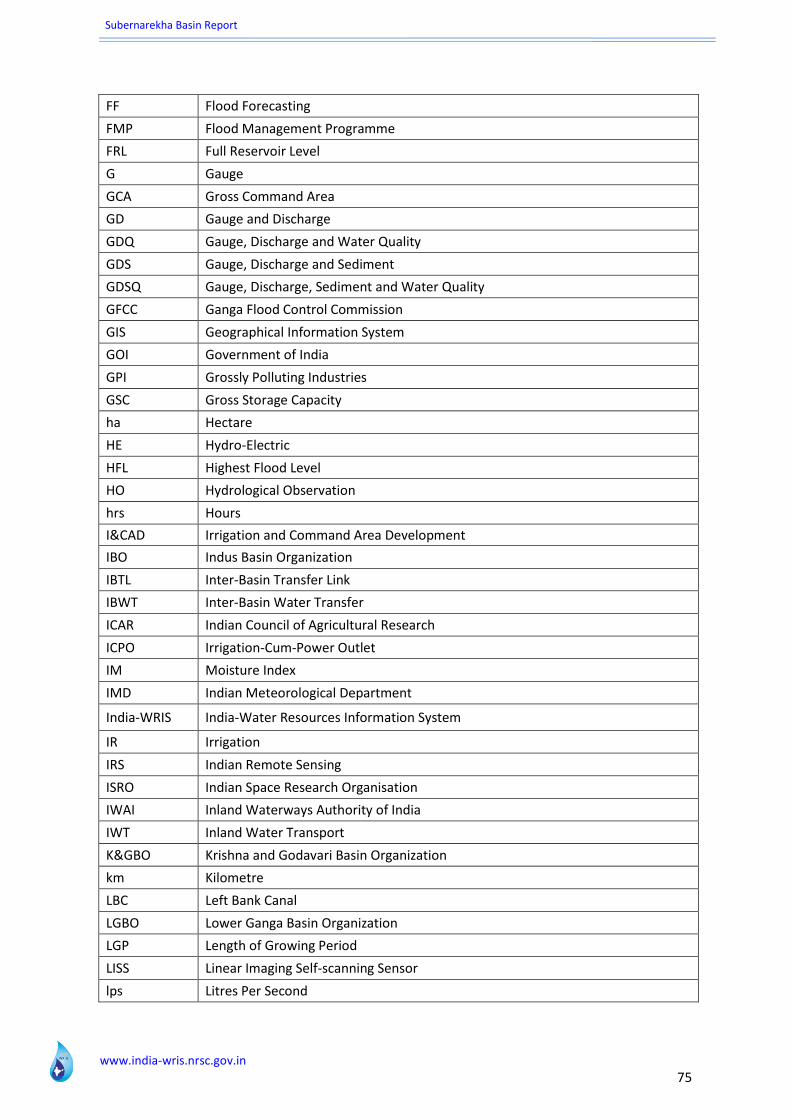
Subernarekha Basin Report
www.india-wris.nrsc.gov.in
75
FF Flood Forecasting
FMP Flood Management Programme
FRL Full Reservoir Level
G Gauge
GCA Gross Command Area
GD Gauge and Discharge
GDQ Gauge, Discharge and Water Quality
GDS Gauge, Discharge and Sediment
GDSQ Gauge, Discharge, Sediment and Water Quality
GFCC Ganga Flood Control Commission
GIS Geographical Information System
GOI Government of India
GPI Grossly Polluting Industries
GSC Gross Storage Capacity
ha Hectare
HE Hydro-Electric
HFL Highest Flood Level
HO Hydrological Observation
hrs Hours
I&CAD Irrigation and Command Area Development
IBO Indus Basin Organization
IBTL Inter-Basin Transfer Link
IBWT Inter-Basin Water Transfer
ICAR Indian Council of Agricultural Research
ICPO Irrigation-Cum-Power Outlet
IM Moisture Index
IMD Indian Meteorological Department
India-WRIS India-Water Resources Information System
IR Irrigation
IRS Indian Remote Sensing
ISRO Indian Space Research Organisation
IWAI Inland Waterways Authority of India
IWT Inland Water Transport
K&GBO Krishna and Godavari Basin Organization
km Kilometre
LBC Left Bank Canal
LGBO Lower Ganga Basin Organization
LGP Length of Growing Period
LISS Linear Imaging Self-scanning Sensor
lps Litres Per Second

Subernarekha Basin Report
www.india-wris.nrsc.gov.in
76
LSC Live Storage Capacity
LULC Land Use Land Cover
m metre
M&ERO Mahanadi and Eastern Rivers Organization
MAF Million Acre Feet
MCM Million Cubic metre
Mcum Million Cubic metre
MDDL Minimum Draw Down Level
mg/l Milligram per Litre
MI Minor Irrigation
MLD Million Liters per Day
mm Millimetres
MMIR Major and Medium Irrigation
MOSDAC Meteorological & Oceanographic Satellite Data Archival Centre
MoU Memorandum of Understanding
MoWR Ministry of Water Resources
MPN Most Probable Number
MSL Mean Sea Level
MU Million Units
MW Mega Watt
N&TBO Narmada and Tapi Basin Organization
NBO Narmada Basin Organization
NBSS & LUP National Bureau of Soil Survey & Land Use Planning
NEEPCO North Eastern Electric Power Corporation Limited
NEIC North Eastern Investigation Circle
NF No Flow
NGRBA National Ganga River Basin Authority
NHPC National Hydro Power Corporation Limited
NRLD National Register of Large Dam
NRSC National Remote Sensing Centre
NW National Waterway
NWDA National Water Development Authority
NWDT Narmada Water Disputes Tribunal
NWMP Northern Water Monitoring Programme
NWP National Water Policy
OW Observatory Well
P Precipitation
PET Potential Evapotranspiration
PH Power House
pH puissance de Hydrogen

Subernarekha Basin Report
www.india-wris.nrsc.gov.in
77
ppm parts per million
PS Pisciculture
PW Peizometre Well
Q Water Quality
R&R Rehabilitation and Resettlement
RBC Right Bank Canal
RF Rainfall
RRR Repair, Renovation and Restoration
RRSC Regional Remote Sensing Centre
RSC Residual Sodium Carbonate
S Sediment
SAC Standing Advisory Committee
SAR Sodium Absorption Ratio
SD Sub Division
SMCS Soil Moisture Control Section
SOI Survey of India
Sq.km Square Kilometres
SRTM Shuttle Radar Topographic Mission
TAC Technical Advisory Committee
TBO Tapi Basin Organization
TC Total Coliform
TDS Total Dissolved Solids
Th ha Thousand Hectare
THDC Tehri Hydro Development Corporation
TW Tube well
UGBO Upper Ganga Basin Organization
UIP Ultimate Irrigation Potential
UJVNL Uttarkhand Jal Vidyut Nigam Limited
UNESCO United Nations Educational, Scientific and Cultural Organization
UPJVNL Uttar Pradesh Jal Vidyut Nigam Limited
UT Union Territory
WB Water Body
WFR West Flowing Rivers
WMO World Meteorological Organization
WS Water Supply
YBO Yamuna Basin Organization

Subernarekha Basin Report
www.india-wris.nrsc.gov.in
78
References
Prasad, N. and Singh, Onkar. 1971. Andhra Plateau. In: Singh, R.L. et al. eds. India A
Regional Geography.Varansi, pp.847-849.
Central Water Commission. 2013. Annual Report 2012-2013.
Central Water Commission, New Delhi. 2010. Water Year Book, CWC, 2009-2010.
Central Water commission, New Delhi. 1997. India River Basin Atlas.
Jain, Sharad. K.; Agarwal, Pushpendra. K.; Singh, Vijay P. 2007. Hydrology and Water
Resources of India. pp 611-621.
Ministry of Irrigation and Power, New Delhi.1972. Report of the Irrigation Commission
Volume III (Part 1 & 2), pp. 3-27.
National Remote Sensing Centre, Hyderabad. 2011. Landuse land cover Atlas of India
based on Multi-temporal Satellite Data of 2005-06.
Regional Remote Sensing Center West, NRSC, ISRO, Jodhpur, India.2012. River Basin Atlas
of India.
Regional Remote Sensing Center West Technical Report.2009. Assessment of Waterlogging
and Salt and/or Alkaline affected Soils in the Commands of All Major and Medium Irrigation
Projects in the Country using Satellite Remote Sensing, PP. 16-21, 67-71.
Sehgal, J.; Mandal, D.K.; Mandal, C. and Vadivelu, S. 1992. Agro-Ecological Regions of India.
Second Edition, Tech. Bull. No. 24, NBSS and LUP, pp 130.
Links:
a. India-Water Resources Information System: www.india-wris.nrsc.gov.in
b. Shuttle Radar Topography Mission SRTM) 90 m digital elevation Model: CGIAR. 2006,
http://srtm.sci.cgiar.org

Subernarekha Basin Report
www.india-wris.nrsc.gov.in
79
Authors
ISRO Officials CWC Officials
Dr. V.K. Dadhwal Director National Remote Sensing Centre (NRSC) ISRO, Department of Space, Govt. of India Balanagar, Hyderabad
Er. A. Mahendran Member (WP & P) Central Water Commission New Delhi
Dr. J.R. Sharma Project Director, India-WRIS Project & Chief General Manager Regional Remote Sensing Centres - NRSC/ ISRO DOS Branch Secretariat, Loknayak Bhawan New Delhi
Er. W.M. Tembhurney Chief Engineer (EMO) Central Water Commission New Delhi
Dr. A.T Jeyseelan General Manager Regional Remote Sensing Centre-West NRSC, ISRO, Jodhpur
Er R.K.Jain Chief Engineer (BPMO) Central Water Commission New Delhi
Ms. B Manasa Devi Research Scientist Regional Remote Sensing Centre-West NRSC, ISRO, Jodhpur
Er. Yogesh Paithankar Director Remote Sensing Directorate Central Water Commission, New Delhi
Mrs. Himani Singh Research Scientist Regional Remote Sensing Centre-West NRSC, ISRO, Jodhpur
Er. Alok Paul Kalsi Deputy Director Remote Sensing Directorate Central Water Commission, New Delhi

Subernarekha Basin Report
www.india-wris.nrsc.gov.in
80
ISRO Officials
CWC Officials
Project Director Dr. J R Sharma Project In-charge Er. Yogesh Paithankar, Director
Convener (S/W)
Sh. P G Diwakar
Quality Assurance Team Sh. V M Bothale, Sh. M V Ravikumar, Dr. S S Rao, Dr. S N Das, Sh. D S P Rao, Ms. A Vijaya Banu, Sh. Chandrasekaran, Sh. D J Chutia
Dy. Project In-charge Er. Alok Paul Kalsi, Dy. Director Er. Prashant Kumar Gupta, Dy. Director
Convener (Database) Dr. A Jeyaram
Quality Assurance Team Dr. S Sudhakar, Sh. Uday Raj, Dr. M Kudrat, Ms. Rajashree V Bothale, Dr. D Dutta, Dr. G Ravishankar, Sh. S Pathak, Dr. K K Sarma
Technical Guidance Er. C K Agarwal, Chief Engineer (B & BBO) Er. W M Tembhurney, Chief Engineer EMO Er R.K. Jain, Chief Engineer (BPMO) Project Coordinators Sh. Shantanu B., Sh.Uday Raj, Dr. A T Jeyaseelan
Project Managers Dr. A K Bera, Dr. B K Bhadra, Sh. S Pathak, Dr. Rakesh Paliwal
Groups and Work Components
Project Leads & Project Scientists at Lead Centre
Research Scientists at Lead Centre
DPDs & Project Scientists
Team
Er. Navin Kumar, Director
Er. S N Abraham, Director
Er. R Azhagesan, Director
Er. Ashish Banerjee, Director
Er. Rajiv Kumar, Director
Er. Piyush Ranjan, Executive Engineer
Er. Pankaj Sharma, Dy. Director
Er. Amarjit Singh, Dy. Director
Er. S K Chaturvedi, Dy. Director
Er. Y S Varshney, Executive Engineer
Er. Manoj Paunikar, Executive Engineer
Er. Amitabh Prabhakar, Executive Engineer
Er. Vishal Garg, Assistant Director
Er. M Sahabdeen, Assistant Director
Er. Ashish Awasthi Assistant Director
Er. R. Bhaskaran, Assistant Director
S/W Design, Architecture, Integration, Data Security, Web Hosting & Website
Sh. Gaurav Kumar
Sh. K S Srinivasan
Sh. Hansraj Meena
Ms. Suman Gurjar
Ms. Pragya Chaturvedi
Ms. Shilpa Taneja
Ms. S V Pravalika
Ms. Divya Mishra
Ms. Jyotsana Chuchra
Mr. Samuel Lourdraj C
Mr. Rahul Sharma
Mr. Piyush Dubey
Mr. V Srinivasa Reddy
Ms. Chitra S Pai
Ms. Manasa Devi B
Mr. Mohamed Ali S
Ms. Hemlata Gehlot
Mr. Amit Kumar
Mr. Devdatta Tengshe
Mr. Jai Prakash Jyani
Mr. Munish Gorsi
Ms. Deepika Acharaya
Ms. Pratima Tak
Mr. Niteen K Bankar
Ms. Himani Singh
Ms. Sneha
Ms. Kamini Yadav
Mr. Goutam Bhati
Mr. Debhasish Bhakta
Mr. Nitin Chauhan
Ms. Ila Agnihotri
Mr. Vishal Singh
Ms. Vineeta Sharma
Dr. N Vyjayanthi
Dr. Shirsath Paresh B
Mr. Sanjay Kumar
Ms. Rashmi Rekha Dutta
Mr. Brij Kishor Jashal
Sh. Vinod M Bothale
Sh. Shantanu B
Sh. K Nagajyothi
Sh. S S Rajashekhar
Sh. Harish Karnatak
Sh. D Giribabu
Dr. A V Suresh Babu
Sh. E Sivasankar
Database Organization & Geo-database Standards
Dr. A K Bera
Dr. Rakesh Paliwal
Dr. M C Gupta
Dr. S N Das
Dr. S S Rao
Sh. K Abdul Hakeem
Legacy Data ISRO Projects
Dr. Rakesh Paliwal
Sh. Ashish Kumar Jain
Dr. V V Rao Dr. G Ravishankar Dr. A V Suresh Babu Sh. B Simhadhari Rao
Watershed Atlas & Water Resources Projects
Dr. A K Bera
Dr. Rakesh Paliwal
Er. Sagar S Salunkhe
Ms. Rajashree V B
Dr. G Sreenivasan
Dr. S Ravindranath
Dr. K H V Durga Rao
Administrative & Thematic Layers
Dr. B K Bhadra
Dr. Rakesh Paliwal
Sh. S Pathak
Sh. Sushilkumar B Rehpade
Sh. Amanpreet Singh
Dr. D Dutta Dr. V M Choudhary Sh. P V Raju Sh. P Satyanarayana
Environmental Data Dr. S Rama Subramoniam
Dr. Manoj Joseph
Dr. S N Das Sh. John Mathew Sh. M Shanker Sh. B Simhadhari Rao
Capacity Building, Modelling, Value Addition & Report
Sh. S Pathak Dr. P Manavalan Sh. Pramod Kumar Sh. P V Raju Dr. K H V Durga Rao
India-WRIS Project Team
India-WRIS Project Team
Lead Centre: Regional Remote Sensing Centre - West, NRSC/ISRO, Jodhpur

Subernarekha Basin Report
www.india-wris.nrsc.gov.in
81


