80
IBM Tivoli® Version 3.1.0 Using IBM Tivoli OMEGAMON XE for IMS on z/OS GC32-9351-00 OMEGAMON XE for IMS on z/OS

IBMTivoli®
Version 3.1.0
Using IBM Tivoli OMEGAMON XE for IMS on z/OS
GC32-9351-00
OMEGAMON XE for IMS on z/OS

12
1
2
IBMTivoli®
Version 3.1.0
OMEGAMON XE for IMS on z/OS
Using IBM Tivoli OMEGAMON XE for IMS on z/OS
GC32-9351-00

12
1
Second Edition (December 2005)
This edition applies to version 3.1.0 of IBM Tivoli OMEGAMON XE for IMS on z/OS (product number 5698-A39) and to all subsequent releases and modifications until otherwise indicated in new editions.
This edition replaces GC32-9192-00.
© Copyright IBM Corp. 2004, 2005 All Rights Reserved.
Note to U.S. Government Users Restricted Rights -- Use, duplication or disclosure restricted by GSA ADP Schedule Contract with IBM Corp.
2
Before using this information and the product it supports, read the information in “Notices” on page 71.
Note

Contents 5
What�s New in Version 3.1.0 . . . . . . . . . . . . . . . . . . . . . . . . . . . . . . . . . . . . . . . . . . . . . . . . . . . . . . . 7
Preface . . . . . . . . . . . . . . . . . . . . . . . . . . . . . . . . . . . . . . . . . . . . . . . . . . . . . . . . . . . . . . 9About This Guide . . . . . . . . . . . . . . . . . . . . . . . . . . . . . . . . . . . . . . . . . . . . . . . . . . . . .10Documentation Conventions. . . . . . . . . . . . . . . . . . . . . . . . . . . . . . . . . . . . . . . . . . . . .15
Chapter 1. Introducing IBM Tivoli OMEGAMON XE for IMS on z/OS. . . . . . . . . . . . . . . . 17Tivoli OMEGAMON XE for IMS Description . . . . . . . . . . . . . . . . . . . . . . . . . . . . . . . . .18Key Features . . . . . . . . . . . . . . . . . . . . . . . . . . . . . . . . . . . . . . . . . . . . . . . . . . . . . . . . .21
Chapter 2. Using and Customizing Tivoli OMEGAMON XE for IMS . . . . . . . . . . . . . . . . .25Using the Predefined Workspaces . . . . . . . . . . . . . . . . . . . . . . . . . . . . . . . . . . . . . . . . .26Using the Predefined Situations . . . . . . . . . . . . . . . . . . . . . . . . . . . . . . . . . . . . . . . . . . .29Investigating an Event . . . . . . . . . . . . . . . . . . . . . . . . . . . . . . . . . . . . . . . . . . . . . . . . . .32Using Historical Data Collection and Reporting . . . . . . . . . . . . . . . . . . . . . . . . . . . . . . .35Finding More Information . . . . . . . . . . . . . . . . . . . . . . . . . . . . . . . . . . . . . . . . . . . . . . .38
Chapter 3. Monitoring IMS Systems . . . . . . . . . . . . . . . . . . . . . . . . . . . . . . . . . . . . . . . . . 39Introducing the IMS Workspaces . . . . . . . . . . . . . . . . . . . . . . . . . . . . . . . . . . . . . . . . . .40The System-Level Workspaces . . . . . . . . . . . . . . . . . . . . . . . . . . . . . . . . . . . . . . . . . . .43
Chapter 4. Monitoring IMSplex . . . . . . . . . . . . . . . . . . . . . . . . . . . . . . . . . . . . . . . . . . . . . 55Introducing the IMSplex Workspaces . . . . . . . . . . . . . . . . . . . . . . . . . . . . . . . . . . . . . . .56The Shared Queues Group Workspaces . . . . . . . . . . . . . . . . . . . . . . . . . . . . . . . . . . . .58The Data Sharing Group Workspaces . . . . . . . . . . . . . . . . . . . . . . . . . . . . . . . . . . . . . .63
Appendix A. Support Information . . . . . . . . . . . . . . . . . . . . . . . . . . . . . . . . . . . . . . . . . . . . .65
Appendix B. Notices . . . . . . . . . . . . . . . . . . . . . . . . . . . . . . . . . . . . . . . . . . . . . . . . . . . . . . .71
Index . . . . . . . . . . . . . . . . . . . . . . . . . . . . . . . . . . . . . . . . . . . . . . . . . . . . . . . . . . . . . 75
Contents

6 Using IBM Tivoli OMEGAMON XE for IMS on z/OS, Version 3.1.0

What�s New in Version 3.1.0 7
What’s New in Version 3.1.0
IBM® Tivoli® OMEGAMON® XE for IMS� on z/OS®, Version 3.1.0 is a member of the latest generation of OMEGAMON family of mainframe monitoring products. It enables you to monitor and manage the availability, performance, and resource utilization of your IMS environment, both at a system level and within an IMSplex. Tivoli OMEGAMON XE for IMS merges the functionality of two OMEGAMON XE products:
� OMEGAMON XE for IMS
� OMEGAMON XE for IMSplex
In addition, this release
� continues the migration of functionality from OMEGAMON and OMEGAMON II for IMS
� offers enhancements of existing functionality
� provides new features
The new and migrated features allow existing 3270-based users to migrate to the XE architecture without losing significant function. In addition, however, Tivoli OMEGAMON XE for IMS offers you access to the OMEGAMON for IMS classic and CUA® 3270 implementations.
Product simplificationEnhancements to Tivoli OMEGAMON XE for IMS improve its versatility. Its Candle Management Server® hub runs on additional platfroms, including AIX, Sun, HP, and Windows.
Real-time event monitoringTivoli OMEGAMON XE for IMS collectors now include real-time event monitoring support.
Global Lock usabilityTivoli OMEGAMON XE for IMS�s restructured Lock table provides lock owner information in the same row as waiters.
Historical data collectionComplete historical data can be collected for most new tables added and for those tables that were not eligible for historical collection in previous releases.
W
8 Using IBM Tivoli OMEGAMON XE for IMS on z/OS, Version 3.1.0
Enhanced reporting capabilities for transaction related dataReporting enhancements include the monitoring of input/output common queue server (CQS) time, input/output local queue time, and local/shared input queue time. Tivoli OMEGAMON XE for IMS also now supports log records for Multiple Systems Coupling (MSC), Shared Queues, and Fast Path. With shared queue transactions, the log records for transit time reports might be on several IMS subsystem logs. The TRF Extractor has been enhanced to correctly process log data of shared IMS environments.
Open Transaction Manager Access (OTMA) extensionsTivoli OMEGAMON XE for IMS enriches available OMTA information by including basic configuration data along with statistics on transaction pipes (Tpipes) and transaction members (Tmembers).
Shared Queue enhancementsTivoli OMEGAMON XE for IMS adds OTMA, advanced program-to-program communication (APPC), and cold queue reporting to the shared queue reporting feature. Table structure has been updated to provide unique views of each type of monitored queue.
IMS Connect supportTivoli OMEGAMON XE for IMS displays the CPU resource consumed by an individual task control block (TCB) within the IMS Connect address space. The value of this data is that the IMS Connect address space dedicates a TCB to each port to which it listens. Thus a TCB CPU profile will give an indication of the absolute and relative activity of each active TCP/IP port.
Fast Path Wait for Input (WFI) supportTivoli OMEGAMON XE for IMS now reports on the transaction DL/I activity within a fast path region for the currently active transaction.
Used in conjunction with other OMEGAMON XE monitoring products, the data, analyses, and alerts presented by IBM Tivoli OMEGAMON XE for IMS on z/OS help you develop a holistic view of your entire computing enterprise from a single console.

Preface 9
Preface
The Using IBM Tivoli OMEGAMON XE for IMS on z/OS, Version 3.1.0 manual explains how to monitor availability and performance of the components of your IMS environment with IBM Tivoli OMEGAMON XE for IMS on z/OS. This guide describes the features and functionality specific to Tivoli OMEGAMON XE for IMS. It is not intended as an introduction to the OMEGAMON Platform.
This guide will help you
� become familiar with the predefined workspaces that report on your IMS system and IMSplex environment
� anticipate and detect problems in using your IMS environment
� access specific information about events occurring in your environment
P

About This Guide
10 Using IBM Tivoli OMEGAMON XE for IMS on z/OS, Version 3.1.0
About This Guide
Audience for this guideThis guide is intended primarily for those responsible for planning and configuring monitoring of IMSplexes and the IMS systems that participate in them. It also contains information of interest to those who are responsible for
� monitoring the health of these systems and resolving or forwarding problems
� troubleshooting and providing solutions for problems
� fine-tuning the performance of systems (by measuring system capabilities and tweaking configuration settings).
This guide assumes familiarity with the following topics:
� The z/OS operating system and its associated concepts
� Microsoft Windows® or UNIX® desktop environment
� The OMEGAMON Platform
� The functionality of the CandleNet Portal®
� Database administration concepts
� Performance monitoring concepts
Document set informationThis section lists publications in the IBM Tivoli OMEGAMON XE for IMS on z/OS library and related documents. It also describes how to access Tivoli publications online and how to order Tivoli publications.
IBM Tivoli OMEGAMON XE for IMS on z/OS library
The following documents are available in the library:
� Getting Started with IBM Tivoli OMEGAMON XE for IMS on z/OS, SC32-9469
Provides planning information for installing IBM Tivoli OMEGAMON XE for IMS on z/OS and information about the OMEGAMON XE zSeries® products.
� Configuring IBM Tivoli OMEGAMON XE for IMS on z/OS, SC32-9354
Explains how to configure and customize IBM Tivoli OMEGAMON XE for IMS on z/OS and its user interfaces and components.
� Using IBM Tivoli OMEGAMON XE for IMS on z/OS, GC32-9351
Describes the basics of using IBM Tivoli OMEGAMON XE for IMS on z/OS to manage real-time IMS environments.
� IBM Tivoli OMEGAMON XE for IMS on z/OS Release Notes, GI11-4037
Contains information about what is new in this release, including new or revised OMEGAMON II® panels. Also contains information about problems discovered late in

Preface 11
About This Guide
the testing cycle that are not included in the other publications and work-around procedures for those problems.
IBM Tivoli OMEGAMON II for IMS library
The following documents are available in the library:
� IBM Tivoli OMEGAMON II for IMS User�s Guide, GC32-9355
Describes the basics of using IBM Tivoli OMEGAMON II for IMS to manage real-time IMS environments.
� IBM Tivoli OMEGAMON II for IMS Configuration and Customization Guide, SC32-9356
Explains how to configure and customize OMEGAMON II and its user interfaces and components.
� IBM Tivoli OMEGAMON II for IMS IMS Console Facility, SC32-9357
Provides a comprehensive description of the features of the IMS Console Facility (ICF) component.
� IBM Tivoli OMEGAMON II for IMS Transaction Reporting Facility, SC32-9358
Provides user and reference information about the features of the Transaction Reporting Facility (TRF) component.
� IBM Tivoli OMEGAMON II for IMS Bottleneck Analysis Reference Manual, SC32-9359
Provides reference information and descriptions of the features of the bottleneck analysis component.
� IBM Tivoli OMEGAMON II for IMS Historical Component (EPILOG) Reference Manual, SC32-9360
Provides a comprehensive description of the features of the historical component (EPILOG®).
� IBM Tivoli OMEGAMON II for IMS Historical Component (EPILOG) User�s Guide, GC32-9361
Teaches you, step-by-step, how to operate the historical component (EPILOG) reporter after installation.
� IBM Tivoli OMEGAMON II for IMS Realtime Commands Reference Manual, SC32-9362
Describes in detail all of the features of the OMEGAMON II command interface.
� IBM Tivoli OMEGAMON II for IMS Response Time Analysis (RTA) Reference Manual, SC32-9363
Provides reference information and descriptions of the features of the response time analysis (RTA) component.
� IBM Tivoli OMEGAMON II for IMS Application Trace Facility, SC32-9470
About This Guide
12 Using IBM Tivoli OMEGAMON XE for IMS on z/OS, Version 3.1.0
Explains how the Application Trace Facility (ATF) monitors and collects detailed information on IMS and Data base Control (DBCTL) transactions to help you analyze and improve performance.
� IBM Tivoli End-to-End Response Time Feature Reference Manual, SC32-9376
Provides a description of the ETE Response Time feature and explains how to start ETE after installation and customization have been completed. Also includes a description of each ETE command argument and descriptions of the ETE error messages, return codes, and sense codes.
IBM Tivoli OMEGAMON Platform Messages
The following books document the messages issued by the OMEGAMON Platform components and products that run on it.
� IBM Tivoli Candle Products Messages Volume 1 (AOP�ETX), SC32-9416
� IBM Tivoli Candle Products Messages Volume 2 (EU�KLVGM), SC32-9417
� IBM Tivoli Candle Products Messages Volume 3 (KLVHS-KONCT), SC32-9418
� IBM Tivoli Candle Products Messages Volume 4 (KONCV-OC), SC32-9419
� IBM Tivoli Candle Products Messages Volume 5 (ODC�VEB and Appendixes), SC32-9420
Related publications
To use the information in this guide effectively, you must have some prerequisite knowledge, which you can obtain from the following guides:
� Installing and Setting up OMEGAMON Platform and CandleNet Portal on Windows and UNIX, SC32-1768
Provides information on installing and setting up the component products of the OMEGAMON Platform: Candle Management Server®, CandleNet Portal, Candle Management Workstation®, Warehouse Proxy, Alert Adapter for AF/REMOTE®, Alert Adapter for Tivoli Enterprise Console®, and Alert Emitter for Tivoli Enterprise Console on Windows® and UNIX®.
� Administering OMEGAMON Products: CandleNet Portal, GC32-9180
This document describes the support tasks and functions required for the OMEGAMON platform, including CandleNet Portal user administration.
� Using OMEGAMON Products: CandleNet Portal, GC32-9182
This guide describes the features of CandleNet Portal and how best to use them with your OMEGAMON products.
� Historical Data Collection Guide for IBM Tivoli OMEGAMON XE Products, GC32-9429
Describes the process of collecting historical data and either warehousing it or converting it to delimited flat files for reporting purposes. Also describes how to configure historical data collection and warehousing intervals using the CandleNet

Preface 13
About This Guide
Portal describes how to maintain the Persistent Data Store used to collect and store historical data on z/OS.
� Configuring IBM Tivoli Candle Management Server on z/OS, GC32-9414
Provides instructions for configuring and customizing the Candle Management Server on z/OS.
The online glossary for the CandleNet Portal includes definitions for many of the technical terms related to OMEGAMON XE software.
Accessing publications online
The documentation CD contains the publications that are in the product library. The format of the publications is PDF. Refer to the readme file on the CD for instructions on how to access the documentation.
IBM posts publications for this and all other Tivoli products, as they become available and whenever they are updated, to the Tivoli software information center Web site. Access the Tivoli software information center by first going to the Tivoli software library at the following Web address:
http://www.ibm.com/software/tivoli/library
Scroll down and click the Product manuals link. In the Tivoli Technical Product Documents Alphabetical Listing window, click the Tivoli OMEGAMON XE for IMS link to access the product library at the Tivoli software information center.
If you print PDF documents on other than letter-sized paper, set the option in the File -> Print window that allows Adobe Reader to print letter-sized pages on your local paper.
Ordering publications
You can order many Tivoli publications online at the following Web site:
http://www.elink.ibmlink.ibm.com/public/applications/publications/cgibin/pbi.cgi
You can also order by telephone by calling one of these numbers:
� In the United States: 800-879-2755
� In Canada: 800-426-4968
In other countries, contact your software account representative to order Tivoli publications.
Tivoli technical trainingFor Tivoli technical training information, refer to the following IBM Tivoli Education Web site:
http://www.ibm.com/software/tivoli/education
Support informationIf you have a problem with your IBM software, you want to resolve it quickly. IBM provides the following ways for you to obtain the support you need:

About This Guide
14 Using IBM Tivoli OMEGAMON XE for IMS on z/OS, Version 3.1.0
� Searching knowledge bases: You can search across a large collection of known problems and workarounds, Technotes, and other information.
� Obtaining fixes: You can locate the latest fixes that are already available for your product.
� Contacting IBM Software Support: If you still cannot solve your problem, and you need to work with someone from IBM, you can use a variety of ways to contact IBM Software Support.
For more information about these three ways of resolving problems, see �Support Information� on page 65.
Participating in newsgroupsUser groups provide software professionals with a forum for communicating ideas, technical expertise, and experiences related to the product. They are located on the Internet and are available using standard news reader programs. These groups are primarily intended for user-to-user communication and are not a replacement for formal support.
To access a newsgroup, use the instructions appropriate for your browser.

Preface 15
Documentation Conventions
Documentation Conventions
OverviewThis guide uses several conventions for special terms and actions, and operating system-dependent commands and paths.
Panels and figuresThe panels and figures in this document are representations. Actual product panels might differ.
Required blanksThe slashed-b (!) character in examples represents a required blank. The following example illustrates the location of two required blanks.
!!!!eBA*ServiceMonitor!!!!0990221161551000
Revision barsRevision bars (|) might be displayed in the left margin to identify new or updated material.
Variables and literalsIn examples of z/OS command syntax, uppercase letters are actual values (literals) that the user types; lowercase letters are used for variables that represent data supplied by the user. Default values are underscored.
LOGON APPLID (cccccccc)
In the above example, you type LOGON APPLID followed by an application identifier (represented by cccccccc) within parentheses.
SymbolsThe following symbols might appear in command syntax:
Table 1. Symbols in Command Syntax
Symbol Usage
| The �or� symbol is used to denote a choice. Either the argument on the left or the argument on the right can be used. Example:
YES | NOIn this example, YES or NO can be specified.

Documentation Conventions
16 Using IBM Tivoli OMEGAMON XE for IMS on z/OS, Version 3.1.0
[ ] Denotes optional arguments. Those arguments not enclosed in square brackets are required. Example:
APPLDEST DEST [ALTDEST]In this example, DEST is a required argument and ALTDEST is optional.
{ } Some documents use braces to denote required arguments, or to group arguments for clarity. Example:
COMPARE {workload} -REPORT={SUMMARY | HISTOGRAM}
The workload variable is required. The REPORT keyword must be specified with a value of SUMMARY or HISTOGRAM.
_ Default values are underscored. Example:
COPY infile outfile - [COMPRESS={YES | NO}]In this example, the COMPRESS keyword is optional. If specified, the only valid values are YES or NO. If omitted, the default is YES.
Table 1. Symbols in Command Syntax
Symbol Usage

Introducing IBM Tivoli OMEGAMON XE for IMS on z/OS 17
IntroducingIBM Tivoli OMEGAMON XE for IMS
on z/OS
OverviewThis chapter introduces Tivoli OMEGAMON XE for IMS. It also explains what Tivoli OMEGAMON XE for IMS is, what it does, and how it can help you monitor, analyze, and manage your IMS systems, either at a system level or within an IMSplex.
Chapter contentsTivoli OMEGAMON XE for IMS Description. . . . . . . . . . . . . . . . . . . . . . . . . . . . . . . . . . . . . . . 18Key Features. . . . . . . . . . . . . . . . . . . . . . . . . . . . . . . . . . . . . . . . . . . . . . . . . . . . . . . . . . . . . . . 21
1

Tivoli OMEGAMON XE for IMS Description
18 Using IBM Tivoli OMEGAMON XE for IMS on z/OS, Version 3.1.0
Tivoli OMEGAMON XE for IMS Description
BackgroundTivoli OMEGAMON XE for IMS is a member of the latest generation of OMEGAMON family of mainframe monitoring products. It enables you to monitor and manage the availability, performance, and resource utilization of your IMS systems, either at a system level or within an IMSplex. The intuitive browser interface enables you to clearly see and understand application and system events.
Tivoli OMEGAMON XE for IMS allows you to
� Proactively manage performance and availability of IBM IMS systems from a single, integrated interface
� Track and optimize both resource usage and transaction processing
� View coupling facility statistics to identify factors affecting the performance of IBM IMSplex environments
� Use shared queue support to monitor workload balancing and use data sharing support to minimize the impact of locks on shared databases
� Integrate information from IBM Tivoli OMEGAMON XE monitors across multiple platforms and third-party software into a single view
Tivoli OMEGAMON XE for IMS also acts as a powerful analytic interface to classic OMEGAMON and OMEGAMON II for IMS monitoring products. Used in conjunction with other OMEGAMON XE monitoring products, the data, analyses, and alerts presented by Tivoli OMEGAMON XE for IMS help you develop a holistic view of your entire computing enterprise from a single console.
Benefits of using Tivoli OMEGAMON XE for IMSTivoli OMEGAMON XE for IMS provides these benefits:
� Increases knowledge�with extensive reporting capabilities that provide real-time access to reliable, up-to-the-minute data. Thus, you can make faster, better-informed operating decisions.
� Enhances system performance�by letting you integrate, monitor, and manage your system, environment, console, and mission-critical applications. For example, Tivoli OMEGAMON XE for IMS can alert you when conditions in your environment meet or exceed the thresholds you set. These alerts notify your system administrator to limit and control system traffic.
� Simplifies application and system management�by managing applications, platforms, and resources across your system.
� Enhances efficiency�by monitoring diverse platforms and networks from a single PC screen. Depending on your CandleNet Portal configuration, you can collect and monitor data across a variety of plaforms. Tivoli OMEGAMON XE for IMS helps you gather and monitor the consistent, accurate, and timely information you need to effectively perform your job.
Introducing IBM Tivoli OMEGAMON XE for IMS on z/OS 19
Tivoli OMEGAMON XE for IMS Description
How Tivoli OMEGAMON XE for IMS helps youTivoli OMEGAMON XE for IMS enables you to
� pinpoint issues before they become disruptive or crippling
� identify trouble areas, determine the cause of the problem, and decide what corrective action to take
� detect outages and performance degradations and take automated recovery actions
� support the evolution of applications and processes in your environment
� analyze historical trends
Used in conjunction with other IBM products, the views, analyses, and reports presented by Tivoli OMEGAMON XE for IMS help you develop a holistic view of performance within your IMS environment.
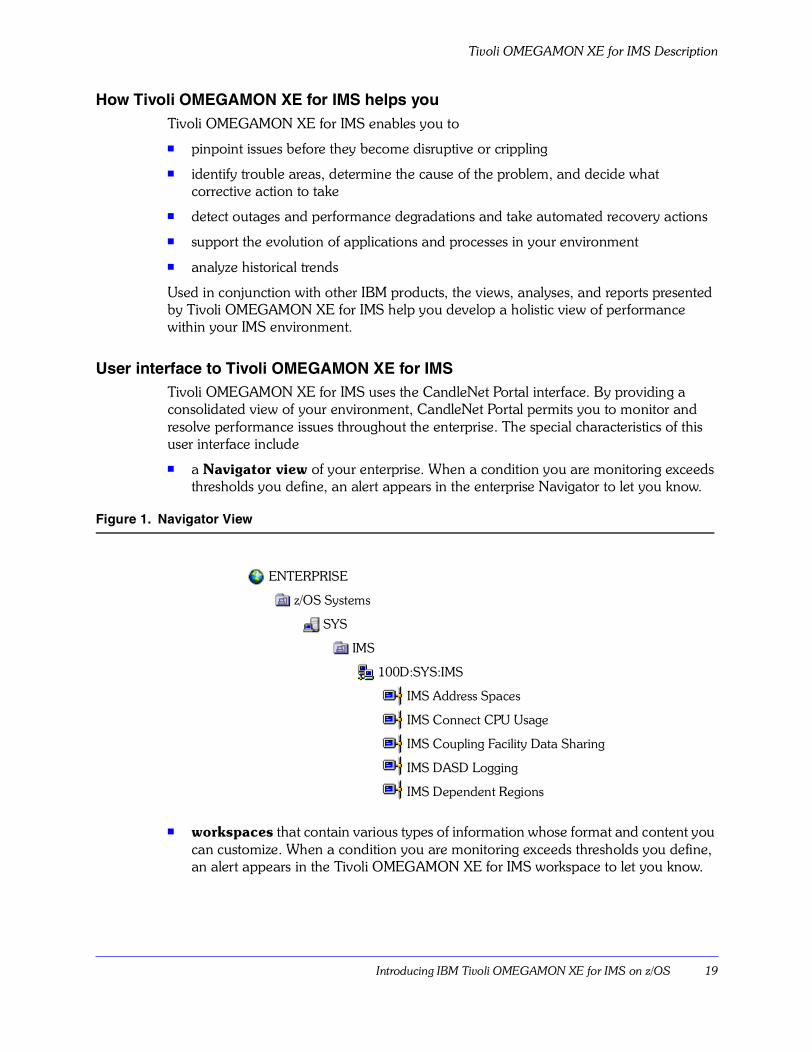
User interface to Tivoli OMEGAMON XE for IMSTivoli OMEGAMON XE for IMS uses the CandleNet Portal interface. By providing a consolidated view of your environment, CandleNet Portal permits you to monitor and resolve performance issues throughout the enterprise. The special characteristics of this user interface include
� a Navigator view of your enterprise. When a condition you are monitoring exceeds thresholds you define, an alert appears in the enterprise Navigator to let you know.
Figure 1. Navigator View
� workspaces that contain various types of information whose format and content you can customize. When a condition you are monitoring exceeds thresholds you define, an alert appears in the Tivoli OMEGAMON XE for IMS workspace to let you know.
ENTERPRISE
z/OS Systems
SYS
IMS
100D:SYS:IMS
IMS Address Spaces
IMS Connect CPU Usage
IMS Coupling Facility Data Sharing
IMS DASD Logging
IMS Dependent Regions

Tivoli OMEGAMON XE for IMS Description
20 Using IBM Tivoli OMEGAMON XE for IMS on z/OS, Version 3.1.0
Figure 2. Example Attributes in a Table
� attributes you can use to create situations that monitor areas of particular interest and issue alerts when specified conditions are met.
� predefined situations you can use as shipped to begin monitoring immediately, or modify to monitor your specific environment.
IMS ID Job Name Type Swapped Out CPU TIme
191C IMS910CC Control No 12.71
191C IMS910CD DL/I_SAS No 10.54
191C IMS910CB DBRC No 0.17
191C IMS9CMSI IRLM No 6.74
191C IMS9CFPI Message No 0.03
Introducing IBM Tivoli OMEGAMON XE for IMS on z/OS 21
Key Features
Key Features
Java™-based graphical interfaceTivoli OMEGAMON XE for IMS is one of a suite of zSeries products that use the CandleNet Portal interface. The interface includes:
� browser- or desktop-based access to data
� tabular and chart views of data
� ability to create alerts using logic rather than just thresholds
� ability see alerts and associated information from the same interface
� reflex automation capabilities
� expert advice for problem conditions
� built-in TN3270
With OMEGAMON DE views can be expanded to display business-critical information, such as application overviews, service availability, or statistics by geography, and give you the ability integrate monitoring and alerts with information from other systems and subsystems on multiple platforms.
AttributesTivoli OMEGAMON XE for IMS gathers data on the managed systems of your network and stores the data as system elements called attributes. You can use these attributes to
� build situations to monitor the performance of the managed systems you are concerned with
� create queries and use the resulting data to build custom views
Related attributes are grouped into attribute groups, or attribute tables. A given table view contains information provided by a single attribute group.
To use attributes effectively, you must first understand their structure.
� An attribute group associates attributes that refer to some unique characteristic of the data being stored.
� An attribute item stores data for a single property of an attribute group.
� The name of each attribute is composed of the attribute�s group name, then a period, then the name of the attribute item.
For example, in the attribute
TRANSACTIONS.Max_Region
Max_Region is an attribute item that indicates the maximum number of regions allowed scheduled for the subject IMS transaction. Attribute item Max_Region is a member of the TRANSACTIONS group.

Key Features
22 Using IBM Tivoli OMEGAMON XE for IMS on z/OS, Version 3.1.0
You use attributes to create situations that monitor the state of your operating system, database, or application. A situation describes a condition you want to test. When you start a situation, CandleNet Portal compares the values you have assigned for the situation�s attributes with the values collected by Tivoli OMEGAMON XE for IMS and registers an event if the condition is met. You are alerted to events by indicator icons that appear in the Navigator.
Chart and table views use queries to specify which attribute values to request from a monitoring agent. You can use the Query editor to create a new query, modify an existing one, or apply filters and set styles to define the content and appearance of a view based on an existing query.
For more information about these attributes, see the Tivoli OMEGAMON XE for IMS section of the CandleNet Portal online help.
Predefined workspaces and viewsThe heart of the CandleNet Portal display are its workspaces, which provide access to the collected data. Tivoli OMEGAMON XE for IMS provides two sets of predefined workspaces. In these workspaces, status, configuration, and statistical information collected by Tivoli OMEGAMON XE for IMS is displayed in tabular and graphical views. Each workspace or set of related workspaces target a specific area.
The IMSplex-level views in these workspaces provide data on IMSplex features, such as
� coupling facility structures
� global locks
� shared queues
The system-level workspaces provide data on IMS system features, such as
� CPU usage
� device activity
� Fast Path environment status
� multiple systems coupling physical and logical links
� Overflow Sequential Access Method (OSAM) statistics
� pool storage and buffer pool metrics
� Response Time Analysis data
� startup parameter details
� Virtual Storage Access Method (VSAM) activity measures
You can use the information provided by these workspaces to manage the performance and availability of systems and their resources, to identify potential problems, to trace the causes of alerts or exceptions, to make tuning and resource distribution decisions, and to identify particular conditions you want to monitor.
For information on locating and navigating Tivoli OMEGAMON XE for IMS workspaces, see �Using the Predefined Workspaces� on page 26. For a complete list and descriptions
Introducing IBM Tivoli OMEGAMON XE for IMS on z/OS 23
Key Features
of the predefined workspaces, see the Tivoli OMEGAMON XE for IMS section of the CandleNet Portal online help. For information about creating and customizing views and workspaces, see the CandleNet Portal online help.
Predefined monitoring situationsSituations are descriptions of conditions to which you want to be alerted. When situations are distributed to monitored systems they can, for example, issue a message when a queue count is greater than or equal to 100 messages. Tivoli OMEGAMON XE for IMS provides a set of predefined situations designed to enable you to monitor critical activity and to serve as templates for creating customized situations of your own.
For details on the predefined situations that come with this product, see the Tivoli OMEGAMON XE for IMS section of the CandleNet Portal online help. For information on creating, editing, and distributing situations, see the CandleNet Portal online help.
Take Action commandsTivoli OMEGAMON XE for IMS permits you to define and use Take Action commands and to stop and start processes from within CandleNet Portal. You can add a Take Action view to a workspace. You can send an action you have defined or you can enter a command manually through the Command field. For more information about Take Action, see the CandleNet Portal online help.
Terminal viewWhen researching the cause of an alert, you might want to review conditions raised by an OMEGAMON II product. To access an OMEGAMON II host session, use the terminal emulator adapter feature of CandleNet Portal.
The terminal emulator adapter turns a view into a 3270 interface so you can connect to any z/OS host system using TCP/IP. The terminal emulator adaptor provides for simple terminal emulation. It also provides a scripting language interface that:
� Permits you to record (capture) a host session. As you interact with a host session, the session is recorded as a set of script commands that can be saved under a name you specify and played back at a later time. This allows you to automate navigation to a specific set of screens.
� Permits you to author entire complex scripts containing custom functions for manipulating host sessions.
Historical data collectionIn addition to providing real time performance and availability data, Tivoli OMEGAMON XE for IMS also lets you to collect data over extended periods of time. By studying the information gathered from a historical perspective, you can, for example, identify trends and determine whether current performance is typical or exceptional, or evaluate the effect of tuning decisions. The historical data collection function permits you to specify
� the interval at which data is to be collected

Key Features
24 Using IBM Tivoli OMEGAMON XE for IMS on z/OS, Version 3.1.0
� the interval at which data is to be warehoused (if you choose to do so)
� the location (either at the agent or at the Candle Management Server) at which the collected data is to be stored
You can view the historical data collected by Tivoli OMEGAMON XE for IMS in CandleNet Portal workspaces or in reports generated by third-party reporting tools.
For more information about historical data collection for Tivoli OMEGAMON XE for IMS, see �Using Historical Data Collection and Reporting� on page 35, the CandleNet Portal online help, and Historical Data Collection Guide for OMEGAMON XE Products.

Using and Customizing Tivoli OMEGAMON XE for IMS 25
Using and CustomizingTivoli OMEGAMON XE for IMS
OverviewThis chapter is intended to familiarize you with the monitoring resources provided by Tivoli OMEGAMON XE for IMS and to help you customize them to suit your specific requirements. The chapter describes how to
� use and customize predefined workspaces that report IMSplex- and system-level data
� activate and customize predefined situations to enable alerts and reflex actions
� use CandleNet Portal to investigate and respond to reported events in your IMS systems
� configure historical data reporting
� find more detailed information on workspaces, attributes, and situations.
The information on the organization and use of the workspaces interests most Tivoli OMEGAMON XE for IMS users. The information on activating and modifying situations and configuring historical data collection interests users with administrative authorities who are responsible for setting up and customizing monitoring and alerts.
Chapter contentsUsing the Predefined Workspaces . . . . . . . . . . . . . . . . . . . . . . . . . . . . . . . . . . . . . . . . 26Using the Predefined Situations . . . . . . . . . . . . . . . . . . . . . . . . . . . . . . . . . . . . . . . . . 29Investigating an Event. . . . . . . . . . . . . . . . . . . . . . . . . . . . . . . . . . . . . . . . . . . . . . . . . 32Using Historical Data Collection and Reporting . . . . . . . . . . . . . . . . . . . . . . . . . . . . . 35Finding More Information. . . . . . . . . . . . . . . . . . . . . . . . . . . . . . . . . . . . . . . . . . . . . . 38
2

Using the Predefined Workspaces
26 Using IBM Tivoli OMEGAMON XE for IMS on z/OS, Version 3.1.0
Using the Predefined Workspaces
About the workspacesTivoli OMEGAMON XE for z/OS ships with two categories of predefined workspaces: IMSplex-level workspaces and system-level workspaces. The IMSplex-level workspaces display information associated with data sharing groups and shared queues groups. The system-level workspaces report data on a rich variety of key resources for each IMS subsystem.
Workspaces are accessed either directly from the physical Navigator or through links from other workspaces. In the Navigator, the IMSplex workspaces are listed under either the data sharing group or the shared queues group for each monitored IMSplex, while the system workspaces are listed under each item representing an IMS system.
Most of the predefined workspaces are capable of reporting historical data. However, you must configure and start historical data collection in order for historical data to be available for reporting. (For more information on configuring data collection and prerequisites for historical data reporting, see �Using Historical Data Collection and Reporting� on page 35.)
IMSplex-level and system-level managed system namesFrom the standpoint of Tivoli OMEGAMON XE for IMS, IMSplexes and systems are managed systems. In the CandleNet Portal Navigator, managed systems are identified by managed system names.
IMSplex managed system names take the form
GROUPNAME:PLEXNAME:TYPE
where GROUPNAME is the name of the data sharing or shared queues group, PLEXNAME is the name of the sysplex, and TYPE is either DSGROUP for data sharing group or SQGROUP for shared queues group.
(for example, DFS181G:LPAR400J:SQGROUP)
System managed system names take the form
IMSID:SMFID:IMS
where IMSID is the identifier of the IMS subsystem, SMFID is the SMF identifier for the LPAR being monitored, and IMS indicates that this is a managed IMS system.
(for example, 181A:SYS:IMS)
The physical Navigator view of the CandleNet Portal shows an enterprise as a mapping of platforms, systems, agents, subagents, and monitored resources. Below each IMSplex name are items for the IMSplex-level resources and components and an item for every data sharing and shared queues group being monitored by a Tivoli OMEGAMON XE for IMS agent. Under each system (or MVS� logical partition) are items for each of the IMS system level resources being monitored by a Tivoli OMEGAMON XE agent. Each navigator item can be associated with one or more workspaces that provide information relevant to that level of the navigator.

Using and Customizing Tivoli OMEGAMON XE for IMS 27
Using the Predefined Workspaces
IMSplex-level workspaces
Each entry below an IMSplex in the Navigator tree is associated with one or more workspaces that report information on resources shared by the IMSplex or IMSplex workloads. Each entry has a default workspace, which opens when you select the item, and which can have other associated workspaces you can access through links in table views in the default workspace.
For example, the default workspace for each IMSplex managed system entry is an IMSplex Level Overview workspace, which provides summary data for the selected IMSplex. From this workspace, you can link to a variety of related workspaces. The default workspace for the Shared Transaction Queue Summaries entry is the Shared Transaction Queue Summaries workspace, which displays information for all the groups in the IMSplex. From this workspace you can link to a workspace that displays details for a selected queue.
System level workspaces
Beneath each system item in the Navigator tree is an item for each type of resource being monitored by a Tivoli OMEGAMON XE agent. For example, if you have installed both Tivoli OMEGAMON XE for IMS and Tivoli OMEGAMON XE for Storage, you will see entries for IMS and for Storage Subsystem.
When you expand IMS, you will see the managed system name of the system or LPAR monitored by Tivoli OMEGAMON XE for IMS:
When you expand the managed system entry, the workspaces that provide information about that system are listed:
DFS181G:LPAR400J:SQGROUP Sysplex Level Overview Workspace
Coupling Facility Shared Queue Structures Coupling Facility Shared Queue Structures Workspace
Shared Transaction Queue Summaries Shared Transaction Queue Summaries Workspace
. . .
Shared Cold Queues Summary Shared Cold Queues Summary Workspace
SYS system name
IMS managed system type (agent)
Storage Subsystem managed system type (agent)
SYS system name
IMS managed system type (agent)
181A:SYS:IMS managed system name
181A:SYS:IMS managed system name
IMS Address Spaces system workspace
IMS Connect CPU Usage system workspace
IMS Coupling Facility Data Sharing Status system workspace

Using the Predefined Workspaces
28 Using IBM Tivoli OMEGAMON XE for IMS on z/OS, Version 3.1.0
As with the IMSplex-level entries, every entry under the system name is associated with one or more workspaces. Each entry has a default workspace, which opens when you select the entry, and which can have other related workspaces you can access through links in table views in the workspace.
Customizing workspacesYou can modify the predefined workspaces in a number of ways. You can:
� add, delete, or modify views
� modify queries
� apply thresholds or filters
� change the appearance of tables and charts
� add links to other workspaces, or make a workspace accessible using a URL
Note: To change a workspace, create a copy of the original and modify the copy, then save it with a new name.
You can also choose a particular workspace as your home workspace, just as you might set a home page for your web browser. For example, you might want to set the IMSplex Enterprise Overview workspace as your home workspace, the one you see first when you log on to CandleNet Portal.
In using and modifying workspaces, it is important to understand how workspaces are populated with data, and the impact queries might have on processing and performance.
If you have OMEGAMON DE on z/OS, you can create workspaces that include both mainframe and distributed sites, applications, and business processes.
Finding more information about workspacesFor descriptions of the predefined workspaces, the views they contain, and the attribute groups on which they are based, see Workspaces in the Tivoli OMEGAMON XE for IMS section of the CandleNet Portal online Help.
For more information about customizing workspaces, see Using OMEGAMON Products: CandleNet Portal and the CandleNet Portal online Help.
Using and Customizing Tivoli OMEGAMON XE for IMS 29
Using the Predefined Situations
Using the Predefined Situations
About the situationsTo help you begin monitoring quickly, Tivoli OMEGAMON XE for IMS provides a number of predefined situations. These situations monitor for conditions that are typically considered to be problematic or noteworthy and trigger Critical or Warning event indicators in the Navigator when those conditions occur.
Some situations are shipped with very high or very low values. Examine these situations and customize them with values that are meaningful for your system management requirements.
Activating predefined situationsPredefined situations shipped with Tivoli OMEGAMON XE for IMS are not set to autostart. You must activate these situations before they can begin monitoring.
To activate a situation you use the Situation editor of the CandleNet Portal to
1. Distribute (assign) the situation to one or more managed systems or managed system lists.
2. Start the situation.You do not need to associate predefined situations with Navigator items. Each situation is already associated with an appropriate Navigator item. When you distribute a situation, you will see its name listed under the name of its associated item in the Situation editor.
Some situations are shipped with very high or very low values. Others have values that might be inconsistent with your site�s policies, goals, or monitoring requirements. Examine the predefined situations and customize them with values that are meaningful for your installation before you activate them.
Distributing situations
You distribute situations using the CandleNet Portal Situation editor. You can access the Situation editor from the toolbar or by right-clicking an item in the Navigator and
selecting Situations from the pop-up menu.
Distribute only the situations that you are going to autostart or plan to manually enable. If you distribute all the situations, they will be propagated to the agents when the Candle Management Server starts. This can simplify any subsequent activation procedures, but it extends startup time. Review the situations to determine which ones you plan to use and add distribution lists for only those situations. Once the situations are distributed, their alerts will appear on the Navigator items they are associated with.
To distribute a situation:
1. If necessary, use the Situation Filter to view the situations available for distribution. Check Eligible for Association to see a list of all the situations which are written for this type of managed system (z/OS IMSplex or z/OS System, depending on where you access

Using the Predefined Situations
30 Using IBM Tivoli OMEGAMON XE for IMS on z/OS, Version 3.1.0
the Situation editor from; if you access the editor from the toolbar, you will see situations for all types of managed systems).
Any undistributed situations will show their icon partially dimmed .
2. Select (click) the situation you want to distribute.The Situation editor displays the Condition tab for the situation.
3. Select the Distribution tab.
The available managed systems and managed systems lists are displayed.
4. Select the systems and lists to which you want to distribute the situation, then click the left arrow to assign the situations to the systems or system lists.
5. Click Apply to save and implement the change and continue editing; click OK to apply and save the change and close the Situation editor.
Starting situations
Some situations you might want to run for a limited time or only under specific conditions. Start and stop these situations manually. Other situations you might want to run continuously. Set these situations to run at Candle Management Server startup, so they run across Candle Management Server restarts.
Initially, you might want to start situations manually to evaluate the impact of the monitoring and monitoring interval on system performance, adjust them accordingly, then decide if you want the situation to run indefinitely, across Candle Management Server restarts.
To start a situation, right-click on the situation name in the Situation editor tree and select Start from the pop-up menu.
To set a situation to start automatically when the Candle Management Server starts:
1. Select (click) the name of the situation in the Situation editor tree.
2. The settings for the situation are displayed in the righthand frame of the editor.
3. On the Conditions tab, check Run at startup.
4. Click Apply to save and implement the change and continue editing; click OK to apply and save the change and close the Situation editor.
Modifying predefined situationsBefore activating any predefined situations, examine the conditions and values they monitor and, if necessary, adjust them to ones better suited to your environment.
To edit a situation, open the Situation editor from the toolbar, or by right-clicking a Navigator entry and selecting Situations from the pop-up menu.
Use the Situation Filter to view the situations. If necessary, check Associated with Monitored Application to see all situations that were written for this type of agent, regardless of where they are distributed.
Using and Customizing Tivoli OMEGAMON XE for IMS 31
Using the Predefined Situations
Note: If you decide to make changes to a predefined situation, create a copy of the situation (Create Another) and rename and modify the copy. Otherwise, the changes you make will be overwritten the next time the product is updated.
Finding more information about situationsYou can find descriptions of all the predefined situations shipped with Tivoli OMEGAMON XE for IMS, including definitions, by selecting Situations in the Tivoli OMEGAMON XE for IMS section of the CandleNet Portal online Help.
You can find more information on creating and modifying situations in Using OMEGAMON Products: CandleNet Portal and in the CandleNet Portal online Help.

Investigating an Event
32 Using IBM Tivoli OMEGAMON XE for IMS on z/OS, Version 3.1.0
Investigating an Event
Navigating the workspacesTypically, OMEGAMON XE products use multiple monitoring agents, one on each managed system. In the CandleNet Portal Navigator tree, each agent is represented with a subnode under its host system. Its associated workspaces are listed below, identified by attribute group:
Event indicator and event workspaceWhen the conditions of a situation have been met, the situation evaluates True, causing an event indicator to appear in the Navigator. You can investigate the cause of an event by opening its workspace.
The event workspace shows two table views, one with the values of the attributes when the situation evaluated True, and the other with the attributes� current values.
The event workspace can also display a view with any expert advice written by the situation's author. The advice will display as Web text and any links you have defined will be active, or, if the expert advice consisted only of a link to a specific Web page of advice, that Web page is displayed. The Take Action view also displays in the event workspace so you can send a command to the application started on that system.
The following Navigator example displays raised event indicators: red indicators for critical conditions and yellow indicators for warnings. If both a warning and a critical condition occur for the same workspace, the indicator always shows the highest level alert.
Enterprise
Operating platform
System
Agent
Attribute group
Attribute group
Agent
System
Agent

Using and Customizing Tivoli OMEGAMON XE for IMS 33
Investigating an Event
Figure 3. Navigator Item for an Event Workspace
When you see an alert icon overlaying a Navigator icon, open the Event workspace and drill down to investigate the cause of the alert.
Figure 4. Event Workspace
Looking at this workspace, you can determine the situation that raised the event and the attributes whose values are contributing to the alert. You can also review available advice and take appropriate actions.
ENTERPRISE
z/OS Systems
SYS
IMS
100D:SYS:IMS
IMS Address Spaces
IMS Connect CPU Usage
IMS Coupling Facility Data Sharing
IMS DASD Logging
IMS Dependent Regions

Investigating an Event
34 Using IBM Tivoli OMEGAMON XE for IMS on z/OS, Version 3.1.0
AcknowledgmentWhen you see an event indicator in the Navigator, you can create an acknowledgment. An acknowledgment notifies other users that you have taken ownership of the problem related to the event and are working on it. When you acknowledge an event, a blue checkmark appears next to the situation in the event flyover list and, if you opened the event workspace, over the situation item in the Navigator. If the situation is still true when the acknowledgment expires, the indicator changes accordingly. You can also cancel the acknowledgment before it has expired. This changes the indicator so that users can see that the acknowledgment has been removed even though the situation remains true.
Using and Customizing Tivoli OMEGAMON XE for IMS 35
Using Historical Data Collection and Reporting
Using Historical Data Collection and Reporting
About historical data collection and reportingIn addition to monitoring real-time data, Tivoli OMEGAMON XE for IMS can log data to binary datasets so you can examine data for longer periods of time.
You can view the logged historical data in CandleNet Portal workspaces. Table and chart views for which historical data collection has been enabled have a tool for setting a time span, which allows you to see previously collected data samples for up to 24 hours. If you have configured data warehousing, you can view samples for longer periods of time.
In order for historical data to be available in workspaces, you must configure and start historical data collection for the appropriate attribute groups. See the two sections that follow for information about configuring and starting historical data collection.
You can also export the logged historical data to delimited flat files for use with third-party reporting tools to produce trend analysis reports and graphics. Data warehoused to the Candle Data Warehouse, a relational database, can be used to produce customized history reports.
Datasets for storing historical data must have been allocated in the persistent data store (CT/PDS) and maintenance of the CT/PDS must have been configured as part of the configuration of the Candle Management Server in each address space. To warehouse data, you must have installed Microsoft SQL Server and configured your environment to include the Warehouse Proxy agent and Candle Data Warehouse (historical database).
Configuring historical data collectionConfigure historical data collection using the CandleNet Portal History Collection Configuration window. (You can also use the History Configuration program in the Candle Management Workstation.)
Configuration is done on an attribute group by attribute group basis. You can configure collection for different attribute groups at different intervals so important volatile data can be collected faster while less dynamic data can be collected is collected less frequently.
Not all attribute groups can collect historical data. This is because collecting history data for these attribute groups is not appropriate or has a detrimental effect on performance. For example, collection might generate unmanageable amounts of data. Only those attribute groups for which data can be collected are listed in the Configuraiton window.
Note that for a given attribute group, the same history collection options are applied to all Candle Management Servers for which collection for that attribute group is currently enabled. You cannot specify different intervals for the same attribute group for different Candle Management Servers. In addition, note that IMS-level data can be collected either at the agent or at the Candle Management Server, but IMSplex-level data can only be collected at the Candle Management Server.
Using Historical Data Collection and Reporting
36 Using IBM Tivoli OMEGAMON XE for IMS on z/OS, Version 3.1.0
Starting and stopping data collectionYou start and stop historical data collection for individual attribute groups from the Status tab of the History Collection Configuration window.
On the Status tab, select the target Candle Management Server and Tivoli OMEGAMON XE for IMS, then the attribute group or groups for which you want to change collection status.
Requests for historical data from large tablesRequests for historical data from tables that collect a large amount of data will have a negative impact on the performance of the OMEGAMON Platform components involved. To reduce the performance impact on your system, set a longer collection interval for attribute groups (tables) that collect a large amount of data. You specify this setting from the Configuration tab of the History Collection Configuration window.
Requests for historical data from tables that collect a large amount of data will have a negative impact on the performance of the product components involved. To reduce the performance impact on your system, set a longer collection interval for tables that collect a large amount of data.
When you are viewing a report or a workspace for which you collect historical data, you can set the Time Span interval to obtain data for previous samplings. Selecting a long time span interval for the report time span increases the amount of data being processed, and might have a negative impact on performance. The program must dedicate more memory and CPU cycles to process a large volume of report data. To reduce the impact, use the shortest time span setting sufficient to provide the information you need, especially for tables that collect a large amount of data.
If the amount of information requested is too large, the report request might drop the task and return to the CandleNet Portal or Candle Management Workstation with no data because the agent took too long to process the request. However, the agent continues to process the report data to completion, and remains blocked, even though the report data is not viewable.
Also, historical report data from the Persistent Data Store might not be available. This can occur because the Persistent Data Store might be not be available while its maintenance job is running.
Finding more information about historical data collectionFor more information on configuring historical data collection and reporting in CandleNet Portal, see �Historical Reporting Overview�, �Historical Reporting�, and �Configure History Data Collection� in the CandleNet Portal online Help and Using OMEGAMON Products: CandleNet Portal.
For information on maintaining the CT/PDS, exporting historical data to flat files, and warehousing historical date, see the Historical Data Collection Guide for IBM Tivoli OMEGAMON XE Products.
Using and Customizing Tivoli OMEGAMON XE for IMS 37
Using Historical Data Collection and Reporting
For information on configuring the Candle Data Warehouse and the Warehouse proxy, see Installing and Setting up OMEGAMON Platform and CandleNet Portal on Windows and UNIX.
Finding More Information
38 Using IBM Tivoli OMEGAMON XE for IMS on z/OS, Version 3.1.0
Finding More Information
You can find detailed instructions for using CandleNet Portal in
� the CandleNet Portal online help
� these books on the OMEGAMON Platform publications CD:
� Using OMEGAMON Products: CandleNet Portal
� Administering OMEGAMON Products: CandleNet Portal
� Historical Data Collection Guide for IBM Tivoli OMEGAMON XE Products
You can find detailed information on Tivoli OMEGAMON XE for IMS workspaces, attributes, situations, and Take Action commands in the Tivoli OMEGAMON XE for IMS section of the CandleNet Portal online help.
For information about messages and problem determination, see IBM Tivoli Candle Products Messages.

Monitoring IMS Systems 39
Monitoring IMS Systems
IntroductionThis chapter briefly describes the workspaces shipped with Tivoli OMEGAMON XE for IMS that allow you to monitor IMS systems.
Chapter contentsIntroducing the IMS Workspaces. . . . . . . . . . . . . . . . . . . . . . . . . . . . . . . . . . . . . . . . . 40The System-Level Workspaces . . . . . . . . . . . . . . . . . . . . . . . . . . . . . . . . . . . . . . . . . . 43
3

Introducing the IMS Workspaces
40 Using IBM Tivoli OMEGAMON XE for IMS on z/OS, Version 3.1.0
Introducing the IMS Workspaces
OverviewIn the section �Using the Predefined Workspaces� on page 26, you learned about using CandleNet Portal to work with the workspace provided by Tivoli OMEGAMON XE for IMS. This chapter describes each of the predefined workspaces and explains how you might use them to monitor your IMS environment.
Tivoli OMEGAMON XE for IMS workspacesThe following list of predefined workspaces mimics the structure of the Navigator tree.
� IMS Address Spaces� IMS Connect CPU Usage� IMS Coupling Facility Data Sharing Status
� IMS Coupling Facility Data Sharing OSAM Details
� IMS DASD Logging
� Online Log Dataset
� IMS Dependent Regions
� Single Dependent Region
� Selected PSBs
� Single Transaction Information
� IMS Device Activity
� IMS Extended Recovery Facility
� IMS External Subsystems
� Selected PSBs
� IMS Fast Path Balancing Groups
� Selected PSBs
� IMS Fast Path DEDB Activity
� IMS Fast Path MSDB Information
� MSDB Fields
� IMS Fast Path Regions
� Selected PSBs
� Single Transaction Information
� IMS Fast Path System
� IMS Fast Path VSO Data Spaces

Monitoring IMS Systems 41
Introducing the IMS Workspaces
� VSO Areas
� IMS IRLM Information
� IMS Logical Terminals
� IMS MQSeries Status
� IMS MSC - Physical Links
� IMS MSC - Logical Links
� IMS OSAM BP Statistics
� IMS OSAM BP Statistics (Delta)
� IMS OSAM Subpool Statistics
� IMS OTMA Status Extended
� IMS OTMA Tmember Status
� IMS OTMA Tpipe Status
� IMS Pools Display
� IMS Program Scheduling Blocks
� IMS Recovery Control Datasets
� IMS RTA Group Summary
� IMS RTA Item Summary
� IMS Startup Parameters
� IMS System Datasets
� Display All System Datasets
� IMS System Exceptions
� IMS System Information
� IMS Transaction Summary
� IMS Detailed Transactions
� IMS TRF Class Summary
� IMS TRF DLI Summary
� IMS VSAM Activity
� IMS VSAM/OSAM Activity
� IMS VSAM Subpool Statistics
Accessing a workspaceTivoli OMEGAMON XE for IMS provides workspaces featuring a variety of table views. You can access a workspace in several ways:
� By selecting its name from the list provided in the CandleNet Portal Navigator

Introducing the IMS Workspaces
42 Using IBM Tivoli OMEGAMON XE for IMS on z/OS, Version 3.1.0
� By right-clicking an item in the Navigator and selecting a workspace from the pop-up menu that is displayed
� By right-clicking in a column of a table view and selecting a workspace from the pop-up menu that is displayed

Monitoring IMS Systems 43
The System-Level Workspaces
The System-Level Workspaces
IntroductionThis section describes the features and components of the IMS system-level workspaces. For a description of the attributes used as column headings in a workspace�s table views, review the attribute group definitions in the Tivoli OMEGAMON XE for IMS online Help. Based on the information that these workspaces provide, you can make changes, set up situations, and verify that your changes improve performance.
IMS Address Spaces workspaceThe IMS Address Spaces workspace displays detail address space information for the IMS Control Region and its dependent regions. This workspace is comprised of three views:
� CPU Usage for TCB and SRB bar chart
� IMS Address Spaces table view
� Paging and EXCP bar chart
IMS Connect CPU Usage workspaceThe IMS Connect CPU Usage workspace allows you to observe busy TCBs and open more ports if necessary. The IMS Connect Address Space CPU Usage bar chart provides a view of the percent CPU time the TCBs consume. Each TCB represents a port that is used by IMS Connect to receive messages over TCP/IP. The relative CPU consumption of each TCB can be used as an indicator for load balancing TCP/IP traffic across multiple ports. This workspace is comprised of two views:
� IMS Connect Address Space CPU Usage bar chart
� IMS Connect CPU Usage table view
IMS Coupling Facility Data Sharing Status workspaceThe IMS Coupling Facility Data Sharing Status workspace shows detailed information about data sharing status, buffer counts, queues, and structure size for the data sharing group you choose. Up to 32 individual IMS systems in the IMSplex attach to the Coupling Facility through the OSAM and VSAM structures. These Coupling Facility structures have information on the connections and the shared data. Buffer status and connection information is found in the IMS control blocks. Use the workspace to verify that Data Sharing is active, view the number of buffers cached in the Coupling Facility and the number for which data sharing is implemented, and determine the structure size required. The table view shows detailed information about data sharing status, buffer counts, queues, and structure size for the data sharing group.
This workspace is comprised of two views:
� Global Data Sharing Buffers bar chart
� Coupling Facility Data Sharing Status table view

The System-Level Workspaces
44 Using IBM Tivoli OMEGAMON XE for IMS on z/OS, Version 3.1.0
IMS Coupling Facility Data Sharing OSAM DetailsThe CF Data Sharing OSAM Details workspace displays a global view of the data sharing OSAM structures. The OSAM cache structures are used to implement IMS database buffer invalidation. When a data sharing buffer is changed by one of its applications, IMS issues a buffer invalidate call to the Coupling Facility. IMS is notified that its local copy of the data sharing buffer is not valid and must be reacquired. Use the CF Data Sharing OSAM Details table view to:
� determine the Coupling Facility capacities
� monitor the number of requests waiting for the Coupling Facility
� observe the number of blocks not written to the Coupling Facility cache structure
� determine if many blocks read are cached, but never updated
� observe the number of successful buffer invalidate calls that tell the Coupling Facility to notify connectors that their local buffers must be refreshed
� determine whether a change needs to be made to the cache structure size or memory needs to be added to the Coupling Facility
IMS DASD Logging workspaceThe IMS DASD Logging workspace displays DASD logging environment data. This workspace is comprised of two views:
� Online Log Dataset Information table view
� Write Ahead Dataset Information table view
In addition, the Online Logging Datasets (OLDS) workspace displays information about the OLDS datasets. This workspace is comprised of a single view, the IMS OLDS Status table view.
IMS Dependent RegionsThe IMS Dependent Regions workspace displays status information for dependent regions, including BMP checkpoint counts, database calls, locks held count, and message inserts. This workspace is comprised of two views:
� Dependent Region Counters bar chart
� IMS Dependent Regions table view
The Single Dependent Region workspace, available through a link on the IMS Dependent Regions table view, displays status information for the selected dependent region. Additional data is also available in the Single Dependent Region, Selected PSBs, and Single Transaction Information workspaces.
IMS Device Activity workspaceThe IMS Device Activity workspace displays information about each active device in the system for the subject IMS subsystem. This workspace is comprised of a single view, the IMS Device Activity table view.
Monitoring IMS Systems 45
The System-Level Workspaces
IMS Extended Recovery FacilityThe IMS Extended Recovery Facility workspace displays definitions and the status of extended recovery (if defined). This workspace is comprised of four views:
� Surveillance Timeout Period bar chart
� Surveillance Interval Times bar chart
� Extended Recovery - Common table view
� Surveillance Information table view
IMS External SubsystemsThe IMS External Subsystems workspace displays status information on DB2® external subsystems. This workspace is comprised of two views:
� DB2 Connection Summary table view
� External Subsystems table view
IMS Fast Path Balancing GroupsThe IMS Fast Path Balancing Groups workspace displays status information and database and message counters for the Fast Path balancing groups. This workspace is comprised of two views:
� Database and Message Counters bar chart
� Fast Path Balancing Groups table view
IMS Fast Path DEDB ActivityThe IMS Fast Path DEDB Activity workspace displays status information for the Fast Path data entry databases. This workspace is comprised of three views:
� HSSP Buffer Utilization bar chart
� CI Counters bar chart
� Fast Path Data Entry Databases table view
IMS Fast Path MSDB InformationThe IMS Fast Path MSDB workspace displays status information and statistics associated with Fast Path main storage database (MSDB) activity. This workspace is comprised of three fields:
� Real Storage Page Count bar chart
� MSDB Calls bar chart
� Main Storage Databases table view
The MSDB Fields workspace, available through a link on the Main Storage Databases table view, displays definitions and status information associated with the selected main

The System-Level Workspaces
46 Using IBM Tivoli OMEGAMON XE for IMS on z/OS, Version 3.1.0
storage database. You can display definitions and status information associated with all MSDBs by right-clicking the item on the Navigator tree.
IMS Fast Path RegionsThe IMS Fast Path Regions workspace displays the status and statistics associated with Fast Path dependent regions. This workspace is comprised of three views:
� Queue Depths bar chart
� Buffers Waiting for Output Threads bar chart
� Fast Path Regions table view
Data for specific fast path regions is available through links on the Fast Path Regions table view.
IMS Fast Path SystemThe IMS Fast Path System workspace displays the overall status of the Fast Path environment. This workspace is comprised of three views:
� Balancing Groups table view
� Output Threads table view
� Fast Path System Information table view
Data for specific fast path regions is available through links on the Fast Path System Information table view.
IMS Fast Path VSO Data SpacesThe IMS Fast Path VSO Dataspaces workspace displays definitions and activity for Fast Path VSO dataspaces. This workspace is comprised of three views:
� Total I/O Counts bar chart
� I/O Rates bar chart
� Fast Path VSO Data Spaces table view
The VSO Areas workspace, available through a link on the Fast Path VSO Data Spaces table view, displays definitions and activity for the selected dataspace.
IMS IRLM Information workspaceThe IMS IRLM Information workspace displays IRLM contention and coupling facility information. This workspace is comprised of three views:
� Contention Counts bar chart
� IMS IRLM Information table view
� RLE�s in Use bar chart

Monitoring IMS Systems 47
The System-Level Workspaces
IMS Logical TerminalsThe IMS Logical Terminals workspace displays status information on logical terminals. This workspace is comprised of two views:
� Output Queue Lengths bar chart
� Logical Terminal Information (Output Pending) table view
An additional workspace, All Logical Terminals, offers status information for all logical terminals.
IMS MQSeries StatusThe IMS MQSeries Status workspace provides you with detailed MQ status information for a specific IMS subsystem. You can sort and filter information in the IMS MQSeries Status workspace to change the way you see information. Use the IMS MQSeries Status Detail table view to view status information about the connection between an IMS and an external MQ subsystem and to track MQ status over a period of time.
IMS Multiple Systems Coupling
Overview
These workspaces provide you with detailed link information about your physical and logical links. Using the IMS Multiple Systems Coupling workspaces you can:
� evaluate and analyze your physical and logical links
� monitor the link status and queue counts of your physical and logical links
� identify logical links for a physical link
� identify links that are slow or not processing
� track multiple systems coupling (MSC) link activity over a period of time
IMS MSC - Physical Links
The IMS MSC - Physical workspace provides a view of MSC physical links for a specific IMS subsystem.
Use the MSC Physical display to:
� monitor the link status and queue counts of your MSC physical links
� track physical link activity over a period of time
Monitoring MSC physical links
You can use the IMS MSC - Physical workspace to monitor your MSC physical links and track link activity over a period of time. For example, you might want to monitor MSC physical links with a normal link status and a queue count greater than 100.
Access the IMS MSC - Physical workspace. Notice that, by default, the view is sorted in alphabetical order by physical link name. To see the Physical Link Status and Queue Count columns, scroll as necessary.

The System-Level Workspaces
48 Using IBM Tivoli OMEGAMON XE for IMS on z/OS, Version 3.1.0
Analyzing an MSC physical link
You can use the IMS MSC - Logical Links workspace to analyze a specific MSC physical link, and view link details for all MSC logical links assigned to the MSC physical link. For example, you might want to do a logical link analysis of a specific MSC physical link to determine if all the logical links are active.
From the IMS MSC - Physical workspace, access the IMS MSC - Logical Links workspace for a specific MSC physical link. The IMS MSC - Logical Links workspace displays the link details for all the logical links for the specified physical link. To view the link status for each logical link, scroll as necessary.
Note: You can continue your investigation of an MSC physical or logical link by using the TN3270 functionality of CNP.
MSC Logical Links
The IMS MSC - Logical Links workspace displays detailed MSC link information for all logical links assigned to a specific physical link, when selected through a link on the IMS MSC - Physical Links workspace. The IMS MSC - Logical Links workspace displays detailed MSC link information for logical links assigned to all specific physical link, when you right-click and select it from the Navigator Tree). Use the workspace to:
� identify all the logical links for a physical link
� view the status and queue counts of each logical link
IMS Node Level SummaryThe IMS Node Level Summary workspace displays IMS address space and IMS pools information. This workspace is comprised of two views:
� Address Spaces for this IMS System table view
� Pool Storage Utilization bar chart
IMS OSAM BP Statistics workspaceThe IMS OSAM BP Statistics workspace displays details and summary views of OSAM Buffer Pools. This workspace is comprised of two views:
� OSAM Buffer Pool Statistics table view
� Subpool Statistics table view
IMS OSAM BP Statistics (Delta) workspaceThe IMS OSAM BP Statistics (Delta) workspace provides a delta view of the statistics reported for OSAM Buffer Pools and its subpools. This workspace is comprised of two views:
� OSAM Buffer Pool Statistics table view
� Subpool Statistics (Delta) table view

Monitoring IMS Systems 49
The System-Level Workspaces
IMS OSAM Subpool StatisticsThe IMS OSAM Subpool Statistics workspace provides ISAM and OSAM subpool statistics. This workspace is comprised of three views:
� Delta Counters bar chart
� Total Counters bar chart
� ISAM/OSAM Subpool Statistics table view
Additional data for specific subpools is available through a link from the ISAM/OSAM Subpool Statistics table view.
IMS OTMA Status workspacesThe IMS OTMA Status workspace displays the Open Transaction Manager Access summary status of the subject IMS subsystem. This workspace is comprised of two views:
� Conversation Counts bar chart
� IMS OTMA Status table view
The IMS OTMA Tmember Status workspace features the list of owned Tmember resources, including statistics for Tpipes owned by the TMember. The IMS OTMA Tpipe Status workspace includes current static data and resource utilization for each OTMA Tpipe (thread) used by Tmembers for IMS transaction/command activity.
IMS Pools Display workspaceThe IMS Pools Display workspace displays combined pool statistics pertaining to communications, databases and programs. This workspace is comprised of three views:
� IMS Pools Display table view
� Pool Storage Sizes bar chart
� Pool Utilization bar chart
IMS Program Scheduling Blocks workspaceThe IMS Program Scheduling Blocks workspace displays details for Program Scheduling Blocks. This workspace is comprised of three views:
� IMS Program Scheduling Blocks table view
� Region Activity bar chart
� Transaction Activity bar chart
IMS Recovery Control Datasets workspaceThe IMS Recovery Control Datasets workspace indicates the status of another job reserving the RECON dataset. This workspace is comprised of a single view, the Recovery Control Datasets table view.

The System-Level Workspaces
50 Using IBM Tivoli OMEGAMON XE for IMS on z/OS, Version 3.1.0
IMS Response Time Analysis
Overview
The IMS Repsonse Time Analysis workspaces provide views of transaction response times for a specific IMS subsystem or for all IMS subsystems. Use the IMS Response Time Analysis workspaces to:
� view response times of all RTA groups for multiple IMS systems
� view response time components for each RTA group
� track response time activity over a period of time
� view response time data for RTA groups when an RTA situation evaluates to true
Response Time Analysis Group
The IMS Response Time Analysis Group Summary workspace provides a global view of transaction response times.
Monitoring transaction response times by RTA group
Suppose you want to monitor response times for a specific RTA group to ensure the R0 time for the group stays under 5 seconds. Access the RTA Group workspace. Notice that, by default, the view is sorted in alphabetical order by RTA group name. To locate the R0 Time column, scroll as necessary.
Investigating a true RTA situation
You might want to investigate the predefined situation IMS RTA Group Response Critical, which evaluates to true when:
R0 Time is greater than or equal to 5 seconds
OR
R1 Time is greater than or equal to 7 seconds
Access the IMS RTA Group Summary workspace. To see the R0 time and R1 time values, scroll as necessary. Identify the RTA groups that have an R0 time greater than or equal to 5 seconds or R1 time greater than or equal to 7 seconds.
Response Time Analysis Item Summary
The IMS Response Time Analysis Item Summary workspace displays response time details for all RTA items in a specific RTA group, when you select a link for the specific group from the IMS RTA Group Summary workspace OR for all RTA items for all groups (when you right-click and select this option from the Navigator tree.
Analyzing response time item details
You can use the RTA Item Summary workspace to analyze the response time item details for a specific RTA group that you identify on the RTA Group Summary workspace. For example, you might want to do an item analysis of a specific RTA group to identify which items in the group have an R0 time value greater than or equal to 5 seconds.
Monitoring IMS Systems 51
The System-Level Workspaces
From the Response Time Analysis Group Summary workspace, access the RTA Item Summary workspace for the RTA group. The RTA Item Summary workspace displays the response time details for all items in the RTA group. To see the R0 time values for each item, scroll to the right.
Note: You can continue your analysis of an RTA group or item by using the TN3270 functionality of CNP.
IMS Startup Parameters workspaceThe IMS Startup Parameters workspace provides you with a global view of IMS startup parameters. Details include expansion percentage and low/high thresholds of in memory buffers. This workspace is comprised of three views:
� Startup Parameters Quick View table view
� SQ Thresholds bar chart
� Startup Parameters Details table view
IMS System DatasetsThe IMS System Datasets workspace displays measures of input/output activity. This workspace is comprised of four views:
� Total I/O Counts bar chart
� Message Datasets table view
� RECON Datasets table view
� System Datasets table view
The Display All System Datasets workspace, available through a link on the System Datasets table view, provides input/output activity measures for all IMS system datasets.
IMS System Exceptions workspaceThe IMS System Exceptions workspace displays information that serve as indicators for IMS system wide exceptions. This workspace is comprised of three views:
� APPC Conversations bar chart
� IMS System Exceptions table view
� Utilization bar chart
IMS System Information workspaceThe IMS System Information workspace displays a summary of IMS system information. This workspace is comprised of three views:
� APPC Conversations bar chart
� Count of Connected Regions by Type bar chart
� IMS System Information table view

The System-Level Workspaces
52 Using IBM Tivoli OMEGAMON XE for IMS on z/OS, Version 3.1.0
Single Transaction Information workspaceThe Single Transaction Information workspace displays information for transactions by state or type. This workspace is comprised of two views:
� Enqueue/Dequeued Messages bar chart
� Transactions with Activity for IMS System table view
IMS Transaction Summary workspaceThe IMS Transaction Summary workspace displays a summary of transactions by state and type and provides links to filter detail transaction views. This workspace is comprised of three views:
� Transaction Counts bar chart
� Transaction Summary table view
� Transactions by State table view
IMS TRF Class SummaryThe Online TRF Class Summary workspace provides a specific or global view of IMS transaction profiles. This workspace provides a global view of an IMS transaction profile for a specific IMS subsystem or for all IMS subsystems. Use this workspace to:
� identify transactions that fall outside established guidelines for a transaction profile
� monitor resource utilization
� view application and code audit information
� gather information to establish transaction profiles
IMS TRF DLI SummaryThe Online TRF DLI Summary workspace provides you with a global view of DLI resource consumption. This workspace provides a global view of DLI resource consumption for a specific IMS subsystem. Use the Online TRF DLI Summary workspace to:
� view transaction DLI call profile information
� monitor transaction DLI efficiency
� identify unusual DLI activity
IMS VSAM Activity workspaceThe IMS VSAM Activity workspace displays dataset information about a VSAM database. This workspace is comprised of two views:
� IMS VSAM Activity table view
� VSAM Counters bar chart

Monitoring IMS Systems 53
The System-Level Workspaces
IMS VSAM/OSAM Activity workspaceThe IMS VSAM/OSAM Activity workspace displays VSAM/OSAM database information. This workspace is comprised of two views:
� EXCP Analysis bar chart
� IMS VSAM/OSAM Database Summary table view
IMS VSAM Subpool StatisticsThe IMS VSAM Subpool Statistics workspace displays a variety of measures associated with VSAM Subpools. This workspace is comprised of three views:
� Delta Counters bar chart
� Total Counters bar chart
� VSAM Subpools Statistics table view
Additional subpool data is available through a link on the VSAM Subpool Statistics table view.

The System-Level Workspaces
54 Using IBM Tivoli OMEGAMON XE for IMS on z/OS, Version 3.1.0

Monitoring IMSplex 55
Monitoring IMSplex
IntroductionThis chapter describes the workspaces shipped with Tivoli OMEGAMON XE for IMS that allow you to monitor IMSplex systems.
Chapter contentsIntroducing the IMSplex Workspaces . . . . . . . . . . . . . . . . . . . . . . . . . . . . . . . . . . . . . 56The Shared Queues Group Workspaces . . . . . . . . . . . . . . . . . . . . . . . . . . . . . . . . . . . 58The Data Sharing Group Workspaces . . . . . . . . . . . . . . . . . . . . . . . . . . . . . . . . . . . . . 63
4
Introducing the IMSplex Workspaces
56 Using IBM Tivoli OMEGAMON XE for IMS on z/OS, Version 3.1.0
Introducing the IMSplex Workspaces
OverviewIn the section �Using the Predefined Workspaces� on page 26, you learned about using CandleNet Portal to work with the workspace provided by Tivoli OMEGAMON XE for IMS. The IMSplex workspaces help you monitor shared queues groups and data sharing groups. This chapter describes each of the predefined workspaces and explains how you might use it to monitor your IMS environment.
Data Sharing Group workspacesThe following list of predefined workspaces mimics the structure of the Navigator tree items associated with the Data Sharing Group.
� Coupling Facility Data Sharing Structures� Global Lock Conflicts
Shared Queues Group workspacesThe following list of predefined workspaces mimics the structure of the Navigator tree items associated with the Shared Queues Group.
� Coupling Facility Shared Queues Structures
� Shared Transaction Queue Summaries
� Shared Transaction Queue Detail
� Shared Fast Path Program Queue Summaries
� Shared Fast Path Program Queue Detail
� Shared LTERM Queue Summaries
� Shared LTERM Detail Data
� Shared APPC Queue Summaries
� Shared APPC Queue TPname Summaries
� Shared OTMA Queues Summary
� Shared OTMA Queues Tpipe Summaries
� Shared Cold Queues Summary
� Shared Cold Queues Summaries for All Destinations (an alternate workspace available by right-clicking on the Shared Cold Queues Summary item)
� Shared Cold Queues - APPC Summaries
� Shared Cold Queues - LTERM Summaries
� Shared Cold Queues - OTMA Summaries
� Shared Cold Queues - Remote Summaries
� Shared Cold Queues - Transaction Summaries
Monitoring IMSplex 57
Introducing the IMSplex Workspaces
Accessing a workspaceTivoli OMEGAMON XE for IMS provides workspaces featuring a variety of table views. You can access a workspace in several ways:
� By selecting its name from the list provided in the CandleNet Portal Navigator
� By right-clicking an item in the Navigator and selecting a workspace from the pop-up menu that is displayed
� By right-clicking in a column of a table view and selecting a workspace from the pop-up menu that is displayed
The Shared Queues Group Workspaces
58 Using IBM Tivoli OMEGAMON XE for IMS on z/OS, Version 3.1.0
The Shared Queues Group Workspaces
IntroductionThis section describes the features and components of the Shared Queues Group workspaces. For a description of the attributes used as column headings in a workspace�s table views, review the attribute group definitions in the Tivoli OMEGAMON XE for IMS online Help. Based on the information that these workspaces provide, you can make changes, set up situations, and verify that your changes improve performance.
Coupling Facility Shared Queues StructuresThe Coupling Facility Shared Queues Structures workspace provides a global view of coupling facility structures for a shared queues group. Use this workspace to:
� verify the connection status of your cache and lock structures
� examine global lock contentions over a period of time as real and false contentions impact performance
� monitor lock structure utilization - view lock table entries and record list entries usage
� monitor cache structure sizes - examine usage of directory entries and data entries
� view structure data associated with a true coupling facility situation
Shared Transaction Queue Summaries workspaceThe Shared Transaction Queue Summaries workspace shows summary information for items on the transaction ready queue and transaction serial queue. Summary information includes queue counts and time stamps for the oldest and the most recent item on the given queue. This workspace is comprised of two views:
� Shared Transaction Queue Summaries bar chart, indicating queue count by queue name
� Shared Transaction Queue Summary Data table view
To display detail information for the selected queue, use the link in the table view.
Shared Transaction Queue Detail workspaceThe Shared Transaction Queue Detail workspace displays details for the queue you selected from the Shared Transaction Queue Summary Data table view. This workspace is comprised of a single view, the Shared Transaction Queue Detail for [the queue you selected] table view.
Shared Fast Path Program Queue Summaries workspaceThe Shared Fast Path Program Queue Summaries workspace shows summary information for items on the fast path program ready queue. Summary information
Monitoring IMSplex 59
The Shared Queues Group Workspaces
includes queue counts and time stamps for the oldest and the most recent item on the given queue. This workspace is comprised of two views:
� Shared Fast Path Program Queue Summaries bar chart, indicating queue count by queue name
� Shared Fast Path Program Queue Summary Data table view
To display detail information for the selected queue, use the link in the table view.
Shared Fast Path Program Queue Detail workspaceThe Shared Fast Path Program Queue Detail workspace displays details for the queue you selected from the Shared Fast Path Program Queue Summary Data table view. This workspace is comprised of a single view, the Shared Fast Path Program Queue Detail for [the queue you selected] table view.
Shared LTERM Queue Summaries workspaceThe Shared LTERM Queue Summaries workspace shows summary information for items on the LTERM ready queue. Summary information includes queue counts and time stamps for the oldest and the most recent item on the given queue. This workspace is comprised of two views:
� Shared LTERM Queue Summaries bar chart, indicating queue count by queue name
� Shared LTERM Queue Summary Data table view
To display detail information for the selected queue, use the link in the table view.
Shared LTERM Queue Detail workspaceThe Shared LTERM Queue Detail workspace displays details for the queue you selected from the Shared LTERM Queue Summary Data table view. This workspace is comprised of a single view, the Shared LTERM Queue Detail for [the queue you selected] table view.
Shared APPC Queue Summaries workspaceThe Shared APPC Queue Summaries workspace shows summary information for items on the APPC ready queue by logical (LU) name. Summary information includes queue counts and time stamps for the oldest and the most recent item for a given LU. This workspace is comprised of two views:
� Shared APPC Queues - LU Name Summaries bar chart, indicating queue count by LU name
� Shared APPC Queues - LU Name Summary Data table view
To display summary information for the selected LU by transaction program (TP) name in the Shared APPC Queue TPname Summaries workspace, use the link in the table view.

The Shared Queues Group Workspaces
60 Using IBM Tivoli OMEGAMON XE for IMS on z/OS, Version 3.1.0
Shared APPC Queue TPname Summaries workspaceThe Shared APPC Queue TPname Summaries workspace displays summary information for the selected LU by TP name. This workspace is comprised of two views:
� Shared APPC Queues - TP Name Summaries bar chart, indicating queue count by TP name
� Shared APPC Queues - TP Name Summary Data table view
To display the Shared APPC Queue TPname Summaries workspace, select the link from the Shared APPC Queue Summaries workspace, resulting in TP name summaries for the selected LU name.
In addition, you can display the Shared APPC Queue TPname Summaries workspace by right-clicking on the Shared APPC Queue Summaries item on the Navigator tree and selecting the workspace from the menu. The workspace displays TP name summaries for all LU names.
Shared OTMA Queues Summary workspaceThe Shared OTMA Queue Summaries workspace shows summary information for items on the OTMA ready queue by Tmember name. Summary information includes queue counts and time stamps for the oldest and the most recent item for a given Tmember. This workspace is comprised of two views:
� Shared OTMA Queues - Tmember Summaries bar chart, indicating queue count by Tmember name
� Shared OTMA Queues - Tmember Summary Data table view
To display summary information for the selected Tmember by Tpipe in the Shared OTMA Queues Tpipe Summaries workspace, use the link in the table view.
Shared OTMA Queues Tpipe Summaries workspaceThe Shared OTMA Queues Tpipe Summaries workspace displays summary information for the selected Tmember by Tpipe. This workspace is comprised of two views:
� Shared OTMA Queues - Tpipe Summaries bar chart, indicating queue count by Tpipe name
� Shared OTMA Queues - Tpipe Summary Data table view
To display the Shared OTMA Queue Tpipe Summaries workspace, select the link from the Shared OTMA Queues Summary workspace, resulting in Tpipe summaries for the selected Tmember.
In addition, you can display the Shared OTMA Queue Tpipe Summaries workspace by right-clicking on the Shared OTMA Queue Summaries item on the Navigator tree and selecting the workspace from the menu. The workspace displays Tpipe summaries for all Tmembers.

Monitoring IMSplex 61
The Shared Queues Group Workspaces
Shared Cold Queues Summary workspaceThe Shared Cold Queues Summary workspace shows summary information for items on the cold queue by queue type. Summary information includes queue counts and time stamps for the oldest and the most recent item for a given Queue Type. This workspace is comprised of two views:
� Shared Cold Queues - Summaries by Queue Type bar chart, indicating queue count by queue type
� Shared Cold Queues - Summary Data by Queue Type table view
To display summary information for each of the queues on the selected Queue Type, use the link in the table view. Select a queue type of transaction ready queue, transaction serial queue, or fast path program queue to display the Shared Cold Queues - Transaction Summaries workspace. Select an LTERM, Remote, APPC, or OTMA ready queue to display its summary workspace.
Shared Cold Queues - Transaction Summaries workspaceThe Shared Cold Queues - Transaction Summaries workspace displays a summary of cold queue data by transaction for the selected transaction queue type. This workspace is comprised of two views:
� Shared Cold Queues - Transaction Summaries bar chart, indicating the queue counts by queue name
� Shared Cold Queues - Transaction Summary Data table view
Shared Cold Queues - LTERM Summaries workspaceThe Shared Cold Queues - LTERM Summaries workspace displays a summary of cold queue data by LTERM for the selected LTERM queue type. This workspace is comprised of two views:
� Shared Cold Queues - LTERM Summaries bar chart, indicating the queue counts by queue name
� Shared Cold Queues - LTERM Summary Data table view
Shared Cold Queues - Remote Summaries workspaceThe Shared Cold Queues - Remote Summaries workspace displays a summary of cold queue data by msname for the selected remote queue. This workspace is comprised of two views:
� Shared Cold Queues - Remote Ready Summaries bar chart, indicating the queue counts by queue name
� Shared Cold Queues - Remote Ready Summary Data table view
The Shared Queues Group Workspaces
62 Using IBM Tivoli OMEGAMON XE for IMS on z/OS, Version 3.1.0
Shared Cold Queues - APPC Summaries workspaceThe Shared Cold Queues - APPC Summaries workspace displays a summary of cold queue data by APPC destination (network ID, luname, and tpname). This workspace is comprised of two views:
� Shared Cold Queues - APPC Ready Queue Summaries bar chart, indicating the queue counts by queue name
� Shared Cold Queues - APPC Ready Queue Summary Data table view
Shared Cold Queues - OTMA Summaries workspaceThe Shared Cold Queues - OTMA Summaries workspace displays a summary of cold queue data by OTMA destination (Tmember and Tpipe name). This workspace is comprised of two views:
� Shared Cold Queues - OTMA Ready Queue Summaries bar chart, indicating the queue counts by Tpipe name
� Shared Cold Queues - OTMA Ready Queue Summary Data table view
Shared Cold Queues Summaries for All Destinations workspaceThe Shared Cold Queues Summaries for All Destinations workspace displays a summary of cold queue data for all queues or destinations on the cold queue by queue destination: transaction, LTERM, msname, OTMA destination (Tmember and Tpipe name), or APPC destination (network ID, luname, and tpname).This workspace is comprised of two views:
� Shared Cold Queues - Summaries by Destination bar chart, indicating the queue counts by destination
� Shared Cold Queues - Summary Data by Destination table view
To display the Shared Cold Queues Summaries for All Destinations workspace, right-click on the Shared Cold Queues Summaries item on the Navigatot tree and select the workspace from the menu.
Monitoring IMSplex 63
The Data Sharing Group Workspaces
The Data Sharing Group Workspaces
IntroductionThis section describes the features and components of the Data Sharing Group workspaces. For a description of the attributes used as column headings in a workspace�s table views, review the attribute group definitions in the Tivoli OMEGAMON XE for IMS online Help. Based on the information that these workspaces provide, you can make changes, set up situations, and verify that your changes improve performance.
Coupling Facility Data Sharing StructuresThe Coupling Facility Data Sharing Structures workspace provides a global view of coupling facility structures for a data sharing group. Use this workspace to:
� verify the connection status of your shared queue structures (MSGQ and EMHQ structures)
� monitor structure sizes to prevent structure full condition and avoid overflow processing - examine list entries, data elements, and EMC utilization
� view structure data associated with a true coupling facility situation
Global Lock ConflictsThe Global Lock Conflicts workspace provides a global view of lock conflicts for an entire data sharing group. Use the Global Lock Conflicts workspace to:
� identify all BMPs, MPPs, or DBCTL threads waiting on a database lock
� identify both the owners and waiters of a database lock
� track lock processing for transactions over a period of time
� view locking data for transactions when a database lock situation evaluates to true
� view CICS® transaction data when a DBCTL thread holds a database lock
You can sort and filter information in the workspaces to change the way you see information.
Monitoring database lock activity
For example, you might want to monitor critical transactions with a lock elapsed time of greater than 10 seconds. Notice that, by default, the table view shows lock elapsed time in descending order. This makes it easy to identify the transactions with a lock elapsed time of greater than 10 seconds.
Investigating a true database lock situation
Use this table view to investigate a database lock situation, viewing locking data for one or more transactions that caused a situation to evaluate to true. You might want to investigate the predefined situation, IMS Lock Waiter Time Critical, which evaluates to true when the lock elapsed time is greater than 10 seconds and lock status is Waiter. Filter
The Data Sharing Group Workspaces
64 Using IBM Tivoli OMEGAMON XE for IMS on z/OS, Version 3.1.0
the view to show only those transactions with a lock elapsed time greater than 10 seconds. On the filtered view, identify all transactions with a Waiter lock status.
You can continue your investigation of a database lock conflict by using the Accessing OMEGAMON II feature to zoom to an OMEGAMON II host session.
Support Information 65
Support Information
If you have a problem with your IBM software, you want to resolve it quickly. This section describes the following options for obtaining support for IBM software products:
� �Searching knowledge bases� on page 65
� �Obtaining fixes� on page 66
� �Receiving weekly support updates� on page 66
� �Contacting IBM Software Support� on page 67
Searching knowledge basesYou can search the available knowledge bases to determine whether your problem was already encountered and is already documented.
Searching the information center
IBM provides extensive documentation that can be installed on your local computer or on an intranet server. You can use the search function of this information center to query conceptual information, instructions for completing tasks, and reference information.
Searching the Internet
If you cannot find an answer to your question in the information center, search the Internet for the latest, most complete information that might help you resolve your problem.
To search multiple Internet resources for your product, use the Web search topic in your information center. In the navigation frame, click Troubleshooting and support > Searching knowledge bases and select Web search. From this topic, you can search a variety of resources, including the following:
� IBM technotes
� IBM downloads
� IBM Redbooks®
� IBM developerWorks®
� Forums and newsgroups
A

66 Using IBM Tivoli OMEGAMON XE for IMS on z/OS, Version 3.1.0
Obtaining fixesA product fix might be available to resolve your problem. To determine what fixes are available for your IBM software product, follow these steps:
1. Go to the IBM Software Support Web site at (http://www.ibm.com/software/support).
2. Click Downloads and drivers in the Support topics section.
3. Select the Software category.
4. Select a product in the Sub-category list.
5. In the Find downloads and drivers by product section, select one software category from the Category list.
6. Select one product from the Sub-category list.
7. Type more search terms in the Search within results if you want to refine your search.
8. Click Search.
9. From the list of downloads returned by your search, click the name of a fix to read the description of the fix and to optionally download the fix.For more information about the types of fixes that are available, refer to the IBM Software Support Handbook at http://techsupport.services.ibm.com/guides/handbook.html.
Receiving weekly support updatesTo receive weekly e-mail notifications about fixes and other software support news, follow these steps:
1. Go to the IBM Software Support Web site at http:/www.ibm.com/software/support.
2. Click My Support in the upper right corner of the page.
3. If you have already registered for My Support, sign in and skip to the next step. If you have not registered, click register now. Complete the registration form using your e-mail address as your IBM ID and click Submit.
4. Click Edit Profile.
5. In the Products list, select Software. A second list is displayed.
6. In the second list, select a product segment, for example, Application servers. A third list is displayed.
7. In the third list, select a product sub-segment, for example, Distributed Application & Web Servers. A list of applicable products is displayed.
8. Select the products for which you want to receive updates, for example, IBM HTTP Server and WebSphere Application Server.
9. Click Add products.
10. After selecting all products that are of interest to you, click Subscribe to email on the Edit profile tab.
11. Select Please send these documents by weekly email.
Support Information 67
12. Update your e-mail address as needed.
13. In the Documents list, select Software.
14. Select the types of documents that you want to receive information about.
15. Click Update. If you experience problems with the My support feature, you can obtain help in one of the following ways:
Online: Send an e-mail message to [email protected], describing your problem.
By phone: Call 1-800-IBM-4You (1-800-426-4968).
Contacting IBM Software SupportIBM Software Support provides assistance with product defects.
Before contacting IBM Software Support, your company must have an active IBM software maintenance contract, and you must be authorized to submit problems to IBM. The type of software maintenance contract that you need depends on the type of product you have:
� For IBM distributed software products (including, but not limited to, Tivoli, Lotus®, and Rational® products, as well as DB2® and WebSphere® products that run on Windows or UNIX operating systems), enroll in Passport Advantage® in one of the following ways:
� Online: Go to the Passport Advantage Web page (http://www.lotus.com/services/passport.nsf/WebDocs/ Passport_Advantage_Home) and click How to Enroll
� By phone: For the phone number to call in your country, go to the IBM Software Support Web site at http://techsupport.services.ibm.com/guides/contacts.html and click the name of your geographic region.
� For customers with Subscription and Support (S & S) contracts, go to the Software Service Request Web site at https://techsupport.services.ibm.com/ssr/login.
� For customers with IBMLink�, CATIA, Linux�, S/390®, iSeries�, pSeries®, zSeries®, and other support agreements, go to the Support Line Web site at http://www.ibm.com/services/us/index.wss/so/its/a1000030/dt006.
� For IBM eServer� software products (including, but not limited to, DB2 and WebSphere products that run in zSeries, pSeries, and iSeries environments), you can purchase a software maintenance agreement by working directly with an IBM sales representative or an IBM Business Partner. For more information about support for eServer software products, go to the IBM Technical Support Advantage Web site at http://www.ibm.com/servers/eserver/techsupport.html.
If you are not sure what type of software maintenance contract you need, call 1-800-IBMSERV (1-800-426-7378) in the United States. From other countries, go to the contacts page of the IBM Software Support Handbook on the Web at

68 Using IBM Tivoli OMEGAMON XE for IMS on z/OS, Version 3.1.0
http://techsupport.services.ibm.com/guides/contacts.html and click the name of your geographic region for phone numbers of people who provide support for your location.
To contact IBM Software Support, follow these steps:
1. �Determining the business impact� on page 682. �Describing problems and gathering information� on page 683. �Submitting problems� on page 69
Determining the business impactWhen you report a problem to IBM, you are asked to supply a severity level. Therefore, you need to understand and assess the business impact of the problem that you are reporting. Use the following criteria:
Describing problems and gathering informationWhen explaining a problem to IBM, be as specific as possible. Include all relevant background information so that IBM Software Support specialists can help you solve the problem efficiently. To save time, know the answers to these questions:
� What software versions were you running when the problem occurred?
� Do you have logs, traces, and messages that are related to the problem symptoms? IBM Software Support is likely to ask for this information.
� Can you re-create the problem? If so, what steps were performed to re-create the problem?
� Did you make any changes to the system? For example, did you make changes to the hardware, operating system, networking software, and so on.
� Are you currently using a workaround for the problem? If so, be prepared to explain the workaround when you report the problem.
� What software versions were you running when the problem occurred?
Severity 1 The problem has a critical business impact. You are unable to use the program, resulting in a critical impact on operations. This condition requires an immediate solution.
Severity 2 The problem has a significant business impact. The program is usable, but it is severely limited.
Severity 3 The problem has some business impact. The program is usable, but less significant features (not critical to operations) are unavailable.
Severity 4 The problem has minimal business impact. The problem causes little impact on operations, or a reasonable circumvention to the problem was implemented.

Support Information 69
Submitting problemsYou can submit your problem to IBM Software Support in one of two ways:
� Online: Click Submit and track problems on the IBM Software Support site at http://www.ibm.com/software/support/probsub.html. Type your information into the appropriate problem submission form.
� By phone: For the phone number to call in your country, go to the contacts page of the IBM Software Support Handbook (http://techsupport.services.ibm.com/guides/contacts.html) and click the name of your geographic region.
If the problem you submit is for a software defect or for missing or inaccurate documentation, IBM Software Support creates an Authorized Program Analysis Report (APAR). The APAR describes the problem in detail. Whenever possible, IBM Software Support provides a workaround that you can implement until the APAR is resolved and a fix is delivered. IBM publishes resolved APARs on the Software Support Web site daily, so that other users who experience the same problem can benefit from the same resolution.

70 Using IBM Tivoli OMEGAMON XE for IMS on z/OS, Version 3.1.0

Notices 71
Notices
OverviewThis information was developed for products and services offered in the U.S.A. IBM may not offer the products, services, or features discussed in this document in other countries. Consult your local IBM representative for information on the products and services currently available in your area. Any reference to an IBM product, program, or service is not intended to state or imply that only that IBM product, program, or service may be used. Any functionally equivalent product, program, or service that does not infringe any IBM intellectual property right may be used instead. However, it is the user's responsibility to evaluate and verify the operation of any non-IBM product, program, or service.
IBM may have patents or pending patent applications covering subject matter described in this document. The furnishing of this document does not give you any license to these patents. You can send license inquiries, in writing, to:
IBM Director of LicensingIBM CorporationNorth Castle DriveArmonk, NY 10504-1785 U.S.A.
For license inquiries regarding double-byte (DBCS) information, contact the IBM Intellectual Property Department in your country or send inquiries, in writing, to:
IBM World Trade Asia CorporationLicensing2-31 Roppongi 3-chome, Minato-kuTokyo 106, Japan
The following paragraph does not apply to the United Kingdom or any other country where such provisions are inconsistent with local law:
INTERNATIONAL BUSINESS MACHINES CORPORATION PROVIDES THIS PUBLICATION "AS IS" WITHOUT WARRANTY OF ANY KIND, EITHER EXPRESS OR IMPLIED, INCLUDING, BUT NOT LIMITED TO, THE IMPLIED WARRANTIES OF NON-INFRINGEMENT, MERCHANTABILITY OR FITNESS FOR A PARTICULAR PURPOSE.
Some states do not allow disclaimer of express or implied warranties in certain transactions, therefore, this statement might not apply to you.
This information could include technical inaccuracies or typographical errors. Changes are periodically made to the information herein; these changes will be incorporated in
B

72 Using IBM Tivoli OMEGAMON XE for IMS on z/OS, Version 3.1.0
new editions of the publication. IBM may make improvements and/or changes in the product(s) and/or the program(s) described in this publication at any time without notice.
Any references in this information to non-IBM Web sites are provided for convenience only and do not in any manner serve as an endorsement of those Web sites. The materials at those Web sites are not part of the materials for this IBM product and use of those Web sites is at your own risk.
IBM may use or distribute any of the information you supply in any way it believes appropriate without incurring any obligation to you.
Licensees of this program who wish to have information about it for the purpose of enabling: (i) the exchange of information between independently created programs and other programs (including this one) and (ii) the mutual use of the information which has been exchanged, should contact:
IBM Corporation2Z4A/10111400 Burnet RoadAustin, TX 78758 U.S.A.
Such information may be available, subject to appropriate terms and conditions, including in some cases payment of a fee.
The licensed program described in this document and all licensed material available for it are provided by IBM under terms of the IBM Customer Agreement, IBM International Program License Agreement or any equivalent agreement between us.
Any performance data contained herein was determined in a controlled environment. Therefore, the results obtained in other operating environments may vary significantly. Some measurements may have been made on development-level systems and there is no guarantee that these measurements will be the same on generally available systems. Furthermore, some measurement may have been estimated through extrapolation. Actual results may vary. Users of this document should verify the applicable data for their specific environment.
Information concerning non-IBM products was obtained from the suppliers of those products, their published announcements or other publicly available sources. IBM has not tested those products and cannot confirm the accuracy of performance, compatibility or any other claims related to non-IBM products. Questions on the capabilities of non-IBM products should be addressed to the suppliers of those products.
All statements regarding IBM's future direction or intent are subject to change or withdrawal without notice, and represent goals and objectives only.
All IBM prices shown are IBM's suggested retail prices, are current and are subject to change without notice. Dealer prices may vary.
This information is for planning purposes only. The information herein is subject to change before the products described become available.
This information contains examples of data and reports used in daily business operations. To illustrate them as completely as possible, the examples include the names of individuals, companies, brands, and products. All of these names are fictitious and any
Notices 73
similarity to the names and addresses used by an actual business enterprise is entirely coincidental.
COPYRIGHT LICENSE:
This information contains sample application programs in source language, which illustrate programming techniques on various operating platforms. You may copy, modify, and distribute these sample programs in any form without payment to IBM, for the purposes of developing, using, marketing or distributing application programs conforming to the application programming interface for the operating platform for which the sample programs are written. These examples have not been thoroughly tested under all conditions. IBM, therefore, cannot guarantee or imply reliability, serviceability, or function of these programs. You may copy, modify, and distribute these sample programs in any form without payment to IBM for the purposes of developing, using, marketing, or distributing application programs conforming to IBM�s application programming interfaces.
Each copy or any portion of these sample programs or any derivative work, must include a copyright notice as follows:
© (your company name) (year). Portions of this code are derived from IBM Corp. Sample Programs. © Copyright IBM Corp. _enter the year or years_. All rights reserved.
If you are viewing this information in softcopy form, the photographs and color illustrations might not display.
TrademarksIBM, the IBM logo, AF/OPERATOR, AF/REMOTE, AIX, Candle, Candle Management Server, Candle Management Workstation, CandleNet Command Center, CandleNet Portal, CICS, Common User Access, CUA, DB2, DB2 Universal Database, developerWorks, EPILOG, ETE, eServer, IBMLink, IMS, Informix, iSeries, Lotus, OMEGACENTER, OMEGAMON, OMEGAMON II, OMEGAVIEW, OMEGAVIEW II, OS/390, Passport Advantage, pSeries, RACF, Rational, Redbooks, Tivoli, the Tivoli logo, Tivoli Enterprise Console, TME, WebSphere, z/OS, and zSeries are trademarks or registered trademarks of International Business Machines Corporation in the United States, other countries, or both.
Linux is a trademark of Linus Torvalds in the United States, other countries, or both.
Microsoft, Windows, Windows NT, and the Windows logo are trademarks of Microsoft Corporation in the United States, other countries, or both.
UNIX is a registered trademark of The Open Group in the United States and other countries.
Java and all Java-based trademarks and logos are trademarks or registered trademarks of Sun Microsystems, Inc. in the United States, other countries, or both.

74 Using IBM Tivoli OMEGAMON XE for IMS on z/OS, Version 3.1.0
Other company, product, and service names may be trademarks or service marks of others.

Index 75
Aaccessing a workspace 41, 57attributes
definition 21groups 21items 21structure 21
Bbooks
see publications 10
CCoupling Facility Data Sharing Structures workspace
63Coupling Facility Shared Queues Structures
workspace 58customer support
see Software Support 67
Ddocumentation conventions 15
Eevents 32
definition 22indicator 32
GGlobal Lock Conflicts workspace 63
Hhistorical data collection 23
IIMS Address Spaces workspace 43IMS CF Data Sharing OSAM Details workspace 44IMS Connect CPU Usage workspace 43IMS Coupling Facility Data Sharing Status workspace
43IMS DASD Logging workspace 44IMS Dependent Regions workspace 44IMS Device Activity workspace 44
IMS Extended Recovery Facility workspace 45IMS External Subsystems workspace 45IMS Fast Path Balancing Groups workspace 45IMS Fast Path DEDB Activity workspace 45IMS Fast Path MSDB Information workspace 45IMS Fast Path Regions workspace 46IMS Fast Path System workspace 46IMS Fast Path VSO Data Spaces workspace 46IMS IRLM Information workspace 46IMS Logical Terminals workspace 47IMS MQSeries Status workspace 47IMS MSC - Logical Links workspace 48IMS MSC - Physical Links workspace 47IMS Node Level Summary workspace 48IMS OSAM BP Statistics (Delta) workspace 48IMS OSAM BP Statistics workspace 48IMS OSAM Subpool Statistics workspace 49IMS OTMA Status workspace 49IMS Pools Display workspace 49IMS Program Scheduling Blocks workspace 49IMS Recovery Control Datasets workspace 49IMS RTA Group Item Summary workspace 50IMS RTA Group Summary workspace 50IMS Startup Parameters workspace 51IMS System Datasets workspace 51IMS System Exceptions workspace 51IMS System Information workspace 51IMS Transaction Summary workspace 52IMS TRF Class Summary workspace 52IMS TRF DLI Summary workspace 52IMS VSAM Activity workspace 52IMS VSAM Subpool Statistics workspace 53IMS VSAM/OSAM Activity workspace 53information centers, searching to find software
problem resolution 65
Kknowledge bases, searching to find software problem
resolution 65
Mmanuals
see publications 10
Index

76 Using IBM Tivoli OMEGAMON XE for IMS on z/OS, Version 3.1.0
Nnavigating the workspaces 32Navigator tree 32newsgroups 14
OOnline Log Dataset workspace 44online publications
accessing 13ordering publications 13
Pperformance impact
requests for historical data from large tables 36publications 10
accessing online 13ordering 13
Qqueries 22
SShared APPC Queue Summaries workspace 59Shared APPC Queue TPname Summaries
workspace 60Shared Cold Queues - APPC Summaries workspace
62Shared Cold Queues - LTERM Summaries
workspace 61Shared Cold Queues - OTMA Summaries workspace
62Shared Cold Queues - Remote Summaries
workspace 61Shared Cold Queues - Transaction Summaries
workspace 61Shared Cold Queues Summaries for All Destinations
workspace 62Shared Cold Queues Summary workspace 61Shared Fast Path Program Queue Detail workspace
59Shared Fast Path Program Queue Summaries
workspace 58Shared LTERM Queue Detail workspace 59Shared LTERM Queue Summaries workspace 59Shared OTMA Queues Summary workspace 60Shared OTMA Queues Tpipe Summaries workspace
60Shared Transaction Queue Detail workspace 58Shared Transaction Queue Summaries workspace 58Single Transaction Information workspace 52
Software Supportcontacting 67
TTivoli software information center 13
Wworkspaces
accessing 41, 57Coupling Facility Data Sharing Structures 63Coupling Facility Shared Queues Structures 58Global Lock Conflicts 63IMS Address Spaces 43IMS CF Data Sharing OSAM Details 44IMS Connect CPU Usage 43IMS Coupling Facility Data Sharing Status 43IMS DASD Logging 44IMS Dependent Regions 44IMS Device Activity 44IMS Extended Recovery Facility 45IMS External Subsystems 45IMS Fast Path Balancing Groups 45IMS Fast Path DEDB Activity 45IMS Fast Path MSDB Information 45IMS Fast Path Regions 46IMS Fast Path System 46IMS Fast Path VSO Data Spaces 46IMS IRLM Information 46IMS Logical Terminals 47IMS MQSeries Status 47IMS MSC - Logical Links 48IMS MSC - Physical Links 47IMS Node Level Summary 48IMS OSAM BP Statistics 48IMS OSAM BP Statistics (Delta) 48IMS OSAM Subpool Statistics 49IMS OTMA Status 49IMS Pools Display 49IMS Program Scheduling Blocks 49IMS Recovery Control Datasets 49IMS RTA Group Item Summary 50IMS RTA Group Summary 50IMS Startup Parameters 51IMS System Datasets 51IMS System Exceptions 51IMS System Information 51IMS Transaction Summary 52IMS TRF Class Summary 52

Index 77
IMS TRF DLI Summary 52IMS VSAM Activity 52IMS VSAM Subpool Statistics 53IMS VSAM/OSAM Activity 53introduction 40, 56navigating 32Online Log Dataset 44overview of 22Shared APPC Queue Summaries 59Shared APPC Queue TPname Summaries 60Shared Cold Queues - APPC Summaries 62Shared Cold Queues - LTERM Summaries 61Shared Cold Queues - OTMA Summaries 62Shared Cold Queues - Remote Summaries 61Shared Cold Queues - Transaction Summaries 61Shared Cold Queues Summaries for All
Destinations 62Shared Cold Queues Summary 61Shared Fast Path Program Queue Detail 59Shared Fast Path Program Queue Summaries 58Shared LTERM Queue Detail 59Shared LTERM Queue Summaries 59Shared OTMA Queues Summary 60Shared OTMA Queues Tpipe Summaries 60Shared Transaction Queue Detail 58Shared Transaction Queue Summaries 58Single Transaction Information 52

78 Using IBM Tivoli OMEGAMON XE for IMS on z/OS, Version 3.1.0


IBM@
Part Number: GC32-9351-00
Printed in USA
GC32-9351-00
GC32-9351-00


