For Windows 98 TM and higher User’s Manual Version 4.0 All Rights Reserved Copyright 1996 – 2004 Fibonacci Trader Corporation 450 -106 North SR13, # 206 Jacksonville, FL 32259 www.fibonaccitrader.com Fibonacci Trader - 1 -
Transcript
For Windows 98TM and higher
User’s Manual
Version 4.0
All Rights Reserved
Copyright 1996 – 2004
Fibonacci Trader Corporation
450 -106 North SR13, # 206
Jacksonville, FL 32259
www.fibonaccitrader.com
Fibonacci Trader - 1 -
The Main Menu.......................................................................................................................................................... 5
New Chart ................................................................................................................................................. 14
Chart List .................................................................................................................................................. 16 Printer Setup..................................................................................................................................................... 18 Exit.................................................................................................................................................................... 18
Systems ....................................................................................................................................................... 28 FT Tools ............................................................................................................................................................... 38
Fix FT. Ranger.................................................................................................................................................. 38 Edit Fix FT. Ranger .......................................................................................................................................... 39 Live FT. Ranger................................................................................................................................................ 39 Edit Live FT. Ranger......................................................................................................................................... 39 Show FiboZones Next ...................................................................................................................................... 40 Edit FiboZones Next ......................................................................................................................................... 40 Show FiboZones Hi .......................................................................................................................................... 41 Edit FiboZones Hi ............................................................................................................................................. 41 Show FiboZones Matrix.................................................................................................................................... 42
J.Z. ....................................................................................................................................................................... 42 Show JZ Matrix................................................................................................................................................. 42
Help...................................................................................................................................................................... 58 The Chart................................................................................................................................................................. 59
Chart Options Window...................................................................................................................................... 62 Chart Pop-up Menu .......................................................................................................................................... 73
Editing Bar Data....................................................................................................................................................... 82 The Drawing Tools................................................................................................................................................... 85
Box Information ............................................................................................................................................ 86
Circle and Ellipse .................................................................................................................................. 86
Daniel Lines .................................................................................................................................................. 87
Fibonacci Fan ............................................................................................................................................... 88
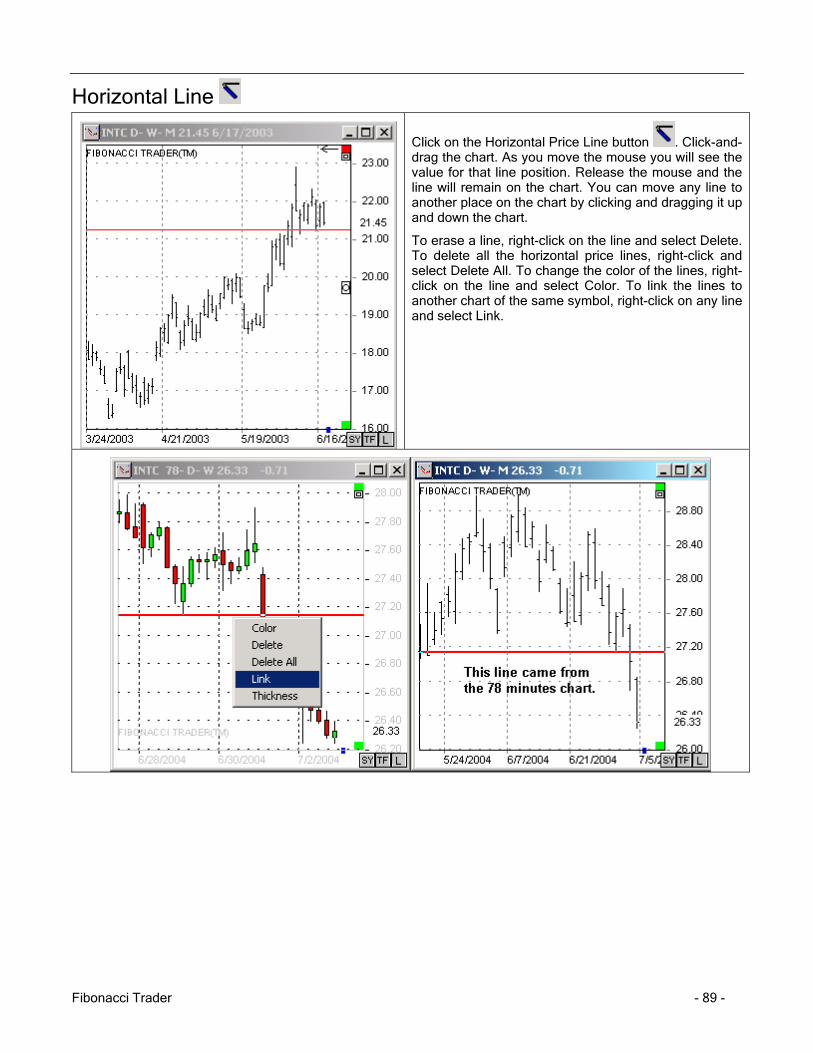
Horizontal Line .............................................................................................................................................. 89
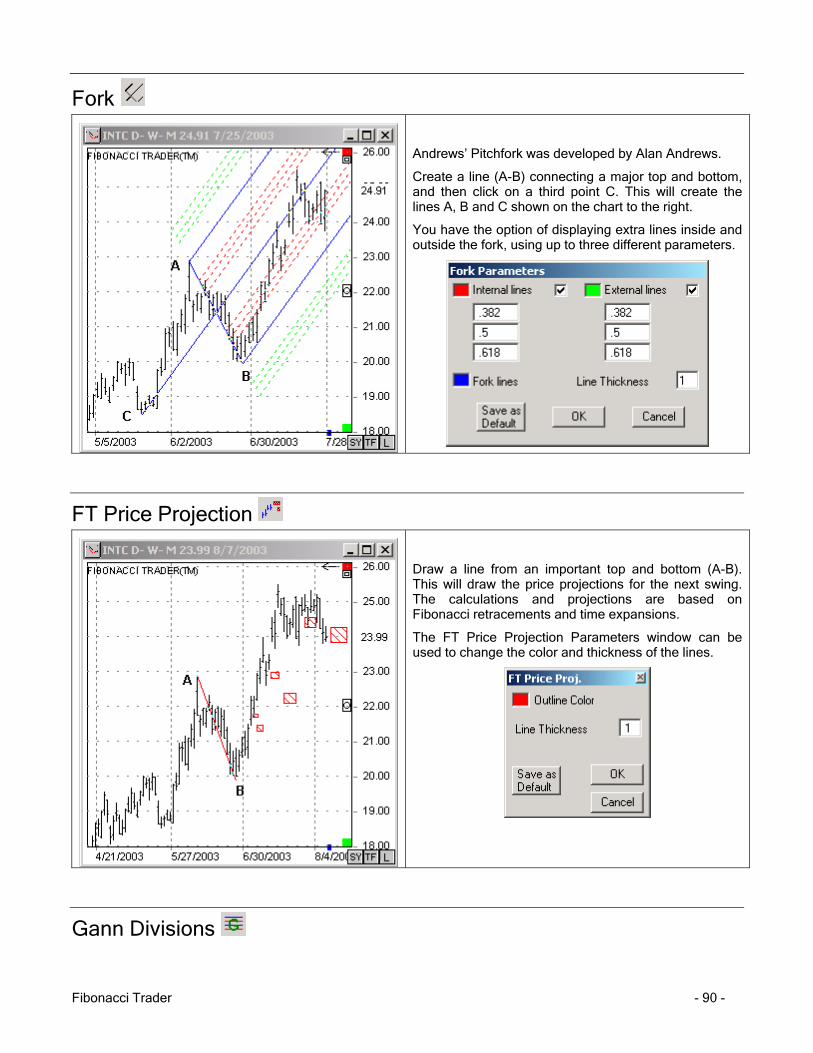
FT Price Projection ....................................................................................................................................... 90
Gann Fan ...................................................................................................................................................... 92
Gann Square of Nine .................................................................................................................................... 94
Least Square ................................................................................................................................................. 96
Price Line ...................................................................................................................................................... 97
Text ............................................................................................................................................................... 99
Trend Line ................................................................................................................................................... 100
Time Cycle ................................................................................................................................................. 100
Time Expansion .......................................................................................................................................... 101
Vertical Line ................................................................................................................................................ 102
Zoom ........................................................................................................................................................... 102 The Indicators ........................................................................................................................................................ 103
Divergences ....................................................................................................................................................... 103 High Probability Zone Analysis.............................................................................................................................. 105
Fibonacci Trader - 4 -
The Main Menu
File
Exchanges (Real-time Version)
The Fibonacci Trader RT software needs to know the time difference between your computer’s local time and the time where the exchange is.
The program uses the difference in hours between your local time (computer time) and the exchange time to calculate the correct time for each tick it receives in real time from your data vendor.
When you run Fibonacci Trader RT for the first time the program will use the time zone set in your Windows operating system to update all exchange time zones. As you start the program for the first time click File, Exchanges, then Edit Exchanges to see if the time zones are set correctly
Click on “NEW YORK STOCK EXCHANGE.” The time zone must be 0 (zero) if you are on EST.
If you are west of the NYSE you will subtract hours. So, if your computer time is set to Central Standard Time, the time zone should be –1.
If your computer is set to Mountain Standard Time, the time zone should read –2.
If your computer time is set to Pacific Standard Time, the time zone should read -3.
If you are located east of EST then you will add hours. For example; if you are in London you will add 5 and the Time Zone for the NYSE will be +5, Germany +6, Singapore +13. To change all exchange times at once, click Exchanges on the EXCHANGES window menu. You will then have the following options:
Add one hour to all time zones—this will add one hour to all exchanges.
Subtract one hour from all time zones—this will subtract one hour from all exchanges.
Always check to see that the difference in hours between your local computer time and New York time is correct.
Fibonacci Trader - 5 -
This value is always calculated as your computer time minus the time at the exchange. This way we will always use the appropriate exchange time for opening and closing time of the symbol being tracked.
The DEFAULT EXCHANGE that comes with Fibonacci Trader RT is the NYSE. When you press the F5 key, the ADD SYMBOL window will open, allowing you to insert symbols using the NYSE parameters. (Note that the default exchange has a drawing of a hand to the left of the default exchange name.)
To change the default exchange, right-click on the exchange you want. A pop-up menu will appear. Click “SET AS DEFAULT.”
You can also click on a exchange and then click on the Symbols button. All symbols for that exchange will appear. You can then add symbols for that exchange by pressing F5.
When adding symbols using the F5 function, you can define the following parameters: “Trading Times,” “Default Unit”, “Division”, “Delay,” and “Minutes to Wait after the Close” of the exchange to which you are adding symbols.
You can also create an exchange if needed. Let’s create the AMEX…
Type “AMEX” in the Exchange Name box, then enter the time zone, and (if you receive delayed data) the Real-time Delay.
Click the Add button.
Click on the Default Trading Time button and enter the trading times—in this case, Monday to Friday, 9:30 to 16:00. Click OK.
(NOTE: You do not need to type all the open and close times individually. Enter the first, then double-click on that entry to copy the time you entered to all boxes in the same column for which the day has been checked.)
Click on the Default Unit button. Select the default unit price and click OK.
Click on the Default Division that you want to use for this exchange. In this case, click on “Stocks.”
Click SAVE, then Exit to close the Exchanges window.
Fibonacci Trader - 6 -
Add Symbol (F5 key) – (Real-time Version)
Any time you press the F5 key on your keyboard the Insert New Symbol and Symbols List window of the default exchange will open. Enter the symbol you want to add, and then click OK.
(NOTE: You can type just the symbol and that symbol will be added to the Default Exchange or you can type the exchange abbreviation and symbol using the following format:
Exchange Abbreviation~Symbol
i.e. (NASDAQ~INTC).
This will add the symbol to the desired exchange using that exchange’s parameters.
In the picture below, even though the Default Exchange is NASDAQ you can type NYSE~IBM and that will add IBM to the New York Stock Exchange.
When you click OK the symbol will be created. If Fibonacci Trader RT can download historical data from your real-time data vendor the program will open a new daily chart and request the data.
In the Exchange Symbol List window you can right-click on any symbol and a pop-up menu will appear giving you the following options:
Fibonacci Trader - 7 -
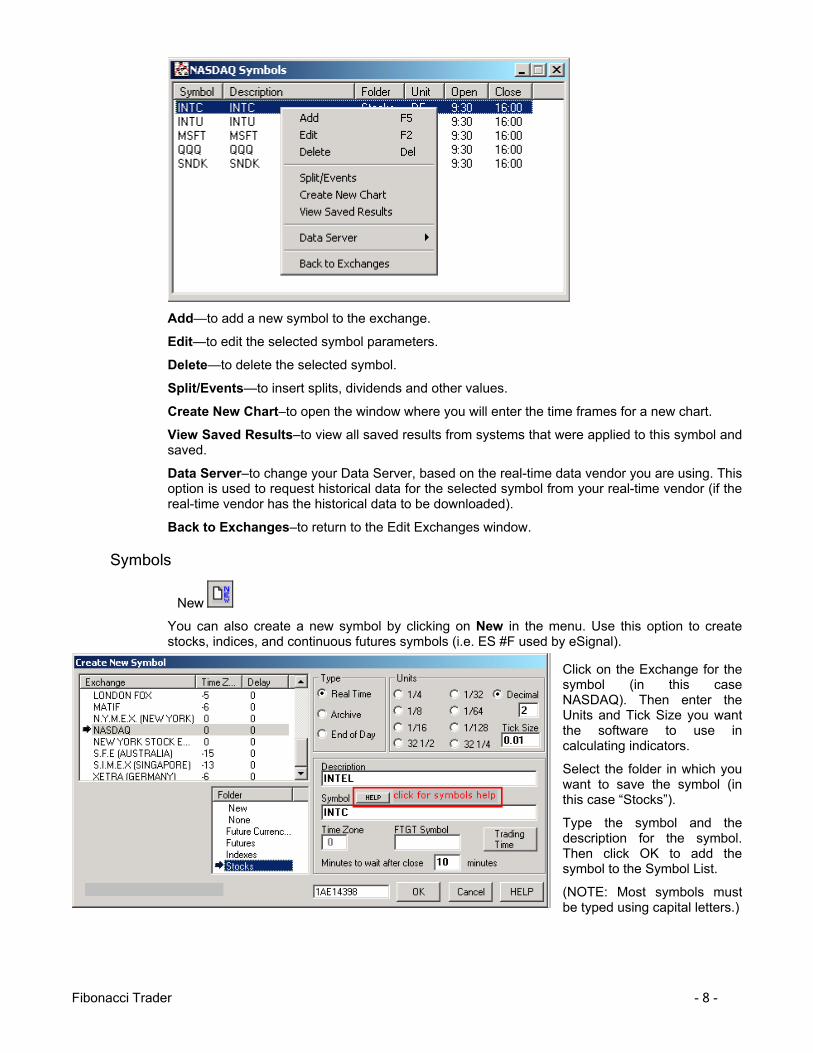
Add—to add a new symbol to the exchange.
Edit—to edit the selected symbol parameters.
Delete—to delete the selected symbol.
Split/Events—to insert splits, dividends and other values.
Create New Chart–to open the window where you will enter the time frames for a new chart.
View Saved Results–to view all saved results from systems that were applied to this symbol and saved.
Data Server–to change your Data Server, based on the real-time data vendor you are using. This option is used to request historical data for the selected symbol from your real-time vendor (if the real-time vendor has the historical data to be downloaded).
Back to Exchanges–to return to the Edit Exchanges window.
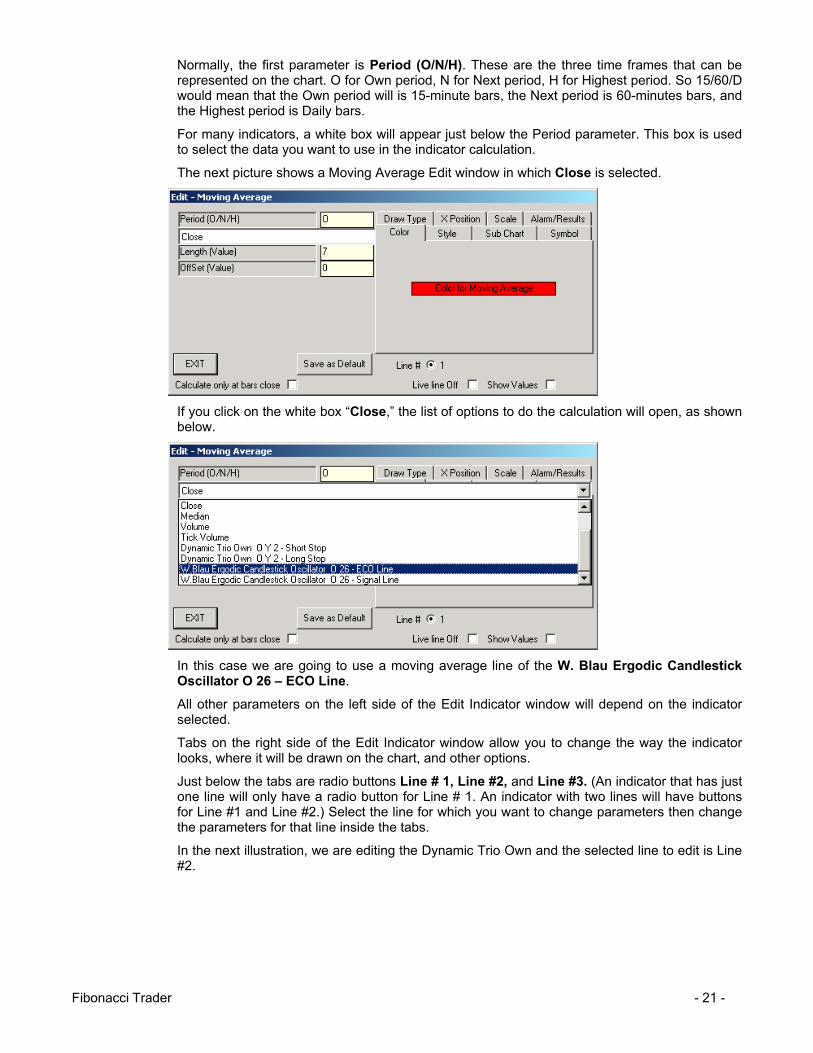
Symbols
New
You can also create a new symbol by clicking on New in the menu. Use this option to create stocks, indices, and continuous futures symbols (i.e. ES #F used by eSignal).
Click on the Exchange for the symbol (in this case NASDAQ). Then enter the Units and Tick Size you want the software to use in calculating indicators.
Select the folder in which you want to save the symbol (in this case “Stocks”).
Type the symbol and the description for the symbol. Then click OK to add the symbol to the Symbol List.
(NOTE: Most symbols must be typed using capital letters.)
Fibonacci Trader - 8 -
Creating an EOD symbol
If you are using data from TC2000 EOD do not use this window, just go to your keyboard and press the F4 key to create symbols directly from the TC2000 files.
Click on File, then on Symbol, then on New. The Create New Symbol window will open.
Select “End-of-Day” in the Create New Symbol window. This will generate a list of data supplier formats compatible with Fibonacci Trader.
In this window you do not need to enter the chart’s symbol, but you do need to enter the format of the file from which the data will be collected.
In this example we will create an End-of-Day contract for the stock Eastman Kodak, then update the contract using a MetaStock formatted file. Click Select to open the Select File window.
Using the Drive list and the Folder list, find the MASTER file that you want to use. (The MASTER file is the MetaStock file containing a list of all files in a specific folder. )
(NOTE: For CSI formatted data, the file to look for is called QMASTER. CompuTrac formatting uses the MASTER file, and the new MetaStock 8 format looks for the file EMASTER.)
The box in the bottom of the window shows the list of all files in this folder. Select the one you want (in this case Eastman Kodak) and click OK.
Fibonacci Trader - 9 -
Click OK on the New Symbol window and the chart will be created.
Auto Create--If you click on Auto Create and not on the Select button all charts in this Master file will be created. Just go to the Chart list (click Chart on the Main Menu), look under End-of-Day and then under the division you had used. Open the charts from there.
New TC2000 Symbol (F4 key) for TC2000 EOD users only
Click on this option in the File menu or press the F4 key on your keyboard.
Type the symbol in the box and click OK. This will create the Symbol file and a Daily Chart for use with TC2000 EOD data.
New Yahoo Symbol (F2 key)
Click on this option on the File menu or press the F2 key.
Type the symbol in the box and click OK. This will create the Symbol file and a Daily Chart using data from the Yahoo site. (You must be connected to the internet to use this feature.)
Fibonacci Trader - 10 -
Symbols List
The left side of this window shows the three main folders used by the program: Real-Time, Archive, and End-of-Day. (NOTE: If you have the End-of-Day version of the program you will see Archive and End-of-Day only.)
Each folder has sub-folders. The sub-folders store all of your symbols.
If you right-click on the left side of the window, a menu will open allowing you to add and delete folders.
On the right side of the window you will see the list of symbols that are stored within the selected folder.
When you right-click on a symbol, a menu will appear with the following options:
New Symbol--opens the New Symbol window.
Edit Symbol--opens the Edit Symbol window.
Delete Symbol--deletes the selected symbol (ALL DATA FOR THE SYMBOL WILL BE LOST)
Split/Events--inserts a split or event in the symbol’s data.
Import ASC data--imports ASC data from an ASC file into the selected symbol.
Export ASC data--exports data from the selected symbol into an ASC file.
Data Server–(available in the real-time version if the Fibonacci Trader) downloads historical data from the real-time data vendor in use. Data Server could be read as eSignal Server for eSignal users, Quote.com Server for quote.com users, myTrack Server for myTrack users and so on.
Create New Chart--creates a new chart for the selected symbol.
View Saved Results--shows results of system back test you have created for this symbol.
View As--changes the List Display format.
Fibonacci Trader - 11 -
Futures
Click on the Futures menu to access the available options. You can also access these options by right-clicking on any futures group within the list.
The options are defined as follows:
New Futures Group opens the New Futures window.
Edit Futures Group opens the Edit Futures window.
Delete Futures Group deletes the selected futures group (all data for this group will be lost).
What is a Futures Group?
Futures groups are the collections of futures symbols that Fibonacci Trader will automatically roll over for you.
When you want to create a futures contract symbol, do not use the New Symbol window. If you do, new futures contracts will not be added automatically.
Click on File, then Futures. The Futures List window will open.
When you click on the Futures menu or right-click in the Futures Groups window you will have the following options:
New Futures Group--creates a new future group.
Edit Futures Group--edits the selected future group.
Delete Futures Group--deletes the selected future group (all data for all contracts in this futures group will be lost).
Fibonacci Trader - 12 -
New/Edit Futures Group Window
The next picture shows the Create New Futures Group window. The inputs are the same as those in the Symbols window except for the addition of the Expiration Month choices.
Select the Exchange where the futures contract is traded. This will synchronize the time of the futures contract to the default trading time of the folder and unit. (You can change these values if you desire.)
Symbols for the S&P are normally written as follows: SPM0, SPU0, SPZ0, SPH1, SPM1, etc.
Do not type the month and year next to the root symbol in the symbol box. Instead enter “SP?!.” The question mark (‘?’) will automatically be replaced by the months that you selected for this group, and the exclamation point (‘!’) will automatically be replaced by the year.
If the data you receive from your data vendor is formatted with the year before the month, such as SP0M, SP0U, or SP0Z, then switch the positions of the “!” and the “?” i.e.”!?”.
If your data vendor does not use the year (as for some European and Asian markets), do not use the “!” at all.
If the symbol you need to use has more information, for example SPU0.LAST or SPU0/LS, you would still use “?!” in the place of “U0”. For example: SP?!.LAST or SP?!/LS.
Type the description you want for this futures group. Keep descriptions short.
Click on Trading Times to call up the Trading Times window. Here you can change the times if the futures symbol’s trading times are different from the exchange’s default trading time.
Check the active trading days and enter the correct times.
Short cut: If you double-click on any time that you have entered, that value will be copied to all trading times for all selected active trading days in that column. Click OK to finish.
When using decimals as your Unit you will need to enter the tick size for this symbol. Tick size increments are used to calculate many indicators. For example the Dow Jones Industrial trades in 0.01 increments, the S&P futures trades in 0.1 increments, and the S&P e-Mini trades in 0.25 increments.
Select a folder in which you want to store the symbol (if different from the exchange’s default folder).
Select all of the expiration months that the selected futures symbol trades. In this case, the S&P expires in March, June, September and December.
Click OK and the group will be created.
Fibonacci Trader - 13 -
When the current futures contract expires, the program will have already created and collected data for the next contract. You will never have to manually create the next expiration month.
In the Symbols Control window (above), SP 01/12, SP 02/03, SP 02/06, and SP 02/09 are real-time futures contracts for which the program is collecting data.
When the SP 01/12 (December 2001) contract expires, the program will move that contract to the Archive folder and create a new contract (SP 02/12), for which to collect data for December 2002.
NOTE: Most symbols use capital letters.
New Chart
Select the symbol for which a chart will be created.
Enter or select the time frames for the chart. Click OK.
If creating a Tick Bar chart, click on the option ‘Tick Bar’.
The options selected in the window to the left will create a QQQ chart with an Own Period of 50 ticks, a Next Period of 500 ticks, and with Daily as its Highest Period.
When you select the option ‘Tick Bar’, the program will give you the average tick volume (by day). If you change the day count, the program will change the average tick volume to account for the new number of days.
(NOTE: Fibonacci Trader RT uses daily data to find this information.)
Fibonacci Trader - 14 -
For range bars charts, click on the Range Bar option and enter the range you want in the R$ box. The Next and Higher Periods on range bars are then fixed on Daily and Weekly. Range bars can be created using 1-minute data or tick data. For tick data the last 500,000 ticks will be used.
The next illustration shows a selection of options that will result in a range bar chart for the QQQ, with a range of 10 cents, using tick data.
Click on the Chart List menu to open the window shown below. The left side of this window shows all the symbols that the program is tracking. Symbol files are saved in separate folders according to type (Futures, Indexes, Stocks, Archive). The right side of the window shows the list of charts already created for the selected symbol or folder on the left.
If you right-click a folder name on the left side of the window, the following menu appears...
The options are:
New Symbol--opens the New Symbol window.
Create New Chart–opens the Create New Chart window.
New Folder--creates a new folder under the main folder.
Delete Folder–deletes the currently selected folder.
Data Server–(available in the real-time version if the Fibonacci Trader) downloads historical data from the real-time data vendor. Data Server would read eSignal Server for eSignal users, Quote.com Server for quote.com users, myTrack Server for myTrack users, and so on.
Fibonacci Trader - 16 -
If you right-click a symbol name in the left window, you will get the following menu:
Create New Chart--opens the New Chart window.
Edit Symbol--opens the Edit Symbol window.
Delete Symbol--deletes the symbol (all data for the symbol will be lost).
Split/Events--inserts a split or event in the symbol data.
Import ASC data--imports ASC data from an ASC file into the selected symbol.
Export ASC data--exports symbol data into an ASC file.
Data Server—(available in the real-time version if the Fibonacci Trader) downloads historical data from the real-time data vendor in use. Data Server would read eSignal Server for eSignal users, Quote.com Server for quote.com users, myTrack Server for myTrack users, and so on.
View Saved Results--displays results of a system back test you have create for this symbol.
On the right window you will have the charts for the selected symbol or folder on the left window.
If you right-click a symbol name on the right window you will get the menu shown in the next illustration.
Open Chart–opens the selected chart or charts.
Close Chart–closes the selected chart or charts
Delete Chart–deletes the selected chart or charts.
New Chart–creates a new chart using the symbol of the selected chart.
Edit This Symbol–edits the symbol parameters of the selected chart.
Show Notes–opens an extra column on the right window showing notes made on each chart. The next illustration shows the right window with the Notes column. The “Show Note” option is now “Hide Notes”.
Fibonacci Trader - 17 -
Hide Menu–hides the menu on the top of the Charts window.
Printer Setup
Open the Windows Printer Setup window.
Exit
Close the program. If collecting real-time data the collection of data will stop.
Chart Click this menu item to open the Chart List window.
This is the same as clicking on File and then on Chart List or on the button .
Fibonacci Trader - 18 -
Page
The Page window allows you to save one or more chart windows as a page so that you can quickly open up multiple chart windows with a single mouse click. Open the charts you want to include in a page. Tile the charts on the screen as you want them to appear then click on Page in the Main menu.
Right-click on the white area, or click on the Page menu. You will have the following options:
Open Page–opens the selected page.
Close Page–closes the selected page.
Save Page–saves the current page.
Save Page As–saves the page under a new name.
Rename Page–renames the current selected page.
Delete Page--deletes the current selected page.
Close–closes the page window.
When you save a page, the program saves the charts that are open on your screen as well as those charts’ positions on the screen. When you reopen the page, the program will reopen these charts in the saved position.
(NOTE: When you delete a page you are only deleting the list of charts on the page. The charts themselves will not be deleted, and can still be found on the Charts List.)
There are two additional options.
Close All Charts and Open Page–closes all currently open charts and opens the page.
Include Minimized Charts–includes any charts on the page that are minimized at the time you are saving the page.
Fibonacci Trader - 19 -
Indicators Use the Indicator window to add indicators to your charts. The upper frame shows a list of the indicators that will be applied to your chart. The lower frame contains a list of all available indicators.
Simply scroll to and select the indicator(s) of your choice in the lower frame, then click on Add or double-click on the indicator name itself to add that indicator to the list.
To change the parameters of an indicator before applying it to a chart, highlight the indicator in the upper frame, right-click on it, and select Edit from the drop-down menu, or click on the EDIT button below.
The Edit Indicator window will open
The parameters that the indicator uses for the calculation appear on the frame on the left.
Fibonacci Trader - 20 -
Normally, the first parameter is Period (O/N/H). These are the three time frames that can be represented on the chart. O for Own period, N for Next period, H for Highest period. So 15/60/D would mean that the Own period will is 15-minute bars, the Next period is 60-minutes bars, and the Highest period is Daily bars.
For many indicators, a white box will appear just below the Period parameter. This box is used to select the data you want to use in the indicator calculation.
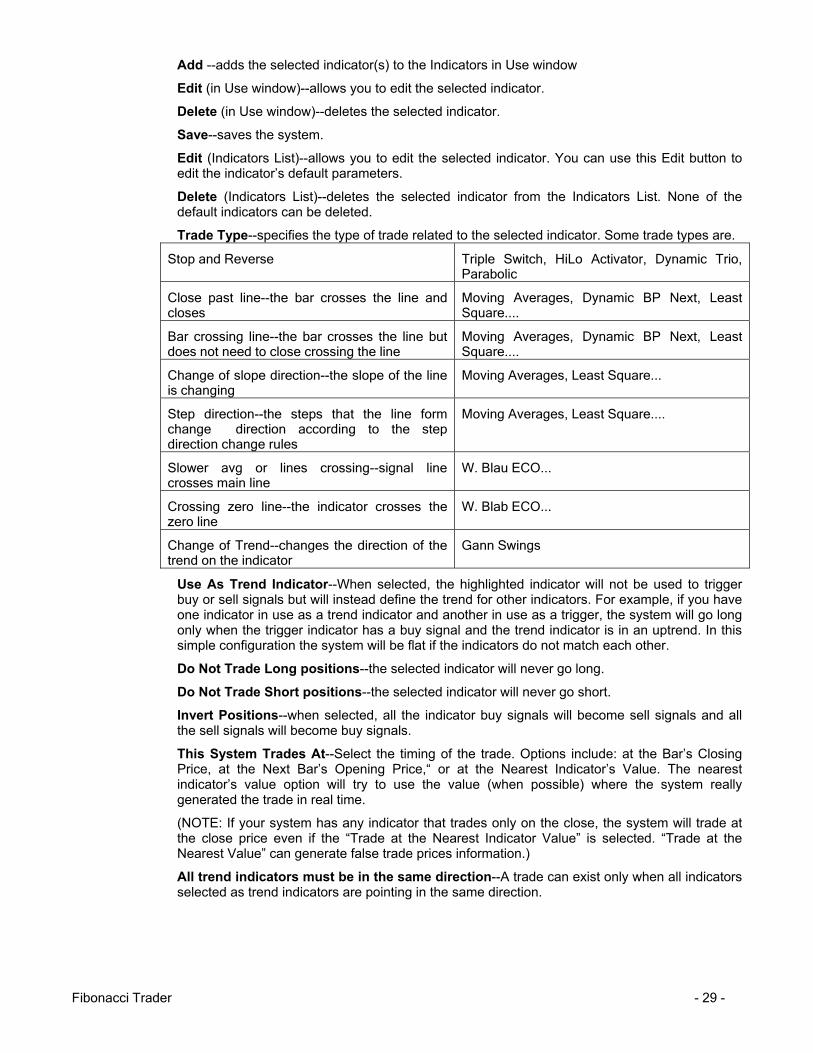
The next picture shows a Moving Average Edit window in which Close is selected.
If you click on the white box “Close,” the list of options to do the calculation will open, as shown below.
In this case we are going to use a moving average line of the W. Blau Ergodic Candlestick Oscillator O 26 – ECO Line.
All other parameters on the left side of the Edit Indicator window will depend on the indicator selected.
Tabs on the right side of the Edit Indicator window allow you to change the way the indicator looks, where it will be drawn on the chart, and other options.
Just below the tabs are radio buttons Line # 1, Line #2, and Line #3. (An indicator that has just one line will only have a radio button for Line # 1. An indicator with two lines will have buttons for Line #1 and Line #2.) Select the line for which you want to change parameters then change the parameters for that line inside the tabs.
In the next illustration, we are editing the Dynamic Trio Own and the selected line to edit is Line #2.
Fibonacci Trader - 21 -
The Color tab allows you to change the Close of the line. In this case, you would click on the green color box and the Select Colors window will open.
Select the color you want and click OK.
The Style tab allows you to select the thickness and spacing of the indicator line.
Fibonacci Trader - 22 -
Use the Sub Chart tab to tell the program where to draw the indicator on your chart. Chart 1 will draw the indicator in the same window as the price bars. Charts 2-6 will draw the indicator below the price bars.
Use the Symbol tab to select what kind of symbol to use to denote the indicator value.
Use the Draw Type tab to change how the indicator will be drawn on the chart.
Fibonacci Trader - 23 -
X position is used to place the indicator in front of or behind the price bars.
Check Use Fixed Scale and type the minimum value and maximum value you want for the scale of the selected indicator.
Use the Alarm/Results tab to set alarms. For an audible alarm to sound and an alarm window to pop up on the screen, check the Alarm On condition box. Select the Trade Type and identify the specific signals that will trigger the trade. Clicking in the Show Trades on Chart box will place buy and sell arrows on the chart when a trade signal occurs.
On the bottom of the Edit window you have the following options:
Calculate Only At Bars' Close–calculates the indicator using oonly when the bar closes. (This will speed up the program to adapt to very fast markets.)
Scale – Use Best Fit –forces the indicator lines to fit on the sub chart window.
(NOTE: This may make the Values Scale on the right incorrect. Be careful when using this option with different indicators on the same sub chart. With this option checked, line crossing of different indicators can be false.)
Fibonacci Trader - 24 -
Live Line Off–hides the projected live line, if the indicator has one.
The left side of the next illustration shows a Balance Step Next indicator with the projected Live Line for when the new Next period opens. The picture on the right shows the same indicator without the Live Line.
Show Values--makes indicator values appear on the chart, next to the indicator line. When you check Show Values you are given the option of checking All. if you check All, then indicator values for all bars will appear on the chart.
Click the Save As Default button and the indicator parameter changes you made will now be saved as the default parameters for the indicator.
Fibonacci Trader - 25 -
To access the Edit Indicator window for an indicator that is already on a chart, just click on the indicator name on the chart. The indicator names are on the top left corner of each chart.
If you right-click the indicator name, a menu will open. (This menu will be discussed later, in the chapter about Chart Windows.)
To change the default parameters of an indicator, highlight the indicator in the lower window frame and click on Edit (below the entire window). You also can right-click on the indicator name and the Edit menu will appear.
Click Edit and the Edit window for a default indicator will open.
Fibonacci Trader - 26 -
This is the same window that we discussed earlier, with the addition of a Save As New button, and a box in which to type a name.
If there is an indicator for which you would like to have different defaults, you would input the defaults you want, type a new name for the indicator, then click the Save As New button.
For example you can have a default Moving Average 14.
Click Add to add the selected indicator to the top list of indicators (indicators in use on the chart).
Click Delete to delete the indicator from the list of indicators. Indicators that come with the program cannot be deleted.
Click Provider will show information about the indicator file.
Fibonacci Trader - 27 -
Systems On the Main menu click on Systems. The following window will open. Right-clicking on the white box or on a system name will generate the following options:
New--opens the New System window shown below.
System Name--allows you to enter the name you want to use for this system.
Indicators in Use (top frame)--lists the indicators currently used by this system. If the check box by the indicator name is unchecked, the indicator will be displayed on the screen, but it will not be used in any calculation of positions used by this system.
Indicators List (bottom frame)--lists all the indicators available in the software.
Fibonacci Trader - 28 -
Add --adds the selected indicator(s) to the Indicators in Use window
Edit (in Use window)--allows you to edit the selected indicator.
Delete (in Use window)--deletes the selected indicator.
Save--saves the system.
Edit (Indicators List)--allows you to edit the selected indicator. You can use this Edit button to edit the indicator’s default parameters.
Delete (Indicators List)--deletes the selected indicator from the Indicators List. None of the default indicators can be deleted.
Trade Type--specifies the type of trade related to the selected indicator. Some trade types are.
Stop and Reverse Triple Switch, HiLo Activator, Dynamic Trio, Parabolic
Close past line--the bar crosses the line and closes
Moving Averages, Dynamic BP Next, Least Square....
Bar crossing line--the bar crosses the line but does not need to close crossing the line
Moving Averages, Dynamic BP Next, Least Square....
Change of slope direction--the slope of the line is changing
Moving Averages, Least Square...
Step direction--the steps that the line form change direction according to the step direction change rules
Moving Averages, Least Square....
Slower avg or lines crossing--signal line crosses main line
W. Blau ECO...
Crossing zero line--the indicator crosses the zero line
W. Blab ECO...
Change of Trend--changes the direction of the trend on the indicator
Gann Swings
Use As Trend Indicator--When selected, the highlighted indicator will not be used to trigger buy or sell signals but will instead define the trend for other indicators. For example, if you have one indicator in use as a trend indicator and another in use as a trigger, the system will go long only when the trigger indicator has a buy signal and the trend indicator is in an uptrend. In this simple configuration the system will be flat if the indicators do not match each other.
Do Not Trade Long positions--the selected indicator will never go long.
Do Not Trade Short positions--the selected indicator will never go short.
Invert Positions--when selected, all the indicator buy signals will become sell signals and all the sell signals will become buy signals.
This System Trades At--Select the timing of the trade. Options include: at the Bar’s Closing Price, at the Next Bar’s Opening Price,“ or at the Nearest Indicator’s Value. The nearest indicator’s value option will try to use the value (when possible) where the system really generated the trade in real time.
(NOTE: If your system has any indicator that trades only on the close, the system will trade at the close price even if the “Trade at the Nearest Indicator Value” is selected. “Trade at the Nearest Value” can generate false trade prices information.)
All trend indicators must be in the same direction--A trade can exist only when all indicators selected as trend indicators are pointing in the same direction.
Fibonacci Trader - 29 -
Trend indicator must already be in the right direction--If your trigger indicator goes short, the short trade will exist only if the trend indicator is already short. Otherwise, the system will stay flat. If the trigger indicator goes long, the long trade will exist only if the trend indicator is already long, otherwise the system will remain flat.
Use trend indicator only on entries--When you are in a position and the trend indicator changes direction this will not change the position. Only when the trigger indicator changes will the position change.
Allow contra trend trades--With this option you can select the number of contracts to be traded for trend trades and contra trend trades
Allow multiple entries in the same direction--allows the system to go long or short multiple times at different price points.
No flat position, use only STOP/PROFIT protection--The system will go long or short using the selected indicators but will never go flat using the selected indicators. It will, however, use your selected stops and/or profit protection parameters.
Add Position On Reentries--If “No Flat Position, Use Only STOP/PROFIT Protection“ is selected, the position will not go flat when the indicators do. However, if the selected indicators initiate another position in the same direction, the system will add on more positions. For example, you are long one share or contract and the option “No Flat Position, Use Only STOP/PROFIT Protection“ and “Add Positions on Reentries“ is selected. Your trigger indicators happen to go flat but your system will not, and if the indicators should happen to go long again, the system will add one more share or contract for a total of two shares or contracts. This will continue until the Max Entries number is reached or the STOP/PROFIT PROTECTION is reached or if the system goes short.
Show Trades On The Chart--When selected an arrow showing where the trade was initiated will show on the screen.
Alarm On Condition--causes an alarm to go off when the system initiates a position, goes flat, or reverses. If “Only Last Bar” is checked, then the alarm will sound only on the last bar on file. If you use the scroll bar to go backward and forward on the chart (i.e. to do backtesting) then as trades appear the alarm will not sound.
Show Indicators Names--When checked you will see the system name as well as all indicator names in use by the system. The indicator names will be listed underneath the name of the system in the upper left hand corner of your chart.
Options (button)--opens the System Options window.
The first tab is the Stop tab. The options are:
Fibonacci Trader - 30 -
None--No stop will be used.
By % Of Value--the stop is calculated on the entry price +/- a percentage of the entry price. If you bought a stock at 100 and you have By % Of Value 10, then if the price goes back to 90 the system will go flat (i.e. 100-10% = 90). You can check the option Trailing to make this a trailing stop.
By Ticks—allows to to define how many ticks you will allow yourself to loose. For example, if you are long the S&P Futures (tick size is .10) and you have “By Ticks” = 20 then if the position looses 2 points then system will go flat (i.e. 20 x .1 = 2). ). You can check the option Trailing to have this stop trailing.
Average Range Of--the program calculates the average range of “n” periods ago and then multiplies “n” periods by a percentage. Lets assume that the average range of the last “n” periods is 10 and the percent is set to 90, the program will use the number 10 and multiply it by 90%, which gives you 9.
If you use the option “From Entry Point” the program will add or subtract nince from the trade price to calculate your stop. For example, if you buy at 100 your stop will be 100 - 9 = 91.
If you use the option “From High/Low” then the program will use the high or low of the bar from which the trade occurred. For example, if you bought at 100 on a bar that had a low of 99 then the stop is 99 - 9 = 90. If the option “Trailing” is selected then when a new bar opens this bar’s low will be used as the stop as long as it has a higher low then the previous bar. Using the previous example your stop was 90. If a new bar opens and that low is 98, the new stop would be 98 - 9 = 89.
Previous Hi/Low Of--here the stop will be the High or Low of “n” periods ago. If you select
“trailing” then as a new higher low or lower high of n periods ago are formed then the stop will move to that value.
Close All Trades On The End Of The Day--the program will close all positions on the close of the last bar of the day (on intraday charts), if “Reopen Position On The Next Day’s Open” is selected then the program will reopen the same position at the next day’s opening price.
Do Not Show Stop Arrow On Screen--the program displays a stop arrow on the screen to show where the stop is on the chart. If you select this option the arrow will not be displayed.
At The Bar Close – If checked the stop trade will happen only on the close of the bar at which the stop condition occurred.
% Of Position To Close – 100% all the positions will be close, 50% half of your position will be closed.
The second tab is the Profit Protection tab. The options are:
Fibonacci Trader - 31 -
None--No profit protection is used in the system. TOP
By % Of Value--the profit protection is calculated using the entry price +/- a percentage of the entry price. If you bought a stock at 100 and you have “By % of value” of 10, then if the price increases to 110 the system will go flat (i.e. 100+10%=110).
If you select the option ‘Retracement From High Profit’ then when your profit protection point is reached the system will wait for a retracement of the typed value to go flat. In the previous example your profit protection point is 110. If the option ‘Retracement from high profit’ is selected and the value is set to 10% then when price retraces and your profit is reduced by 10% your system will go flat. In this case, 110 is the profit target, 10 is your total profit, if prices go back 10% of 10 (1 point) in this case back to 109 then you will go flat. If after reach 110 the market continues to go higher the retrace value will increase, lets say the price goes to 120, now your total profit is 20, 10% of 20 is 2, then if the price reach 120 and then retraces 2 going to 118 the system will go flat.
By Ticks--you define how many ticks you want to make. For example, if you are long the S&P Futures (tick size is .10) and you have “By Ticks” = 20 then if the position makes 2 points then system will go flat (i.e. 20 x .1 = 2). The same ‘Retracement from high profit’ can be used here as on the “By % of value”, but now you are looking on number of ticks retraced.
Average Range Of--the program calculates the average range of “n” periods ago and then multiplies “n” periods by a percentage. Lets assume that the average range of the last “n” periods is 10 and the percent is set to 90, the program will use the number 10 and multiply it by 90% which gives you 9.
If you use the option “From Entry Point” the program will add or subtract from the trade price the value 9 which will be your profit protection. For example, if you buy at 100 your profit protection will be 100 + 9 = 109.
If you use the option “From High/Low” then the program will use the high or low of the bar from which the trade occurred. For example, if you bought at 100 on a bar that had a high of 105 then the profit protection is 105 + 9 = 114.
Fibonacci Trader - 32 -
Do Not Show Profit Protection Arrow On Screen--the program displays a profit protection arrow on the screen to show where the profit protection is on the chart. If you select this option the arrow will not be shown. TOP
Third tab is the Arrows/Paint Bars tab.
In the window above you can select the color you want for the bars and arrows that will appear on screen when the system is in use.
The paint bar check boxes will cause the bars to be painted using the color selected. For example, if the system happens to go long and the going long color is green then the price bars will turn green and stay green until the system reverses or goes flat.
Show Stop/Profit Arrow Values--The value at which the system traded at will show on the screen along with the position arrows.
Forth tab is the Security tab
Use the Security tab to password protect your system.
Without the password the user will not have access to the system’s parameters.
The ‘System Expires Date’ will make the system expire on a predetermined date.
If you type a serial number in the Serial Number box the system will only run on the typed serial number.
Fibonacci Trader - 33 -
Edit--edits the current selected system on the Systems List window.
Export--exports the current selected system.
Import–imports a system.
Delete–deletes the current system.
Description–displays the system description if the selected system has a description.
Use–adds the selected system to the active chart.
The system name will appear on the top left of the chart. If the system has the option Show the Indicator's Name on, then under the system name you will see all the indicator names that belong to that system.
You can click on the system name to edit it, or click on the indicator name to edit that specific indicator.
Scan--opens the Scan System window for the selected system.
Right-click the system you want to scan then click Scan. The System Scan window will open.
Fibonacci Trader - 34 -
The list shows all charts you have created in the software. Right-clicking on a line will select the chart. Right-click again to unselect the chart.
You can click on Save Selection to save the actual selection to a file. Load Selection will load a previously saved selection and make it active.
The scan will show charts that have a change of position on the last bar on file. If you check Show All Positions then all charts will be shown with their current positions.
Force Close Day will make the program assume that the day is closed.
Number Of Bars To Load, is the number of bar that the program will use to do the calculation on each chart.
Click on Scan Now and the scan will start.
The Result list will appear.
You can double-click a chart on the list to open it.
Scan Symbol List--opens the Scan Symbols list where you can add symbols to be scanned for the time frames that you select.
Fibonacci Trader - 35 -
Right-click the white box and click Add Symbol, or press the F5 key to open the Add Symbol window. Type the symbol you want and click OK.
You can Load a previously saved list, Save a new list, or Clear the current list.
Show All Positions, Force Close Day, and Number of Bars to Load work as explained for the previous item.
Click Scan Now to start the scan.
Scan TC2000 List (for TC2000 users only)--scans a list created in the TC2000 program.
Fibonacci Trader - 36 -
In this scan, select a list created in your TC2000 program and click Scan Now.
Show All Positions and Number of Bars to Load are the same as for the previous item.
In this case the program will scan the Down Jones 20 Transportation Component Stock Index list of stocks.
Clear--removes the selected system out from the current chart.
Fibonacci Trader - 37 -
FT Tools
Fix FT. Ranger
The Fibonacci Ranger (FIX) tracks the past “N” number of days (or bars) to use in calculations. The default is three bars. When you use this indicator, you simply click on the Fix Fibo Ranger button on the Toolbar and then click on a high or low bar. In an up trend, when applied to a High, the Fibo Ranger will search backward for the Low of the past three bars’ range, ignoring inside bars, and then plot Fibonacci ratios of 1.764 up and down from that point as a white dashed line. These lines set up support and resistance points for upcoming price action.
Every time the market makes a new high or low you can re-plot the Fibonacci Ranger. Do not change the parameters until you have determined whether or not the 1.764 value is valid for your market.
(NOTE: This indicator is only intended as a tool to provide additional confidence to new trades which have already generated a valid signal.)
Click on FT Tools, then on Fix FT Ranger. Then click on a high or low bar to plot the tool.
Fibonacci Trader - 38 -
The tool will show a triangle on the top of the bar selected. Right-click the triangle to Edit, or Delete the tool.
Edit Fix FT. Ranger
Change the parameters--click OK to change the current tool in use or click Save As Default to change the default parameters of this tool.
Live FT. Ranger
The Live Fibo Ranger functions in exactly the same way as the Fix, but the program chooses the highs and lows automatically.
Edit Live FT. Ranger
Fibonacci Trader - 39 -
Change the parameters--click OK to change the current tool in use or click Save As Default to change the default parameters of this tool.
Show FiboZones Next
This will display the next period Fibonacci Zones on the chart
Edit FiboZones Next
Fibonacci Trader - 40 -
Show FiboZones Hi
This will display the highest period Fibonacci Zones on the chart
Edit FiboZones Hi
Fibonacci Trader - 41 -
Show FiboZones Matrix
That will open your Symbols List control.
Select the Symbol you want to see the matrix of, then double-click on it.
For more information on Probability Zones, please read the High Probability Zone Analysis chapter.
J.Z.
Show JZ Matrix--opens your Symbols List control.
Select the Symbol you want to see the matrix of, then double-click it.
Fibonacci Trader - 42 -
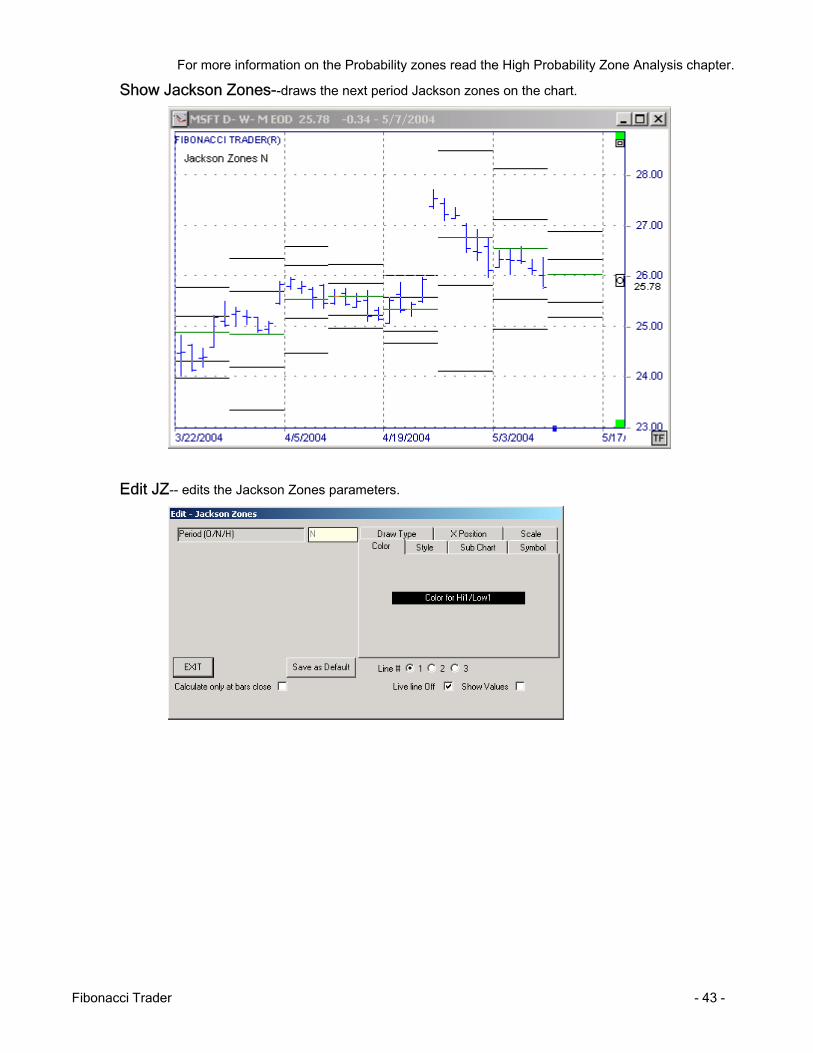
For more information on the Probability zones read the High Probability Zone Analysis chapter.
Show Jackson Zones--draws the next period Jackson zones on the chart.
Edit JZ-- edits the Jackson Zones parameters.
Fibonacci Trader - 43 -
Window
Cascade, Tile Horizontal, Tile Vertical, and Arrange icons are standard ways to arrange the windows.
Open Chart List will open a list of all charts that are currently open
If you click on a chart name, that chart will be displayed.
You can use the up and down arrows to your keyboard to cycle through the open charts.
You can right-click on the name of a chart with Chart option will open. This menu will be discussed at the Charts chapter.
Fibonacci Trader - 44 -
Utilities
Global Settings
Click on Utilities then on Global Settings. The first tab is the Chart tab. Use this tab to set default settings for any new chart you create. Charts that have already been created will not be affected by these settings. To change chart settings for charts that have already been created, select the Chart Options button.
Fibonacci Trader - 45 -
The General tab will allow you to set default parameters for the following:
Deselect crosshair manually after use: when checked crosshair cursor will remain until you choose the arrow cursor.
Show crosshair vertical line in all charts: Will show to vertical line in all charts of the same symbol.
Show values on separated window: When using the crosshair the value for each point will not show next to the crosshair but in a small separated window in the top left of the screen.
Deselect tools manually after use: when checked the current tool selected will remain until a different tool icon is selected
Select tools for all open charts: when you select a tool for one chart all chart will have the same tool selected.
Scroll chart using left mouse button: when selected the user can scroll through the chart by holding down the left mouse button while moving the mouse to the left.
Show symbols not descriptions: when checked the symbol will be listed in the title bar of each chart instead of the symbol’s description
Show symbols button on charts: when selected a small icon in the lower right hand corner of each chart labeled ‘SY’ will be displayed allowing the user to quickly changed the symbol for the current chart
Show time frames button on charts: when selected a small icon in the lower right hand corner of each chart labeled ‘TF’ will be displayed allowing the user to quickly changed the time frames for the current chart
Show menu on drawing tools buttons: when checked clicking on any drawing tool drawn on a chart will bring up a pop-up menu. If not checked the toll will be selected.
Draw box to insert text: when selected user must draw a box from left to right on the chart where text is to be inserted
Display local time on charts: when checked the time on the chart will show the computer local time and not the exchange local time.
Auto Symbol: when checked as you create futures groups the program will know parameters for some symbols, like ES, then just go to the symbol box on the create futures group window and type the symbol you want.
Show price tag on charts: when checked the current price will be displayed next to the live arrow.
Show tips: hovering the mouse cursor over a button will give you a description of that button.
Fibonacci Trader - 46 -
The Sound/Alarms tab allows setting the following parameters:
Show the alarm in an individual window: when an alarm is triggered notice of it will be displayed in a separate window.
Show the alarm in the alarm list window: when an alarm is triggered notice of it will be displayed in a window that contains all currently set alarms.
Sound Alarm: when checked a sound will be played when an alarm is triggered. Choose between the standard beep sound or a customized sound
Real-time Tick Sound: when checked the computer’s speaker will beep each time a tick is received by the program. This can give the user a sense of how active the market is.
The Brokers tab allows the user to select a broker for order entry.
Preferred capital Markets and REDI are currently supported.
To use IB you must get the activation password from us, you must sign a waiver to use it.
Otherwise, type in the your broker’s order entry web page on Broker URL.
To go to this page select Utilities then broker page.
Fibonacci Trader - 47 -
The program can email indicators, systems and price alarms.
On the email Alarms tab set your email parameters to be able to this feature.
Use the ‘Ticks’ tab to manage the size of your tick files.
As you change the ‘max number of ticks per tick file’ an estimate will be given for the approximate size of each tick file and how much of you hard drive will be used.
Status Bar
Shows and hides the status bar on the bottom of the Main window.
The status bar will show the ticks being processed on the left side, on the right side will show process being done, like importing data and reloading data.
Data Source
Fibonacci Trader - 48 -
Click on Utilities, Data Source, Show Data Feed, to see the Current Data Feed In Use window.
The window will depend on the data feed in use.
The above window is for DTN Iqfeed users.
The above window is for eSignal users.
Click on Utilities, Data Source, Select RT Data Vendor, to open the window were you will select your data vendor that is compatible with the Fibonacci Trader.
Fibonacci Trader - 49 -
This window has an extra option for the program to download data from Livecharts and keep updating the data for open charts every 30 seconds, if you want.
If you are using LiveCharts data just to update charts as you need, do not check the option “Reload data every 30 seconds”. An example is if you get real time data from Interactive Brokers (they do not have historical data), then you can use the Livecharts account to fill gaps of data as needed, in this case you do not want the option “Reload data every 30 seconds” checked as you will be getting real time data from Interactive Brokers.
If you do not have any other real time data vendor you can use the Livecharts option and the Reload option that will make you have charts updated every 30 seconds.
To use LiveCharts data first click on Utilities, Data Source, Select RT Data Vendor.
Check the option "If you have a LiveCharts account check here".
That will make the program know that you have a LiveCharts account.
If you also want to have the charts that have the LiveCharts link to update every 30 seconds using Livacharts data then check the box "Reload data every 30 seconds".
Here is how you can set a chart to download data from your LiveCharts account.
Fibonacci Trader - 50 -
On the LiveCharts web program you will select the symbol you want to get the data
In this case we typed INTC, we also selected the interval 1 minute, click on CHART STYLE & TOOLS. The menu will open
Select the option Export Chart then click BAR DATA TO ASCii TEXT
This will export the data into an Internet Explorer window, this window will have in the address bar the link that we are looking for to use into the Fibonacci Trader program.
Fibonacci Trader - 51 -
Note that the address bar above has the link we need, when you just click inside the Address box the link will highlight (if does not highlight move the cursor to the link, right click on it, click Select All, that will highlight the link), with the link highlighted, right click on the link and then select the option COPY, that will copy the link to the computer memory.
Go back to the Fibonacci Trader, get a chart where you want the data to be imported, in this case we open the Intel chart, double click the chart, the menu will open
Select the option LiveCharts Data, this will open the input box to type the link. Click inside the white box, then right click on the white box, a menu will open, click on PASTE.
Fibonacci Trader - 52 -
The link we got from the Internet Explorer will show on the white box, click OK.
A box to confirm the import will show, if all is correct click OK.
The data will then be imported into the chart.
Fibonacci Trader - 53 -
The link that you paste will be saved with the chart, you can change it or clear it any time you want, to do that just double click the chart again and click the LiveCharts Data option.
After that if your "Reload data every 30 seconds" is check then the chart will be updated every 30 seconds using LiveCharts data.
Note that LiveCharts do not have too many bars back, 1 minute bars has about 2 days only.
Fibonacci Trader - 54 -
Quote Screen
Select Utilities, Quote Screen, New or Open. New will create a new quote screen. Open will ask you to open a previously saved quote screen.
Enter the symbol you want to use in the Symbol column. Remember to use capital letters if you data vendor requires it. Right-clicking on any symbol will bring up a menu allowing you to set quote page parameters as well as the look of the quote screen. You can also open up a chart of any symbol by double-clicking on it or right-clicking and selecting either ‘open chart in new window’ or ‘open linked chart’. Selecting ‘open linked chart’ will open a chart window that is linked to the quote page. This means that whatever symbol you double-click, a chart of that symbol will open in the same chart window.
Right-clicking on any column will bring up a menu allowing you to select what you want for that column. Intervals in the top left corner of the window allows you to select time frame for the chart(s) you can open by double-clicking on any symbol or right-clicking and selecting from the menu.
Click on the L button to link or unlink a chart with the quote screen.
Fibonacci Trader - 55 -
If a chart is linked to the quote screen the button L will be green.
Chart Alarm
Use the chart alarm to alert you when the market trades at a pre-defined point. Select New then move the mouse arrow up or down the chart. As you move the mouse arrow up or down the chart the price that corresponds to the cursor location will be displayed in the box at the bottom right of the window. Once you locate the desired price, right-click to activate the alarm.
Once an alarm is activated an arrow will be displayed in the right-hand scale showing exactly where the alarm is set. You can Edit, Delete, or Delete All alarms by right-clicking on the alarm arrow and selecting the desired option from the menu. You can also click the arrow and move it up or down.
Computer Time
You can adjust your computer time by selecting Utilities, Computer Time. Type in the desired time and press OK.
Fibonacci Trader - 56 -
EOD
Reload File--is used to reload end-of-day data.
Always Reload Last Days--will always read the last days from the EOD provider files and overwrite any data in our database, if you have change the last bar data by hand, and this option is checked, when you open the same chart again the change will be overwritten by the EOD provider data.
Floating Clock
Press Utilities, then Floating Clock to activate. Right-click the clock to close it.
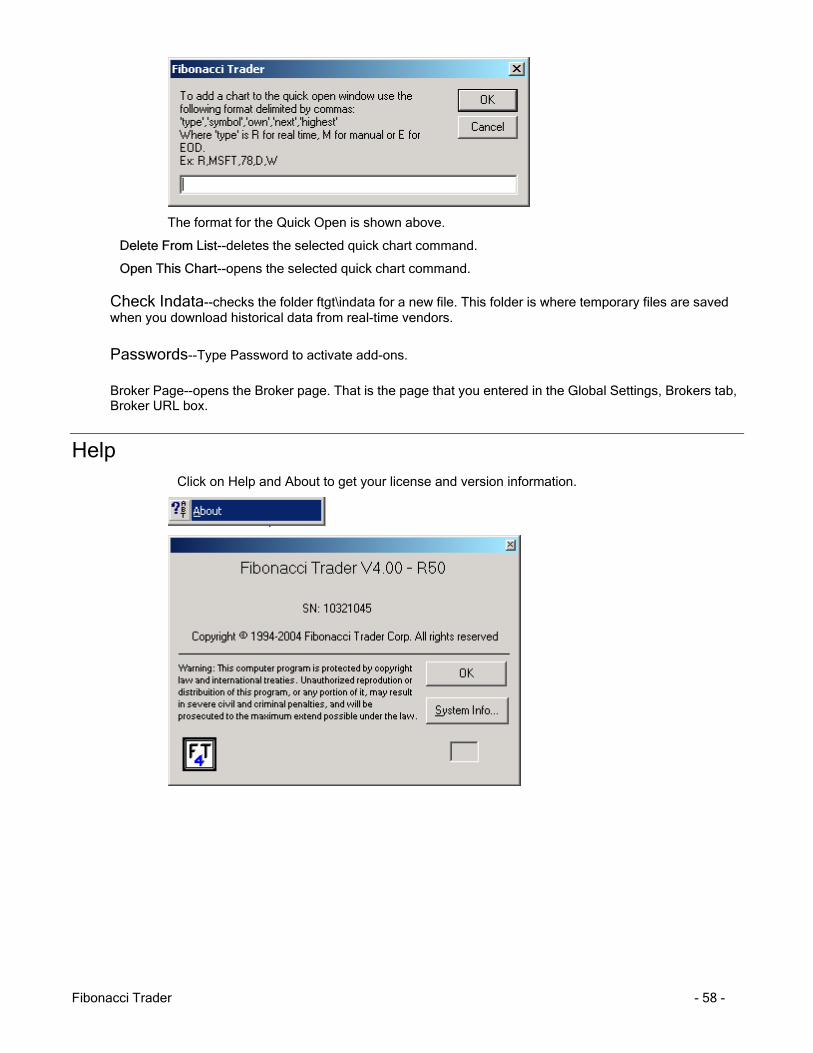
Show Quick Open
The next illustration shows the Quick Open window.
Right-click on the window and you will see the following options:
Add To List--adds a quick chart command to the list.
Fibonacci Trader - 57 -
The format for the Quick Open is shown above.
Delete From List--deletes the selected quick chart command.
Open This Chart--opens the selected quick chart command.
Check Indata--checks the folder ftgt\indata for a new file. This folder is where temporary files are saved when you download historical data from real-time vendors.
Passwords--Type Password to activate add-ons.
Broker Page--opens the Broker page. That is the page that you entered in the Global Settings, Brokers tab, Broker URL box.
Help Click on Help and About to get your license and version information.
Fibonacci Trader - 58 -
The Chart
Click opens or closes the scroll bar.
Opens or closes the scale functions.
Moves the chart up or down.
Expands the chart.
Resets the Y scale.
Right-click a bar to open the Edit Bar window. See Editing Bar Data chapter.
Click-and-drag moves the chart up or down. Press control and drag up or down to expand and compress the chart.Right-click will opens scale window.
Click to open the chart Options window Right-click opens the Indicators window.
Double-click on open the chart area. Opens the Chart menu.
Compresses the chart.
Move chart down.
Turns “what if” on/off.
Drag left/right change right space.
On the dates/times scale, click-and-drag the mouse left or right to compress/expand the chart.
NOTE: The up, down, left and right arrows on your keyboard will also move the chart up, down, left and right.
Fibonacci Trader - 59 -
Click the indicator name on the chart to edit the indicator parameters
Red means you do not have on screen the latest bar.
Click the arrow to move the chart back to the latest bar
Links with quote screen.
Changes the current time frames.
Right-click the indicator name
Edit--opens the indicator Edit w
Do Not Show—hides the indicat
Show Values—displays the indic
Delete—deletes the indicator fro
Divergences—opens the subme
Parameters--allows you
Indicator Line Name--ifselected line.
Results--opens a list of all trade
Fibonacci Trader
Changes the current
and the following menu will open:
indow.
or.
ator values on the chart.
m the chart.
nu:
to edit the divergences parameters.
checked, causes the divergences to appear on the chart for the
s made by the indicators, if the indicators can generate trades.
- 60 -
Fibonacci Trader - 61 -
Chart Options Window
Click the program name on the chart or click the Options button to open the Chart Options window.
Bars Tab
Changes the color of the regular bar.
Changes the color of the live bar.
Changes the thickness of the bar.
This is the number of bars that the program will load in memory. The fewer bars you load in memory, the faster the program will run. Normally 2000 to 4000 bars in memory is more than enough for any chart.
If unchecked the bars will not show on the chart.
Changes the color of the live arrow.
If checked, the live arrow will not be displayed.
If unchecked, the indicator names in use on the chart will not be displayed.
If unchecked, the system names in use on the chart will not be displayed.
Changes the chart background color.
Will create the bars using the “Heikin Ashi” also known as “Average Candle Chart. This option does not work on Range Bars charts.
Fibonacci Trader - 62 -
On tick charts only, you have the additional option . If checked the program will use only ticks with different values to create the tick chart. That means if you have a market with ticks 10, 10, 10, 9, 9, 10,10, 10, 10, 9, 9, 9, the program will only use 10, 9, 10, 9 on the tick chart.
On range bars charts only, you have the additional option . If checked will not create bars on gaps.
For example: On a $1 range bar chart, you have a bar for which the low is $10. You then receive a trade at $11. The next trade is at $14. That will close the first bar at $11, create a new bar from $11 to $12, another bar from $12 to $13 and the last bar from $13 to $14. With this option checked the program will close the bar at $11 and open a new bar at $14, all other bars in the middle will not exist.
The Bar Type selected here is Line. If the option Bar Color is checked the line will have different colors for up, down, or flat lines. (NOTE: The color is based on the actual bar close and the previous bar close.)
Click to change the colorof the Up, Down or Flatbar
The Bar Type selected here is OHLC. (HLC is the same but does not plot the open line.) If the option Bar Color is checked the bars will have different colors for up, down, or flat lines. (NOTE: The color is based on the actual bar close and the previous bar close.)
Click to change the colorof the Up, Down or Flatbar
Fibonacci Trader - 63 -
The Bar Type selected here is Candlestick. You can have the candles set on different colors, with solid or patterned candles, and with or without an outline.
Click to change the colorof the Up, Down or Flatcandle.
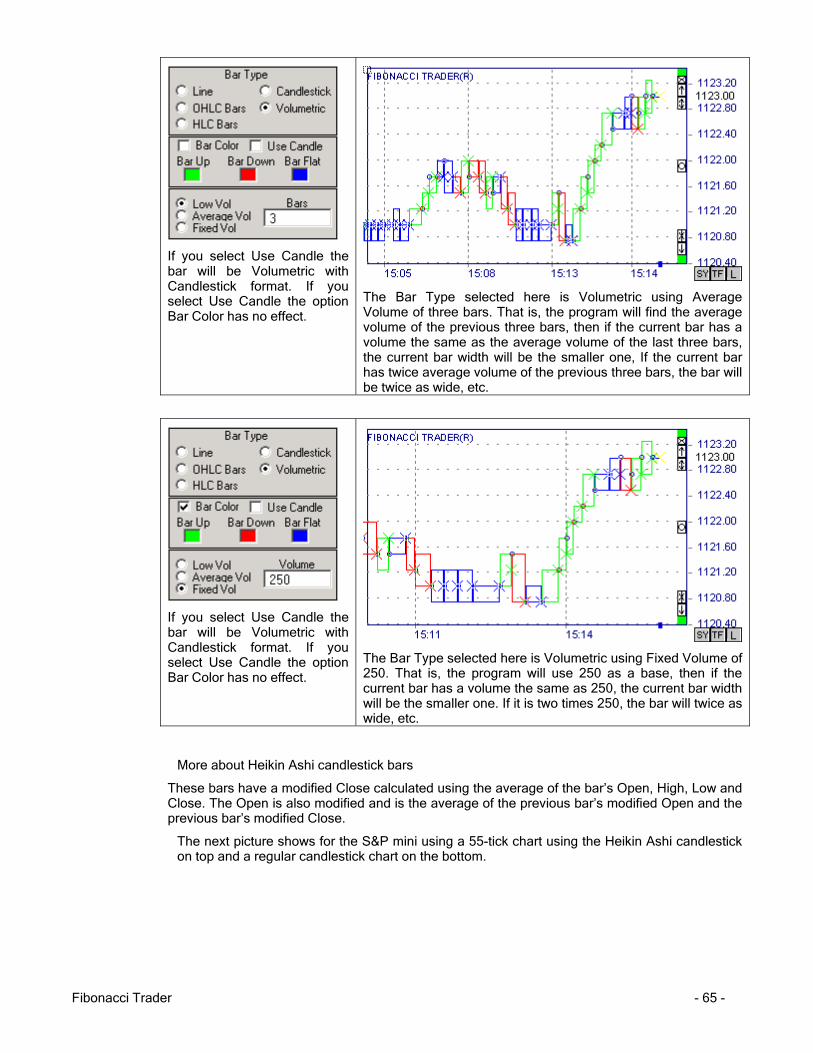
If you select Use Candle the bar will be Volumetric with Candlestick format. If you select Use Candle the option Bar Color has no effect.
The Bar Type selected here is Volumetric using Low Volume of five bars. That is, the program will find the lower volume of the previous five bars. Then if the volume of the current bar is the same as the lower volume of the last five bars the current bar width will be the smaller one. If the volume of the current bar is twice the volume of the lower volume of the previous five bars the bar will be twice as wide as the volume 1 bar. Three times the volume would make the bar three times as wide, etc.
Fibonacci Trader - 64 -
If you select Use Candle the bar will be Volumetric with Candlestick format. If you select Use Candle the option Bar Color has no effect.
The Bar Type selected here is Volumetric using Average Volume of three bars. That is, the program will find the average volume of the previous three bars, then if the current bar has a volume the same as the average volume of the last three bars, the current bar width will be the smaller one, If the current bar has twice average volume of the previous three bars, the bar will be twice as wide, etc.
If you select Use Candle the bar will be Volumetric with Candlestick format. If you select Use Candle the option Bar Color has no effect.
The Bar Type selected here is Volumetric using Fixed Volume of 250. That is, the program will use 250 as a base, then if the current bar has a volume the same as 250, the current bar width will be the smaller one. If it is two times 250, the bar will twice as wide, etc.
More about Heikin Ashi candlestick bars
These bars have a modified Close calculated using the average of the bar’s Open, High, Low and Close. The Open is also modified and is the average of the previous bar’s modified Open and the previous bar’s modified Close.
The next picture shows for the S&P mini using a 55-tick chart using the Heikin Ashi candlestick on top and a regular candlestick chart on the bottom.
Fibonacci Trader - 65 -
Fibonacci Trader - 66 -
Next Bar Tab
Check this option or click the button and the encapsulation will show, that is actually the Next Period bar.
Click to change the Next Period bar color.
Use to change the Next Period bar thickness.
Draw As A Box will draw the Next Period bar as a box around the Own Period bars that belong to that Next Period bar.
Fibonacci Trader - 67 -
Use Own Period Format will draw the Next Period bar using the same format as the Own Period bar.
Next period bars.
At this point if you uncheck the option Show Bars in the Options window Bars tab you will get a chart like this.
These are weekly bars.
Fibonacci Trader - 68 -
High Bar Tab
Check this option or click the button and the encapsulation will show, that is actually the High Period bar.
Click to change the High Period bar color.
Use to change the High Period bar thickness.
Draw As A Box will draw the High Period bar as a box around the Own Period bars that belong to that High Period bar.
Fibonacci Trader - 69 -
Use Own Period Format will draw the High Period bar using the same format as the Own Period bar.
These are weekly bars.
Grids Tab
Here you can set how the grids will appear--specifically the space between the dots and color.
Others Tab
Here you can Open and Close the scroll bar or turn “What If” on or off.
What is the What If?
Fibonacci Trader - 70 -
Many indicators trade after the market Close. If What If is 1, the program will assume that the market is closed and any indicator that trades at the Close will give the signal to trade, even if the market is not yet closed.
Spreads Tab
Click on the button Select Spread Symbol.
That will open the Chart window. Select a second symbol that you want to use on the spread.
Double-click the Select Symbol chart.
Fibonacci Trader - 71 -
The calculation will be “n” times of the chart symbol subtracted, added or divided by “n” times the select spread symbol.
You select that on .
In this case we are doing one time the chart symbol minus one time the selected spread symbol.
The resulting chart is shown below.
Fibonacci Trader - 72 -
Chart Pop-up Menu
Double-click any place in the main bar chart and the Chart pop-up menu will open.
Select between the Normal Arrow and the Crosshair cursor. (NOTE: The crosshair will automatically go back to a normal arrow. To make it remain a crosshair, go to the
Global Settings, General tab and check the option . You
can also use the buttons .
Click to use the Zoom/DeZoom
Use the to mark an area that you want to zoom. After the area is selected, click inside the area to zoom on, or click any place outside the selected area to cancel the zoom.
This will open all the Drawing Tools optionchapter).
Sets alarms on specific prices on the charts. Same as Utilities, Ch
Changes time frames of the chart. You can
the bottom right corner of the chart to open this window .will open.
Fibonacci Trader
Marked area
s (see the Drawing Tools
art Alarm.
also click the TF button in
The Time Frame window
- 73 -
Change the time frames and click OK.
Here you can change the symbol used on the chart. You can also do this by clicking on the SY button on the bottom right corner of the chart
The window will open asking for the new symbol. Follow the instructions and click OK.
A template is a complete configuration of a chart. It contains all the characteristics of a chart including systems, indicators, colors and formats.
Fibonacci Trader - 74 -
To save a Template double-click on the chart and select Template, Save or Save As New. Save will replace the actual Template in use with the parameters of the current chart. Save As New will create a new Template with the parameters of the chart in use.
To open a Template, double-click on the chart or press the button. Double-click a template to open it, or highlight the desired template and select Open from the Template menu. You can also access the Template window by pressing F8.
Clicking on the template namewill open the template menu.
When your chart uses a Template, the Template's name will appear on the chart as the last item listed after any indicators or system names. You can also click on the Template name to show the Template menu.
If you set AUTOREPLACE to ON in the Template menu, then any time you alter the chart the Template be saved with your new changes. In addition, every chart that references this same template will be modified to match the newly changed configuration.
Example: Template 1 has a moving average of seven periods. We open Template 1 on charts A and B. Charts A and B now show a moving average of seven periods. We now set AUTOREPLACE to ON in both charts from the template right-click menu. If, at this point, we were to change the moving average in chart A to nine periods and then save Template 1, Template 1 would now have a moving average of nine periods. Chart B would also be updated to reflect this change, as Chart B also uses Template 1 and has AUTOREPLACE set to ON.
To delete an existing Template right-click the Template name and select Delete from the menu. You can also Delete Templates by hitting F8 or selecting the Template button and selecting Delete from the Template menu.
Fibonacci Trader - 75 -
To break a link between a chart and a Template or to hide a Template's name, right-click on the Template name in the chart and select Hide Template Name.
This will open the Create New Chart window.
Will open the zones table for the current symbol. For more information read the High Probabilities Zones Analysis chapter.
Fibonacci Trader is pleased to provide you with ten years of continuous data for your futures contracts. Zone Analysis requires at least five years of daily data in your data file (not the number of bars in memory) in order for the zones to be calculated accurately. Ten years of data is optimal for zone analysis. For stock and indices simply download all the daily bars from your real-time data vendor’s historical data .
This data is provided by Pinnacle Data Corporation. Pinnacle’s data is formatted as a reversed adjusted continuously linked series. Fibonacci Trader does not guarantee the accuracy of this data. This file is not updated every day and will run approximately one month behind your current data. This will not affect the accuracy of the zone calculations or your indicators. If you want to be able to download Pinnacle data every day please contact Pinnacle Data at www.pinnacledata.com. You can import data from other providers if you like. However, you may not get exactly the same results because the data may be linked together using a different method than Pinnacle Data uses. Therefore, Fibonacci Trader cannot guarantee the accuracy of the zones in these cases.
Open a chart of the symbol for which you want to download the data. Double-click anywhere in the background of your chart. Highlight “Zone Data“ from the menu and select “Download.“ Using capital letters, type in the desired futures symbol. Click OK. The data will be automatically downloaded and imported into the symbol’s file.
See the table below for a listing of available symbols.
Market Name Symbol
AUSTRALIAN $$, composite AN
AUSTRALIAN $$, day session AD
BRITISH POUND, composite session BN
BRITISH POUND, day session BP
CAC40 INDEX CA
CANADIAN $$, composite CN
CANADIAN $$, day session CD
CANADIAN 10YR BOND CB
COCOA CC
COFFEE KC
COPPER HG
CORN C
COTTON #2 CT
CRB FUTURES CR
CRUDE OIL CL
DOW JONES EUROSTOXX50 XU
DOW JONES MINI YM
DOW JONES STOXX 50 XX
DOW JONES, composite ZD
DOW JONES, day session DJ
EURO BOBL UB
EURO SCHATZ UZ
EURO, composite FN
EURO, day session FX
EURODOLLARS ED
FED FUNDS FF
FEEDER CATTLE FC
FTSE 100 INDEX LX
GERMAN BOND (BUND) DT
GERMAN DAX INDEX AX
Fibonacci Trader - 77 -
GILT, LONG BOND GS
GOLD (COMMEX) GC
GOLDMAN SAKS C. I. GI
HANG SENG HS
HEATING OIL #2 HO
JAPANESE YEN, composite JN
JAPANESE YEN, day session JY
LIVE CATTLE LC
LIVE HOGS LH
LUMBER LB
MEXICAN PESO MP
MUNI BONDS MB
NASDAQ 100 ND
NASDAQ, MINI EN
NATURAL GAS NG
NIKKEI INDEX NK
NYSE COMP YX
OATS O
ORANGE JUICE JO
PALLADIUM PA
PLATINUM PL
PORK BELLIES PB
ROUGH RICE NR
RUSSELL 2000 RL
S & P 500, composite SC
S & P 500, day session SP
S & P 500, MINI ES
S&P 400 MD
SILVER (COMMEX) SI
SOYBEAN MEAL SM
SOYBEAN OIL BO
SOYBEANS S
STERLING, SHORT SS
SUGAR #11 SB
SWISS FRANC, composite SN
SWISS FRANC, day session SF
T-BILLS, 90 DAYS TB
T-BONDS, composite US
T-BONDS, day session UA
Fibonacci Trader - 78 -
T-NOTE, 10yr composite TY
T-NOTE, 10yr day session TA
T-NOTE, 5yr composite FB
T-NOTE, 5yr day session FA
T-NOTES, 2yr composite TU
T-NOTES, 2yr day session TD
UNLEADED GAS HU
US DOLLAR INDEX DX
WHEAT, CBOT W
WHEAT, KC KW
WHEAT, MINN MW
View Editing Bar Data chapter. Same as button
Click to open the Insert Bar window.
Click on Date and select the date for the new bar.
Enter the time according to the format HH:MM. Enter the Open, High, Low, Close, and Volume for the bar. Then click Save.
Click Exit to close the Insert Bar window.
Fibonacci Trader - 79 -
This will increase or decrease the number of bars on the screen.
You can also use the buttons or press the + and – keys on your keyboard.
Click to open the Sale window.
You can also right-click on the price scale on the chart itself
or click the button .
In the Scale window, the default is Automatic. Changing this to Fix allows you to define the Max and Min value of the scale.
if checked will make all charts for the same symbol use the same scale.
will close and open the Actual Price Scale on the chart.
will make the scale be logarithmic.
The Number of Bars Displayed On Screen allows you to determine how many bars to be displayed at a time. If you check the option Fixed Distance Between Bars then the program will use the Number of Pixels value and the Number Of Bars Displayed On Screen will change as you change the chart size.
Click Font to change the scale of the font.
Open the Chart Options window. Same as click on the button or click the name Fibonacci Trader on the chart itself.
Will open the Print Chart option. Same as click the button .
Same as click the button .
Will open the Values window. Same as click the button .
Fibonacci Trader - 80 -
This will show the value of all indicators in use on the chart.
If you right-click this window you will have the option to change the Font displayed in the window and to keep data fixed on the Last bar.
If Keep Data Fixed On Last Bar is not checked, as you click different bars on the chart you will see the values on this window change to reflect the new clicked bar.
Click and the Chart Note Input box will open.
Type your note. The note will appear on the Charts list, button.
Fibonacci Trader - 81 -
Editing Bar Data When you right-click on a bar the window with the bar information will open.
Here you have the Date, Time, Open, High, Low, Close, Volume and Tick Volume of the bar.
You can use the buttons to move to the Next or Prior bar. If you right-click other bars on the chart, the values shown will change to those for the bar clicked.
If you click the Edit button the window shown on the next picture will open.
Click “Delete All Bars For This Date“ to delete all minute bar data for the displayed date.
Clicking Delete This Bar will delete the currently selected bar.
Change any of the values (Open, High, Low, Close and Volume). Click Exit and the bar values will change.
Click on the One Minute button and the One Minute window will open as shown on the next picture.
Fibonacci Trader - 82 -
The above window shows all the one-minute bars that belong to the five-minute bar that opens at 10:20. Click any of the bars and the values on the right will fill as shown on the next picture.
If you click the Change button, these one-minute bar values will be updated. If you click Insert, a new one-minute bar will be inserted. If you click Delete, the selected one-minute bar will be deleted.
(NOTE: When you change, delete or insert a one-minute bar, all other one-minute bars on other time frames will also be updated.)
Fibonacci Trader - 83 -
Click the Ticks button and the Ticks window will open as show on the next picture.
The above picture show the ticks that start at 13:17:00.
Right-click on any tick.
You can then edit the tick price, edit the volume, delete the tick or delete all ticks that have volume zero.
Fibonacci Trader - 84 -
The Drawing Tools
Action Reaction Draw a main line from an important bottom and top (A-B). Then click on the third point C. This will draw a parallel to A-B through point C as well as a Reaction Line. The Reaction Line is also parallel and is drawn using the same distance between line A-B and point C.
The Action Reaction Parameters window can be used to change the color and thickness of the lines.
Angle Lines These are trend lines that are at a fixed angle. A change of scale on the chart will affect the position of these lines in relation to the price bars.
In the Angle Lines Parameters window you can change the color and thickness of the lines.
Fibonacci Trader - 85 -
Box Information
Use this tool to see the Date, Range, Total Volume and Number Of Bars between two points.
Circle and Ellipse
Click on the Circle or the Ellipse button to create a circle or ellipse.
The parameters for these tools are the same. You can change the outside line color and thickness, as well as the fill color, you can choose if you want to fill the circle or ellipse or not. Finally, you can set to use just price range, just time range or both.
Fibonacci Trader - 86 -
Daniel Lines
To draw the Daniel Lines, draw a main line from A to B, then click on a third point C.
Daniel Lines are simple parallel lines with two retracement lines in between the two parallel lines. These two retracement lines are defined in the Daniel Lines Parameters window. You can also change the colors and thickness of the lines.
Expansion Draw a line (A-B) connecting a major top and bottom then click a third point C. This will create the expansions of the range A-B plotted from point C. The expansions are defined in the Expansions Options window. In this window you can also change the color and thickness of the lines as well as select which lines to show and whether you want to extend the expansions to the end of the chart. You also have the options to draw the values inverted and to show the actual values of each line.
You can delete individual lines on the expansion. Just press and hold down the CONTROL key, then left-click the line you want to delete.
Fibonacci Arcs
Fibonacci Trader - 87 -
Draw a line (A-B) connecting a major top and bottom. This will creates Fibonacci Arcs of the range A-B. The arcs are defined in the Fibo Arcs Options window where you can also change the color and thickness of the lines, select which lines to show and whether you want a full circle or not.
Fibonacci Fan Draw a line (A-B) connecting a major top and bottom. This will create the Fibonacci Fan of the range A-B. The fan is defined in the Fibo Fan Options window. In this window you can also change the color and thickness of the lines as well as select which lines to show and whether you want to see the horizontal lines or not and have the lines extended or not.
Fibonacci Trader - 88 -
Horizontal Line
Click on the Horizontal Price Line button . Click-and-drag the chart. As you move the mouse you will see the value for that line position. Release the mouse and the line will remain on the chart. You can move any line to another place on the chart by clicking and dragging it up and down the chart.
To erase a line, right-click on the line and select Delete. To delete all the horizontal price lines, right-click and select Delete All. To change the color of the lines, right-click on the line and select Color. To link the lines to another chart of the same symbol, right-click on any line and select Link.
Fibonacci Trader - 89 -
Fork
Andrews’ Pitchfork was developed by Alan Andrews.
Create a line (A-B) connecting a major top and bottom, and then click on a third point C. This will create the lines A, B and C shown on the chart to the right.
You have the option of displaying extra lines inside and outside the fork, using up to three different parameters.
FT Price Projection
Draw a line from an important top and bottom (A-B). This will draw the price projections for the next swing. The calculations and projections are based on Fibonacci retracements and time expansions.
The FT Price Projection Parameters window can be used to change the color and thickness of the lines.
Gann Divisions
Fibonacci Trader - 90 -
Drawing the tool from A-B will cause the program to divide the range in the Number Of Zones Selected in the Gann Parameters window.
Fibonacci Trader - 91 -
Gann Fan
Gann Angles are drawn from a bottom or top at various different angles. There are nine significant angles, the 1 x 1 is the most important:
1 x 8 - 82.5 degrees
1 x 4 - 75 degrees
1 x 3 - 71.25 degrees
1 x 2 - 63.75 degrees
1 x 1 - 45 degrees
2 x 1 - 26.25 degrees
3 x 1 - 18.75 degrees
4 x 1 - 15 degrees
8 x 1 - 7.5 degrees
(NOTE: Each of the angles can provide support and resistance depending on the trend. During an up trend the 1 x 1 angle tends to provide major support. A major reversal is signaled when prices fall below the 1 x 1 trendline. As one angle is penetrated it is expected that prices will move to the next angle.)
In the GannFan Parameters window you can change the angle parameter. A zero means no line will be drawn. You can also change the color and thickness of the lines.
Fibonacci Trader - 92 -
Gann Square
Note that you have the Total Range on the right side of the square and the Total Number of Bars on the bottom of the square.
These are up lines and down lines drawn from the left corners of a square (or rectangle) defined by a line drawn from A to B.
The sides are divided by the Divisions number from the Gann Square Parameters window.
Like the Gann Fan, these lines provide support and resistance and, as one angle is penetrated, it is expected that prices will move to the next angle.
In the Parameters window you can change the color and thickness of the lines as well as whether or not you want to extend the lines to the end of the chart.
Fibonacci Trader - 93 -
Gann Square of Nine
The Square of Nine is basically a spiral of numbers. The initial value can be found in the center of the spiral. This value is then increased by moving in a spiral form. Normally the initial center value is one and the step increment is likewise one, creating the spiral shown below.
The numbers that represent a complete turn (0 or 360 degrees) are 2,11,28,53.....
The numbers that represent 1/8 of a turn (45 degrees) are 3,13,31.....
The numbers that represent 1 quarter of a turn (90 degrees) are 4,15,34.....
The numbers that represent a half turn (180 degrees) are 6,19,40.....
Fibonacci Trader - 94 -
The Start value is determined by clicking the mouse on the chart. You can change the Step value in the Parameter window as shown on the Gann SQ9 Parameters picture to the left. You can also select the angles where the price lines and time lines will be plotted, the direction of the plot, and the color and thickness of the lines.
Another way to find a value from a point is to first find the factor for the movement, a complete turn for a factor is 2, 7/8 of a turn or 315 degrees the factor is 1.75, ¾ of a turn or 270 degrees the factor if 1.5, 225 degrees the factor is 1.25, 180 degrees the factor is 1...., for 45 degrees the factor is 0.25.
For example, choose a start number (for example 40), take its square root (in this case 6.3245), add the factor to go forward or subtract the factor to go backwards. If you want to go forward 225 degrees from 40 we need to add 1.25 to 6.3245 which gives you 7.5745 and then re-square (7.5745^2 = 57.37). 57 is the number 225 degrees forward from the number 40.
This second way is active when you have the option ‘Use Square Formula’ checked.
Fibonacci Trader - 95 -
Least Square
When using the option AUTO from the Based On menu, the program will use the highs on an up trend center line and the lows on a down trend center line.
As you select A to B, the program will draw a Least Square Line ‘C’ and the 2-channel line using the Number of Standard Deviations defined in the Least Square Channel window. In this window you can also choose the color and thickness for the lines as well as the base for the calculation of the Least Square Line.
If you right-click on the main line C, a menu will appear with the options to Delete, Edit or Set an Alarm for the channel.
The three possible alarms are:
1. Set the alarm to None.
2. Set the alarm to go off on a bar that closes past the top or below the bottom channel lines.
3. Set the alarm to go off on a bar that crosses the top or bottom channel lines.
Once the alarm is triggered, it will be set to NONE automatically
Magnet Turning the magnet on or off will make the drawing tools snap to the nearest high or low point of the nearest bar.
Fibonacci Trader - 96 -
Price Line This is just a quick tool to find a value on the chart. Click
on the Price Line button . Go to the chart and click-and-drag it. As you move the mouse you will see the value for that line position.
Price Square
Draw a main line between an important bottom and top (A-B). A triangle A-B-C will be created. From point C a line parallel to A-B will appear.
The Price Square Parameters window can be used to change the color and thickness of the lines.
Retracement
Fibonacci Trader - 97 -
You can delete individual lines on the expansion. To do that, press and hold down the CONTROL key on your keyboard, then left-click the line you want to delete.
Draw a line from A to B connecting a major top and bottom. This will create the retracement lines for the range A-B. The retracements are defined in the Retracement Parameters window. You can change the
color and thickness of the lines. Select to extend the retracements to the end of the chart and
select to show the retracement values. You can change or add values. Values greater than one (>1) will work as an expansion of the range A-B.
In the Retracement menu you also have the options to Link retracements to charts of the same symbol.
Fibonacci Trader - 98 -
The Retracement that appears on the 78-minute chart is from the Daily chart. If you move or resize any of these retracements the other will also move or resize.
Export will copy the Retracement lines of the current chart to the other chart of the same symbol, but the lines will be all independent and not linked.
Export and Replace will convert the Retracement lines of the current chart to independent lines and export the same lines to other charts of the same symbol.
Text
Click on the Text button. This will open the window where you can enter the text you want to insert into a chart. Type the text, then click OK. Go to the chart and click where you want the text to appear.
Right-click on the text and a menu will appear allowing you to Delete, Edit, Duplicate or Change the font.
You can use the button to delete all or some selected texts.
The button is used to change the default font on the selected chart.
Fibonacci Trader - 99 -
Trend Line
Click on the Trend Line button. Go to the chart and click where you want to start the trend line, then drag to where you want it to end.
If you right-click on a trend line. a menu will appear with the options Edit, Delete, Delete All, Parallel, and Extend.
In the Trend Line Parameters window you can change the line color and thickness.
Time Cycle
Select the Time Cycle button. Go to a chart and click where you want the cycle to start. Right-clicking on the first line will call up a menu allowing you to Edit, Delete or Delete All. Select Edit to change the length and color of the cycle
Fibonacci Trader - 100 -
Time Expansion
Draw a line from A to B and the program will project time lines using the ratios above. Right-clicking on the first line (A) will call up a menu allowing you to edit or delete the selected tool or to delete all tools of this type.
Fibonacci Trader - 101 -
Vertical Line
Click on the Vertical Price Line button. Go to the chart, click-and-drag it. You can move any line to another place on the chart by clicking and dragging it left or right.
To erase a line, right-click on the line and select Delete. To delete all the vertical lines, right-click on any vertical line and select Delete All. To change the color of a line, right-click on the line and select Edit.
Zoom
Click on the Zoom button . Go to a chart and draw a box from right to left where you want to zoom in. To zoom in, click inside the box you just drew. To zoom out, click on the Zoom Out
button .
Fibonacci Trader - 102 -
The Indicators
Divergences To show the divergences on the chart right-click on the indicator you want, click Divergences then on the line name to show divergences, on the picture bellow if you click on Stochastic RSI this indicator line will have the divergences shown.
The next picture shows arrows in light red for regular divergence with trend reversal from up to down, light green for regular divergence with trend reversal from down to up, dark red for hidden divergence with trend reversal from up to down, and dark green for a hidden divergence with trend reversal from down to up. These colors and lines can be changed in the Divergences Parameters window.
To change the parameters of the divergences click on the Parameters option .
The Divergences Parameters window will appear.
Fibonacci Trader - 103 -
You will set the parameters for the divergence lines in the Lines section. If you have the option ‘Use indicator line color’ checked, the divergences lines will be displayed in the same color as the indicator line.
Divergences are normally calculated using the highs and lows of bars. The option Use Close will calculate the divergence using just the bar’s close.
Fibonacci Trader - 104 -
High Probability Zone Analysis. Fibonacci Trader has the “High Probability Fibonacci Zone Analysis” and the “Zone Analysis” (John Jackson) built in:
On any chart where the OWN period is “intraday” and the NEXT period is “daily” you can have the probability zones percentages on your screen.
Note: You do not need to buy tables from us. Fibonacci Trader will do all the calculations by itself based on your daily data.
It is very important to look at the “# DAILY BARS” number. This is the number of daily bars that the software is using to create all the statistics for the zones. A low number of bars will give statistically invalid information. Therefore, it is strongly recommended that you have at least 1000 daily bars in your data file.
Press the icon above to toggle the Fibonacci Zones Next Period On or Off. These zones show possible support and resistance areas.
Fibonacci Trader - 105 -
When you press this button on an INTRADAY/DAILY/WEEKLY chart the actual High Probability Fibonacci Zones table for the active symbol will show on the screen.
The Fibonacci Zones are calculated using the daily data for the symbol. The number of bars used to calculate the probabilities is shown in the Probability Matrix.
Example: #DAILY BARS 2525, means the program is using 2525 bars of INTC day daily data.
Important: We recommend that you have a minimum of 5 years of daily data for the symbol (around 1200 bars) to have more accurate probabilities.
The CLOSE-OPEN zone designations are defined as follows:
CLOSE ZONE = 3, means that the daily bar closed on the previous day zone 3.
OPEN ZONE = 4, means that the daily bar opened today in zone 3.
therefore the second the market opens things occur.
The Fibonacci Zone probabilities are calculated and they are displayed in the Probabilities Matrix.
The opening zone will be highlighted in blue. As the prices move from zone to zone, the zones will be highlighted by the blue vertical strip.
Fibonacci Trader - 106 -
Fibonacci Trader - 107 -
In the example there are 3 horizontal lines showing percentages the Resistance, Support and Reached.
On the opening of each day the Zone Matrix will display the probabilities for that day. Some days there will be useful opportunities and other days there will be none.
It is important that you use these High Probabilities Fibonacci Zones in combination with other technical tools and not as a stand alone trading plan.
Because it is not a technical tool in the normal sense of the word, combining the Fibonacci Zone Analysis with other technical tolls can highlight opportunities not really visible by themselves.
Actually it is a statistical analysis of zone pattern probabilities based on comparing yesterday's close and today's open.
This tends to display potentially profitable trading situations, by answering 3 questions.
1. How often will prices reach a specific zone.
2. If prices reach a higher zone, how often will that be the high zone for that day.
3. If prices reach a lower zone, how often will that be the low zone of the day.
For more information please read the Fibonacci Trader Journal # 14 on www.fibonaccitrader.com.