44


University of Brighton Carbon Management Plan Page 1
Date: July 2017 Version number: 1.3 Owner: Abigail Dombey, Environmental Manager Approval route: Carbon Management Programme Board; Management Group, Board of Governors; Finance and Employment Committee Approval status: Approved by the Finance and Employment Committee

University of Brighton Carbon Management Plan Page 2
Contents
1. Introduction 3
2. Carbon Management Strategy 5 2.1 Context and drivers for Carbon Management 5 2.2 Strategic Themes 6 2.3 Targets and objectives 8
3. Emissions Baseline and Projections 13 3.1 Scope 13 3.2 Baseline 14 3.3 Projections and Value at Stake 17
4. Carbon Management Projects 19 4.1 Completed projects 2010-2016 19 4.2 Proposed projects 2016/2017-2020/2021 20
5. Carbon Management Plan Financing 22 5.1 Assumptions 22 5.2 Benefits / savings – quantified and un-quantified 22 5.3 Additional resources 23
6. Actions to Embed Carbon Management at the University 24 6.1 Policy – embedding CO2 saving across the University 24 6.2 Responsibility – being clear that saving carbon is part of everyone’s job 25 6.3 Data Management – measuring the difference, measuring the benefit 25 6.4 Communication and the c-change campaign 25 6.5 Procurement – engaging buyers and suppliers 26 6.6 Monitoring and Evaluation – keeping track of progress 26
7. Programme Management of the CM Programme 27 7.1 The Sustainability Governance Board – strategic ownership and oversight 27 7.2 The Environment Team – delivering the projects 28 7.3 Continuity planning for key roles 29 7.4 Ongoing stakeholder management 29 7.5 Annual progress review to University Executive Board 30
Appendix A: Carbon Management Embedding Matrix 31
Appendix B: Carbon Management Programme Stakeholder map 32
Appendix C: Example Project Highlight Report 35
Appendix D: Gantt Chart Project Timeline and Activities from solar PV installation December 2015 – January 2016 43

University of Brighton Carbon Management Plan Page 3
1. Introduction
The University of Brighton is a community of over 21,000 students and 2,800 staff based on five campuses in Brighton, Eastbourne and Hastings. With an extremely strong teaching and research record, Brighton has a reputation as a leading post-1992 university.
The five campuses house over one hundred buildings comprising of over 150,000m2 of property, including 1,034 bed spaces in university halls of residence. Buildings within the estate range in size from only 81m2 (Gross Internal Area (GIA)) to over 15,000m2 (GIA) for the Cockcroft building in Moulsecoomb.
The University of Brighton recognises that climate change is a real and growing threat and acknowledges that the University has the responsibility to ensure environmentally and socially responsible practices in all its activities. The University has adopted Sustainability as one of its four core values, set out in the University Strategy (2016-21). This states that “We recognise and value the critical importance sustainability has for the future of our students, staff, partners and community. Whether it’s through buildings of the future ... or the long-lasting knowledge and support we give our students and staff – sustainability will be highly valued, underpinning the decisions we make and the activities we do, now and in the future”.
The University has already made a lot of progress in embedding sustainability in its institutional practices, its teaching and research and its links with business and communities. The University is working towards developing an estate which is environmentally excellent, meeting the needs of students and staff without compromising the quality of life of future generations.
In recent years, the University has invested heavily in a dedicated Environment Team, who lead on carbon reduction, engagement and sustainability projects across the University. The team, which grew from a single role in 2009, now compromises of six members of staff who lead on energy and environmental management, sustainable travel initiatives, waste reduction and recycling and delivering staff and student engagement projects through the award-winning c-change campaign.
In addition, the University makes a further contribution to sustainability by the way it performs as a business and engages positively with the local and wider community. If sustainability is to be achieved, economic, social and environmental goals must be progressed simultaneously. It aims to become a centre of excellence in building sustainability into research, teaching and learning and work with local, regional, national and global bodies to help build sustainable learning communities.
A long-standing feature of research at Brighton has involved identifying how technology, ideas, innovation and organisational change in a range of social, business, educational and creative contexts can be management better and designed to contribute to economic growth, improved environments and a more inclusive society. Our future research investments will aim to create knowledge and interventions that change political, scientific, artistic, education, legal and business cultures. Our researchers will also generate new ideas for managing responsible change in policy, business and the voluntary sector. Our Responsible Futures research will contribute to the creation of a more just and environmentally sustainable society.
As Lord Nicholas Stern, the economist and climate change expert who received an Honorary Doctor of Science degree from the University of Brighton, said in an interview with the university’s Channel magazine in September 2009: “Universities have a unique role to play, through their research and teaching, in understanding and managing climate change and shaping public policy. Teaching and working with students, the next generation of leaders and thinkers, to provide them with the required knowledge and skills, is crucial. It is they who will ultimately manage climate change and guide our transformation to a more sustainable future. Universities also have an opportunity and a responsibility to educate beyond their lecture halls, to share their ideas with the wider community, and to work more closely with policy-makers.”

University of Brighton Carbon Management Plan Page 4
In revising this Carbon Management Plan, the University wishes to:
- build on the success of the university’s carbon reduction projects from earlier versions of the Carbon Management Plan;
- continue to monitor carbon emissions and regularly report on progress towards carbon reduction targets;
- ensure that carbon reduction is embedded within all activities and procedures across all campuses;
- continue to identify and quantify the carbon impact of the University through its operations;
- build on existing energy, waste and water management practices to minimise the University’s impacts on the environment;
- continue to monitor and fully integrate travel and transport data into baseline studies;
- inform and direct actions taken by the University in reducing its carbon emissions, to realise a 2020 target.
Key achievements to date:
- installing a state-of-the-art energy efficient water cooled data centre at Watts building to replace the previous data centre;
- carrying out enhancements to the Building energy Management System (BMS) across the University estate to maximise efficiency when heating and ventilating its buildings;
- replacing existing lighting with energy efficient LED lighting in high usage areas;
- installing 434 kWp solar PV panels across the estate;
- installing Combined Heat and Power (CHP) systems in academic and residential buildings;
- installing Dynamic Burner Management Units across the estate;
- replacing boiler burners with efficient fully modulating burners;
- formulating campus specific Travel Plans and an overarching Sustainable Travel Plan Strategy;
- ensuring that all new buildings achieve BREEAM excellent ratings;
- developing c-change, an award-winning sustainable behaviour change and engagement programme.

University of Brighton Carbon Management Plan Page 5
2. Carbon Management Strategy
The University of Brighton recognises that it has a responsibility to ensure financially sound, environmentally and socially responsible operational practices in all its activities. The way in which the estate is managed and developed will impact greatly on both the University’s abilities to satisfy these principles and to operate in a sustainable manner.
2.1 Context and drivers for Carbon Management
Climate Change: the broad context for this Carbon Management Programme is the irrefutable evidence for global climate change and that greenhouse gases are the primary driver of that change.
Against this background, concerted action is required to reduce the emissions of CO2 and other greenhouse gases.
The Climate Change Act 2008: commits the UK to a legally binding reduction in CO2 emissions of 34% by 2020, and an 80% reduction in greenhouse gas emissions by 2050, both compared with 1990 levels. The public sector is expected to lead the way towards meeting the targets.
HEFCE Carbon Reduction Strategy: in January 2010, the Higher Education sector, together with HEFCE, agreed CO2 reduction targets for the sector as a whole, in line with the UK’s Climate Change targets. The target of 34% reduction of CO2 by 2020 (against 1990 figures) was adopted. This is equivalent to a 43% reduction against a 2005/06 baseline.
Capital Funding: HEFCE have also linked capital funding to carbon management via the Capital Investment Framework (CIF2) for HE institutions; if universities do not produce a credible Carbon Management Plan, signed off by their executive body, HEFCE will withhold 40% of a university’s capital funding.
CRC Energy Efficiency Scheme (CRC): the CRC is a mandatory carbon emissions reduction scheme that applies to large non-energy-intensive organisations in the public and private sectors in the UK. The University currently pays approximately £170,000 per year to the CRC.
Energy costs and energy security: investment in energy efficiency projects reduces future costs and risk of budget variance as well as carbon emissions. Long-term measures to increase energy security at a local level centre on reducing dependence on any one source of imported energy, exploiting renewable energy resources, and reducing overall demand through efficiency projects measures.
Doing the right thing: Many staff and students have become increasingly aware of climate change, the environment and the drive to be more sustainable, for instance through engagement campaigns such as c-change, the university’s internal behaviour change campaign, and will respond positively to the university’s efforts to reduce carbon emissions.
Competition and Brand: The marketing position and increasing appeal for future staff and students is important for the university. Being sustainable has been shown to attract potential students and prospective employees. A more sustainable environment also brings local communities together and can attract more local business.
Existing objectives, plans and policies: The University has adopted Sustainability as one of its four core values, set out in the University Strategy (2016-21), and has integrated carbon management within existing development plans and policies, such as the Estates Strategy, the Sustainability Plan and the Environmental Policy. The University’s carbon reduction targets have also been included in the specifications for all capital projects, including the proposed multi-million pound development at

University of Brighton Carbon Management Plan Page 6
Moulsecoomb. Integration ensures that carbon reductions and cost savings are maximised and that carbon management continues to be implemented in the long term.
The benefits the Carbon Management Programme will bring are many. The key benefits are:
Reduce the University’s carbon emissions.
Contain rising costs related to energy, water, waste management and vehicle use.
Embed low carbon thinking throughout the University.
Create a more comfortable environment for staff and students and improve their satisfaction levels.
Enhance the University’s reputation by promoting a sustainability agenda and implementing it, and also in its honest reporting of successes and failures.
Further benefits include:
By becoming a leading university for embedding sustainability, this can better prepare the University for future legislative changes in order to keep a step ahead and indeed potentially help shape that legislative change.
Improve staff and student motivation and staff retention. Involving staff and students in devising and implementing carbon-related sustainability projects gives them the ability to “make a difference”, as well as enabling the University to benefit from their personal insight.
Enhance curriculum development. Learnings taken from the experience of carrying out carbon reduction projects provide input into courses in the areas of Engineering, Business Studies, Strategy as well as Environment and Technology.
Helping provide students with the required knowledge and skills to help f climate change and guide our transformation to a more sustainable future.
The Carbon Management Programme will work towards making the University’s supply chain operate with sustainability in mind. As an organisation with a sizable spend with a diverse supply chain, procuring sustainably, particularly in reference to low carbon solutions, will drive suppliers to innovative and reduce their own emissions and waste.
The Carbon Management Programme could provide a structure for implementing IS0 50001 Energy Management System.
The programme has also provided impetus for implementing ISO14001 Environmental Management System, whereby the University demonstrates legal and regulatory compliance, better management of environmental risks and increased environmental awareness and participation.
The University has adopted Sustainability as one of its four core values, set out in the University Strategy (2016-21), and implementing the Carbon Management Plan plays a key role in embedding sustainability as a whole across the University.
2.2 Strategic Themes
The key strategies in the university’s Carbon Management Plan are:
Governance
Carbon management will be embedded into decision making across all areas of the University, and will continue to be integrated within existing development plans and policies, such as the Estates Strategy, the Sustainability Plan and the Environmental Policy. This ensures that carbon reductions and cost savings are maximised and that carbon management continues to be implemented in the long term. The Environment Team oversee all significant carbon related projects across the institution.
Social Responsibility / Behavioural Change
The Environment Team will continue to raise awareness about climate change and engage staff and students across the University to participate in the carbon reduction and wider sustainability initiatives through workshops, presentations, forums and initiatives, including the c-change campaign.

University of Brighton Carbon Management Plan Page 7
In this way staff and students will be empowered and encouraged to contribute towards carbon reduction, both within the University arena and within their own lives. The Programme will work in both a top-down and bottom-up approach; actively supported by the University Executive Board, Directors and Heads of Schools, and in conjunction with existing forums such as the Environmental Action Networks, and Green Impact teams which engage staff and students from the bottom-up.
Learning and Teaching
Working with academic staff and the Centre for Learning and Teaching, the Carbon Management Programme will be included in different courses across the University’s curriculum to help equip students with the required knowledge and skills to work towards managing climate change. Sustainable development is already integrated into new courses, where appropriate, as they are developed, and into present curricula as courses are reviewed; the Carbon Management Programme can be introduced alongside as a facet of Sustainable Development.
Academics will be engaged to promote carbon management as part of their academic activities; learning and teaching awards will consider a carbon management theme; stronger links will also be forged between academics and central departments (particularly Estates and Facilities Management).
Procurement
The University’s Procurement Strategy 2015-19, sets out the vision for procurement at the University, including embedding life cycle analysis into best practice and the commitment to produce annual procurement plans which identify sustainability opportunities.
Information Technology
The University will implement strategies that employ technology to bring savings such as a new centralised data centre replacing existing localised centres; server virtualization, and automated shutdown of desktop computers.
Physical Environment
The University is currently updating its Estates Strategy and has set targets (included in the Environmental Policy) to achieve BREEAM ‘Excellent’ for new buildings and BREEAM ‘Very Good’ for substantial refurbishment works. Where refurbishment works are more limited in scale, we would ensure that these respect the aspirations of the University’s wider environmental standards.
Given the size and number of individual buildings that make up the University’s estate, we will assess their individual characteristics and provide a response based on the buildings being suitable for refurbishment on both sustainable and economic grounds. Moth-balling or disposal of particularly inefficient buildings may be considered.
The Space Management Group continues to review the existing use of space across both academic and administrative functions across the University. Improvements in the efficient use of the estate are considered a key success factor to ensure that buildings are used more effectively, which in turn will help reduce the University’s carbon emissions.
Business Travel & Commuting
Staff and students are encouraged to use sustainable transport methods, including walking, cycling, public transport and car sharing, and are supported by the Environment Team in exploring their options for this. They are also encouraged to reduce numbers of trips (especially single occupancy) and collaborate on the travel plan.

University of Brighton Carbon Management Plan Page 8
2.3 Targets and objectives
Following a consultation process led by HEFCE, the Higher Education sector adopted the carbon reduction target, in line with the national targets, of 34% by 2020 (against 1990 figures). This is equivalent to a 43% reduction against 2005/06 emission levels.
The Carbon Management Programme Board (now Sustainability Governance Board) adopted a target for 2020/21 of a 55% absolute reduction for non-residential emissions against the 2009/2010 baseline (equivalent to a 49% absolute reduction from 2005/06 emission levels). An interim target was also agreed of a 50% reduction by 2015/16 against a 2009/2010 baseline by 2015/16 (equivalent to a 43% reduction from 2005/06 emissions levels).
Reduction Target 2015/16 Interim Target 2020/21 Target
Against 2009/10 Baseline 50% reduction 55% reduction
Against 2005/06 Baseline 43% reduction 49% reduction
The University has significantly increased its provision of university managed residential accommodation since the original Carbon Management Plan was written in 2011. The number of bedspaces is set to increase by over 100% from 966 in 2009/10 to 2,027 in September 2020, and the associated energy demands of the halls of residence is set to increase accordingly.
In order to take into account this substantial increase in accommodation provision, the Board set a relative reduction target for university-managed residential emissions of 50% reduction per residential bed space by 2015/16, and 55% reduction per bed space by 2020
1 The emissions data for 2005/06 are not complete, and do not include emissions from waste or University vehicles.
Non- Residential
Estate
2005/06 Actual
Emissions
2009/10 Actual
Emissions
2015/16 Target 50% absolute
reduction from 2009/10
2015/16 Actual
Emissions
2020/21 Target: 55% absolute
reduction from 2009/10 baseline
Total emissions (tonnes CO2)
9,0311 9,840 4,920 8,300 4,428
University- Managed
Residential Estate
2005/06 Actual
Emissions
2009/10 Actual Emissions
2015/16 Target 50% reduction per bed space from 2009/10
2015/16 Actual
Emissions
2020/2021 Target
55% reduction per bed space from 2009/10
No. bed spaces
956 956 1,034 1,034 2,027
CO2 emissions per bed space (tCO2/bed)
1.93 1.59 0.80 1.49 0.72
Total emissions (tonnes CO2)
1,842 1,524 822 1,543 1,454

University of Brighton Carbon Management Plan Page 9
The University’s carbon reduction target for the entire UoB estate is outlined below. This includes non-residential and residential energy consumption, waste, water and wastewater, University-owned vehicles and vehicular business mileage. Total Estate
2005/2006 Actual
Emissions
2009/2010 Actual Emissions
2015/2016 Actual Emissions
2020/2021 Target
Total Emissions (tCO2) 10,873 12,066 10,093 5,882
The table above shows that absolute carbon emissions have decreased by 16.5% from 2009/2010 to 2015/2016.
-
2,000
4,000
6,000
8,000
10,000
12,000
tCO2e
Carbon Emissions, Overall UoB Estate (tCO2e)
2009/2010 Baseline 2020/2021 Target
CMP Reduction Target Actual Emissions

University of Brighton Carbon Management Plan Page 10
Business Air Travel
It is calculated that staff and student air travel on university business / field trips was estimated to be responsible for around 3,200 tonnes CO2 per year as of 2013/2014 (10% of the University’s total footprint).
The Board adopted a target to reduce carbon emissions from business air travel by 5% per student FTE by 2020/2021. Internal flights are discouraged, in favour of travelling by train, and encouragement is given for European journeys to be made by Eurostar where possible, and for field trips to consider coach travel. Business Air Travel
2013/2014 Actual Emissions
2020/2021 Target
Total Emissions (tCO2e) 3,205.0
Students FTE 15,780
kgCO2e/Student FTE 203.1 192.95
Commuting
The University actively encourages sustainable commuting in order to reduce its carbon emissions and other associated vehicle emissions. A target was set to reduce the total annual emissions from the daily commute by 35% per student FTE by the end of academic year 2020/21, based on a 2013/14 baseline, with an interim reduction target of 10% per student FTE by 2015/16. The table below shows that this interim target has been exceeded, with the University already achieving a 14.5% reduction in emissions from 2013/2014 levels.
Student & Staff Commuting
2013/2014 Actual Emissions
2015/2016 Actual Emissions
2020/2021 Target
Student Emissions (tCO2e) 5,257.6 4,564.0 3,090*
Staff Emissions (tCO2e) 1,595.9 1,717.4 1,355*
Total Emissions (tCO2e) 6,853.5 6,281.4 4,445*
Students FTE 15,780 16,915.0
Total Emissions per Student FTE (kgCO2e/FTE)
434.3 371.4 282
* Based on a student FTE of 15,780 (2013/14 Baseline)

University of Brighton Carbon Management Plan Page 11
Waste
Emissions from waste also contribute to the University’s overall carbon footprint. A target was set to
reduce the total annual emissions from waste (including construction waste) by 25% per student FTE by
the end of academic year 2020/21, based on a 2013/14 baseline, with an interim target of a 10%
reduction by 2015/16. The table below shows that this interim target has been exceeded, with the
University already achieving a 20% reduction in emissions from 2013/2014 levels.
Waste
2013/2014 Actual Emissions
2015/2016 Target
2015/2016 Actual Emissions
2020/2021 Target
Total Emissions (tCO2e)
18.9 18.3 16.2
Students FTE 15,780 16,915 16,915
kgCO2e/Student FTE 1.20 1.08 0.96 0.90
Water emissions
Emissions from water occur through the supply of water to a site as well as for the removal of
wastewater from the site. The University set a target to reduce the total annual emissions from water
and wastewater by 20% per student FTE by the end of academic year 2020/21, based on a 2013/14
baseline, with an interim target to reduce emissions by 5% by 2015/16.
The table below shows that over the period 2013/14 - 2015/16, water emissions per student FTE
actually decreased by 21.7%.
Water Supply and Wastewater
2013/2014 Actual Emissions
2015/2016 Target
2015/2016 Actual Emissions
2020/2021 Target
Total Emissions (tCO2e)
116.1 110.2 97.4
Students FTE 15,780 15,780 16,915.0
kgCO2e/Student FTE 7.35 6.98 5.76 5.88
Supply Chain (Procurement)
Emissions from the supply chain (procurement) have been calculated using HEFCE’s model based on
spend data. The emissions from procurement dominate the University’s 2009/2010 baseline footprint,
accounting for over 16,500 tCO2; 57% of the university’s total emissions. The same is true in
2015/2016, where the 19,007 tCO2e procurement emissions represent 59% of the total.
A decision was made to remove capital expenditure from the calculations, as it was felt that including
the carbon emissions from capital projects such as the Varley Halls development and the Cockcroft
Refurbishment was resulting in an abnormal spend profile.
Some categories of spend carry a higher weighting than others in the HEFCE model; these are the
areas that have therefore been targeted. The Board adopted a target to reduce the carbon emissions
from procurement in the categories with a high weighting (of 1 or over) by 10% per student FTE by
2020/21. The table below shows that procurement emissions per student FTE increased by 5.8% from

University of Brighton Carbon Management Plan Page 12
The University of Brighton will embed cutting edge Carbon Management Practice into its culture and daily life.
The University has set the following targets1 for 2020/21: to reduce its CO2 emissions from its academic estate by 55% from its residential estate by 55% per residential bedspace;
from business travel (air travel) by 5% per student; from student & staff daily commutes2 by 35% per student,
from waste3 by 25% per student; from water4 by 20% per student;
and from procurement5 by per student by 10% per student.
2009/2010 to 2015/2016. However, it is worth noting that the methodology for calculating procurement
emissions may have changed over this time, and that the comprehensiveness of the data may also
have improved, possibly increasing the measured procurement emissions.
Procurement (Excluding Construction)
2009/2010
Actual Emissions
2010/2011
Actual Emissions
2015/2016
Actual Emissions
2020/2021
Target
Total Emissions
(tCO2e) 16,549 17,049 19,007
Students FTE 15,584 15,707 16,915
tCO2e/Student FTE 1.06 1.09 1.12 0.96
1 from the 2009/10 baseline unless stated otherwise 2 from a 13/14 baseline 3 from a 13/14 baseline 4 from a 13/14 baseline 5 excluding construction

University of Brighton Carbon Management Plan Page 13
3. Emissions Baseline and Projections
3.1 Scope
In order to take a more strategic approach to carbon management, the University has quantified its
baseline annual carbon emissions as a starting point against which to measure future performance.
The emission sources included in the baseline calculation are detailed below. The scope definitions are
from the World Resource Institute, and have been adopted by HEFCE:
Scope 1 Emissions (direct emissions)
Gas (in academic buildings and university-managed halls of residence)
Fuel for university vehicles (diesel and petrol)
Fugitive emissions (leakage of refrigerants which are greenhouse gases)
Scope 2 Emissions (indirect emissions)
Generated from electricity consumed (in academic buildings and university-managed halls of
residence)
Scope 3 Emissions (other indirect emissions)
Waste to landfill (and recycling)
Water use
Business car travel (car travel reimbursed to staff)
Business air travel (staff and students)
Procurement
Sources of emissions not included in this programme but will be considered for future inclusion are:
Externally-managed halls of residence
Commuter travel
Visitor / contractor / supplier travel

University of Brighton Carbon Management Plan Page 14
3.2 Baseline
The University’s carbon emissions baseline year is the academic year 2009/2010 (1st August 2009 –
31st July 2010). This year was chosen as it provided the most recent and most accurate data at the time
of producing the first Carbon Management Plan, and also showed the University in its latest status of
growth, following extensive construction work at the Falmer campus, and the construction of the Huxley
building at Moulsecoomb.
University Academic Buildings
University Managed Halls of Residence
Externally Managed2 Halls of Residence
University Vehicles & Business Car Travel
Waste and Water
Business Air Travel
Supply Chain
(Procurement)
Total
1 August 2009 - 31 July 2010
Baseline CO2 emissions (tonnes)
9,840 1,524 1,685 370 332 1,894 16,549 32,194
% Total CO2 Footprint
30.6% 4.7% 5.2% 1.2% 1.0% 5.9% 51.4% 100%
1 August 2015 - 31 July 2016
CO2 emissions (tonnes)
8,300 1,543 1,203 137 114 3,205 19,007 33,509
% Total CO2 Footprint
24.8% 4.6% 3.6% 0.4% 0.3% 9.6% 56.7% 100%
Table 3.1 Total measured emissions for 2009/2010 and 2015/16
Externally-Managed Halls of Residence
A number of the University’s halls of residence are managed by third parties on behalf of the University:
Paddock Field and Great Wilkins at Falmer, Welkin Hall in Eastbourne and Robert Tressell in Hastings.
As the University only has limited influence on low-carbon investment within these halls, it was deemed
unrealistic to include these externally-managed halls in the University’s ambitious carbon reduction
target.
Therefore, whilst all cross-university campaigns, such as c-change campaigns, are and will continue to
include all halls of residence, only the university-managed halls will be included within the overall target.
The University’s baseline emissions which are covered by its overall carbon reduction target therefore
includes emissions from academic buildings, university-managed halls of residence, fuel for university
vehicles and business travel, and emissions due to waste generation and water use.
2 Not included in the University’s Carbon Reduction Target

University of Brighton Carbon Management Plan Page 15
University Buildings
(Academic)
University Managed Halls of
Residence
University Vehicles & Business
Car Travel
Waste and Water
Business Air Travel
Supply Chain (Procurement)
Total
1 August 2009 - 31 July 2010
9,840 1,524 370 332 1,894 16,549 30,509
1 August 2015 - 31 July 2016
8,300 1,543 137 114 3,205 19,007 32,306
Table 3.2 Summary table of baseline emissions included within overall carbon reduction target 2009/2010 and emissions as of 2015/2016
Notes:
- There is currently no accurate data for the fugitive emissions (refrigeration leakage – Scope 1). This
will be addressed as a specific project as part of the Carbon Management Programme.
- The carbon footprint associated with travel is expected to grow as our data collection in this area
improves.
- The carbon emission figures included throughout this report have been assessed using the Carbon
Trust’s CO2 conversion factors. These are slightly different to the conversion factors used when
reporting the Estate Management Statistics to HESA; there will therefore be small differences in
CO2 emissions for the two sets of statistics.
- As mentioned above, the emissions data for 2005/06 are incomplete. There is no reliable
information on vehicle fleet or waste generation from 2005/06.
- The 2009/10 baseline is much more robust and contains this data.
5.0% 4.8%3.8% 3.1%
16.7%12.4%
5.6%
4.3%
5.1%
4.3%
1.0%1.6%
1.2%
0.4%
6.2%
9.9%
1.1%
0.4%
54.2%58.8%
0%
10%
20%
30%
40%
50%
60%
70%
80%
90%
100%
2009/2010 2015/2016
Contribution to Total Carbon Footprint
Procurement (excl. construction)
Waste+Water
Business Air Travel
Business Car Travel and UniversityVehicles
Hastings
Eastbourne
Falmer
Moulsecoomb
City Campus

University of Brighton Carbon Management Plan Page 16
The emissions from procurement clearly dominate the University’s footprint, accounting for 54% of the
total emissions. Out of the university estate, the Moulsecoomb campus has by far the greatest
contribution, which corresponds with its position of having the most energy-intensive buildings, including
the Watts building which houses the University’s Data Centre, and both the Cockcroft and Huxley
buildings which contain a large number of science laboratories.
Category GIA (m2) tCO2 2009/10 kg CO2/m2 %
Buildings
Residential 26,453 1,524 57.6 5.0%
Grand Parade 18,346 1,162 63.4 3.8%
Moulsecoomb 50,091 5,101 101.8 16.7%
Falmer 26,041 1,710 65.7 5.6%
Eastbourne 25,865 1,561 60.4 5.1%
Hastings 3,813 306 80.3 1.0%
Transport
Fleet - 76 0.2%
Business car - 294 1.0%
Business air - 1,894 6.2%
Further Scope
Refrigerant - 03 0%
Waste - 294 1.0%
Water - 38 0.2%
Procurement - 16,549 54.2%
30,509 100.00%
Table 3.3: Table of emissions for baseline year 2009/10
3 There is currently no accurate data for the refrigeration leakage
University of Brighton Carbon Management Plan Page 17
3.3 Projections and Value at Stake
Carbon Value at Stake
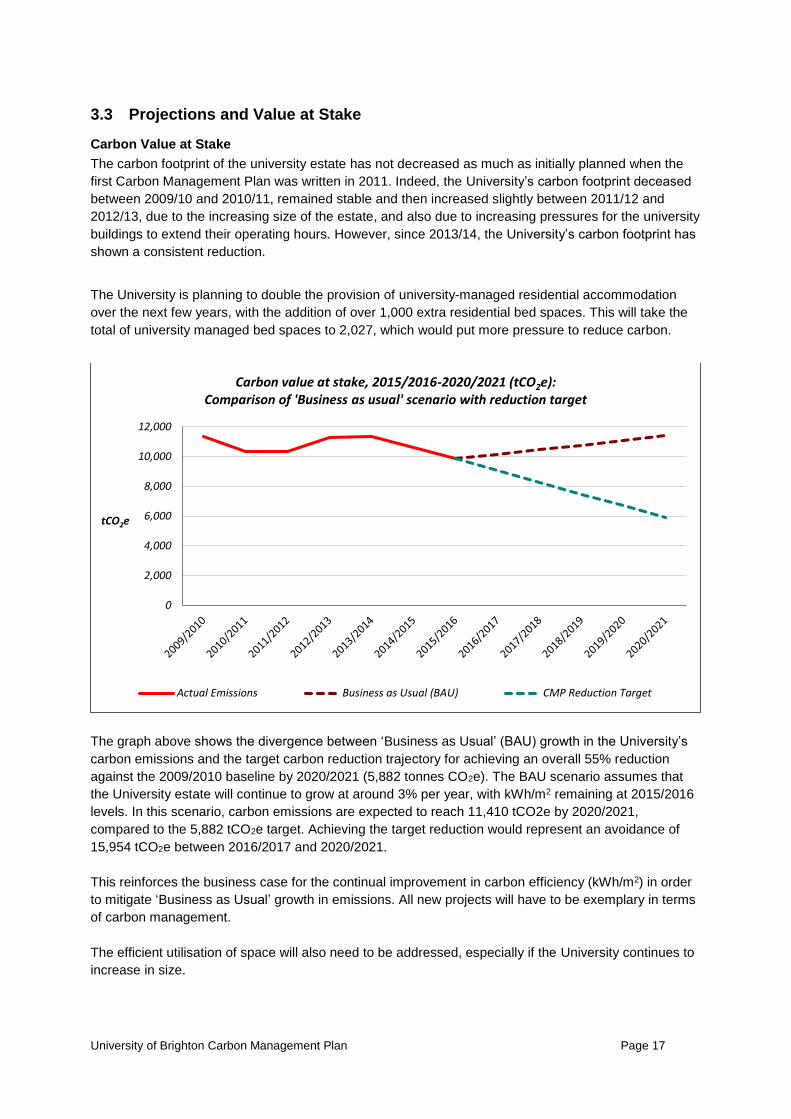
The carbon footprint of the university estate has not decreased as much as initially planned when the
first Carbon Management Plan was written in 2011. Indeed, the University’s carbon footprint deceased
between 2009/10 and 2010/11, remained stable and then increased slightly between 2011/12 and
2012/13, due to the increasing size of the estate, and also due to increasing pressures for the university
buildings to extend their operating hours. However, since 2013/14, the University’s carbon footprint has
shown a consistent reduction.
The University is planning to double the provision of university-managed residential accommodation
over the next few years, with the addition of over 1,000 extra residential bed spaces. This will take the
total of university managed bed spaces to 2,027, which would put more pressure to reduce carbon.
The graph above shows the divergence between ‘Business as Usual’ (BAU) growth in the University’s
carbon emissions and the target carbon reduction trajectory for achieving an overall 55% reduction
against the 2009/2010 baseline by 2020/2021 (5,882 tonnes CO2e). The BAU scenario assumes that
the University estate will continue to grow at around 3% per year, with kWh/m2 remaining at 2015/2016
levels. In this scenario, carbon emissions are expected to reach 11,410 tCO2e by 2020/2021,
compared to the 5,882 tCO2e target. Achieving the target reduction would represent an avoidance of
15,954 tCO2e between 2016/2017 and 2020/2021.
This reinforces the business case for the continual improvement in carbon efficiency (kWh/m2) in order
to mitigate ‘Business as Usual’ growth in emissions. All new projects will have to be exemplary in terms
of carbon management.
The efficient utilisation of space will also need to be addressed, especially if the University continues to
increase in size.
0
2,000
4,000
6,000
8,000
10,000
12,000
tCO2e
Carbon value at stake, 2015/2016-2020/2021 (tCO2e): Comparison of 'Business as usual' scenario with reduction target
Actual Emissions Business as Usual (BAU) CMP Reduction Target

University of Brighton Carbon Management Plan Page 18
Financial Value at Stake
Under a Business as Usual growth scenario, annual costs for energy would reach £3.15 million per year
by 2020/21, increasing from just £2.5 million in 2015/16. In comparison, the trajectory for achieving the
target reduction in carbon emissions would reduce annual energy expenditure to £1.6m by 2020/2021,
with cumulative cost avoidance of £4.3 million.
Therefore, even allowing for significant investment in carbon reduction projects, the Programme is
expected to save considerable sums; conversely, if the measures in the Plan are not implemented, the
University would have to find significant extra funds to account for the increasing energy costs.
£-
£500,000
£1,000,000
£1,500,000
£2,000,000
£2,500,000
£3,000,000
£3,500,000
Energyspend
Financial value at stake: 2015/2016-2020/2021: Comparison of 'Business as usual' scenario with reduction target
Actual Energy Expenditure Business as Usual (BAU) CMP Reduction Target
Cumulative value at
stake
16/17 – 20/21:
£4.3m
University of Brighton Carbon Management Plan Page 19
4. Carbon Management Projects
The Environment Team, together with the Sustainability Governance Board, will continue to be
responsible for identifying carbon reduction projects, alongside key colleagues in Estate and Facilities
Management, Information Services, Accommodation and Hospitality Services, the Students Union and
Finance. Specialist carbon / energy audits and surveys are regularly carried out to identify potential
carbon reduction projects. A review of the University’s waste and recycling was also carried out.
Feasibility studies and cost saving analyses have been carried out to determine which projects should
be progressed. Projects have been prioritised based on practicality, cost, cost saving, carbon saving,
lifetime of project and simple payback.
4.1 Completed projects 2010-2016
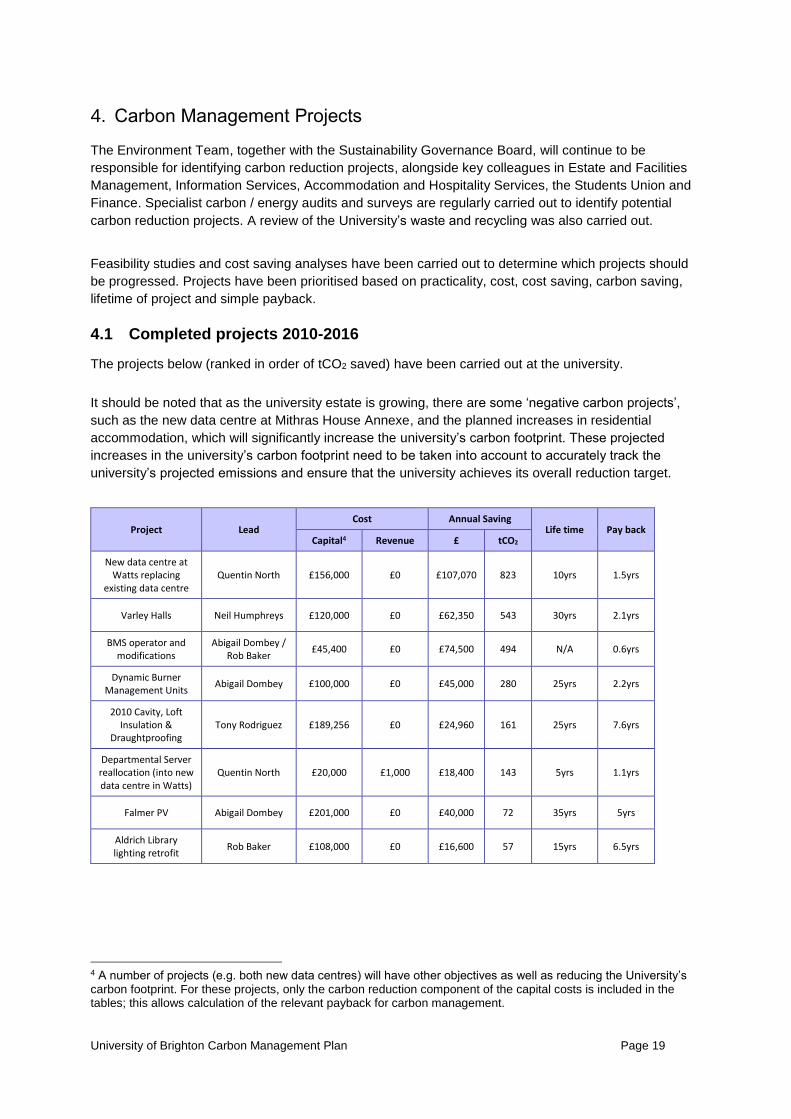
The projects below (ranked in order of tCO2 saved) have been carried out at the university.
It should be noted that as the university estate is growing, there are some ‘negative carbon projects’,
such as the new data centre at Mithras House Annexe, and the planned increases in residential
accommodation, which will significantly increase the university’s carbon footprint. These projected
increases in the university’s carbon footprint need to be taken into account to accurately track the
university’s projected emissions and ensure that the university achieves its overall reduction target.
4 A number of projects (e.g. both new data centres) will have other objectives as well as reducing the University’s carbon footprint. For these projects, only the carbon reduction component of the capital costs is included in the tables; this allows calculation of the relevant payback for carbon management.
Project Lead Cost Annual Saving
Life time Pay back Capital4 Revenue £ tCO2
New data centre at Watts replacing
existing data centre Quentin North £156,000 £0 £107,070 823 10yrs 1.5yrs
Varley Halls Neil Humphreys £120,000 £0 £62,350 543 30yrs 2.1yrs
BMS operator and modifications
Abigail Dombey / Rob Baker
£45,400 £0 £74,500 494 N/A 0.6yrs
Dynamic Burner Management Units
Abigail Dombey £100,000 £0 £45,000 280 25yrs 2.2yrs
2010 Cavity, Loft Insulation &
Draughtproofing Tony Rodriguez £189,256 £0 £24,960 161 25yrs 7.6yrs
Departmental Server reallocation (into new data centre in Watts)
Quentin North £20,000 £1,000 £18,400 143 5yrs 1.1yrs
Falmer PV Abigail Dombey £201,000 £0 £40,000 72 35yrs 5yrs
Aldrich Library lighting retrofit
Rob Baker £108,000 £0 £16,600 57 15yrs 6.5yrs

University of Brighton Carbon Management Plan Page 20
4.2 Proposed projects 2016/2017-2020/2021
5 A number of projects (e.g. the new data centre at Mithras House Annexe above) will have other objectives as well as reducing the University’s carbon footprint. For these projects, only the carbon reduction component of the capital costs is included in the tables; this allows calculation of the relevant payback for carbon management.
PC power management
software Abigail Dombey £56,400 £0 £11,280 45 10yrs 5yrs
Systematic, small-scale lighting
upgrades Rob Baker £50,500 £0 £10,200 43 15yrs 5yrs
Mithras House burner replacement
Rob Baker £54,000 £0 £6,200 40 15yrs 8.7yrs
Cockcroft low-loss transformers
Neil Humphreys £22,500 £0 £9,000 38 25yrs 2.5yrs
Varley solar PV Abigail Dombey £0 £0 £1,000 25 35yrs N/A
Cockcroft solar PV Neil Humphreys £147,000 £0 £12,200 19 35yrs 12yrs
Falmer Library lighting retrofit
Rob Baker £19,700 £0 £4,700 16 15yrs 4.2yrs
Cockcroft ATES Neil Humphreys tbc £0 tbc tbc 30yrs
Cockcroft building refurbishment
Neil Humphreys tbc £0 tbc tbc
c-change campaign (ongoing)
Rebecca Melhuish
£0 £10,000/yr
New data centre at Mithras House
Annexe (business continuity)
Quentin North £40,000 £0 -£77,260 -601 10yrs N/A
Totals £1,329,756 £11,000/yr £366,200 2,198
Project Lead Cost Annual Saving
Life time Pay back Start Year Capital5 Rev’ue £ tCO2
c-change campaign / Green Impact
Rebecca Melhuish £0 £10,000/yr ongoing
Eastbourne solar PV Rob Baker £0 £0 £6,200 62 35yrs N/A 2017
Huxley fume cupboards
Abigail Dombey tbc £0 tbc tbc 2017
Phoenix Residences lighting retrofit
Abigail Dombey £30,000 £0 £8,200 39 15yrs 3.6yrs 2017
GPMB burner replacements
Abigail Dombey £54,000 £0 £5,400 36 15yrs 10yrs 2018
Greynore burner replacements
Abigail Dombey £26,400 £0 £1,200 7 15yrs 22yrs 2018
Queenwood burner replacements
Abigail Dombey £26,800 £0 £1,500 9 15yrs 18yrs 2018

University of Brighton Carbon Management Plan Page 21
Large scale lighting retrofit
Abigail Dombey £650,000 £0 £130,000 430 15yrs 5yrs 2018
BMS controls 1 – motion/CO2 sensors
Energy Management
Engineer £45,000 £0 tbc tbc tbc tbc tbc
BMS controls 2 – lecture theatres
Energy Management
Engineer £17,800 £0 £3,800 32 N/A 4.6yrs 2018
Varley CHP Neil Troak £0 £0 tbc tbc tbc tbc 2018
Grand Parade solar PV
Tom Parkes £0 £0 tbc tbc 35yrs N/A 2018
Green Impact Labs Lucy Kimberley £0 £0 tbc tbc tbc tbc tbc
Vacate Exion and relocate into existing
university estate Neil Humphreys £0 £0 £14,250 111 25yrs 0yrs tbc
Totals £850,000 £10,000/yr £170,550 726

University of Brighton Carbon Management Plan Page 22
5. Carbon Management Plan Financing
Most projects in the Carbon Management Plan are funded on a self-financing basis, requiring any initial
investment of revenue or capital funding to be paid back over a maximum period of 10 years. It is
acknowledged that some projects that are concerned with the introduction of renewable energy sources
or new technologies may have an individual payback period greater than 10 years. Overall, all funding
investment in the plan will have payback period, in aggregate, of no more than 15 years. Savings
arising from efficiency generated against the Business as Usual profile are used to fund further projects.
The capital (investment) cost of the programme is expected to total £2-3 million. The programme is
funded from a number of sources, but the majority relates to major maintenance budget (44%) and
savings arising from energy budgets (33%). In addition interest free loans are available from both
HEFCE Revolving Green Fund and Salix. A further £0.2 million is expected to be available from loan
capital and departmental budgets. Other internal strategic investment funding may also be used to
support some projects.
5.1 Assumptions
The key assumptions made in calculating the benefits and savings are:
Electricity 12.49p per kWh;
Gas 3.04p per kWh;
Business as Usual (BAU) – excluding step changes:
Source Consumption Inflation
Electricity +3.0% +1.7%
Gas +3.0% +1.7%
Transport +0.7% +10.7%
Waste +0.7% +1.6%
5.2 Benefits / savings – quantified and un-quantified
Financial, Service Delivery and Strategic Context
The University aims to continue its work in implementing the Carbon Management Plan without
undermining the student experience. Carbon reduction projects are therefore selected with a view to,
where possible, enhancing the educational experience and, as a prerequisite, to avoid a detriment to
educational and related services. It is recognised that this approach may not always be the most
economic nor deliver the carbon reductions over the shortest possible time, but it is considered to be
consistent with the University Strategy.
As mentioned earlier, the planned increase in residential accommodation will significantly increase the
University’s carbon footprint. This needs to be taken into account to accurately track the University’s
projected emissions and ensure that the University achieves its overall reduction target. Further carbon
reduction projects will also need to be identified.

University of Brighton Carbon Management Plan Page 23
Un-quantified benefits:
There are a number of unquantifiable benefits that will arise from the programme that cannot be expressed in monetary terms. At a university level these include:
Enhanced reputation;
Staff and student recruitment and retention;
Decreased risk from volatile energy markets;
Accommodation planning approval;
Funding body / governmental accountability requirements.
5.3 Additional resources
Since the first version of the Carbon Management Plan, the University has supplemented its resources with a dedicated Environmental Team to oversee the implementation of the Carbon Management Plan and other wide ranging sustainable development initiatives e.g. Environmental Management Systems, Travel Plan, etc.

University of Brighton Carbon Management Plan Page 24
6. Actions to Embed Carbon Management at the University
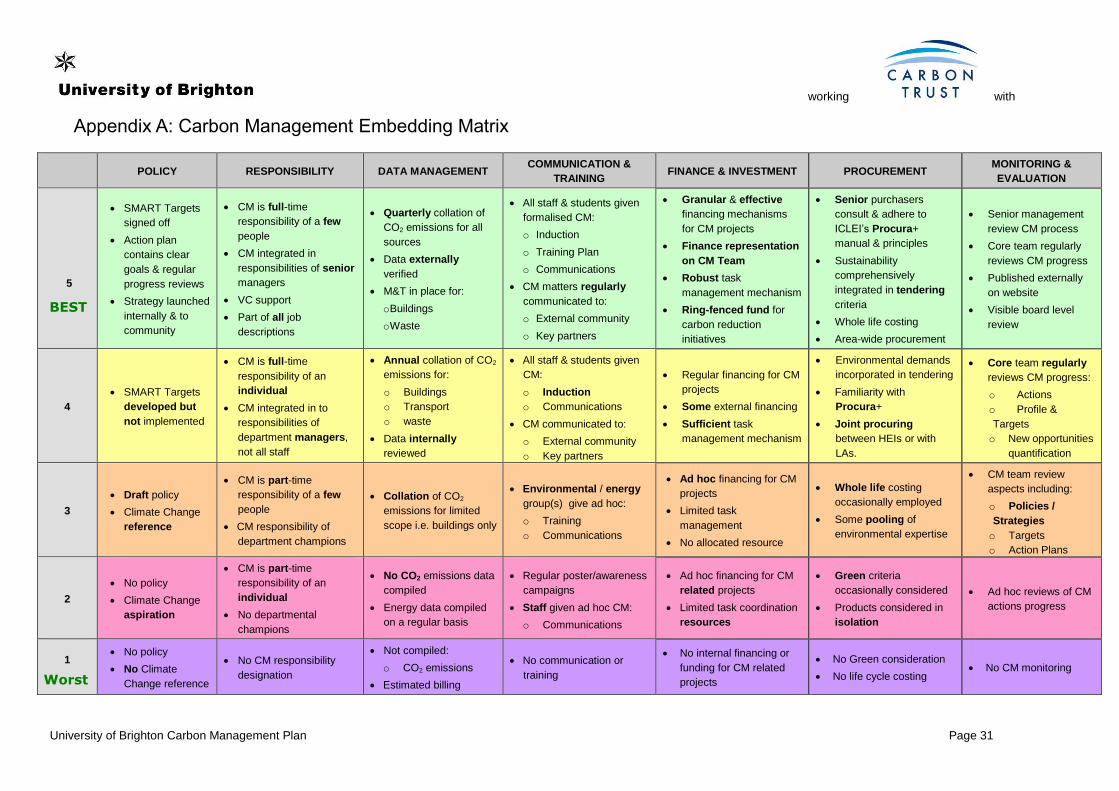
The Environment Team has assessed the level to which carbon management has been integrated into
the University’s operations and management using the Carbon Trust’s Management Embedding Matrix
(Appendix A). A summary of where we were when the Carbon Management Programme was first
initiated (July 2010) and where we are now (July 2017) is presented below.
Policy Responsibility Data
Management Communications
& Training Finance & Investment
Procurement Monitoring
& Evaluation
5. Best
July 2017
July 2017 July 2017 July 2017 July 2017
4 July 2017 July 2017
3 July 2010 July 2017
2 July 2010
July 2010 July 2010 July 2010 July 2010
1. Worst
July 2010
July 2010
The following actions will bring about reduction in carbon emissions and will help to embed carbon management into the University’s policies, procedures, objectives and actions.
6.1 Policy – embedding CO2 saving across the University
The Vice Chancellor has expressed her strong support for the Carbon Management Programme and for
this Plan. The Carbon Management Plan and the carbon reduction target are be published on the
university intra and internet sites for access by all interested stakeholders. This ensures that the
University of Brighton’s commitment is clear, and will reinforce the need for action within the
organisation.
The University recognises that becoming a “low carbon” university will potentially involve a large-scale
change to existing practice and policy. Our approach to the engagement of our stakeholders aims to
ensure that the ethos of carbon saving is effectively embedded across the organisation.
The University will do this by:
Gaining senior management support: senior representatives have been involved throughout the CM Programme.
Communicating with staff right from the outset of the programme
Identifying key individuals, carbon champions and groups within the University to support the programme
Building participation in planning and the implementation of change
Establishing a “Sense of Urgency” by highlighting the costs of doing nothing
Empowering our Sustainability Governance Board to take action
Identifying and delivering “quick wins” in terms of carbon reduction projects using a Business Case approach
Ensuring that the required changes and improvements are institutionalised within our culture
Sustainability is already one of the underpinning core values of the University Strategy. The Estate
Strategy is currently under revision and will include carbon management as a key driver. A sustainable
procurement strategy and procurement policy have recently been approved which include reducing
energy consumption and carbon emissions as key themes (see section 6.5).
All Heads of Schools and Department Directors are encouraged to include carbon management and
sustainability within their business plans and school activities.

University of Brighton Carbon Management Plan Page 25
6.2 Responsibility – being clear that saving carbon is part of everyone’s job
The overall operational responsibility for sustainability and carbon management across the University
lies with the Chief Operating Officer, Sue McHugh. Carbon management is also the full-time
responsibility of the Environmental Manager and Project Leader, Abigail Dombey, and of the Energy
Management Engineer.
The University’s central Induction event for all new staff includes Carbon Management as a key theme,
with a presentation from the Environment Team. There are also aims for carbon management to be
integrated in the responsibilities of all senior managers, and included in their annual Staff Development
Reviews (SDR). All staff have an annual SDR, so there is potential for including carbon saving
objectives for all.
The Environment Team has clearly defined objectives in both project delivery and inclusion within main
university life:
1. Ensure that carbon management and reduction are embedded within the University’s strategy and aims.
2. Ensure governance oversight and review by informing the Sustainability Governance Board and the University Executive Board of progress against agreed targets.
3. Involve all interested parties and stakeholders.
These objectives will be achieved by:
1. Providing regular information and communications on carbon reduction projects and progress against targets, through the c-change campaign, to encourage participation.
2. Embedding Carbon Management within the University planning ethos. 3. Seeking representation from students and staff across the University, who will assist in
developing projects in their departments, schools and halls of residence. 4. The Sustainability Governance Board will continue as a high level Carbon Management group.
6.3 Data Management – measuring the difference, measuring the benefit
The University collates annual carbon emissions figures for buildings, transport and waste and this is
internally reviewed and available on our website
http://www.brighton.ac.uk/sustainability/campus/carbon/our-plan-for-cutting-carbon/
Automatic Monitoring
Near-real-time energy data is available for almost all buildings across the estate. This information is
used to monitor carbon emissions, the success of projects, and is also used to communicate the
outcome of carbon reduction projects and initiatives to all staff through a series of campaigns.
6.4 Communication and the c-change campaign
To achieve its target of cutting carbon emissions by 55% by 2020/21, the University needs engagement
from all staff and students. Raising awareness of the University’s target and encouraging the whole
community to play their part in cutting carbon are key aims of the c-change campaign.
Launched in 2012, c-change is the University of Brighton’s award winning bespoke carbon reduction
campaign, especially designed to engage, inspire and support University of Brighton staff and students
to cut carbon, both on campus and in their personal lives. The c-change campaign uses fun and
innovative ways of engaging with students, co-designing projects with students based upon in-depth
research, to ensure a full understanding of behaviours and attitudes.

University of Brighton Carbon Management Plan Page 26
The c-change campaign was developed with a Brighton Alumnus in 2012, who was responsible for
creating the eye-catching and distinctive graphics of the campaign. This has continued to be used for all
sustainability initiatives, projects and communications, becoming the overarching ‘brand’ for
sustainability at the University of Brighton. By continuing to use the c-change branding, recognition and
trust for the brand is created, encouraging engagement.
Desired outcomes from implementing projects and campaigns through c-change until 2020 are:
Increased engagement and awareness of students and staff of university carbon reduction and sustainability projects
Communication of the progress the University has made in cutting carbon emissions, and future plans
Communication of the University’s ambition to become a responsible low-carbon university
Staff and students are engaged and encouraged to support this goal by taking ownership of the carbon reduction agenda
Behaviours are changed to enable the University to achieve its aim of reducing carbon emissions
The University works together to achieve common objectives, strengthening the sense of community at the University
Sustainability and carbon reduction projects are embedded across the institution.
6.5 Procurement – engaging buyers and suppliers
The University is committed to embedding carbon management in to it procurement processes. To this
end the University has developed a Procurement Strategy and Sustainable Procurement Policy.
The Procurement Strategy sets out the vision for procurement at the University, including embedding
life cycle analysis into best practice and the commitment to produce annual procurement plans which
identify sustainability opportunities.
The Sustainable Procurement Policy sets out a series of commitments and actions which will ensure
that staff have the skills and understanding to ensure that environmental demands are included in the
tendering process including the use of whole life costing and move to area-wide procurement.
Additionally for certain categories of expenditure specific procurement policies have been produced. These are:
Sustainable Procurement Policy - Copier Paper
Sustainable Procurement Policy - Stationery and Other Products
Sustainable Procurement Policy - Furniture
6.6 Monitoring and Evaluation – keeping track of progress
The Sustainability Governance Board incorporate a review progress of individual projects and the
programme as a whole in Board meetings and the multidisciplinary Environment Team oversee all
significant carbon related projects across the institution.
The Board meet termly to monitor progress of the projects, to provide strategic direction and to
implement strict governance. The Board review the Plan on a 2-3 yearly basis to monitor progress
towards targets, review strategies and revisit the planned projects.
Information on carbon reduction projects and progress towards targets will be published on the
University’s website http://www.brighton.ac.uk/sustainability/campus/carbon/ on a regular basis.
University of Brighton Carbon Management Plan Page 27
7. Programme Management of the CM Programme
In order for the Programme to be successful, the University recognises the need for good programme
governance, which will encourage:
Senior strategic ownership of the carbon reduction target.
Bringing together in one place the diverse sets of projects across the University.
Oversight of the programme to encourage delivery by the identification and removal of blockages.
Project owners coming together to ensure coherence and coordination of carbon reduction activity.
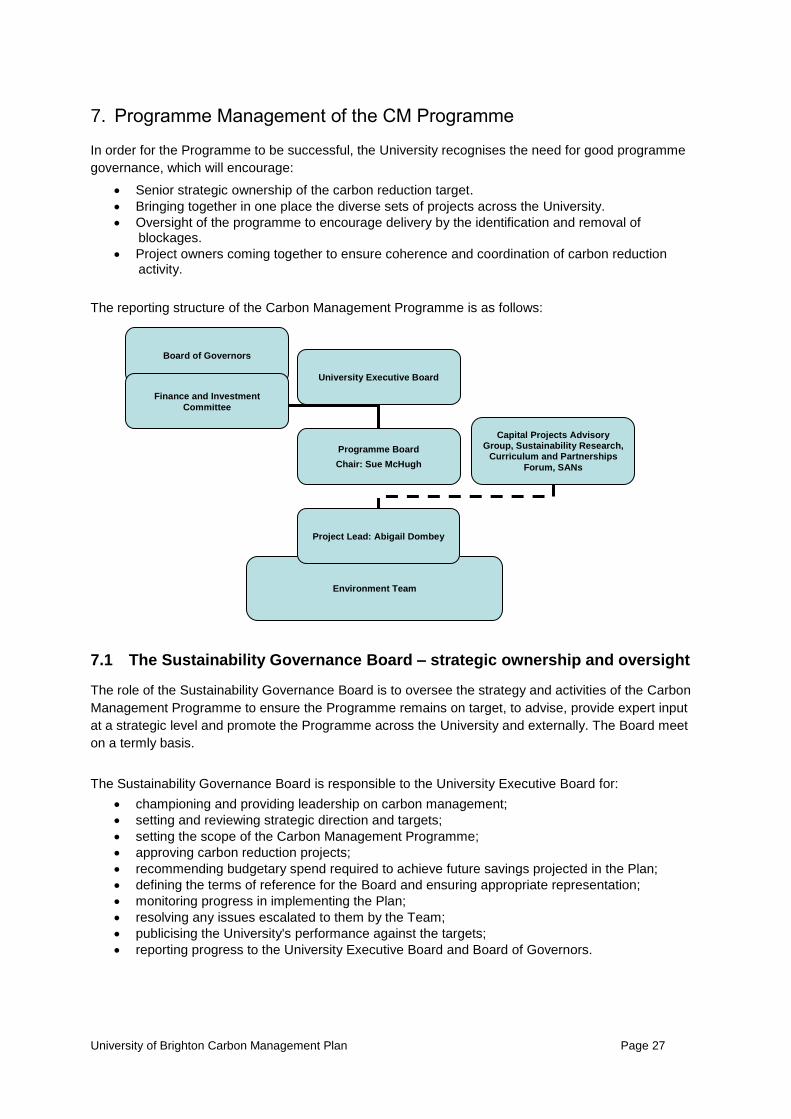
The reporting structure of the Carbon Management Programme is as follows:
7.1 The Sustainability Governance Board – strategic ownership and oversight
The role of the Sustainability Governance Board is to oversee the strategy and activities of the Carbon
Management Programme to ensure the Programme remains on target, to advise, provide expert input
at a strategic level and promote the Programme across the University and externally. The Board meet
on a termly basis.
The Sustainability Governance Board is responsible to the University Executive Board for:
championing and providing leadership on carbon management;
setting and reviewing strategic direction and targets;
setting the scope of the Carbon Management Programme;
approving carbon reduction projects;
recommending budgetary spend required to achieve future savings projected in the Plan;
defining the terms of reference for the Board and ensuring appropriate representation;
monitoring progress in implementing the Plan;
resolving any issues escalated to them by the Team;
publicising the University's performance against the targets;
reporting progress to the University Executive Board and Board of Governors.
Environment Team
University Executive Board
Programme Board
Chair: Sue McHugh
Project Lead: Abigail Dombey
Capital Projects Advisory Group, Sustainability Research,
Curriculum and Partnerships
Forum, SANs
Board of Governors
Finance and Investment
Committee

University of Brighton Carbon Management Plan Page 28
Board Members
Sue McHugh, Programme Sponsor & Chair of Programme Board, Chief Operating Officer
Mike Clark, Programme Co-Sponsor, Director of Estate and Facilities Management
Mike Bewlock, Director of Finance
Professor Andrew Lloyd, Associate Pro-Vice-Chancellor (Academic Operations)
Julie Barker, Director of Accommodation and Hospitality Services
Quentin North, Direction of Information Services
Cat Bach, Student Union Vice President Campus Development
Abigail Dombey, Programme Leader, Environmental Manager.
7.2 The Environment Team – delivering the projects
The Environment Team is responsible for the strategic planning and operational implementation of the
Carbon Management Programme. The Project Leader is responsible for reporting to the Programme
Board.
The Environment Team is responsible to the Board for:
Maintaining the University’s Carbon Management Plan.
Acting as oversight body for all significant carbon related projects across the University.
Generating a project pipeline: prioritising and making recommendations to the Board.
Identifying budgetary spend required to achieve future savings projected in the Programme.
Monitoring progress of individual projects within the Programme, and escalating any issues to the Board.
Developing a communications plan for publicising the University's performance against the Programme.
Reporting progress to the Board.
The Team as a whole oversee all carbon related projects within the University. All projects which have
significant carbon impact need to be signed off by the Team, which therefore:
is in a strong position to enable early identification of all carbon related projects within the University
ensures that all projects with a significant carbon impact fully support the Carbon Management Plan.
‘Project Highlight Reports’ are prepared for each Board meeting – these summarise progress to date, key deliverables and current issues. A sample Highlight Report is included in Appendix C.
Environment Team Members
Abigail Dombey, Project Leader, Environmental Manager,
Energy Management Engineer,
Rebecca Melhuish, Environmental Officer, Behaviour Change and Engagement
Environmental Officer, Strategy and Logistics
Environmental Officer, Environmental Management Systems
Tom Parkes, Assistant Environmental Officer, Carbon Projects
Lucy Kimberley, Assistant Environmental Officer, Engagement and Logistics
Further Key Colleagues
Julian Wood, Head of Procurement and Insurance Services
David Hicks, Deputy Director of Accommodation and Hospitality Services
Jean Piper, Executive Chef, Accommodation and Hospitality Services
Anna Jones, Internal Communications Manager, Marketing and Communications
Chris Temple, Internal Communications Officer , Marketing and Communications

University of Brighton Carbon Management Plan Page 29
Richard Roalfe, Operations Manager, Accommodation and Hospitality Services
Neil Humphreys, Deputy Director E&FM
Tony Rodriquez, Assistant Director E&FM
Barry Mullet, Assistant Director E&FM (Facilities)
Jackie Rana, Enterprise Development Manager, Students’ Union
7.3 Continuity planning for key roles
In order to maintain the momentum of the programme, the succession of key roles must be planned
Role Name Successor
Project Sponsor Sue McHugh, Director of Finance
Stephen Dudderidge, Registrar and Secretary
Project co-Sponsor Mike Clark, Director of E&FM
Neil Humphreys, Deputy Director of E&FM
Project Leader Abigail Dombey, Environmental Manager
Tony Rodriguez, Assistant Director of E&FM
Finance Champion Mike Bewlock, Head of Finance
Julian Wood, Head of Procurement and Insurance Services
7.4 Ongoing stakeholder management
Carbon management within the University should be regarded as an issue that every individual who works
and studies at the University should be responsible for, rather than the sole responsibility of a centralised
department such as E&FM. For this reason successful engagement and education of staff and students
is required in order to achieve the maximum reductions in carbon emissions.
In order to achieve these required levels of engagement and education, specific members of the
Environment Team are responsible for communicating emission reduction and project successes to
senior management, staff and the student population, through the full range of communications channels,
in addition to delivering engagement opportunities through the c-change campaign.
There are a number of key stakeholders within the University that are also in specific roles or sit on
University Boards and Committees. It will be the responsibility of the Environment Team and
Programme Board to engage these stakeholders through reporting, promotion and collaboration. A full
description of stakeholders can be found in Appendix B.

University of Brighton Carbon Management Plan Page 30
University of Brighton Stakeholders
Employees
Students
Governors
University Executive Board
Sustainability Action Networks
External Stakeholders
There are a number of external stakeholders that can and will influence not only the success of the project but its impact on the University of Brighton’s reputation. It will be in our remit to work with, inform and engage these to varying degrees.
Alumni
Prospective Students
Local residents / local community
Local councils
HEFCE
Local MPs
University League, People and Planet
Environmental Association of Universities and Colleges (EAUC) and other NGOs.
Energy suppliers
Maintenance contractors
Component suppliers
Carbon Trust
7.5 Annual progress review to University Executive Board
An annual review of the Carbon Management Programme is published to document progress against the Plan. The review:
documents the cost and all benefits from the Programme including: o financial savings; o CO2 savings against the agreed target; o intangible benefits, including as influencing the student body and staff;
reports to the University Executive Board, via the Programme Board.
The Project Leader reports to the Sustainability Research, Curriculum and Partnerships Forum at the twice yearly meetings, and the Project Sponsor reports to the Board of Governors on a termly basis.
working with
University of Brighton Carbon Management Plan Page 31
Appendix A: Carbon Management Embedding Matrix
POLICY RESPONSIBILITY DATA MANAGEMENT
COMMUNICATION &
TRAINING FINANCE & INVESTMENT PROCUREMENT
MONITORING &
EVALUATION
SMART Targets
signed off
Action plan
contains clear
goals & regular
progress reviews
Strategy launched
internally & to
community
CM is full-time
responsibility of a few
people
CM integrated in
responsibilities of senior
managers
VC support
Part of all job
descriptions
Quarterly collation of
CO2 emissions for all
sources
Data externally
verified
M&T in place for:
o Buildings
o Waste
All staff & students given
formalised CM:
o Induction
o Training Plan
o Communications
CM matters regularly
communicated to:
o External community
o Key partners
Granular & effective
financing mechanisms
for CM projects
Finance representation
on CM Team
Robust task
management mechanism
Ring-fenced fund for
carbon reduction
initiatives
Senior purchasers
consult & adhere to
ICLEI’s Procura+
manual & principles
Sustainability
comprehensively
integrated in tendering
criteria
Whole life costing
Area-wide procurement
Senior management
review CM process
Core team regularly
reviews CM progress
Published externally
on website
Visible board level
review
4
SMART Targets
developed but
not implemented
CM is full-time
responsibility of an
individual
CM integrated in to
responsibilities of
department managers,
not all staff
Annual collation of CO2
emissions for:
o Buildings
o Transport
o waste
Data internally
reviewed
All staff & students given
CM:
o Induction
o Communications
CM communicated to:
o External community
o Key partners
Regular financing for CM
projects
Some external financing
Sufficient task
management mechanism
Environmental demands
incorporated in tendering
Familiarity with
Procura+
Joint procuring
between HEIs or with
LAs.
Core team regularly
reviews CM progress:
o Actions
o Profile &
Targets
o New opportunities
quantification
3
Draft policy
Climate Change
reference
CM is part-time
responsibility of a few
people
CM responsibility of
department champions
Collation of CO2
emissions for limited
scope i.e. buildings only
Environmental / energy
group(s) give ad hoc:
o Training
o Communications
Ad hoc financing for CM
projects
Limited task
management
No allocated resource
Whole life costing
occasionally employed
Some pooling of
environmental expertise
CM team review
aspects including:
o Policies /
Strategies
o Targets
o Action Plans
2
No policy
Climate Change
aspiration
CM is part-time
responsibility of an
individual
No departmental
champions
No CO2 emissions data
compiled
Energy data compiled
on a regular basis
Regular poster/awareness
campaigns
Staff given ad hoc CM:
o Communications
Ad hoc financing for CM
related projects
Limited task coordination
resources
Green criteria
occasionally considered
Products considered in
isolation
Ad hoc reviews of CM
actions progress
No policy
No Climate
Change reference
No CM responsibility
designation
Not compiled:
o CO2 emissions
Estimated billing
No communication or
training
No internal financing or
funding for CM related
projects
No Green consideration
No life cycle costing No CM monitoring
5
BEST
1
Worst
working with
University of Brighton Carbon Management Plan Page 32
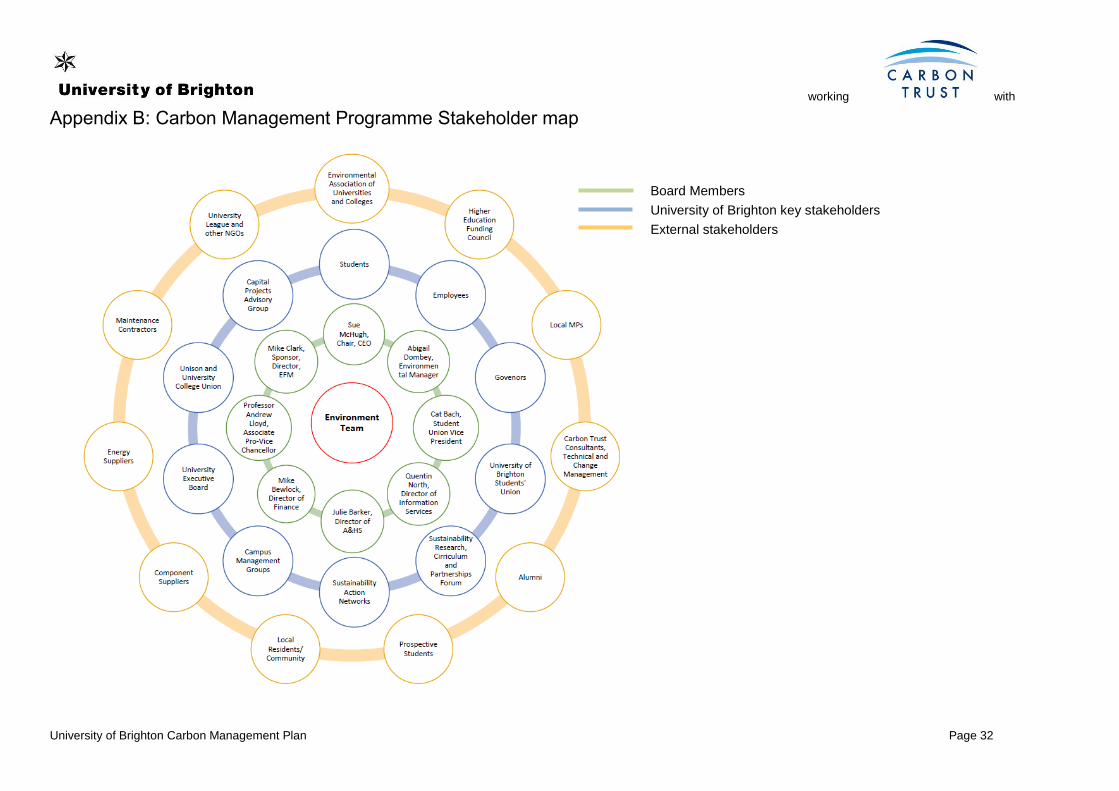
Appendix B: Carbon Management Programme Stakeholder map
Board Members
University of Brighton key stakeholders
External stakeholders

working with
University of Brighton Carbon Management Plan Page 33
Stakeholder Descriptions
Employees Academic and support staff. Ultimately, the attitudes and activities of individual staff members will make a significant difference between success and failure.
Students These are our customers and we will ultimately be responsible for their environmental experience whilst on site. Students will be able to provide ideas and participate in c-change run events, campaigns and initiatives.
Governors We will report progress to Governors and anticipate their sign off on the final deliverable Strategy and Implementation Plan.
Senior Management Team We will report progress to the SMT and ask for support in promoting the programme.
Sustainability Research, Curriculum and Partnerships Forum We will report progress to the SRCPF to keep them informed and seek support, advice and expertise as and when needed.
Campus Management Groups We will report our plans and coordinate activities with the campus Management Groups where needed.
Capital Projects Advisory Group We will report our plans and coordinate activities with the Capital Projects Advisory Group where needed.
Sustainability Action Networks We will work with the SANs to report results, promote plans and activities for carbon saving, and support the groups to run carbon savings projects of their own, and encourage feedback of projects and idea to the Environment Team
c-change
We will continue to use the c-change branding for sustainability and carbon reduction projects, initiatives and campaigns, that are staff and student facing, and to communicate any project successes.
Unison & University and College Union We anticipate working with the Unions in implementing the Programme, informing their members of the positive steps the university is taking to make their working environment healthier and more sustainable.
External Stakeholders
There are a number of external stakeholders that can and will influence not only the success of the project but its impact on the University of Brighton’s reputation. It will be in our remit to work with, inform and engage these to varying degrees.

working with
University of Brighton Carbon Management Plan Page 34
Local Residents/ Community We will report to and engage with the local residents to engender community support for the Programme.
HEFCE The Carbon Management Plan must be signed off by the Board of Governors in order to receive full Capital funding from HEFCE.
Carbon Trust The Carbon Trust is delivering the Carbon Management Programme, providing guidance, expertise and advice on implementing the programme. The Carbon Trust will provide two expert consultants, one in change management and one in technical aspects of the programme.
Members of Parliament We anticipate working with the local MPs in implementing the Programme, informing them of the positive steps the university is taking.
University League, Environmental Association of Universities and Colleges and other NGOs. The University League ranks all universities on their environmental progress and has become an influential ranking system for sustainability in the HE sector. There are no doubt many other NGOs and pressure groups that will show an interest in the environmental activities at the university and we will continue to maintain our webpages and social media to disseminate information about our activities.
Component suppliers These are suppliers of equipment such as IT, air conditioning and building materials. We will seek to use the most carbon efficient equipment where practicable.
Energy suppliers The University could forge links with energy suppliers to explore options for the generation of renewable energies.
Maintenance contractors Carbon management should be a key requirement of maintenance contractors.
Alumni The University has an active alumni base that takes strong interest in the University’s activities. As students graduate and become alumni they can take benefits and learnings gained from the programme with them, spreading our reputation and expertise.
Prospective Students Prospective students will increasingly expect to study in an environmentally friendly university. Implementing this programme could help in attracting more students with this mindset.

working with
University of Brighton Carbon Management Plan Page 35
Appendix C: Example Project Highlight Report
Project Highlight Report – February 2017
Carbon Management Programme
Project Name Carbon Management Programme
Project Code CMP
Project Manager Abigail Dombey
Highlight Report Date May 2017
Period Covered February 2017 – May 2017
Current Project Status
Overall RAG Status* Green
Carbon Management Plan** Embedding Structure** Implementation**
Amber
Green
Green
Red: Activities are not on schedule or unmanageable against scope, the current due date is later than the baseline date and is highly likely to remain so. An Issue should be documented below for this milestone.
Amber: Activities are not on schedule, the current due date is later than the baseline date, however, it is possible to recover this milestone bringing the current due date in line with the baseline date or the board has approved a rebaselined date. A Risk should be documented below for this milestone.
Green: Activities are on schedule or manageable against scope, current due date is the same, or earlier than, the baseline date.
Budget**
Amber
Budget Status:
Red: Current Budget exceeds approved budget by more than 10%, or forecast spend has increased by more than 10% for budget period for this report
Amber: Forecast spend has increased by less than 10% for this report
Green: Proceeding to plan

working with
University of Brighton Carbon Management Plan Page 36
Overview of Activity Since the Last Meeting
Since the last CMPB meeting the Environment Team have been focussing on developing the university’s Sustainability Plan and associated governance structure; carrying out the Travel Survey; the PV installation project at Eastbourne; LED lighting upgrade project at Phoenix; installation of bike storage at Grand Parade and Falmer; and the university-wide Green Week and Bike Week.
Work on revising the CMP has also progressed, but as Rob Baker will unfortunately shortly be leaving the university, this has slowed somewhat and will be continued by Rob’s replacement.
Carbon Reporting
University-wide energy consumption increased by 4.8% during the period April 2016 to March 2017
compared to the previous 12 months, with electricity 6% higher and gas 3.9% higher. Overall carbon
emissions increased by 5.2%, as a result of the higher carbon intensity of grid electricity compared to natural
gas.
Gas consumption (see Appendix A) increased across the university estate during the period April 16 - March
17 compared to the previous 12 months. However, taking into account degree day data, the 16/17 winter
was 14.5% colder than that of 15/16. In this context, the increase in gas consumption of 10.5% in the
residential estate and 2.3% in the academic estate, and therefore only 3.9% overall, is entirely favourable.
Hastings electricity consumption was 36.8% higher than during the previous 12-month period, which as
discussed previously is due to the ongoing use of the Lacuna Place building which is entirely electrically
heated.
Electricity consumption at Moulsecoomb increased by 11.5% due to the ATES electricity demand and a
temporary supply for the AEC building during the construction phase. This increased electricity demand will
have been mitigated somewhat by the 16% reduction in electricity demand at Aldrich Library, achieved by
the LED lighting retrofit project completed in September 2016. Operation of the ATES also accounts for the
1.7% reduction in gas consumption at Moulsecoomb, compared to increased gas consumption across most
of the rest of the university estate.
Falmer electricity consumption reduced by 8.2% compared to the previous year due to the combined effects
of the PV arrays installed in January 2016 and the lighting retrofit at Falmer Library in August 2016.
2015/2016 2016/2017 Change 2015/2016 2016/2017 Change
5,053,896 5,114,822 1.2% 1,430 1,400 -2.1%
12,899,195 13,521,679 4.8% 3,831 4,113 7.4%
3,673,008 4,054,998 10.4% 984 1,069 8.7%
5,309,320 5,138,554 -3.2% 1,403 1,375 -2.0%
1,387,082 1,785,788 28.7% 436 576 32.1%
1,337,554 1,438,509 7.5% 376 392 4.3%
3,848,523 4,067,563 5.7% 987 1,014 2.8%
638,052 665,796 4.3% 155 162 4.6%
28,322,502 29,615,841 4.6% 8,084 8,533 5.6%
5,824,129 6,171,868 6.0% 1,518 1,568 3.3%
34,146,631 35,787,709 4.8% 9,602 10,102 5.2%
Scope 1 and 2 CO2 emissions (tCO2e)Energy consumption (gas + electricity)
(kWh)
Moulsecoomb Residences
Most recent 12 months of
data: April-2016 to March-
2017
Campus
Falmer
Moulsecoomb
City
Eastbourne
Hastings
Phoenix
Varley
Estate Total
Total Academic
Total Residential

working with
University of Brighton Carbon Management Plan Page 37
At City Campus, electricity consumption increased by 4.8% between 15/16 and 16/17. The increased
consumption is largely attributable to the use of the refurbished Edward Street building which was first used
for teaching in winter 2015/16, and by St. Peter’s House Library’s extended opening hours.
Electricity consumption remained broadly stable at Eastbourne, decreased by 1.9% at Phoenix and by 4.6%
at Varley. Moulsecoomb Residences showed a 5.4% increase in electricity.
Please refer to appendix A for a full breakdown of the University’s energy consumption.
Carbon Projects
Eastbourne PV
The Environment Team is progressing the Eastbourne PV project following approval from CPAG in February. The layout of the panels has had to be slightly amended following information from structural engineers advising on the project, but the total output of the arrays has not been affected and is still 120kW for Hillbrow and 30kW on top of Robert Dodd annexe.
Due to the changes in the proposed layout, a revised planning application has had to be submitted to Eastbourne council to account for the additional panels on Hillbrow Sports hall roof. We expect to receive an outcome on this by the beginning of June with the installation commencing immediately after this. The project will take up to 3 weeks in total to complete. Site staff and Heads of Schools are supportive of the project and will be notified of the final installation dates once these have been determined.
The Team are currently liaising with Brighton Energy Coop (who are financing the project) and the Principal Contractor to finalise the programme of works, pre-construction information and health and safety arrangements. The main outstanding issues relate to the fall protection systems required on both buildings in order to provide safe access to the roof areas for ongoing maintenance visits.
Existing PV Installations
To date, the Cockcroft PV array has generated total savings of over £67,725, achieving a ROI of 45.9%, and has cut emissions by 108 tCO2e. The Falmer PV arrays have generated savings of £44,655, which represents a ROI of 22.8%, with total emissions cut by 86 tCO2e. The arrays at Varley have generated savings of £498, with emissions cut by 13 tCO2e.
Huxley Fume Cupboards
The current maintenance contractor, Servcom, has recently serviced the fume cupboards at Huxley. They are confident that there are no further energy savings available from the existing fume cupboards due to the poor original design of the building’s ventilation systems. However, the Environment Team propose to seek alternative advice from specialists who have undertaken fume cupboard enhancement works at other universities with a great deal of success.
The additional Huxley ventilation project, mentioned at the previous CMPB meeting, is currently on hold until we resolve the issue of achieving increased control of the fume cupboards, and they are able to operate as variable air volume fume cupboards, as intended.

working with
University of Brighton Carbon Management Plan Page 38
Lighting
The Environmental Team are currently putting together a proposal for Finance for the Phoenix halls lighting project. This project proposes replacing 300+ existing fluorescent lights that serve the corridor areas of the residences with modern LED lamps. These new lamps use 70% less energy than the existing fittings and so the projected financial savings are significant. The project, with an estimated value of £27,500, is predicted to pay for itself within 3 years, and deliver 10 year net savings of £64k.
A number of other buildings have also been surveyed, including Grand Parade main building, Watts and Mithras House. Designs will be drawn up for those areas where retrofit lighting projects appear worthwhile and have a payback period of 5 years or less.
The team also intends to roll out a phased replacement of all GU10 halogen spot lamps across the University estate as these are particularly inefficient but easily replaced with LEDs. Given that the works are very straightforward, we are due to discuss the project with colleagues in EFM to determine if the installation works could be undertaken in-house rather than being outsourced to a separate contractor. The cost of this project is likely to be in the region of £10k and should pay for itself within 1.5 years.
Lighting Specification
Following much consultation, the Lighting Specification document was issued to members of EFM and to all colleagues attending Infrastructure Group meetings. The team hopes this will see the installation of quality, well designed lighting systems, while minimising ongoing energy and maintenance costs associated with the lighting equipment.
Energy Guru halls campaign
The ‘Energy Guru’ campaign was launched at Varley at the end of February, with e-mail, social media,
posters, c-change student ambassadors door-knocking, a dinner-time stall, and a pizza party including an
energy-saving obstacle course. 136 students (approximately 1 in 4 residents) pledged to help save energy
for the rest of their time at Varley.
A facebook photo competition also saw 11 students participate by posting photographs of their energy-
saving habits, and one further social media competition will be run before the end of the academic year.
18 of the 136 pledgers (13%) completed a ‘one-month on’ survey. The survey showed a shift in conscious effort to save energy – with 61% either ‘always’ or ‘often’ consciously making an effort to reduce energy consumption before taking the pledge, compared to 94% after since taking the pledge. A more comprehensive evaluation survey will be carried out in May.
Wider Environmental Projects
Sustainability Plan
Following on from the Sustainability Plan workshop, the Environment Team have been consulting with colleagues from across the university on the draft Sustainability Plan, and its associated governance structure. This will be submitted to the Sustainable Development Strategy Advisory Group for discussion at the next SDSAG meeting in early June.

working with
University of Brighton Carbon Management Plan Page 39
Transport Update
Commuter Travel Survey
The University’s annual commuter travel survey was carried out during the week of the 20th-24th February,
with 1,255 students and 385 staff completing face-to-face questionnaires across all sites. The University-
wide overview is shown below and overleaf. A more detailed breakdown will be available in the meeting.
2016 2017
All Students Staff All Students Staff
Walk 33.9% 38.9% 20.9% 33.4% 38.5% 16.5%
Cycle 4.9% 4.1% 7.8% 4.2% 3.6% 6.9%
Elec. Bike - - - 0.1% 0.0% 0.3%
Train 11.5% 10.2% 15.2% 9.4% 8.3% 12.7%
Big Lemon - - - 5.9% 7.7% 0.5%
Bus 21.7% 25.3% 10.6% 15.2% 17.4% 9.9%
Mtcl / Scooter 0.3% 0.3% 0.4% 0.4% 0.5% 0.3%
Elec. Car - - - 0.0% 0.0% 0.0%
Shared - driver 2.7% 2.5% 2.7% 4.1% 4.6% 3.1%
Shared - pass 2.5% 2.5% 1.3% 2.9% 2.6% 2.5%
Car (alone) 18.4% 12.5% 37.9% 20.7% 12.9% 43.5%
Taxi 0.5% 0.5% 0.0% 0.3% 0.4% 0.0%
Other 1.8% 1.9% 0.7% 0.2% 0.2% 0.0%
Multiple 1.7% 1.3% 2.5% 3.3% 3.3% 3.8%
Total 100% 100% 100% 100% 100% 100%
As can be seen from the figures, overall numbers of staff and students walking, cycling, and taking the bus (including the big lemon bus) have not changed considerably since the last travel survey in 2016. However, the numbers of staff walking, taking the train and cycling to work, have decreased since last year, and single occupancy car use for staff has increased from 37.9% in 2016 to 43.5% this year.

working with
University of Brighton Carbon Management Plan Page 40
Travel Plans
The Moulsecoomb Travel Plan has been finalised and will be circulated to CMPB members for their approval. The Falmer Travel Plan is now in the process of being updated; this is the last of the original Travel Plans to be updated.
BHCC and Hourbike Bike Share Scheme
As previously mentioned, BHCC is introducing a bike share scheme in Brighton in conjunction with Hourbike,
a bike share operator. The scheme will be operated through a combination of infrastructural facilities and
app-based software, with customers able to access bicycles from docking ‘hubs’ using their mobile phones or
a key card.
BHCC and the University of Brighton are keen to situate bike share hubs at the Moulsecoomb and Falmer
campuses, to open up the scheme to the huge number of students and staff based along the Lewes Road
corridor, and to promote sustainable travel to and between University sites, in accordance with the new
University Strategy.
Following BHCC’s and Hourbike’s requirements for identifying possible locations for bike share docking hubs,
the Environment Team is recommending the locations for bike hubs at Cockcroft (across two locations) and
Falmer.
The recommended locations at Cockcroft are at the front of the building, with 10 docking spaces to the left
of the main entrance, in place of the existing Sheffield stands, and a further 5 docking spaces in front of the
large Cockcroft sign adjacent to the access road into the campus and the AEB construction site.
The bike hub at Falmer should ideally be located in the space between Mayfield House and Westlain House,
opposite the existing Sheffield stands. This location is centrally positioned at the Falmer campus and would
provide ample access for manoeuvrability when accessing or docking a bike. Although the centre of the
campus is accessed via a hill leading up from the Sports Centre, it is anticipated that the gearing of the bikes
will be sufficient to enable all cyclists to reach the docking station without having to get off their bikes.

working with
University of Brighton Carbon Management Plan Page 41
Waste Update
Recycling levels
The university’s overall recycling rate for the 12 most recent months of currently available waste data (April
2016 to March 2017) show our recycling levels to be at 50%, including food waste sent for Anaerobic
Digestion. However, this does not include the full data from all waste streams (as some data is only supplied
annually rather than monthly) so is not directly comparable to the annual EMR submission.
The table below shows the data in comparison to the same waste streams the previous year.
15-16 16-17
Recycling & Food waste (kg)
Recycling & Food waste (%)
Total all waste and recycling
Recycling & Food waste (kg)
Recycling & Food waste (%)
Total all waste and recycling
April 16,911 55% 30,518 26,501 49% 54,576
May 26,265 54% 48,807 23,783 41% 58,054
June 44,138 56% 79,096 42,599 50% 84,804
July 31,339 59% 52,731 23,375 53% 44,456
August 31,832 70% 45,698 25,412 63% 40,444
September 27,474 55% 49,877 26,239 53% 49,803
October 34,335 48% 72,201 24,190 49% 49,284
November 29,805 53% 56,039 36,608 59% 61,711
December 22,132 58% 38,399 28,573 55% 51,596
January 22,702 49% 46,801 20,924 47% 44,599
February 29,188 46% 62,880 19,014 48% 39,957
March 29,089 51% 56,745 18,912 34% 54,843
345,207 54% 639,789 316,127 50% 634,124
Green Week
Green Week ran from 13th – 17th March, with a variety of events and initiatives across all campuses,
including: a c-change roadshow, Bike Doctors, a food waste cookery demo, a biodiversity walk, a wildlife
photography walk, an IS skype taster session, a film screening of ‘Before the Flood’, and SU Food co-op
giveaways.
A total of 580 staff and students engaged with the week’s event and activities. Of these 339 were engaged
through the ‘Big c-change pledge-athon’. The most successful events were the c-change ‘Big c-change
pledge-athon’ roadshow (263 engaged), the food waste cookery demo (95 engaged), and the film screening
(75 engaged).

working with
University of Brighton Carbon Management Plan Page 42
Big c-change pledge-athon
The Big c-change pledge-athon built on last year’s success, engaging a total of 339 staff, students and
members of the public to make a total of 473 pledges to adopt more environmentally friendly behaviours for
the month of March. A breakdown of staff and student numbers, and pledge categories chosen, can be
found in the tables below. The total number of participants this year was a 50% increase on the previous
year, when 227 participated.
No. participants:
Staff 135
Students 205
Public 5
Total participants 339
Pledge categories:
power down 144
travel smart 95
eat eco 107
cut the waste 127
Total pledges 473
A follow up survey sent out at the end of the month was completed by 101 of the 339 participants (30%).
77% of respondents stated that they stuck to their pledge for either most or all of the time. The vast majority
of participants also stated that participating in the pledge made them try to reduce their environmental
impact in other ways in addition to their specific pledge – with only 11% selecting ‘not at all’. 100% stated
that they planned to keep to their pledge despite the pledge-athon having ended, with 84% intending to do
so either ‘most of the time’ or ‘all the time’.
Prior to launching this year’s pledge-athon, a ‘one year on’ survey was sent out to last year’s participants, to
evaluate the long term effectiveness of the campaign. 38 participants responded (17%) to this survey. 67%
of respondents stated they had continued their pledge either ‘all’ or ‘most’ of the time, over the past year,
with 0% choosing ‘not at all’. 78% of respondents stated that participating in last year’s pledge-athon has
led them to act in more environmentally conscious ways (in general) during university-related activities,
either ‘to a great extent’ or ‘somewhat’.
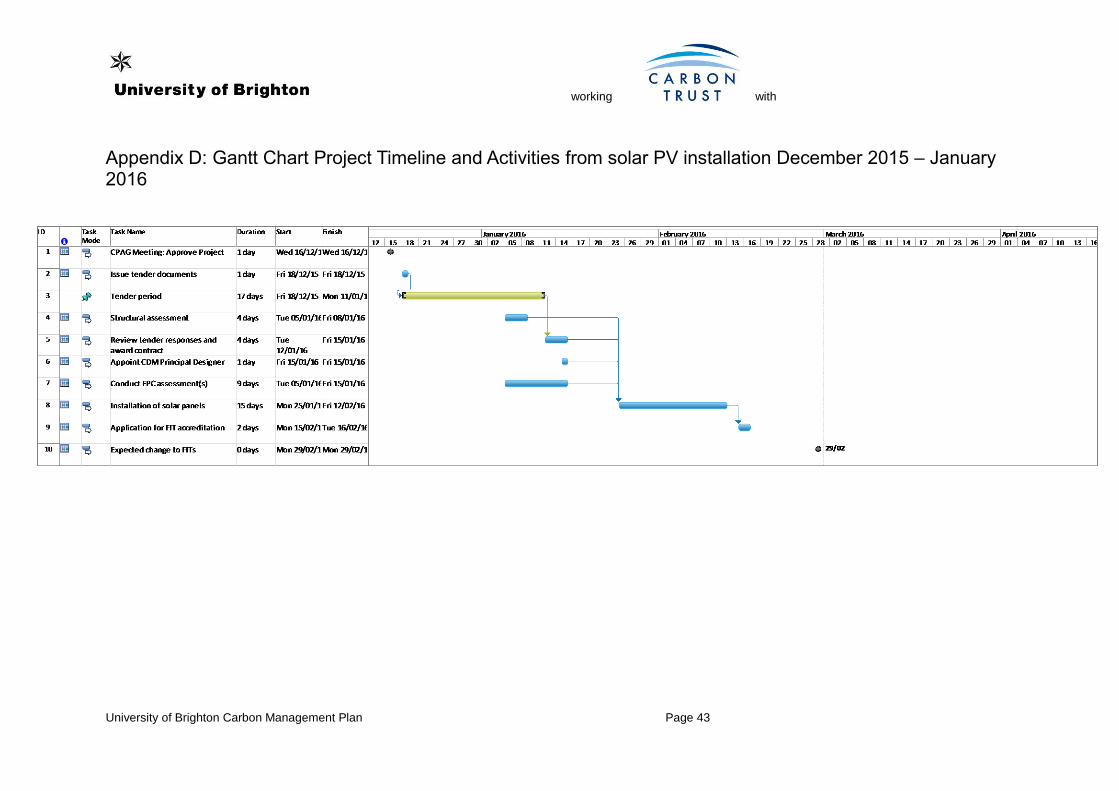
working with
University of Brighton Carbon Management Plan Page 43
Appendix D: Gantt Chart Project Timeline and Activities from solar PV installation December 2015 – January 2016


![Welcome to Brighton...Brighton Station Brighton Palace Pier Country Tour Welcome to Brighton [Minutes past the hour] Brighton Palace Pier, opposite Pool Valley Coach Station [00] for](https://static.documents.pub/doc/80x56/5ee0e2e1ad6a402d666bf67e/welcome-to-brighton-brighton-station-brighton-palace-pier-country-tour-welcome.jpg)