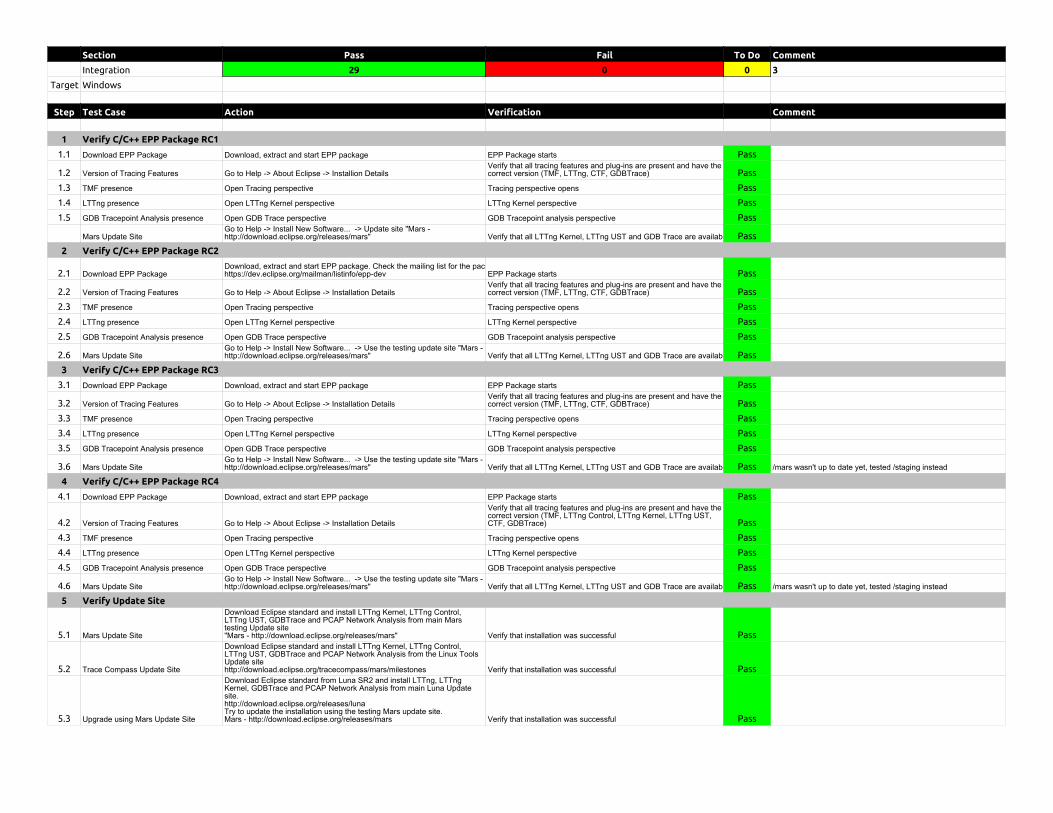
1.2 Version of Tracing Features Go to Help -> About Eclipse -> Installion DetailsVerify that all tracing features and plug-ins are present and have thecorrect version (TMF, LTTng, CTF, GDBTrace) Pass
1.3 TMF presence Open Tracing perspective Tracing perspective opens Pass
Mars Update SiteGo to Help -> Install New Software... -> Update site "Mars -http://download.eclipse.org/releases/mars" Verify that all LTTng Kernel, LTTng UST and GDB Trace are availab Pass
2 Verify C/C++ EPP Package RC2
2.1 Download EPP PackageDownload, extract and start EPP package. Check the mailing list for the pachttps://dev.eclipse.org/mailman/listinfo/epp-dev EPP Package starts Pass
2.2 Version of Tracing Features Go to Help -> About Eclipse -> Installation DetailsVerify that all tracing features and plug-ins are present and have thecorrect version (TMF, LTTng, CTF, GDBTrace) Pass
2.3 TMF presence Open Tracing perspective Tracing perspective opens Pass
2.6 Mars Update SiteGo to Help -> Install New Software... -> Use the testing update site "Mars -http://download.eclipse.org/releases/mars" Verify that all LTTng Kernel, LTTng UST and GDB Trace are availab Pass
3.2 Version of Tracing Features Go to Help -> About Eclipse -> Installation DetailsVerify that all tracing features and plug-ins are present and have thecorrect version (TMF, LTTng, CTF, GDBTrace) Pass
3.3 TMF presence Open Tracing perspective Tracing perspective opens Pass
3.6 Mars Update SiteGo to Help -> Install New Software... -> Use the testing update site "Mars -http://download.eclipse.org/releases/mars" Verify that all LTTng Kernel, LTTng UST and GDB Trace are availab Pass /mars wasn't up to date yet, tested /staging instead
4.6 Mars Update SiteGo to Help -> Install New Software... -> Use the testing update site "Mars -http://download.eclipse.org/releases/mars" Verify that all LTTng Kernel, LTTng UST and GDB Trace are availab Pass /mars wasn't up to date yet, tested /staging instead
5 Verify Update Site
5.1 Mars Update Site
Download Eclipse standard and install LTTng Kernel, LTTng Control,LTTng UST, GDBTrace and PCAP Network Analysis from main Marstesting Update site"Mars - http://download.eclipse.org/releases/mars" Verify that installation was successful Pass
5.2 Trace Compass Update Site
Download Eclipse standard and install LTTng Kernel, LTTng Control,LTTng UST, GDBTrace and PCAP Network Analysis from the Linux ToolsUpdate sitehttp://download.eclipse.org/tracecompass/mars/milestones Verify that installation was successful Pass
5.3 Upgrade using Mars Update Site
Download Eclipse standard from Luna SR2 and install LTTng, LTTngKernel, GDBTrace and PCAP Network Analysis from main Luna Updatesite.http://download.eclipse.org/releases/lunaTry to update the installation using the testing Mars update site.Mars - http://download.eclipse.org/releases/mars Verify that installation was successful Pass
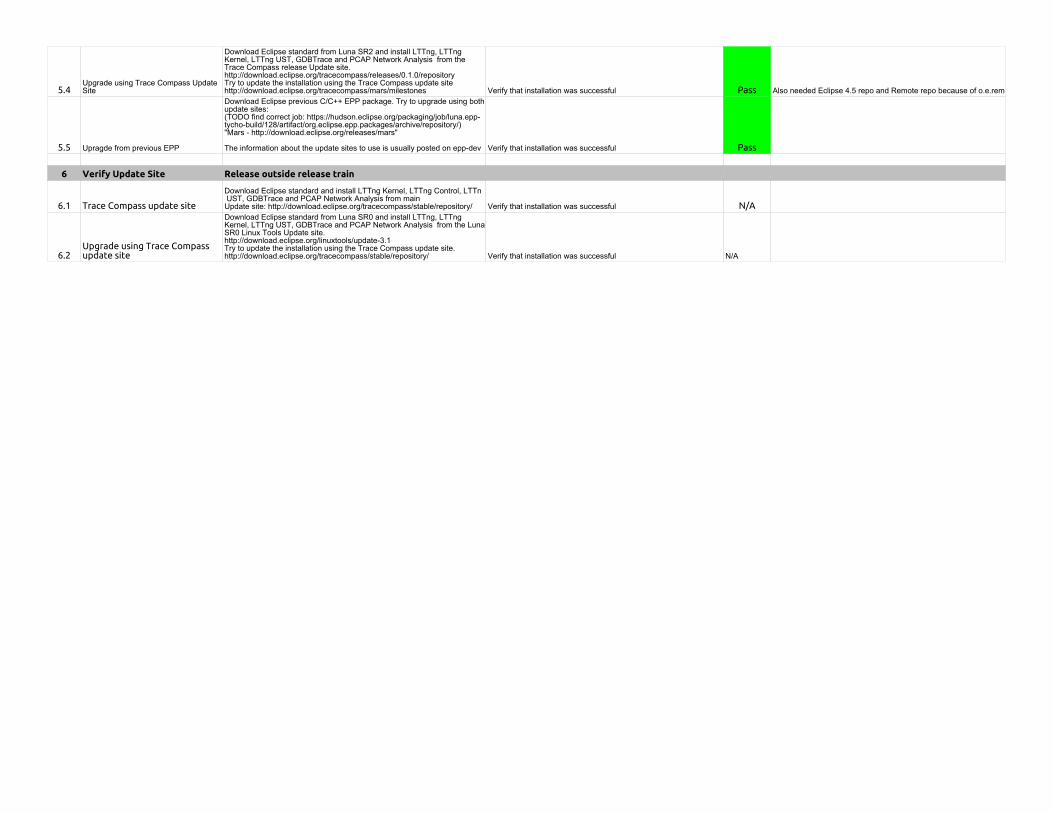
5.4Upgrade using Trace Compass UpdateSite
Download Eclipse standard from Luna SR2 and install LTTng, LTTngKernel, LTTng UST, GDBTrace and PCAP Network Analysis from theTrace Compass release Update site.http://download.eclipse.org/tracecompass/releases/0.1.0/repositoryTry to update the installation using the Trace Compass update sitehttp://download.eclipse.org/tracecompass/mars/milestones Verify that installation was successful Pass Also needed Eclipse 4.5 repo and Remote repo because of o.e.rem
5.5 Upragde from previous EPP
Download Eclipse previous C/C++ EPP package. Try to upgrade using bothupdate sites:(TODO find correct job: https://hudson.eclipse.org/packaging/job/luna.epp-tycho-build/128/artifact/org.eclipse.epp.packages/archive/repository/)"Mars - http://download.eclipse.org/releases/mars"
The information about the update sites to use is usually posted on epp-dev Verify that installation was successful Pass
6 Verify Update Site Release outside release train
6.1 Trace Compass update site
Download Eclipse standard and install LTTng Kernel, LTTng Control, LTTn UST, GDBTrace and PCAP Network Analysis from mainUpdate site: http://download.eclipse.org/tracecompass/stable/repository/ Verify that installation was successful N/A
6.2Upgrade using Trace Compassupdate site
Download Eclipse standard from Luna SR0 and install LTTng, LTTngKernel, LTTng UST, GDBTrace and PCAP Network Analysis from the LunaSR0 Linux Tools Update site.http://download.eclipse.org/linuxtools/update-3.1Try to update the installation using the Trace Compass update site.http://download.eclipse.org/tracecompass/stable/repository/ Verify that installation was successful N/A
Section Pass Fail To Do Comment
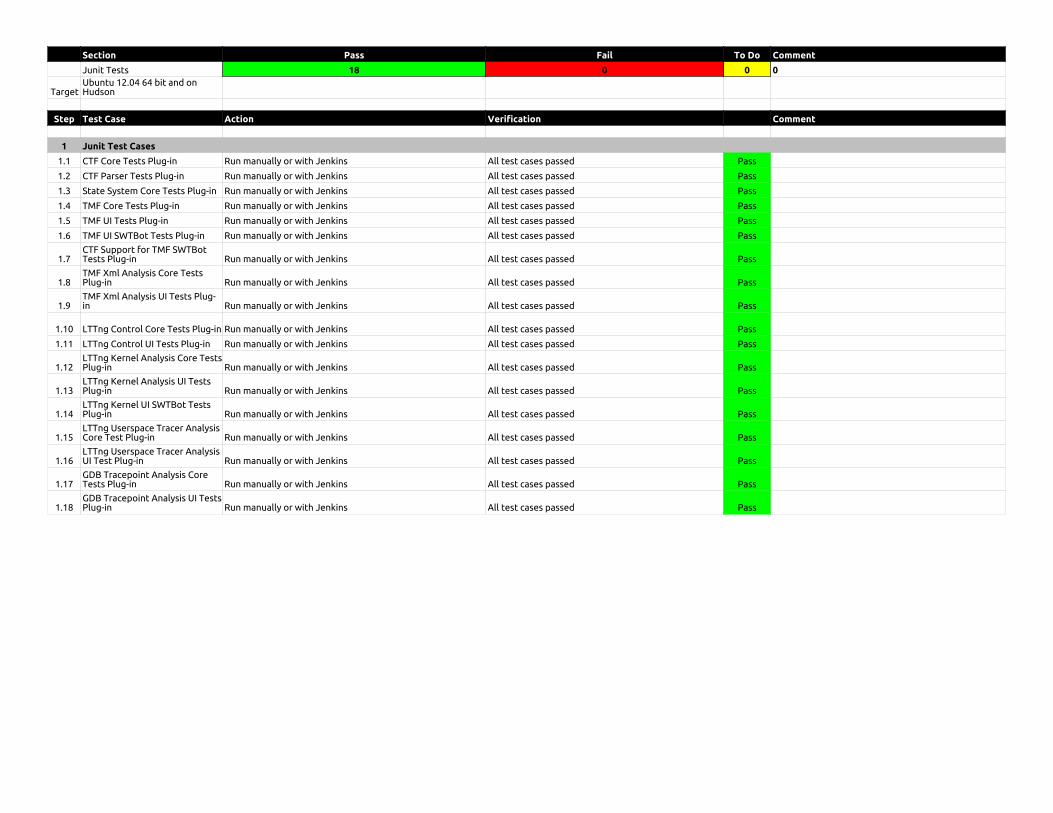
Junit Tests 18 0 0 0
TargetUbuntu 12.04 64 bit and onHudson
Step Test Case Action Verification Comment
1 Junit Test Cases
1.1 CTF Core Tests Plug-in Run manually or with Jenkins All test cases passed Pass
1.2 CTF Parser Tests Plug-in Run manually or with Jenkins All test cases passed Pass
1.3 State System Core Tests Plug-in Run manually or with Jenkins All test cases passed Pass
1.4 TMF Core Tests Plug-in Run manually or with Jenkins All test cases passed Pass
1.5 TMF UI Tests Plug-in Run manually or with Jenkins All test cases passed Pass
1.6 TMF UI SWTBot Tests Plug-in Run manually or with Jenkins All test cases passed Pass
1.7CTF Support for TMF SWTBotTests Plug-in Run manually or with Jenkins All test cases passed Pass
1.8TMF Xml Analysis Core TestsPlug-in Run manually or with Jenkins All test cases passed Pass
1.9TMF Xml Analysis UI Tests Plug-in Run manually or with Jenkins All test cases passed Pass
1.10 LTTng Control Core Tests Plug-in Run manually or with Jenkins All test cases passed Pass
1.11 LTTng Control UI Tests Plug-in Run manually or with Jenkins All test cases passed Pass
1.12LTTng Kernel Analysis Core TestsPlug-in Run manually or with Jenkins All test cases passed Pass
1.13LTTng Kernel Analysis UI TestsPlug-in Run manually or with Jenkins All test cases passed Pass
1.14LTTng Kernel UI SWTBot TestsPlug-in Run manually or with Jenkins All test cases passed Pass
1.15LTTng Userspace Tracer AnalysisCore Test Plug-in Run manually or with Jenkins All test cases passed Pass
1.16LTTng Userspace Tracer AnalysisUI Test Plug-in Run manually or with Jenkins All test cases passed Pass
1.17GDB Tracepoint Analysis CoreTests Plug-in Run manually or with Jenkins All test cases passed Pass
1.18GDB Tracepoint Analysis UI TestsPlug-in Run manually or with Jenkins All test cases passed Pass
Section Pass Fail Type To Do Comment
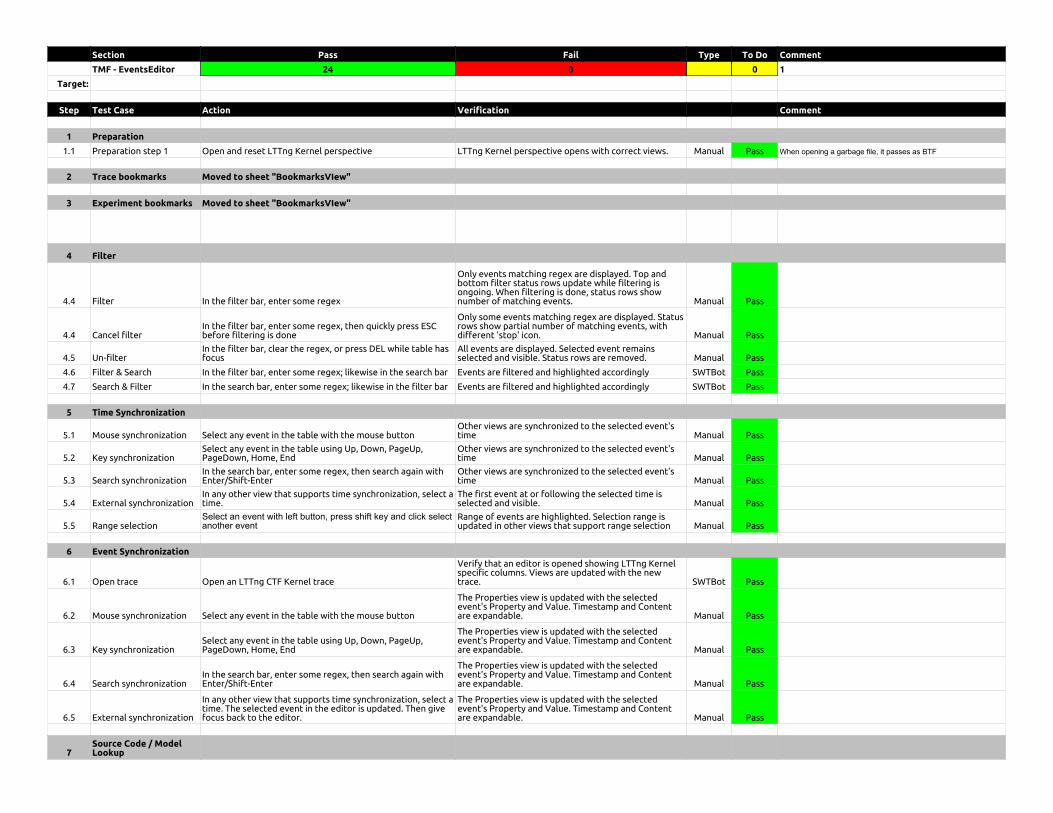
TMF - EventsEditor 24 0 0 1
Target:
Step Test Case Action Verification Comment
1 Preparation
1.1 Preparation step 1 Open and reset LTTng Kernel perspective LTTng Kernel perspective opens with correct views. Manual Pass When opening a garbage file, it passes as BTF
2 Trace bookmarks Moved to sheet "BookmarksVIew"
3 Experiment bookmarks Moved to sheet "BookmarksVIew"
4 Filter
4.4 Filter In the filter bar, enter some regex
Only events matching regex are displayed. Top andbottom filter status rows update while filtering isongoing. When filtering is done, status rows shownumber of matching events. Manual Pass
4.4 Cancel filterIn the filter bar, enter some regex, then quickly press ESCbefore filtering is done
Only some events matching regex are displayed. Statusrows show partial number of matching events, withdifferent 'stop' icon. Manual Pass
4.5 Un-filterIn the filter bar, clear the regex, or press DEL while table hasfocus
All events are displayed. Selected event remainsselected and visible. Status rows are removed. Manual Pass
4.6 Filter & Search In the filter bar, enter some regex; likewise in the search bar Events are filtered and highlighted accordingly SWTBot Pass
4.7 Search & Filter In the search bar, enter some regex; likewise in the filter bar Events are filtered and highlighted accordingly SWTBot Pass
5 Time Synchronization
5.1 Mouse synchronization Select any event in the table with the mouse buttonOther views are synchronized to the selected event'stime Manual Pass
5.2 Key synchronizationSelect any event in the table using Up, Down, PageUp,PageDown, Home, End
Other views are synchronized to the selected event'stime Manual Pass
5.3 Search synchronizationIn the search bar, enter some regex, then search again withEnter/Shift-Enter
Other views are synchronized to the selected event'stime Manual Pass
5.4 External synchronizationIn any other view that supports time synchronization, select atime.
The first event at or following the selected time isselected and visible. Manual Pass
5.5 Range selectionSelect an event with left button, press shift key and click selectanother event
Range of events are highlighted. Selection range isupdated in other views that support range selection Manual Pass
6 Event Synchronization
6.1 Open trace Open an LTTng CTF Kernel trace
Verify that an editor is opened showing LTTng Kernelspecific columns. Views are updated with the newtrace. SWTBot Pass
6.2 Mouse synchronization Select any event in the table with the mouse button
The Properties view is updated with the selectedevent's Property and Value. Timestamp and Contentare expandable. Manual Pass
6.3 Key synchronizationSelect any event in the table using Up, Down, PageUp,PageDown, Home, End
The Properties view is updated with the selectedevent's Property and Value. Timestamp and Contentare expandable. Manual Pass
6.4 Search synchronizationIn the search bar, enter some regex, then search again withEnter/Shift-Enter
The Properties view is updated with the selectedevent's Property and Value. Timestamp and Contentare expandable. Manual Pass
6.5 External synchronization
In any other view that supports time synchronization, select atime. The selected event in the editor is updated. Then givefocus back to the editor.
The Properties view is updated with the selectedevent's Property and Value. Timestamp and Contentare expandable. Manual Pass
7Source Code / ModelLookup
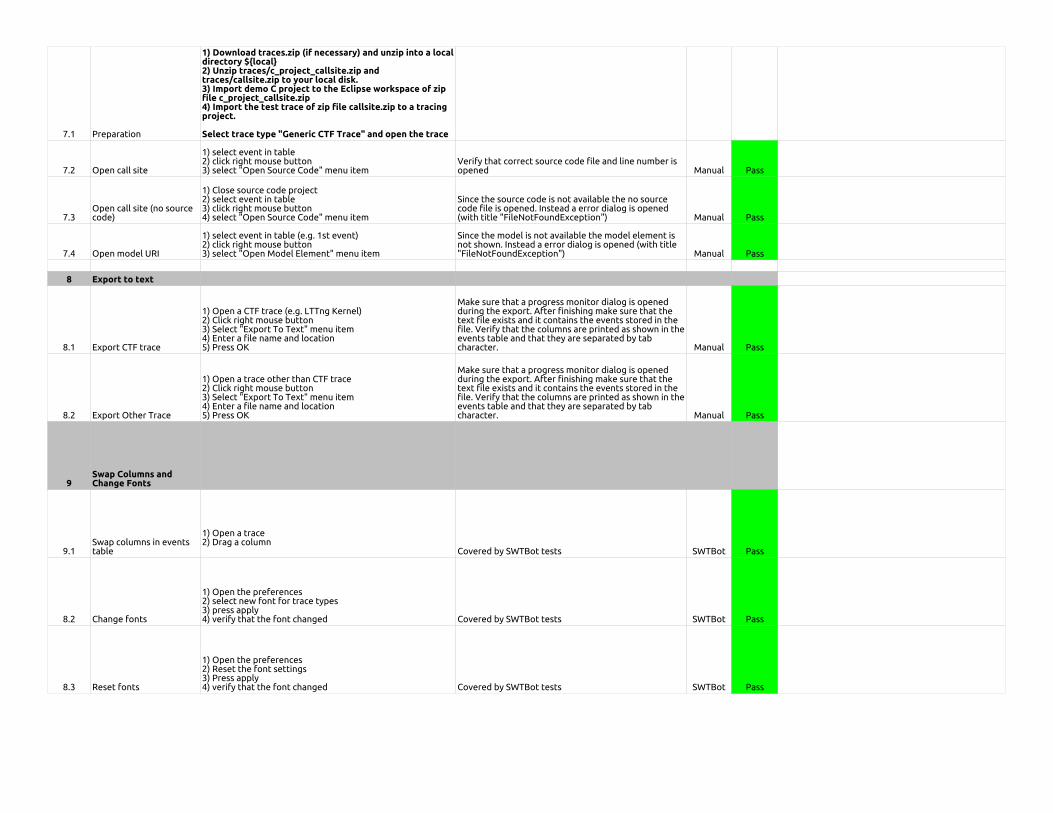
7.1 Preparation
1) Download traces.zip (if necessary) and unzip into a localdirectory ${local}2) Unzip traces/c_project_callsite.zip andtraces/callsite.zip to your local disk.3) Import demo C project to the Eclipse workspace of zipfile c_project_callsite.zip4) Import the test trace of zip file callsite.zip to a tracingproject.
Select trace type "Generic CTF Trace" and open the trace
7.2 Open call site
1) select event in table2) click right mouse button3) select "Open Source Code" menu item
Verify that correct source code file and line number isopened Manual Pass
7.3Open call site (no sourcecode)
1) Close source code project2) select event in table3) click right mouse button4) select "Open Source Code" menu item
Since the source code is not available the no sourcecode file is opened. Instead a error dialog is opened(with title "FileNotFoundException") Manual Pass
7.4 Open model URI
1) select event in table (e.g. 1st event)2) click right mouse button3) select "Open Model Element" menu item
Since the model is not available the model element isnot shown. Instead a error dialog is opened (with title"FileNotFoundException") Manual Pass
8 Export to text
8.1 Export CTF trace
1) Open a CTF trace (e.g. LTTng Kernel)2) Click right mouse button3) Select "Export To Text" menu item4) Enter a file name and location5) Press OK
Make sure that a progress monitor dialog is openedduring the export. After finishing make sure that thetext file exists and it contains the events stored in thefile. Verify that the columns are printed as shown in theevents table and that they are separated by tabcharacter. Manual Pass
8.2 Export Other Trace
1) Open a trace other than CTF trace2) Click right mouse button3) Select "Export To Text" menu item4) Enter a file name and location5) Press OK
Make sure that a progress monitor dialog is openedduring the export. After finishing make sure that thetext file exists and it contains the events stored in thefile. Verify that the columns are printed as shown in theevents table and that they are separated by tabcharacter. Manual Pass
9Swap Columns andChange Fonts
9.1Swap columns in eventstable
1) Open a trace2) Drag a column
Covered by SWTBot tests SWTBot Pass
8.2 Change fonts
1) Open the preferences2) select new font for trace types3) press apply4) verify that the font changed Covered by SWTBot tests SWTBot Pass
8.3 Reset fonts
1) Open the preferences2) Reset the font settings3) Press apply4) verify that the font changed Covered by SWTBot tests SWTBot Pass
Section Pass Fail Type To Do Comment
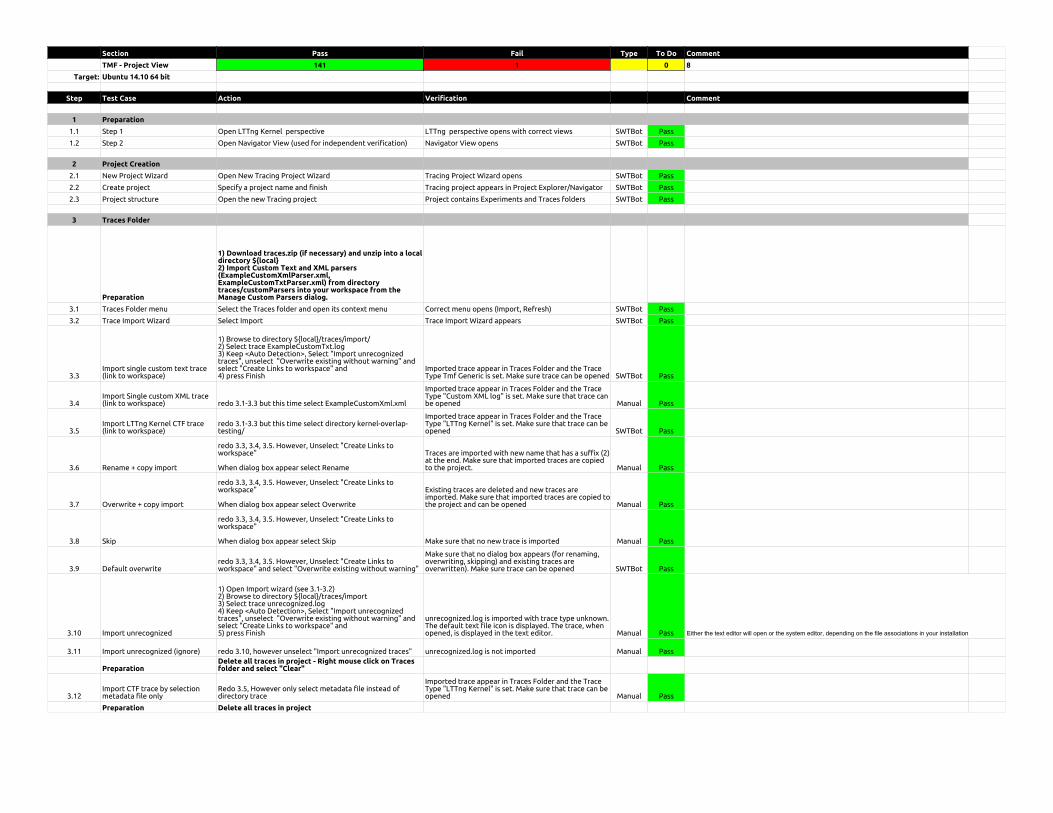
TMF - Project View 141 1 0 8
Target: Ubuntu 14.10 64 bit
Step Test Case Action Verification Comment
1 Preparation
1.1 Step 1 Open LTTng Kernel perspective LTTng perspective opens with correct views SWTBot Pass
1.2 Step 2 Open Navigator View (used for independent verification) Navigator View opens SWTBot Pass
2 Project Creation
2.1 New Project Wizard Open New Tracing Project Wizard Tracing Project Wizard opens SWTBot Pass
2.2 Create project Specify a project name and finish Tracing project appears in Project Explorer/Navigator SWTBot Pass
2.3 Project structure Open the new Tracing project Project contains Experiments and Traces folders SWTBot Pass
3 Traces Folder
Preparation
1) Download traces.zip (if necessary) and unzip into a localdirectory ${local}2) Import Custom Text and XML parsers(ExampleCustomXmlParser.xml,ExampleCustomTxtParser.xml) from directorytraces/customParsers into your workspace from theManage Custom Parsers dialog.
3.1 Traces Folder menu Select the Traces folder and open its context menu Correct menu opens (Import, Refresh) SWTBot Pass
3.3Import single custom text trace(link to workspace)
1) Browse to directory ${local}/traces/import/2) Select trace ExampleCustomTxt.log3) Keep <Auto Detection>, Select "Import unrecognizedtraces", unselect "Overwrite existing without warning" andselect "Create Links to workspace" and4) press Finish
Imported trace appear in Traces Folder and the TraceType Tmf Generic is set. Make sure trace can be opened SWTBot Pass
3.4Import Single custom XML trace(link to workspace) redo 3.1-3.3 but this time select ExampleCustomXml.xml
Imported trace appear in Traces Folder and the TraceType "Custom XML log" is set. Make sure that trace canbe opened Manual Pass
3.5Import LTTng Kernel CTF trace(link to workspace)
redo 3.1-3.3 but this time select directory kernel-overlap-testing/
Imported trace appear in Traces Folder and the TraceType "LTTng Kernel" is set. Make sure that trace can beopened SWTBot Pass
3.6 Rename + copy import
redo 3.3, 3.4, 3.5. However, Unselect "Create Links toworkspace"
When dialog box appear select Rename
Traces are imported with new name that has a suffix (2)at the end. Make sure that imported traces are copiedto the project. Manual Pass
3.7 Overwrite + copy import
redo 3.3, 3.4, 3.5. However, Unselect "Create Links toworkspace"
When dialog box appear select Overwrite
Existing traces are deleted and new traces areimported. Make sure that imported traces are copied tothe project and can be opened Manual Pass
3.8 Skip
redo 3.3, 3.4, 3.5. However, Unselect "Create Links toworkspace"
When dialog box appear select Skip Make sure that no new trace is imported Manual Pass
3.9 Default overwriteredo 3.3, 3.4, 3.5. However, Unselect "Create Links toworkspace" and select "Overwrite existing without warning"
Make sure that no dialog box appears (for renaming,overwriting, skipping) and existing traces areoverwritten). Make sure trace can be opened SWTBot Pass
3.10 Import unrecognized
1) Open Import wizard (see 3.1-3.2)2) Browse to directory ${local}/traces/import3) Select trace unrecognized.log4) Keep <Auto Detection>, Select "Import unrecognizedtraces", unselect "Overwrite existing without warning" andselect "Create Links to workspace" and5) press Finish
unrecognized.log is imported with trace type unknown.The default text file icon is displayed. The trace, whenopened, is displayed in the text editor. Manual Pass
3.11 Import unrecognized (ignore) redo 3.10, however unselect "Import unrecognized traces" unrecognized.log is not imported Manual Pass
PreparationDelete all traces in project - Right mouse click on Tracesfolder and select "Clear"
3.12Import CTF trace by selectionmetadata file only
Redo 3.5, However only select metadata file instead ofdirectory trace
Imported trace appear in Traces Folder and the TraceType "LTTng Kernel" is set. Make sure that trace can beopened Manual Pass
Preparation Delete all traces in project
Either the text editor will open or the system editor, depending on the file associations in your installation
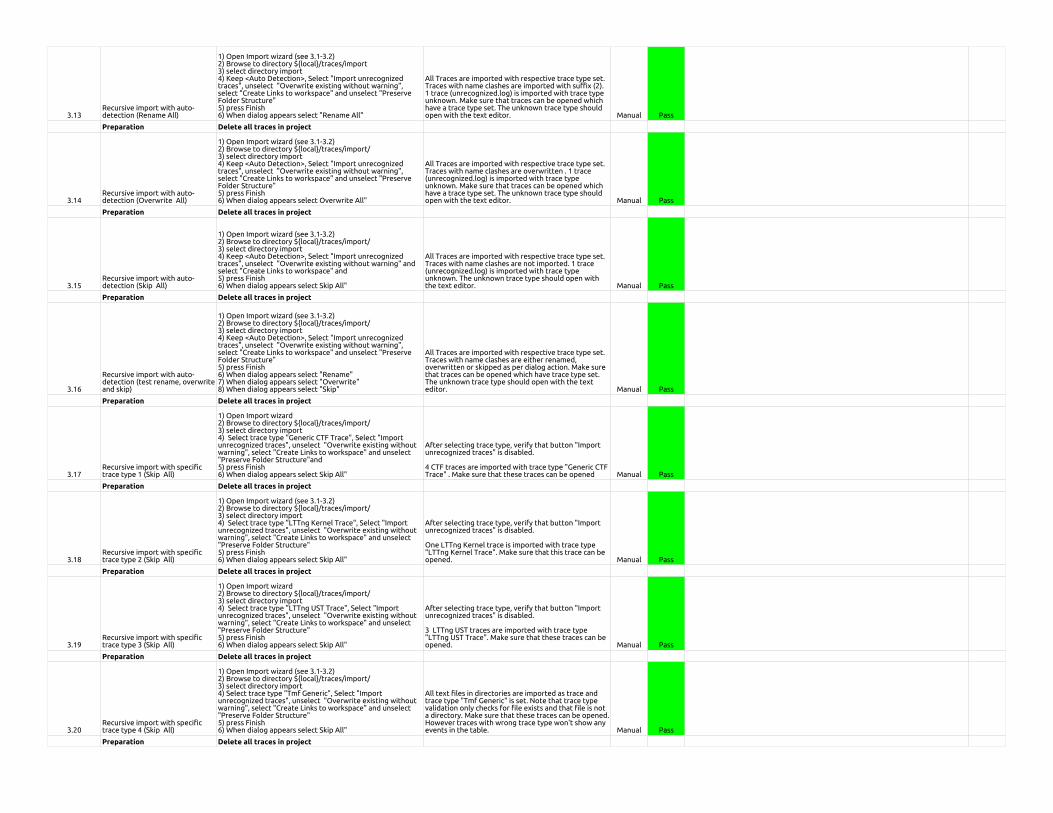
3.13Recursive import with auto-detection (Rename All)
1) Open Import wizard (see 3.1-3.2)2) Browse to directory ${local}/traces/import3) select directory import4) Keep <Auto Detection>, Select "Import unrecognizedtraces", unselect "Overwrite existing without warning",select "Create Links to workspace" and unselect "PreserveFolder Structure"5) press Finish6) When dialog appears select "Rename All"
All Traces are imported with respective trace type set.Traces with name clashes are imported with suffix (2).1 trace (unrecognized.log) is imported with trace typeunknown. Make sure that traces can be opened whichhave a trace type set. The unknown trace type shouldopen with the text editor. Manual Pass
Preparation Delete all traces in project
3.14Recursive import with auto-detection (Overwrite All)
1) Open Import wizard (see 3.1-3.2)2) Browse to directory ${local}/traces/import/3) select directory import4) Keep <Auto Detection>, Select "Import unrecognizedtraces", unselect "Overwrite existing without warning",select "Create Links to workspace" and unselect "PreserveFolder Structure"5) press Finish6) When dialog appears select Overwrite All"
All Traces are imported with respective trace type set.Traces with name clashes are overwritten . 1 trace(unrecognized.log) is imported with trace typeunknown. Make sure that traces can be opened whichhave a trace type set. The unknown trace type shouldopen with the text editor. Manual Pass
Preparation Delete all traces in project
3.15Recursive import with auto-detection (Skip All)
1) Open Import wizard (see 3.1-3.2)2) Browse to directory ${local}/traces/import/3) select directory import4) Keep <Auto Detection>, Select "Import unrecognizedtraces", unselect "Overwrite existing without warning" andselect "Create Links to workspace" and5) press Finish6) When dialog appears select Skip All"
All Traces are imported with respective trace type set.Traces with name clashes are not imported. 1 trace(unrecognized.log) is imported with trace typeunknown. The unknown trace type should open withthe text editor. Manual Pass
Preparation Delete all traces in project
3.16
Recursive import with auto-detection (test rename, overwriteand skip)
1) Open Import wizard (see 3.1-3.2)2) Browse to directory ${local}/traces/import/3) select directory import4) Keep <Auto Detection>, Select "Import unrecognizedtraces", unselect "Overwrite existing without warning",select "Create Links to workspace" and unselect "PreserveFolder Structure"5) press Finish6) When dialog appears select "Rename"7) When dialog appears select "Overwrite"8) When dialog appears select "Skip"
All Traces are imported with respective trace type set.Traces with name clashes are either renamed,overwritten or skipped as per dialog action. Make surethat traces can be opened which have trace type set.The unknown trace type should open with the texteditor. Manual Pass
Preparation Delete all traces in project
3.17Recursive import with specifictrace type 1 (Skip All)
1) Open Import wizard2) Browse to directory ${local}/traces/import/3) select directory import4) Select trace type "Generic CTF Trace", Select "Importunrecognized traces", unselect "Overwrite existing withoutwarning", select "Create Links to workspace" and unselect"Preserve Folder Structure"and5) press Finish6) When dialog appears select Skip All"
After selecting trace type, verify that button "Importunrecognized traces" is disabled.
4 CTF traces are imported with trace type "Generic CTFTrace" . Make sure that these traces can be opened Manual Pass
Preparation Delete all traces in project
3.18Recursive import with specifictrace type 2 (Skip All)
1) Open Import wizard (see 3.1-3.2)2) Browse to directory ${local}/traces/import/3) select directory import4) Select trace type "LTTng Kernel Trace", Select "Importunrecognized traces", unselect "Overwrite existing withoutwarning", select "Create Links to workspace" and unselect"Preserve Folder Structure"5) press Finish6) When dialog appears select Skip All"
After selecting trace type, verify that button "Importunrecognized traces" is disabled.
One LTTng Kernel trace is imported with trace type"LTTng Kernel Trace". Make sure that this trace can beopened. Manual Pass
Preparation Delete all traces in project
3.19Recursive import with specifictrace type 3 (Skip All)
1) Open Import wizard2) Browse to directory ${local}/traces/import/3) select directory import4) Select trace type "LTTng UST Trace", Select "Importunrecognized traces", unselect "Overwrite existing withoutwarning", select "Create Links to workspace" and unselect"Preserve Folder Structure"5) press Finish6) When dialog appears select Skip All"
After selecting trace type, verify that button "Importunrecognized traces" is disabled.
3 LTTng UST traces are imported with trace type"LTTng UST Trace". Make sure that these traces can beopened. Manual Pass
Preparation Delete all traces in project
3.20Recursive import with specifictrace type 4 (Skip All)
1) Open Import wizard (see 3.1-3.2)2) Browse to directory ${local}/traces/import/3) select directory import4) Select trace type "Tmf Generic", Select "Importunrecognized traces", unselect "Overwrite existing withoutwarning", select "Create Links to workspace" and unselect"Preserve Folder Structure"5) press Finish6) When dialog appears select Skip All"
All text files in directories are imported as trace andtrace type "Tmf Generic" is set. Note that trace typevalidation only checks for file exists and that file is nota directory. Make sure that these traces can be opened.However traces with wrong trace type won't show anyevents in the table. Manual Pass
Preparation Delete all traces in project
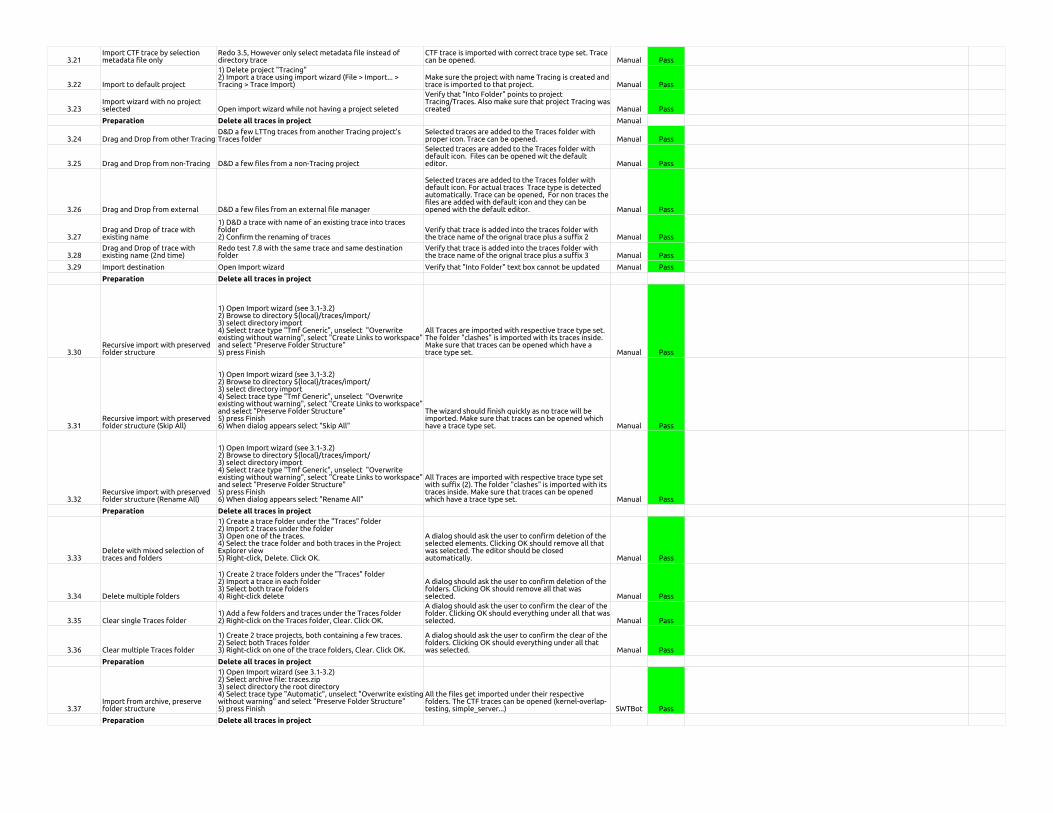
3.21Import CTF trace by selectionmetadata file only
Redo 3.5, However only select metadata file instead ofdirectory trace
CTF trace is imported with correct trace type set. Tracecan be opened. Manual Pass
3.22 Import to default project
1) Delete project "Tracing"2) Import a trace using import wizard (File > Import... >Tracing > Trace Import)
Make sure the project with name Tracing is created andtrace is imported to that project. Manual Pass
3.23Import wizard with no projectselected Open import wizard while not having a project seleted
Verify that "Into Folder" points to projectTracing/Traces. Also make sure that project Tracing wascreated Manual Pass
Preparation Delete all traces in project Manual
3.24 Drag and Drop from other TracingD&D a few LTTng traces from another Tracing project'sTraces folder
Selected traces are added to the Traces folder withproper icon. Trace can be opened. Manual Pass
3.25 Drag and Drop from non-Tracing D&D a few files from a non-Tracing project
Selected traces are added to the Traces folder withdefault icon. Files can be opened wit the defaulteditor. Manual Pass
3.26 Drag and Drop from external D&D a few files from an external file manager
Selected traces are added to the Traces folder withdefault icon. For actual traces Trace type is detectedautomatically. Trace can be opened, For non traces thefiles are added with default icon and they can beopened with the default editor. Manual Pass
3.27Drag and Drop of trace withexisting name
1) D&D a trace with name of an existing trace into tracesfolder2) Confirm the renaming of traces
Verify that trace is added into the traces folder withthe trace name of the orignal trace plus a suffix 2 Manual Pass
3.28Drag and Drop of trace withexisting name (2nd time)
Redo test 7.8 with the same trace and same destinationfolder
Verify that trace is added into the traces folder withthe trace name of the orignal trace plus a suffix 3 Manual Pass
3.29 Import destination Open Import wizard Verify that "Into Folder" text box cannot be updated Manual Pass
Preparation Delete all traces in project
3.30Recursive import with preservedfolder structure
1) Open Import wizard (see 3.1-3.2)2) Browse to directory ${local}/traces/import/3) select directory import4) Select trace type "Tmf Generic", unselect "Overwriteexisting without warning", select "Create Links to workspace"and select "Preserve Folder Structure"5) press Finish
All Traces are imported with respective trace type set.The folder "clashes" is imported with its traces inside.Make sure that traces can be opened which have atrace type set. Manual Pass
3.31Recursive import with preservedfolder structure (Skip All)
1) Open Import wizard (see 3.1-3.2)2) Browse to directory ${local}/traces/import/3) select directory import4) Select trace type "Tmf Generic", unselect "Overwriteexisting without warning", select "Create Links to workspace"and select "Preserve Folder Structure"5) press Finish6) When dialog appears select "Skip All"
The wizard should finish quickly as no trace will beimported. Make sure that traces can be opened whichhave a trace type set. Manual Pass
3.32Recursive import with preservedfolder structure (Rename All)
1) Open Import wizard (see 3.1-3.2)2) Browse to directory ${local}/traces/import/3) select directory import4) Select trace type "Tmf Generic", unselect "Overwriteexisting without warning", select "Create Links to workspace"and select "Preserve Folder Structure"5) press Finish6) When dialog appears select "Rename All"
All Traces are imported with respective trace type setwith suffix (2). The folder "clashes" is imported with itstraces inside. Make sure that traces can be openedwhich have a trace type set. Manual Pass
Preparation Delete all traces in project
3.33Delete with mixed selection oftraces and folders
1) Create a trace folder under the "Traces" folder2) Import 2 traces under the folder3) Open one of the traces.4) Select the trace folder and both traces in the ProjectExplorer view5) Right-click, Delete. Click OK.
A dialog should ask the user to confirm deletion of theselected elements. Clicking OK should remove all thatwas selected. The editor should be closedautomatically. Manual Pass
3.34 Delete multiple folders
1) Create 2 trace folders under the "Traces" folder2) Import a trace in each folder3) Select both trace folders4) Right-click delete
A dialog should ask the user to confirm deletion of thefolders. Clicking OK should remove all that wasselected. Manual Pass
3.35 Clear single Traces folder1) Add a few folders and traces under the Traces folder2) Right-click on the Traces folder, Clear. Click OK.
A dialog should ask the user to confirm the clear of thefolder. Clicking OK should everything under all that wasselected. Manual Pass
3.36 Clear multiple Traces folder
1) Create 2 trace projects, both containing a few traces.2) Select both Traces folder3) Right-click on one of the trace folders, Clear. Click OK.
A dialog should ask the user to confirm the clear of thefolders. Clicking OK should everything under all thatwas selected. Manual Pass
Preparation Delete all traces in project
3.37Import from archive, preservefolder structure
1) Open Import wizard (see 3.1-3.2)2) Select archive file: traces.zip3) select directory the root directory4) Select trace type "Automatic", unselect "Overwrite existingwithout warning" and select "Preserve Folder Structure"5) press Finish
All the files get imported under their respectivefolders. The CTF traces can be opened (kernel-overlap-testing, simple_server...) SWTBot Pass
Preparation Delete all traces in project
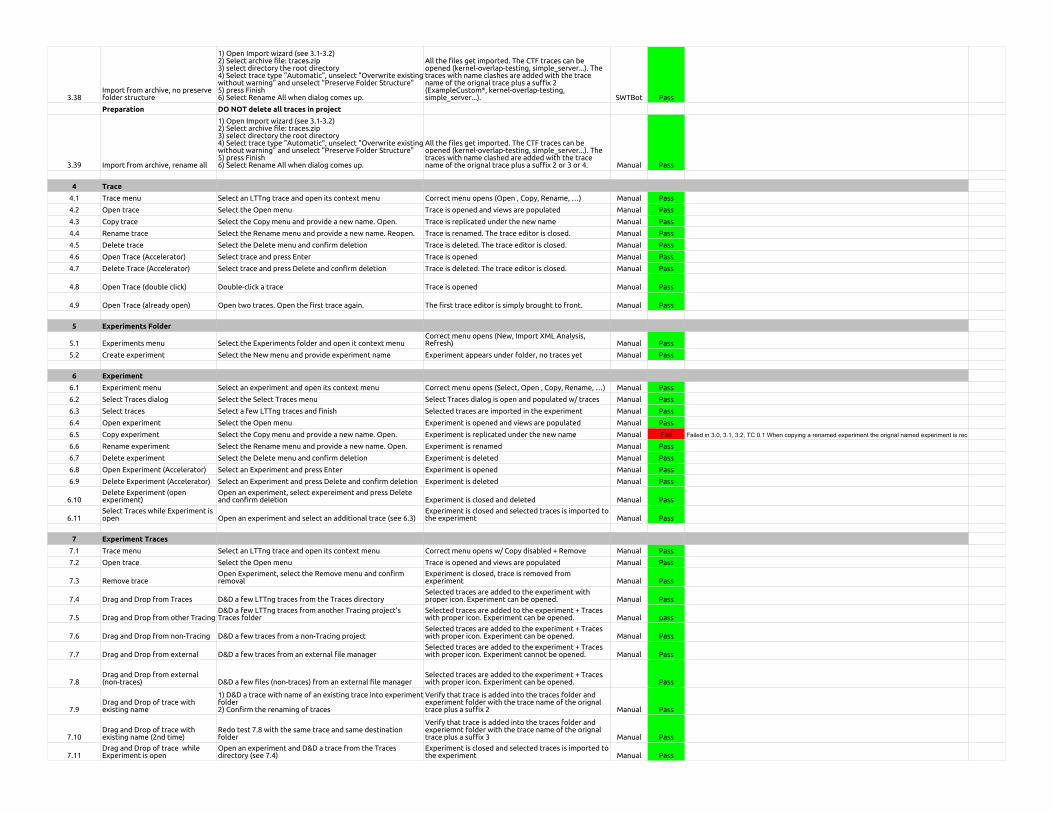
3.38Import from archive, no preservefolder structure
1) Open Import wizard (see 3.1-3.2)2) Select archive file: traces.zip3) select directory the root directory4) Select trace type "Automatic", unselect "Overwrite existingwithout warning" and unselect "Preserve Folder Structure"5) press Finish6) Select Rename All when dialog comes up.
All the files get imported. The CTF traces can beopened (kernel-overlap-testing, simple_server...). Thetraces with name clashes are added with the tracename of the orignal trace plus a suffix 2(ExampleCustom*, kernel-overlap-testing,simple_server...). SWTBot Pass
Preparation DO NOT delete all traces in project
3.39 Import from archive, rename all
1) Open Import wizard (see 3.1-3.2)2) Select archive file: traces.zip3) select directory the root directory4) Select trace type "Automatic", unselect "Overwrite existingwithout warning" and unselect "Preserve Folder Structure"5) press Finish6) Select Rename All when dialog comes up.
All the files get imported. The CTF traces can beopened (kernel-overlap-testing, simple_server...). Thetraces with name clashed are added with the tracename of the orignal trace plus a suffix 2 or 3 or 4. Manual Pass
4 Trace
4.1 Trace menu Select an LTTng trace and open its context menu Correct menu opens (Open , Copy, Rename, …) Manual Pass
4.2 Open trace Select the Open menu Trace is opened and views are populated Manual Pass
4.3 Copy trace Select the Copy menu and provide a new name. Open. Trace is replicated under the new name Manual Pass
4.4 Rename trace Select the Rename menu and provide a new name. Reopen. Trace is renamed. The trace editor is closed. Manual Pass
4.5 Delete trace Select the Delete menu and confirm deletion Trace is deleted. The trace editor is closed. Manual Pass
4.6 Open Trace (Accelerator) Select trace and press Enter Trace is opened Manual Pass
4.7 Delete Trace (Accelerator) Select trace and press Delete and confirm deletion Trace is deleted. The trace editor is closed. Manual Pass
4.8 Open Trace (double click) Double-click a trace Trace is opened Manual Pass
4.9 Open Trace (already open) Open two traces. Open the first trace again. The first trace editor is simply brought to front. Manual Pass
5 Experiments Folder
5.1 Experiments menu Select the Experiments folder and open it context menuCorrect menu opens (New, Import XML Analysis,Refresh) Manual Pass
5.2 Create experiment Select the New menu and provide experiment name Experiment appears under folder, no traces yet Manual Pass
6 Experiment
6.1 Experiment menu Select an experiment and open its context menu Correct menu opens (Select, Open , Copy, Rename, …) Manual Pass
6.2 Select Traces dialog Select the Select Traces menu Select Traces dialog is open and populated w/ traces Manual Pass
6.3 Select traces Select a few LTTng traces and finish Selected traces are imported in the experiment Manual Pass
6.4 Open experiment Select the Open menu Experiment is opened and views are populated Manual Pass
6.5 Copy experiment Select the Copy menu and provide a new name. Open. Experiment is replicated under the new name Manual Fail Failed in 3.0, 3.1, 3.2, TC 0.1 When copying a renamed experiment the orignal named experiment is rec
6.6 Rename experiment Select the Rename menu and provide a new name. Open. Experiment is renamed Manual Pass
6.7 Delete experiment Select the Delete menu and confirm deletion Experiment is deleted Manual Pass
6.8 Open Experiment (Accelerator) Select an Experiment and press Enter Experiment is opened Manual Pass
6.9 Delete Experiment (Accelerator) Select an Experiment and press Delete and confirm deletion Experiment is deleted Manual Pass
6.10Delete Experiment (openexperiment)
Open an experiment, select expereiment and press Deleteand confirm deletion Experiment is closed and deleted Manual Pass
6.11Select Traces while Experiment isopen Open an experiment and select an additional trace (see 6.3)
Experiment is closed and selected traces is imported tothe experiment Manual Pass
7 Experiment Traces
7.1 Trace menu Select an LTTng trace and open its context menu Correct menu opens w/ Copy disabled + Remove Manual Pass
7.2 Open trace Select the Open menu Trace is opened and views are populated Manual Pass
7.3 Remove traceOpen Experiment, select the Remove menu and confirmremoval
Experiment is closed, trace is removed fromexperiment Manual Pass
7.4 Drag and Drop from Traces D&D a few LTTng traces from the Traces directorySelected traces are added to the experiment withproper icon. Experiment can be opened. Manual Pass
7.5 Drag and Drop from other TracingD&D a few LTTng traces from another Tracing project'sTraces folder
Selected traces are added to the experiment + Traceswith proper icon. Experiment can be opened. Manual pass
7.6 Drag and Drop from non-Tracing D&D a few traces from a non-Tracing projectSelected traces are added to the experiment + Traceswith proper icon. Experiment can be opened. Manual Pass
7.7 Drag and Drop from external D&D a few traces from an external file managerSelected traces are added to the experiment + Traceswith proper icon. Experiment cannot be opened. Manual Pass
7.8Drag and Drop from external(non-traces) D&D a few files (non-traces) from an external file manager
Selected traces are added to the experiment + Traceswith proper icon. Experiment can be opened. Pass
7.9Drag and Drop of trace withexisting name
1) D&D a trace with name of an existing trace into experimentfolder2) Confirm the renaming of traces
Verify that trace is added into the traces folder andexperiment folder with the trace name of the orignaltrace plus a suffix 2 Manual Pass
7.10Drag and Drop of trace withexisting name (2nd time)
Redo test 7.8 with the same trace and same destinationfolder
Verify that trace is added into the traces folder andexperiemnt folder with the trace name of the orignaltrace plus a suffix 3 Manual Pass
7.11Drag and Drop of trace whileExperiment is open
Open an experiment and D&D a trace from the Tracesdirectory (see 7.4)
Experiment is closed and selected traces is imported tothe experiment Manual Pass
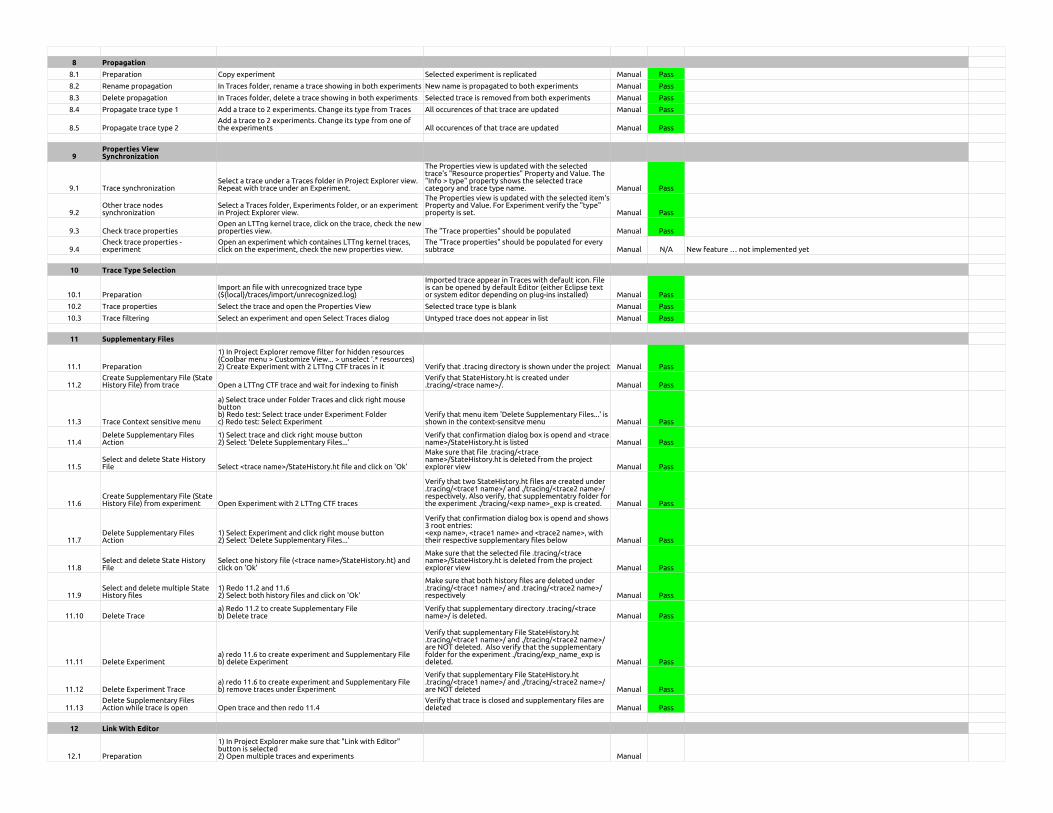
8 Propagation
8.1 Preparation Copy experiment Selected experiment is replicated Manual Pass
8.2 Rename propagation In Traces folder, rename a trace showing in both experiments New name is propagated to both experiments Manual Pass
8.3 Delete propagation In Traces folder, delete a trace showing in both experiments Selected trace is removed from both experiments Manual Pass
8.4 Propagate trace type 1 Add a trace to 2 experiments. Change its type from Traces All occurences of that trace are updated Manual Pass
8.5 Propagate trace type 2Add a trace to 2 experiments. Change its type from one ofthe experiments All occurences of that trace are updated Manual Pass
9Properties ViewSynchronization
9.1 Trace synchronizationSelect a trace under a Traces folder in Project Explorer view.Repeat with trace under an Experiment.
The Properties view is updated with the selectedtrace's "Resource properties" Property and Value. The"Info > type" property shows the selected tracecategory and trace type name. Manual Pass
9.2Other trace nodessynchronization
Select a Traces folder, Experiments folder, or an experimentin Project Explorer view.
The Properties view is updated with the selected item'sProperty and Value. For Experiment verify the "type"property is set. Manual Pass
9.3 Check trace propertiesOpen an LTTng kernel trace, click on the trace, check the newproperties view. The "Trace properties" should be populated Manual Pass
9.4Check trace properties -experiment
Open an experiment which containes LTTng kernel traces,click on the experiment, check the new properties view.
The "Trace properties" should be populated for everysubtrace Manual N/A New feature … not implemented yet
10 Trace Type Selection
10.1 PreparationImport an file with unrecognized trace type(${local}/traces/import/unrecognized.log)
Imported trace appear in Traces with default icon. Fileis can be opened by default Editor (either Eclipse textor system editor depending on plug-ins installed) Manual Pass
10.2 Trace properties Select the trace and open the Properties View Selected trace type is blank Manual Pass
10.3 Trace filtering Select an experiment and open Select Traces dialog Untyped trace does not appear in list Manual Pass
11 Supplementary Files
11.1 Preparation
1) In Project Explorer remove filter for hidden resources(Coolbar menu > Customize View... > unselect '.* resources)2) Create Experiment with 2 LTTng CTF traces in it Verify that .tracing directory is shown under the project Manual Pass
11.2Create Supplementary File (StateHistory File) from trace Open a LTTng CTF trace and wait for indexing to finish
Verify that StateHistory.ht is created under.tracing/<trace name>/. Manual Pass
11.3 Trace Context sensitive menu
a) Select trace under Folder Traces and click right mousebuttonb) Redo test: Select trace under Experiment Folderc) Redo test: Select Experiment
Verify that menu item 'Delete Supplementary Files...' isshown in the context-sensitve menu Manual Pass
11.4Delete Supplementary FilesAction
1) Select trace and click right mouse button2) Select 'Delete Supplementary Files...'
Verify that confirmation dialog box is opend and <tracename>/StateHistory.ht is listed Manual Pass
11.5Select and delete State HistoryFile Select <trace name>/StateHistory.ht file and click on 'Ok'
Make sure that file .tracing/<tracename>/StateHistory.ht is deleted from the projectexplorer view Manual Pass
11.6Create Supplementary File (StateHistory File) from experiment Open Experiment with 2 LTTng CTF traces
Verify that two StateHistory.ht files are created under.tracing/<trace1 name>/ and ./tracing/<trace2 name>/respectively. Also verify, that supplementatry folder forthe experiment ./tracing/<exp name>_exp is created. Manual Pass
11.7Delete Supplementary FilesAction
1) Select Experiment and click right mouse button2) Select 'Delete Supplementary Files...'
Verify that confirmation dialog box is opend and shows3 root entries:<exp name>, <trace1 name> and <trace2 name>, withtheir respective supplementary files below Manual Pass
11.8Select and delete State HistoryFile
Select one history file (<trace name>/StateHistory.ht) andclick on 'Ok'
Make sure that the selected file .tracing/<tracename>/StateHistory.ht is deleted from the projectexplorer view Manual Pass
11.9Select and delete multiple StateHistory files
1) Redo 11.2 and 11.62) Select both history files and click on 'Ok'
Make sure that both history files are deleted under.tracing/<trace1 name>/ and .tracing/<trace2 name>/respectively Manual Pass
Verify that supplementary directory .tracing/<tracename>/ is deleted. Manual Pass
11.11 Delete Experimenta) redo 11.6 to create experiment and Supplementary Fileb) delete Experiment
Verify that supplementary File StateHistory.ht.tracing/<trace1 name>/ and ./tracing/<trace2 name>/are NOT deleted. Also verify that the supplementaryfolder for the experiment ./tracing/exp_name_exp isdeleted. Manual Pass
11.12 Delete Experiment Tracea) redo 11.6 to create experiment and Supplementary Fileb) remove traces under Experiment
Verify that supplementary File StateHistory.ht.tracing/<trace1 name>/ and ./tracing/<trace2 name>/are NOT deleted Manual Pass
11.13Delete Supplementary FilesAction while trace is open Open trace and then redo 11.4
Verify that trace is closed and supplementary files aredeleted Manual Pass
12 Link With Editor
12.1 Preparation
1) In Project Explorer make sure that "Link with Editor"button is selected2) Open multiple traces and experiments Manual
12.2Select trace/experiment in Editorsarea
Select several traces and experiments one after each other inEditors area
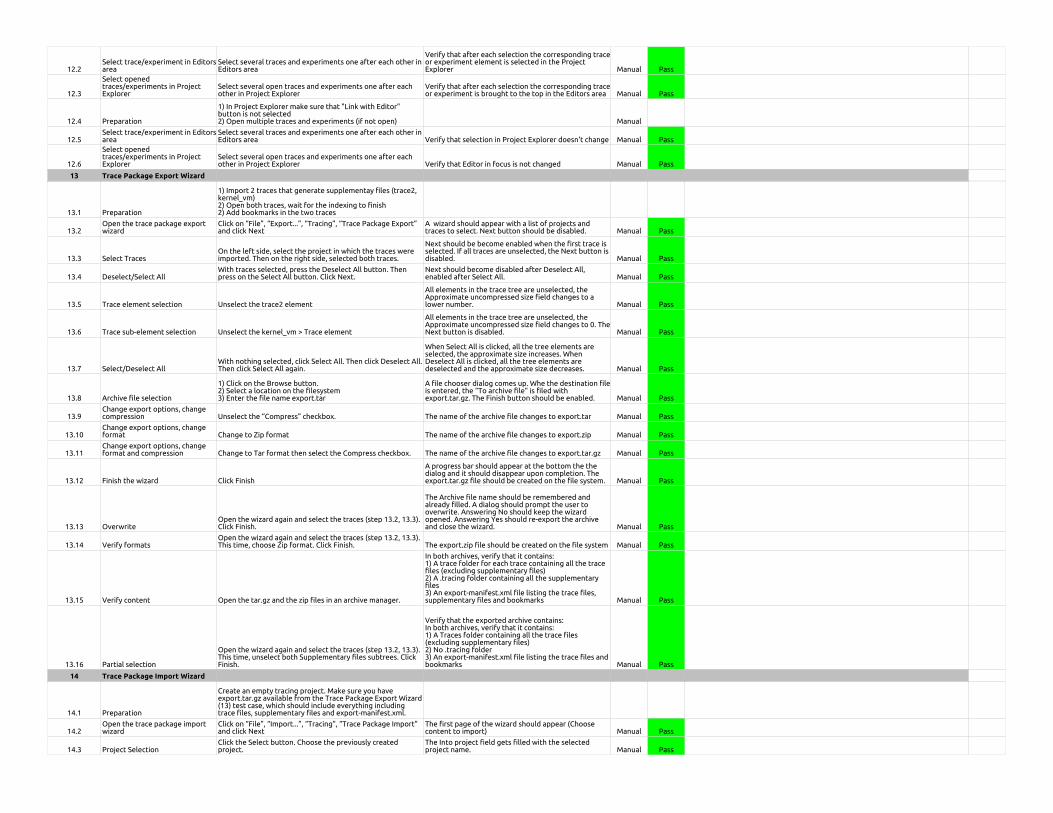
Verify that after each selection the corresponding traceor experiment element is selected in the ProjectExplorer Manual Pass
12.3
Select openedtraces/experiments in ProjectExplorer
Select several open traces and experiments one after eachother in Project Explorer
Verify that after each selection the corresponding traceor experiment is brought to the top in the Editors area Manual Pass
12.4 Preparation
1) In Project Explorer make sure that "Link with Editor"button is not selected2) Open multiple traces and experiments (if not open) Manual
12.5Select trace/experiment in Editorsarea
Select several traces and experiments one after each other inEditors area Verify that selection in Project Explorer doesn't change Manual Pass
12.6
Select openedtraces/experiments in ProjectExplorer
Select several open traces and experiments one after eachother in Project Explorer Verify that Editor in focus is not changed Manual Pass
13 Trace Package Export Wizard
13.1 Preparation
1) Import 2 traces that generate supplementay files (trace2,kernel_vm)2) Open both traces, wait for the indexing to finish2) Add bookmarks in the two traces
13.2Open the trace package exportwizard
Click on “File”, “Export...”, “Tracing”, “Trace Package Export”and click Next
A wizard should appear with a list of projects andtraces to select. Next button should be disabled. Manual Pass
13.3 Select TracesOn the left side, select the project in which the traces wereimported. Then on the right side, selected both traces.
Next should be become enabled when the first trace isselected. If all traces are unselected, the Next button isdisabled. Manual Pass
13.4 Deselect/Select AllWith traces selected, press the Deselect All button. Thenpress on the Select All button. Click Next.
Next should become disabled after Deselect All,enabled after Select All. Manual Pass
13.5 Trace element selection Unselect the trace2 element
All elements in the trace tree are unselected, theApproximate uncompressed size field changes to alower number. Manual Pass
13.6 Trace sub-element selection Unselect the kernel_vm > Trace element
All elements in the trace tree are unselected, theApproximate uncompressed size field changes to 0. TheNext button is disabled. Manual Pass
13.7 Select/Deselect AllWith nothing selected, click Select All. Then click Deselect All.Then click Select All again.
When Select All is clicked, all the tree elements areselected, the approximate size increases. WhenDeselect All is clicked, all the tree elements aredeselected and the approximate size decreases. Manual Pass
13.8 Archive file selection
1) Click on the Browse button.2) Select a location on the filesystem3) Enter the file name export.tar
A file chooser dialog comes up. Whe the destination fileis entered, the “To archive file” is filed withexport.tar.gz. The Finish button should be enabled. Manual Pass
13.9Change export options, changecompression Unselect the “Compress” checkbox. The name of the archive file changes to export.tar Manual Pass
13.10Change export options, changeformat Change to Zip format The name of the archive file changes to export.zip Manual Pass
13.11Change export options, changeformat and compression Change to Tar format then select the Compress checkbox. The name of the archive file changes to export.tar.gz Manual Pass
13.12 Finish the wizard Click Finish
A progress bar should appear at the bottom the thedialog and it should disappear upon completion. Theexport.tar.gz file should be created on the file system. Manual Pass
13.13 OverwriteOpen the wizard again and select the traces (step 13.2, 13.3).Click Finish.
The Archive file name should be remembered andalready filled. A dialog should prompt the user tooverwrite. Answering No should keep the wizardopened. Answering Yes should re-export the archiveand close the wizard. Manual Pass
13.14 Verify formatsOpen the wizard again and select the traces (step 13.2, 13.3).This time, choose Zip format. Click Finish. The export.zip file should be created on the file system Manual Pass
13.15 Verify content Open the tar.gz and the zip files in an archive manager.
In both archives, verify that it contains:1) A trace folder for each trace containing all the tracefiles (excluding supplementary files)2) A .tracing folder containing all the supplementaryfiles3) An export-manifest.xml file listing the trace files,supplementary files and bookmarks Manual Pass
13.16 Partial selection
Open the wizard again and select the traces (step 13.2, 13.3).This time, unselect both Supplementary files subtrees. ClickFinish.
Verify that the exported archive contains:In both archives, verify that it contains:1) A Traces folder containing all the trace files(excluding supplementary files)2) No .tracing folder3) An export-manifest.xml file listing the trace files andbookmarks Manual Pass
14 Trace Package Import Wizard
14.1 Preparation
Create an empty tracing project. Make sure you haveexport.tar.gz available from the Trace Package Export Wizard(13) test case, which should include everything includingtrace files, supplementary files and export-manifest.xml.
14.2Open the trace package importwizard
Click on “File”, “Import...”, “Tracing”, “Trace Package Import”and click Next
The first page of the wizard should appear (Choosecontent to import) Manual Pass
14.3 Project SelectionClick the Select button. Choose the previously createdproject.
The Into project field gets filled with the selectedproject name. Manual Pass
14.4 Archive file selection1) Click on the Browse button.2) Browse for export.tar.gz on the file system
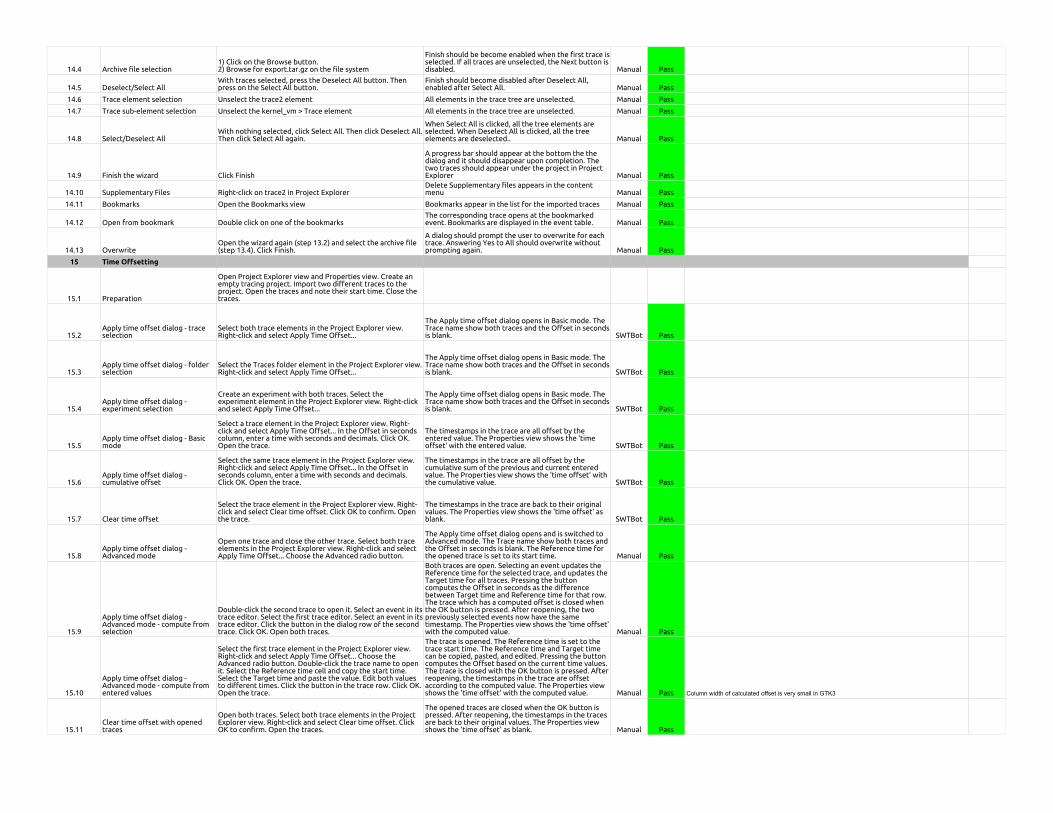
Finish should be become enabled when the first trace isselected. If all traces are unselected, the Next button isdisabled. Manual Pass
14.5 Deselect/Select AllWith traces selected, press the Deselect All button. Thenpress on the Select All button.
Finish should become disabled after Deselect All,enabled after Select All. Manual Pass
14.6 Trace element selection Unselect the trace2 element All elements in the trace tree are unselected. Manual Pass
14.7 Trace sub-element selection Unselect the kernel_vm > Trace element All elements in the trace tree are unselected. Manual Pass
14.8 Select/Deselect AllWith nothing selected, click Select All. Then click Deselect All.Then click Select All again.
When Select All is clicked, all the tree elements areselected. When Deselect All is clicked, all the treeelements are deselected.. Manual Pass
14.9 Finish the wizard Click Finish
A progress bar should appear at the bottom the thedialog and it should disappear upon completion. Thetwo traces should appear under the project in ProjectExplorer Manual Pass
14.10 Supplementary Files Right-click on trace2 in Project ExplorerDelete Supplementary files appears in the contentmenu Manual Pass
14.11 Bookmarks Open the Bookmarks view Bookmarks appear in the list for the imported traces Manual Pass
14.12 Open from bookmark Double click on one of the bookmarksThe corresponding trace opens at the bookmarkedevent. Bookmarks are displayed in the event table. Manual Pass
14.13 OverwriteOpen the wizard again (step 13.2) and select the archive file(step 13.4). Click Finish.
A dialog should prompt the user to overwrite for eachtrace. Answering Yes to All should overwrite withoutprompting again. Manual Pass
15 Time Offsetting
15.1 Preparation
Open Project Explorer view and Properties view. Create anempty tracing project. Import two different traces to theproject. Open the traces and note their start time. Close thetraces.
15.2Apply time offset dialog - traceselection
Select both trace elements in the Project Explorer view.Right-click and select Apply Time Offset...
The Apply time offset dialog opens in Basic mode. TheTrace name show both traces and the Offset in secondsis blank. SWTBot Pass
15.3Apply time offset dialog - folderselection
Select the Traces folder element in the Project Explorer view.Right-click and select Apply Time Offset...
The Apply time offset dialog opens in Basic mode. TheTrace name show both traces and the Offset in secondsis blank. SWTBot Pass
15.4Apply time offset dialog -experiment selection
Create an experiment with both traces. Select theexperiment element in the Project Explorer view. Right-clickand select Apply Time Offset...
The Apply time offset dialog opens in Basic mode. TheTrace name show both traces and the Offset in secondsis blank. SWTBot Pass
15.5Apply time offset dialog - Basicmode
Select a trace element in the Project Explorer view. Right-click and select Apply Time Offset... In the Offset in secondscolumn, enter a time with seconds and decimals. Click OK.Open the trace.
The timestamps in the trace are all offset by theentered value. The Properties view shows the 'timeoffset' with the entered value. SWTBot Pass
15.6Apply time offset dialog -cumulative offset
Select the same trace element in the Project Explorer view.Right-click and select Apply Time Offset... In the Offset inseconds column, enter a time with seconds and decimals.Click OK. Open the trace.
The timestamps in the trace are all offset by thecumulative sum of the previous and current enteredvalue. The Properties view shows the 'time offset' withthe cumulative value. SWTBot Pass
15.7 Clear time offset
Select the trace element in the Project Explorer view. Right-click and select Clear time offset. Click OK to confirm. Openthe trace.
The timestamps in the trace are back to their originalvalues. The Properties view shows the 'time offset' asblank. SWTBot Pass
15.8Apply time offset dialog -Advanced mode
Open one trace and close the other trace. Select both traceelements in the Project Explorer view. Right-click and selectApply Time Offset... Choose the Advanced radio button.
The Apply time offset dialog opens and is switched toAdvanced mode. The Trace name show both traces andthe Offset in seconds is blank. The Reference time forthe opened trace is set to its start time. Manual Pass
15.9
Apply time offset dialog -Advanced mode - compute fromselection
Double-click the second trace to open it. Select an event in itstrace editor. Select the first trace editor. Select an event in itstrace editor. Click the button in the dialog row of the secondtrace. Click OK. Open both traces.
Both traces are open. Selecting an event updates theReference time for the selected trace, and updates theTarget time for all traces. Pressing the buttoncomputes the Offset in seconds as the differencebetween Target time and Reference time for that row.The trace which has a computed offset is closed whenthe OK button is pressed. After reopening, the twopreviously selected events now have the sametimestamp. The Properties view shows the 'time offset'with the computed value. Manual Pass
15.10
Apply time offset dialog -Advanced mode - compute fromentered values
Select the first trace element in the Project Explorer view.Right-click and select Apply Time Offset... Choose theAdvanced radio button. Double-click the trace name to openit. Select the Reference time cell and copy the start time.Select the Target time and paste the value. Edit both valuesto different times. Click the button in the trace row. Click OK.Open the trace.
The trace is opened. The Reference time is set to thetrace start time. The Reference time and Target timecan be copied, pasted, and edited. Pressing the buttoncomputes the Offset based on the current time values.The trace is closed with the OK button is pressed. Afterreopening, the timestamps in the trace are offsetaccording to the computed value. The Properties viewshows the 'time offset' with the computed value. Manual Pass Column width of calculated offset is very small in GTK3
15.11Clear time offset with openedtraces
Open both traces. Select both trace elements in the ProjectExplorer view. Right-click and select Clear time offset. ClickOK to confirm. Open the traces.
The opened traces are closed when the OK button ispressed. After reopening, the timestamps in the tracesare back to their original values. The Properties viewshows the 'time offset' as blank. Manual Pass
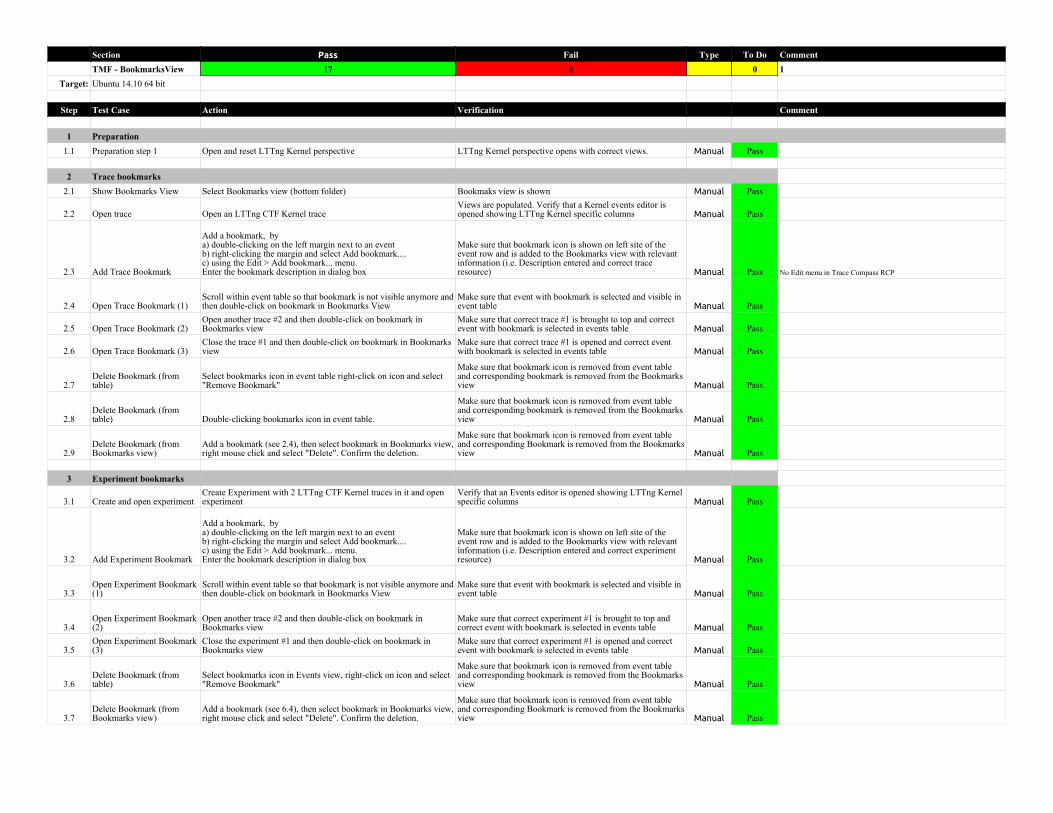
Section Pass Fail Type To Do CommentTMF - BookmarksView 17 0 0 1
Target: Ubuntu 14.10 64 bit
Step Test Case Action Verification Comment
1 Preparation1.1 Preparation step 1 Open and reset LTTng Kernel perspective LTTng Kernel perspective opens with correct views. Manual Pass
2 Trace bookmarks2.1 Show Bookmarks View Select Bookmarks view (bottom folder) Bookmaks view is shown Manual Pass
2.2 Open trace Open an LTTng CTF Kernel traceViews are populated. Verify that a Kernel events editor isopened showing LTTng Kernel specific columns Manual Pass
2.3 Add Trace Bookmark
Add a bookmark, bya) double-clicking on the left margin next to an eventb) right-clicking the margin and select Add bookmark....c) using the Edit > Add bookmark... menu.Enter the bookmark description in dialog box
Make sure that bookmark icon is shown on left site of theevent row and is added to the Bookmarks view with relevantinformation (i.e. Description entered and correct traceresource) Manual Pass No Edit menu in Trace Compass RCP
2.4 Open Trace Bookmark (1)Scroll within event table so that bookmark is not visible anymore andthen double-click on bookmark in Bookmarks View
Make sure that event with bookmark is selected and visible inevent table Manual Pass
2.5 Open Trace Bookmark (2)Open another trace #2 and then double-click on bookmark inBookmarks view
Make sure that correct trace #1 is brought to top and correctevent with bookmark is selected in events table Manual Pass
2.6 Open Trace Bookmark (3)Close the trace #1 and then double-click on bookmark in Bookmarksview
Make sure that correct trace #1 is opened and correct eventwith bookmark is selected in events table Manual Pass
2.7Delete Bookmark (fromtable)
Select bookmarks icon in event table right-click on icon and select"Remove Bookmark"
Make sure that bookmark icon is removed from event tableand corresponding bookmark is removed from the Bookmarksview Manual Pass
2.8Delete Bookmark (fromtable) Double-clicking bookmarks icon in event table.
Make sure that bookmark icon is removed from event tableand corresponding bookmark is removed from the Bookmarksview Manual Pass
2.9Delete Bookmark (fromBookmarks view)
Add a bookmark (see 2.4), then select bookmark in Bookmarks view,right mouse click and select "Delete". Confirm the deletion.
Make sure that bookmark icon is removed from event tableand corresponding Bookmark is removed from the Bookmarksview Manual Pass
3 Experiment bookmarks
3.1 Create and open experimentCreate Experiment with 2 LTTng CTF Kernel traces in it and openexperiment
Verify that an Events editor is opened showing LTTng Kernelspecific columns Manual Pass
3.2 Add Experiment Bookmark
Add a bookmark, bya) double-clicking on the left margin next to an eventb) right-clicking the margin and select Add bookmark....c) using the Edit > Add bookmark... menu.Enter the bookmark description in dialog box
Make sure that bookmark icon is shown on left site of theevent row and is added to the Bookmarks view with relevantinformation (i.e. Description entered and correct experimentresource) Manual Pass
3.3Open Experiment Bookmark(1)
Scroll within event table so that bookmark is not visible anymore andthen double-click on bookmark in Bookmarks View
Make sure that event with bookmark is selected and visible inevent table Manual Pass
3.4Open Experiment Bookmark(2)
Open another trace #2 and then double-click on bookmark inBookmarks view
Make sure that correct experiment #1 is brought to top andcorrect event with bookmark is selected in events table Manual Pass
3.5Open Experiment Bookmark(3)
Close the experiment #1 and then double-click on bookmark inBookmarks view
Make sure that correct experiment #1 is opened and correctevent with bookmark is selected in events table Manual Pass
3.6Delete Bookmark (fromtable)
Select bookmarks icon in Events view, right-click on icon and select"Remove Bookmark"
Make sure that bookmark icon is removed from event tableand corresponding bookmark is removed from the Bookmarksview Manual Pass
3.7Delete Bookmark (fromBookmarks view)
Add a bookmark (see 6.4), then select bookmark in Bookmarks view,right mouse click and select "Delete". Confirm the deletion.
Make sure that bookmark icon is removed from event tableand corresponding Bookmark is removed from the Bookmarksview Manual Pass
Section Pass Fail To Do Comment
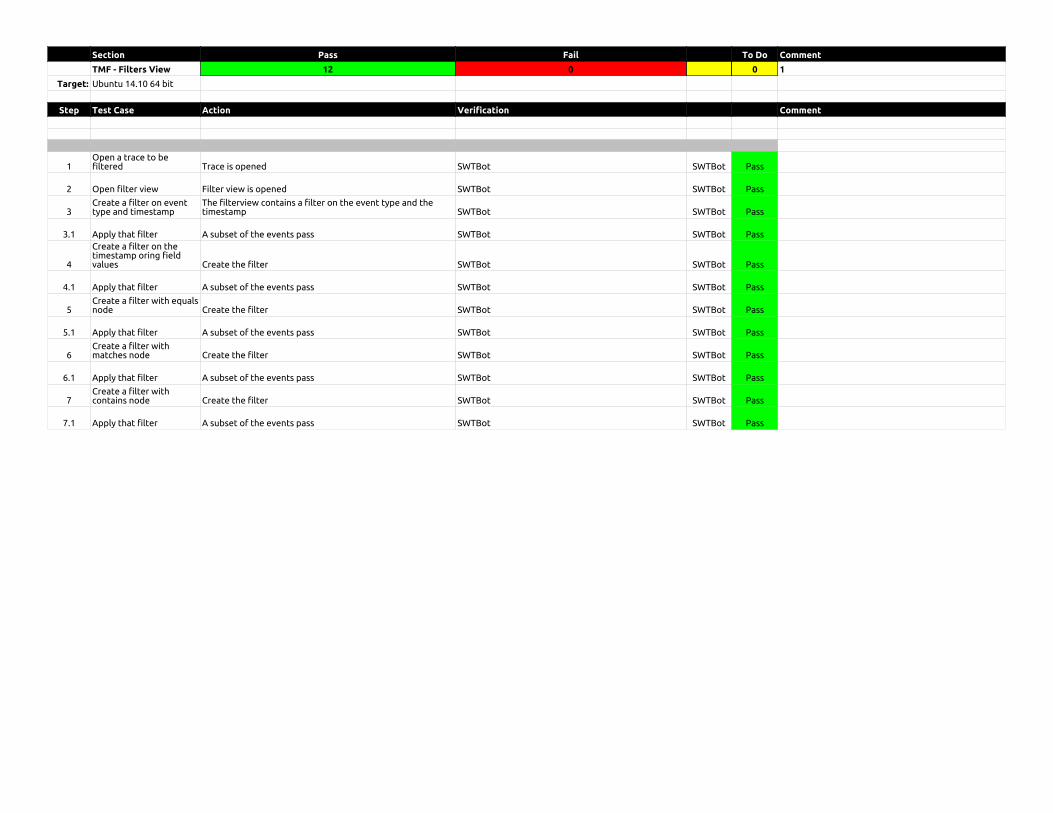
TMF - Filters View 12 0 0 1
Target: Ubuntu 14.10 64 bit
Step Test Case Action Verification Comment
1Open a trace to befiltered Trace is opened SWTBot SWTBot Pass
2 Open filter view Filter view is opened SWTBot SWTBot Pass
3Create a filter on eventtype and timestamp
The filterview contains a filter on the event type and thetimestamp SWTBot SWTBot Pass
3.1 Apply that filter A subset of the events pass SWTBot SWTBot Pass
4
Create a filter on thetimestamp oring fieldvalues Create the filter SWTBot SWTBot Pass
4.1 Apply that filter A subset of the events pass SWTBot SWTBot Pass
5Create a filter with equalsnode Create the filter SWTBot SWTBot Pass
5.1 Apply that filter A subset of the events pass SWTBot SWTBot Pass
6Create a filter withmatches node Create the filter SWTBot SWTBot Pass
6.1 Apply that filter A subset of the events pass SWTBot SWTBot Pass
7Create a filter withcontains node Create the filter SWTBot SWTBot Pass
7.1 Apply that filter A subset of the events pass SWTBot SWTBot Pass
Section Pass Fail To Do Comment
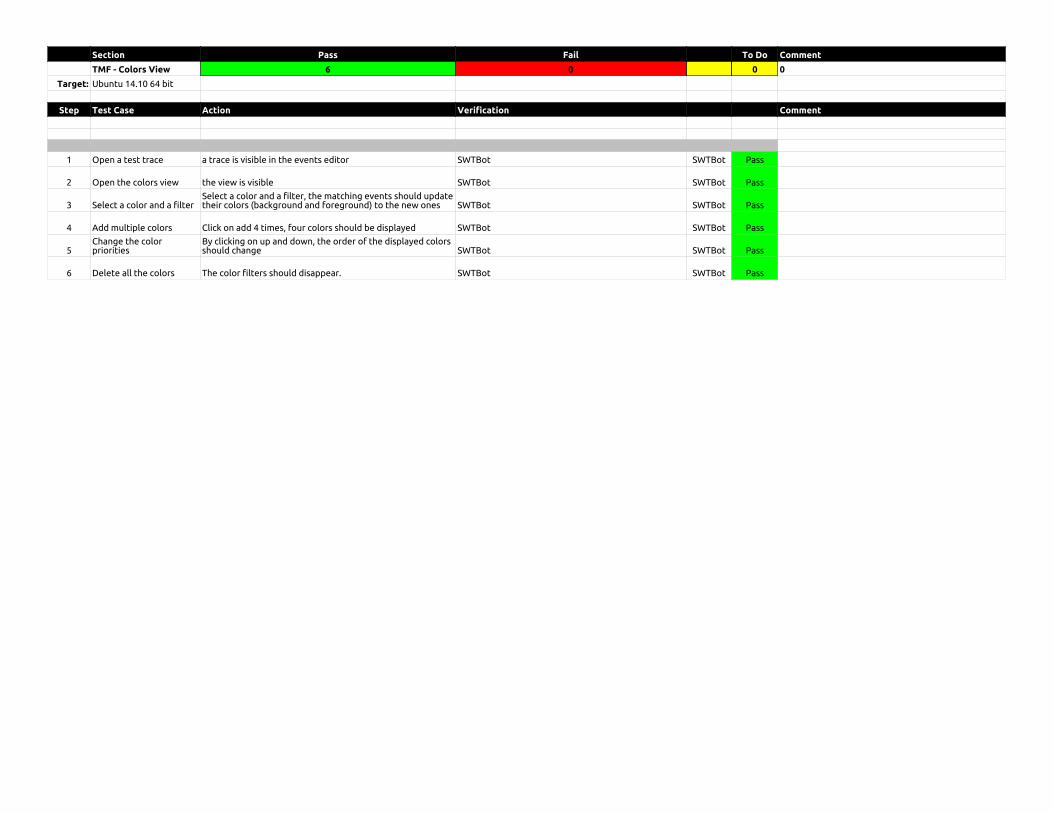
TMF - Colors View 6 0 0 0
Target: Ubuntu 14.10 64 bit
Step Test Case Action Verification Comment
1 Open a test trace a trace is visible in the events editor SWTBot SWTBot Pass
2 Open the colors view the view is visible SWTBot SWTBot Pass
3 Select a color and a filterSelect a color and a filter, the matching events should updatetheir colors (background and foreground) to the new ones SWTBot SWTBot Pass
4 Add multiple colors Click on add 4 times, four colors should be displayed SWTBot SWTBot Pass
5Change the colorpriorities
By clicking on up and down, the order of the displayed colorsshould change SWTBot SWTBot Pass
6 Delete all the colors The color filters should disappear. SWTBot SWTBot Pass
Section Pass Fail To Do Comment
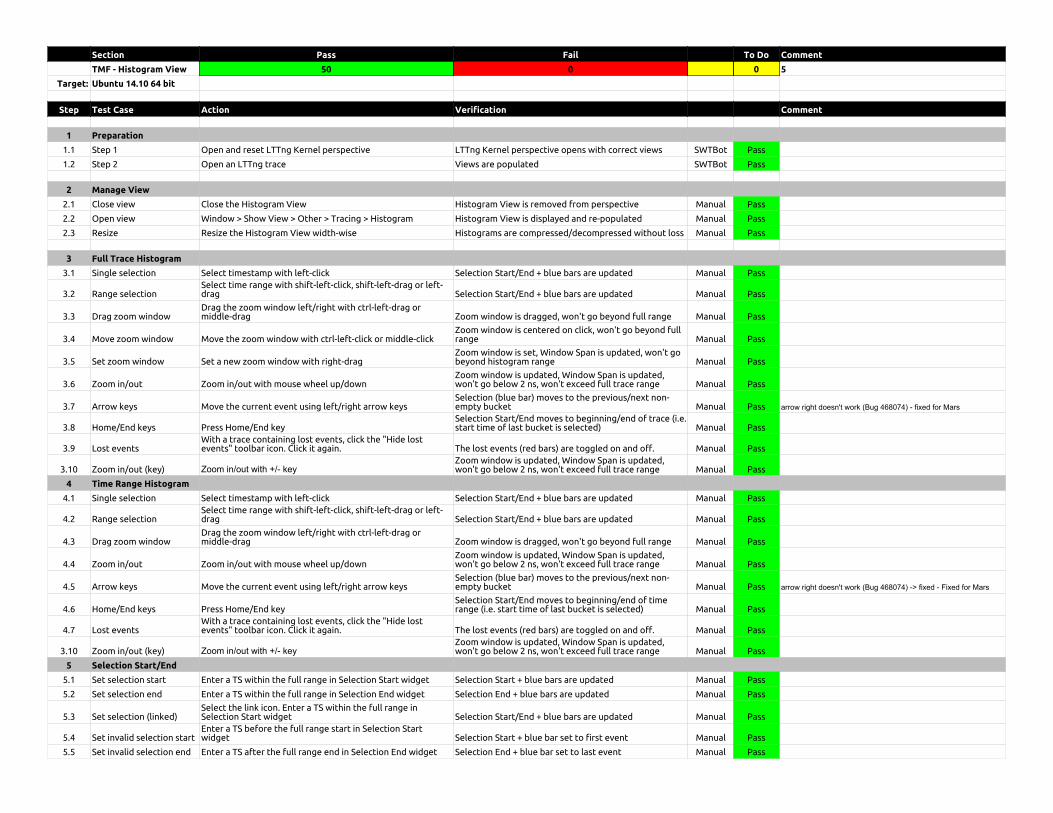
TMF - Histogram View 50 0 0 5
Target: Ubuntu 14.10 64 bit
Step Test Case Action Verification Comment
1 Preparation
1.1 Step 1 Open and reset LTTng Kernel perspective LTTng Kernel perspective opens with correct views SWTBot Pass
1.2 Step 2 Open an LTTng trace Views are populated SWTBot Pass
2 Manage View
2.1 Close view Close the Histogram View Histogram View is removed from perspective Manual Pass
2.2 Open view Window > Show View > Other > Tracing > Histogram Histogram View is displayed and re-populated Manual Pass
2.3 Resize Resize the Histogram View width-wise Histograms are compressed/decompressed without loss Manual Pass
3 Full Trace Histogram
3.1 Single selection Select timestamp with left-click Selection Start/End + blue bars are updated Manual Pass
3.2 Range selectionSelect time range with shift-left-click, shift-left-drag or left-drag Selection Start/End + blue bars are updated Manual Pass
3.3 Drag zoom windowDrag the zoom window left/right with ctrl-left-drag ormiddle-drag Zoom window is dragged, won't go beyond full range Manual Pass
3.4 Move zoom window Move the zoom window with ctrl-left-click or middle-clickZoom window is centered on click, won't go beyond fullrange Manual Pass
3.5 Set zoom window Set a new zoom window with right-dragZoom window is set, Window Span is updated, won't gobeyond histogram range Manual Pass
3.6 Zoom in/out Zoom in/out with mouse wheel up/downZoom window is updated, Window Span is updated,won't go below 2 ns, won't exceed full trace range Manual Pass
3.7 Arrow keys Move the current event using left/right arrow keysSelection (blue bar) moves to the previous/next non-empty bucket Manual Pass arrow right doesn't work (Bug 468074) - fixed for Mars
3.8 Home/End keys Press Home/End keySelection Start/End moves to beginning/end of trace (i.e.start time of last bucket is selected) Manual Pass
3.9 Lost eventsWith a trace containing lost events, click the "Hide lostevents" toolbar icon. Click it again. The lost events (red bars) are toggled on and off. Manual Pass
3.10 Zoom in/out (key) Zoom in/out with +/- keyZoom window is updated, Window Span is updated,won't go below 2 ns, won't exceed full trace range Manual Pass
4 Time Range Histogram
4.1 Single selection Select timestamp with left-click Selection Start/End + blue bars are updated Manual Pass
4.2 Range selectionSelect time range with shift-left-click, shift-left-drag or left-drag Selection Start/End + blue bars are updated Manual Pass
4.3 Drag zoom windowDrag the zoom window left/right with ctrl-left-drag ormiddle-drag Zoom window is dragged, won't go beyond full range Manual Pass
4.4 Zoom in/out Zoom in/out with mouse wheel up/downZoom window is updated, Window Span is updated,won't go below 2 ns, won't exceed full trace range Manual Pass
4.5 Arrow keys Move the current event using left/right arrow keysSelection (blue bar) moves to the previous/next non-empty bucket Manual Pass arrow right doesn't work (Bug 468074) -> fixed - Fixed for Mars
4.6 Home/End keys Press Home/End keySelection Start/End moves to beginning/end of timerange (i.e. start time of last bucket is selected) Manual Pass
4.7 Lost eventsWith a trace containing lost events, click the "Hide lostevents" toolbar icon. Click it again. The lost events (red bars) are toggled on and off. Manual Pass
3.10 Zoom in/out (key) Zoom in/out with +/- keyZoom window is updated, Window Span is updated,won't go below 2 ns, won't exceed full trace range Manual Pass
5 Selection Start/End
5.1 Set selection start Enter a TS within the full range in Selection Start widget Selection Start + blue bars are updated Manual Pass
5.2 Set selection end Enter a TS within the full range in Selection End widget Selection End + blue bars are updated Manual Pass
5.3 Set selection (linked)Select the link icon. Enter a TS within the full range inSelection Start widget Selection Start/End + blue bars are updated Manual Pass
5.4 Set invalid selection startEnter a TS before the full range start in Selection Startwidget Selection Start + blue bar set to first event Manual Pass
5.5 Set invalid selection end Enter a TS after the full range end in Selection End widget Selection End + blue bar set to last event Manual Pass
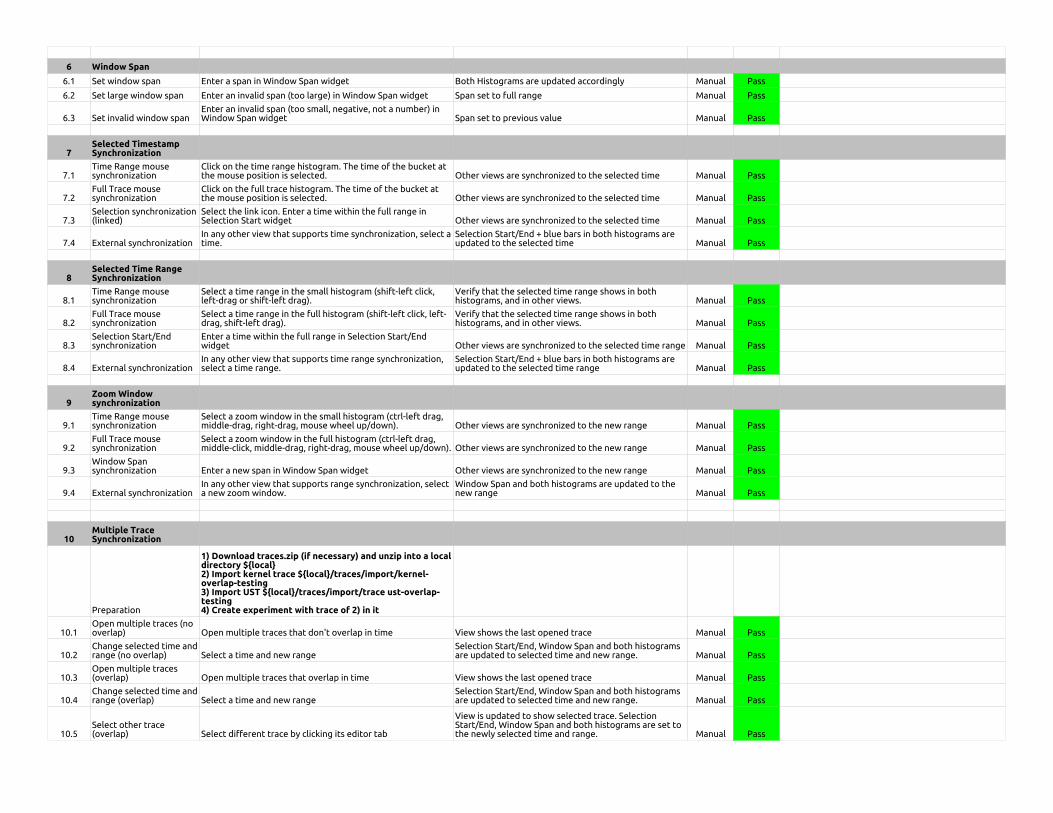
6 Window Span
6.1 Set window span Enter a span in Window Span widget Both Histograms are updated accordingly Manual Pass
6.2 Set large window span Enter an invalid span (too large) in Window Span widget Span set to full range Manual Pass
6.3 Set invalid window spanEnter an invalid span (too small, negative, not a number) inWindow Span widget Span set to previous value Manual Pass
7Selected TimestampSynchronization
7.1Time Range mousesynchronization
Click on the time range histogram. The time of the bucket atthe mouse position is selected. Other views are synchronized to the selected time Manual Pass
7.2Full Trace mousesynchronization
Click on the full trace histogram. The time of the bucket atthe mouse position is selected. Other views are synchronized to the selected time Manual Pass
7.3Selection synchronization(linked)
Select the link icon. Enter a time within the full range inSelection Start widget Other views are synchronized to the selected time Manual Pass
7.4 External synchronizationIn any other view that supports time synchronization, select atime.
Selection Start/End + blue bars in both histograms areupdated to the selected time Manual Pass
8Selected Time RangeSynchronization
8.1Time Range mousesynchronization
Select a time range in the small histogram (shift-left click,left-drag or shift-left drag).
Verify that the selected time range shows in bothhistograms, and in other views. Manual Pass
8.2Full Trace mousesynchronization
Select a time range in the full histogram (shift-left click, left-drag, shift-left drag).
Verify that the selected time range shows in bothhistograms, and in other views. Manual Pass
8.3Selection Start/Endsynchronization
Enter a time within the full range in Selection Start/Endwidget Other views are synchronized to the selected time range Manual Pass
8.4 External synchronizationIn any other view that supports time range synchronization,select a time range.
Selection Start/End + blue bars in both histograms areupdated to the selected time range Manual Pass
9Zoom Windowsynchronization
9.1Time Range mousesynchronization
Select a zoom window in the small histogram (ctrl-left drag,middle-drag, right-drag, mouse wheel up/down). Other views are synchronized to the new range Manual Pass
9.2Full Trace mousesynchronization
Select a zoom window in the full histogram (ctrl-left drag,middle-click, middle-drag, right-drag, mouse wheel up/down). Other views are synchronized to the new range Manual Pass
9.3Window Spansynchronization Enter a new span in Window Span widget Other views are synchronized to the new range Manual Pass
9.4 External synchronizationIn any other view that supports range synchronization, selecta new zoom window.
Window Span and both histograms are updated to thenew range Manual Pass
10Multiple TraceSynchronization
Preparation
1) Download traces.zip (if necessary) and unzip into a localdirectory ${local}2) Import kernel trace ${local}/traces/import/kernel-overlap-testing3) Import UST ${local}/traces/import/trace ust-overlap-testing4) Create experiment with trace of 2) in it
10.1Open multiple traces (nooverlap) Open multiple traces that don't overlap in time View shows the last opened trace Manual Pass
10.2Change selected time andrange (no overlap) Select a time and new range
Selection Start/End, Window Span and both histogramsare updated to selected time and new range. Manual Pass
10.3Open multiple traces(overlap) Open multiple traces that overlap in time View shows the last opened trace Manual Pass
10.4Change selected time andrange (overlap) Select a time and new range
Selection Start/End, Window Span and both histogramsare updated to selected time and new range. Manual Pass
10.5Select other trace(overlap) Select different trace by clicking its editor tab
View is updated to show selected trace. SelectionStart/End, Window Span and both histograms are set tothe newly selected time and range. Manual Pass
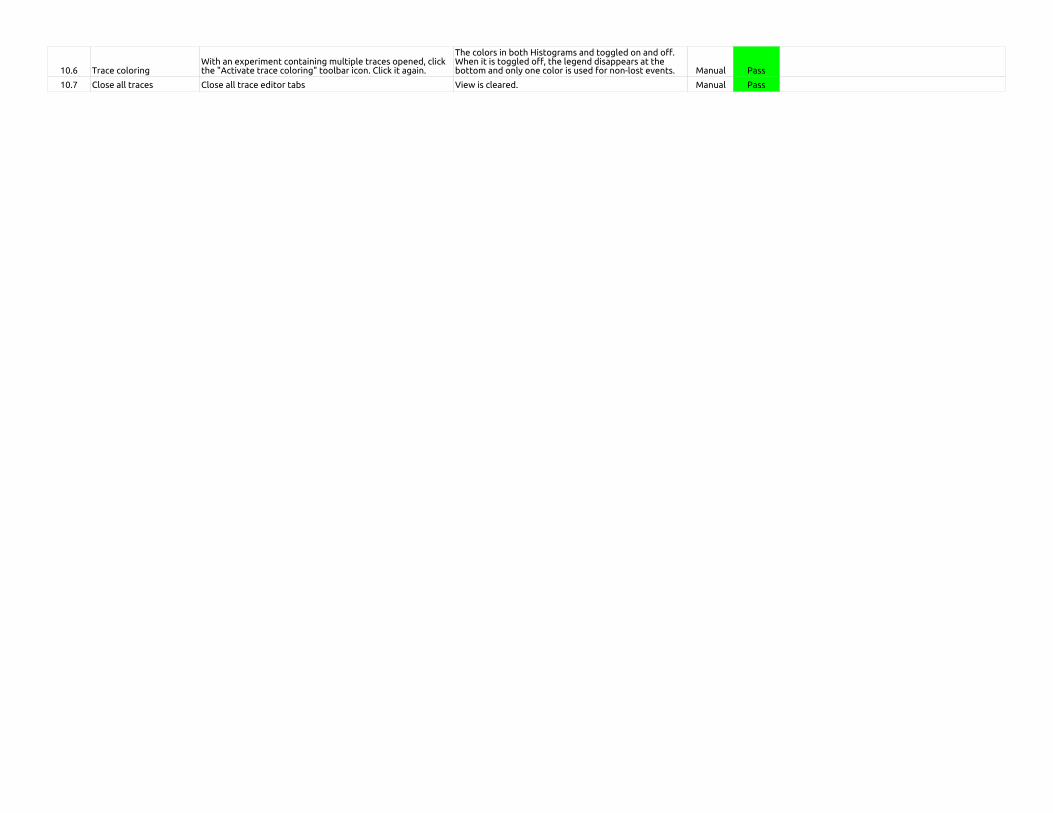
10.6 Trace coloringWith an experiment containing multiple traces opened, clickthe "Activate trace coloring" toolbar icon. Click it again.
The colors in both Histograms and toggled on and off.When it is toggled off, the legend disappears at thebottom and only one color is used for non-lost events. Manual Pass
10.7 Close all traces Close all trace editor tabs View is cleared. Manual Pass
Section Pass Fail To Do Comment
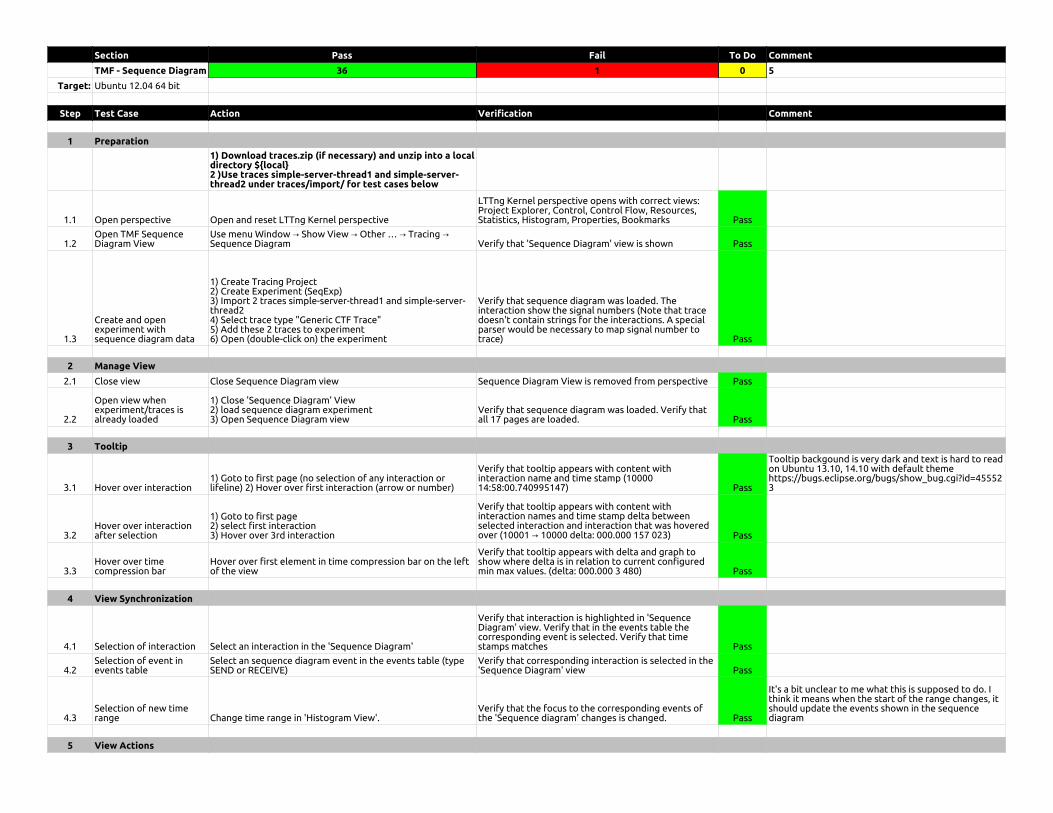
TMF - Sequence Diagram 36 1 0 5
Target: Ubuntu 12.04 64 bit
Step Test Case Action Verification Comment
1 Preparation
1) Download traces.zip (if necessary) and unzip into a localdirectory ${local}2 )Use traces simple-server-thread1 and simple-server-thread2 under traces/import/ for test cases below
1.1 Open perspective Open and reset LTTng Kernel perspective
LTTng Kernel perspective opens with correct views:Project Explorer, Control, Control Flow, Resources,Statistics, Histogram, Properties, Bookmarks Pass
1.2Open TMF SequenceDiagram View
Use menu Window → Show View → Other … → Tracing →Sequence Diagram Verify that 'Sequence Diagram' view is shown Pass
1.3
Create and openexperiment withsequence diagram data
1) Create Tracing Project2) Create Experiment (SeqExp)3) Import 2 traces simple-server-thread1 and simple-server-thread24) Select trace type "Generic CTF Trace"5) Add these 2 traces to experiment6) Open (double-click on) the experiment
Verify that sequence diagram was loaded. Theinteraction show the signal numbers (Note that tracedoesn't contain strings for the interactions. A specialparser would be necessary to map signal number totrace) Pass
2 Manage View
2.1 Close view Close Sequence Diagram view Sequence Diagram View is removed from perspective Pass
2.2
Open view whenexperiment/traces isalready loaded
1) Close 'Sequence Diagram' View2) load sequence diagram experiment3) Open Sequence Diagram view
Verify that sequence diagram was loaded. Verify thatall 17 pages are loaded. Pass
3 Tooltip
3.1 Hover over interaction1) Goto to first page (no selection of any interaction orlifeline) 2) Hover over first interaction (arrow or number)
Verify that tooltip appears with content withinteraction name and time stamp (1000014:58:00.740995147) Pass
Tooltip backgound is very dark and text is hard to readon Ubuntu 13.10, 14.10 with default themehttps://bugs.eclipse.org/bugs/show_bug.cgi?id=455523
3.2Hover over interactionafter selection
1) Goto to first page2) select first interaction3) Hover over 3rd interaction
Verify that tooltip appears with content withinteraction names and time stamp delta betweenselected interaction and interaction that was hoveredover (10001 → 10000 delta: 000.000 157 023) Pass
3.3Hover over timecompression bar
Hover over first element in time compression bar on the leftof the view
Verify that tooltip appears with delta and graph toshow where delta is in relation to current configuredmin max values. (delta: 000.000 3 480) Pass
4 View Synchronization
4.1 Selection of interaction Select an interaction in the 'Sequence Diagram'
Verify that interaction is highlighted in 'SequenceDiagram' view. Verify that in the events table thecorresponding event is selected. Verify that timestamps matches Pass
4.2Selection of event inevents table
Select an sequence diagram event in the events table (typeSEND or RECEIVE)
Verify that corresponding interaction is selected in the'Sequence Diagram' view Pass
4.3Selection of new timerange Change time range in 'Histogram View'.
Verify that the focus to the corresponding events ofthe 'Sequence diagram' changes is changed. Pass
It's a bit unclear to me what this is supposed to do. Ithink it means when the start of the range changes, itshould update the events shown in the sequencediagram
5 View Actions
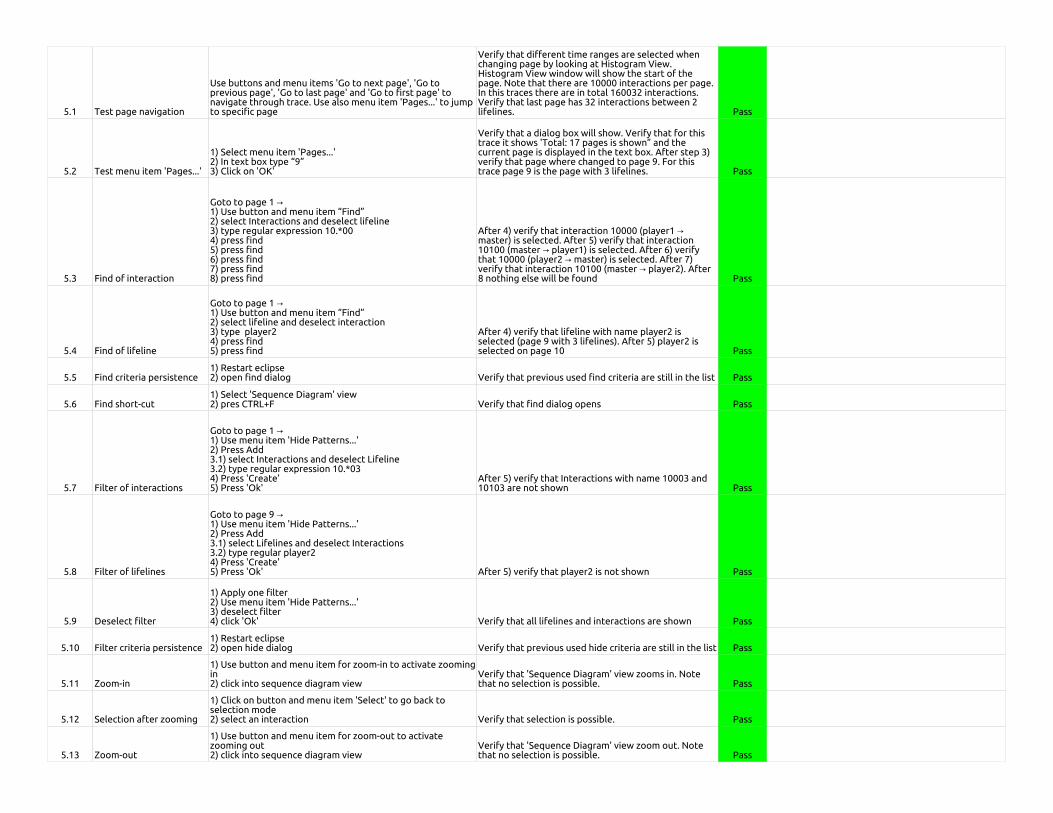
5.1 Test page navigation
Use buttons and menu items 'Go to next page', 'Go toprevious page', 'Go to last page' and 'Go to first page' tonavigate through trace. Use also menu item 'Pages...' to jumpto specific page
Verify that different time ranges are selected whenchanging page by looking at Histogram View.Histogram View window will show the start of thepage. Note that there are 10000 interactions per page.In this traces there are in total 160032 interactions.Verify that last page has 32 interactions between 2lifelines. Pass
5.2 Test menu item 'Pages...'
1) Select menu item 'Pages...'2) In text box type “9”3) Click on 'OK'
Verify that a dialog box will show. Verify that for thistrace it shows 'Total: 17 pages is shown” and thecurrent page is displayed in the text box. After step 3)verify that page where changed to page 9. For thistrace page 9 is the page with 3 lifelines. Pass
5.3 Find of interaction
Goto to page 1 →1) Use button and menu item “Find”2) select Interactions and deselect lifeline3) type regular expression 10.*004) press find5) press find6) press find7) press find8) press find
After 4) verify that interaction 10000 (player1 →master) is selected. After 5) verify that interaction10100 (master → player1) is selected. After 6) verifythat 10000 (player2 → master) is selected. After 7)verify that interaction 10100 (master → player2). After8 nothing else will be found Pass
5.4 Find of lifeline
Goto to page 1 →1) Use button and menu item “Find”2) select lifeline and deselect interaction3) type player24) press find5) press find
After 4) verify that lifeline with name player2 isselected (page 9 with 3 lifelines). After 5) player2 isselected on page 10 Pass
5.5 Find criteria persistence1) Restart eclipse2) open find dialog Verify that previous used find criteria are still in the list Pass
Goto to page 1 →1) Use menu item 'Hide Patterns...'2) Press Add3.1) select Interactions and deselect Lifeline3.2) type regular expression 10.*034) Press 'Create'5) Press 'Ok'
After 5) verify that Interactions with name 10003 and10103 are not shown Pass
5.8 Filter of lifelines
Goto to page 9 →1) Use menu item 'Hide Patterns...'2) Press Add3.1) select Lifelines and deselect Interactions3.2) type regular player24) Press 'Create'5) Press 'Ok' After 5) verify that player2 is not shown Pass
5.9 Deselect filter
1) Apply one filter2) Use menu item 'Hide Patterns...'3) deselect filter4) click 'Ok' Verify that all lifelines and interactions are shown Pass
5.10 Filter criteria persistence1) Restart eclipse2) open hide dialog Verify that previous used hide criteria are still in the list Pass
5.11 Zoom-in
1) Use button and menu item for zoom-in to activate zoomingin2) click into sequence diagram view
Verify that 'Sequence Diagram' view zooms in. Notethat no selection is possible. Pass
5.12 Selection after zooming
1) Click on button and menu item 'Select' to go back toselection mode2) select an interaction Verify that selection is possible. Pass
5.13 Zoom-out
1) Use button and menu item for zoom-out to activatezooming out2) click into sequence diagram view
Verify that 'Sequence Diagram' view zoom out. Notethat no selection is possible. Pass
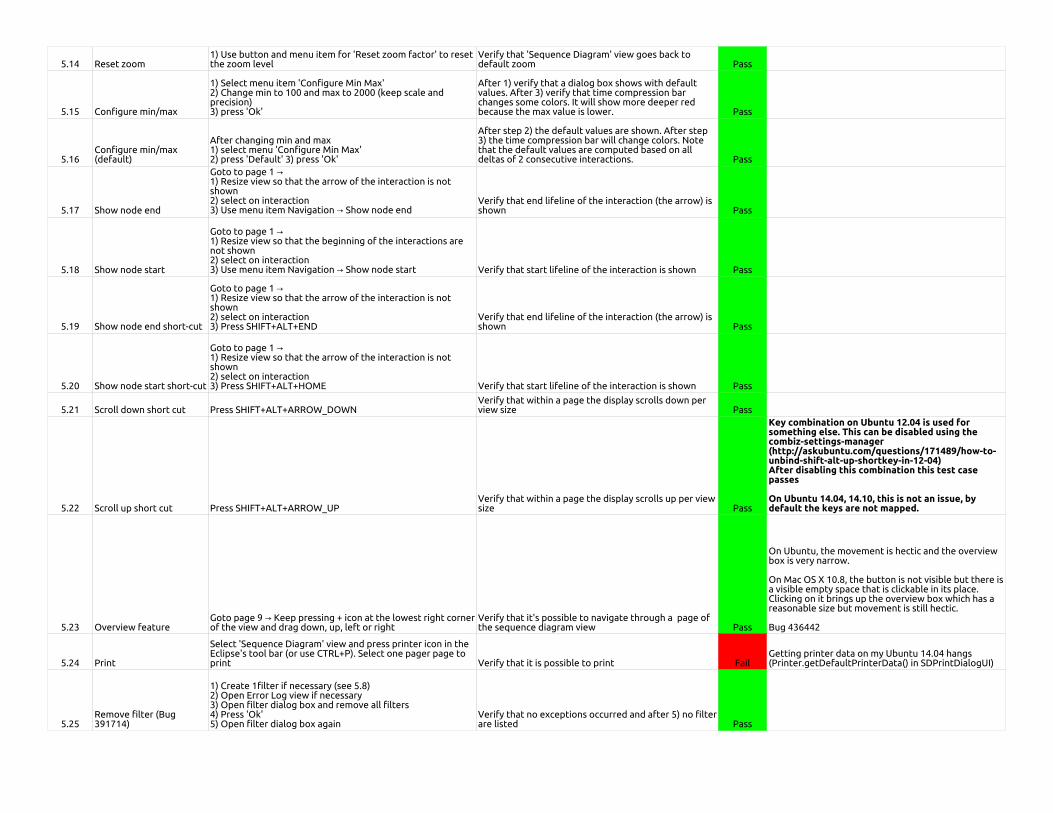
5.14 Reset zoom1) Use button and menu item for 'Reset zoom factor' to resetthe zoom level
Verify that 'Sequence Diagram' view goes back todefault zoom Pass
5.15 Configure min/max
1) Select menu item 'Configure Min Max'2) Change min to 100 and max to 2000 (keep scale andprecision)3) press 'Ok'
After 1) verify that a dialog box shows with defaultvalues. After 3) verify that time compression barchanges some colors. It will show more deeper redbecause the max value is lower. Pass
5.16Configure min/max(default)
After changing min and max1) select menu 'Configure Min Max'2) press 'Default' 3) press 'Ok'
After step 2) the default values are shown. After step3) the time compression bar will change colors. Notethat the default values are computed based on alldeltas of 2 consecutive interactions. Pass
5.17 Show node end
Goto to page 1 →1) Resize view so that the arrow of the interaction is notshown2) select on interaction3) Use menu item Navigation → Show node end
Verify that end lifeline of the interaction (the arrow) isshown Pass
5.18 Show node start
Goto to page 1 →1) Resize view so that the beginning of the interactions arenot shown2) select on interaction3) Use menu item Navigation → Show node start Verify that start lifeline of the interaction is shown Pass
5.19 Show node end short-cut
Goto to page 1 →1) Resize view so that the arrow of the interaction is notshown2) select on interaction3) Press SHIFT+ALT+END
Verify that end lifeline of the interaction (the arrow) isshown Pass
5.20 Show node start short-cut
Goto to page 1 →1) Resize view so that the arrow of the interaction is notshown2) select on interaction3) Press SHIFT+ALT+HOME Verify that start lifeline of the interaction is shown Pass
5.21 Scroll down short cut Press SHIFT+ALT+ARROW_DOWNVerify that within a page the display scrolls down perview size Pass
5.22 Scroll up short cut Press SHIFT+ALT+ARROW_UPVerify that within a page the display scrolls up per viewsize Pass
Key combination on Ubuntu 12.04 is used forsomething else. This can be disabled using thecombiz-settings-manager(http://askubuntu.com/questions/171489/how-to-unbind-shift-alt-up-shortkey-in-12-04)After disabling this combination this test casepasses
On Ubuntu 14.04, 14.10, this is not an issue, bydefault the keys are not mapped.
5.23 Overview featureGoto page 9 → Keep pressing + icon at the lowest right cornerof the view and drag down, up, left or right
Verify that it's possible to navigate through a page ofthe sequence diagram view Pass
On Ubuntu, the movement is hectic and the overviewbox is very narrow.
On Mac OS X 10.8, the button is not visible but there isa visible empty space that is clickable in its place.Clicking on it brings up the overview box which has areasonable size but movement is still hectic.
Bug 436442
5.24 Print
Select 'Sequence Diagram' view and press printer icon in theEclipse's tool bar (or use CTRL+P). Select one pager page toprint Verify that it is possible to print Fail
Getting printer data on my Ubuntu 14.04 hangs(Printer.getDefaultPrinterData() in SDPrintDialogUI)
5.25Remove filter (Bug391714)
1) Create 1filter if necessary (see 5.8)2) Open Error Log view if necessary3) Open filter dialog box and remove all filters4) Press 'Ok'5) Open filter dialog box again
Verify that no exceptions occurred and after 5) no filterare listed Pass
5.27Time Sync. withoutinteractions (Bug 391716)
1) Open trace without any sequence diagram information2) Open SD view if necessary3) Open Error Log view if necessary4) change time range in Histogram view5) Change time current selected time in Histogram View Make sure that no exceptions occurred Pass
Section Pass Fail To Do Comment
TMF - Statistics View 17 0 0 7
Target: Windows 7 64 bit
Step Test Case Action Verification Comment
1 Preparation
PreparationDownload traces simple-server-thread1 and simple-server-thread1 from traces/import/
1.1 Open Perspective Open and reset LTTng Kernel perspective LTTng Kernel perspective opens with correct views Pass
1.2 Open TMF Statistics ViewUse menu Window → Show View → Other … → Tracing →Statistics Verify that 'Statistics' view is shown Pass Path is actually Window -> Show view -> Tracing -> Statistics
1.3 Open experiment
1) Create Tracing Project2) Create Experiment (SeqExp)3) Import 2 traces simple-server-thread1 and simple-server-thread24) Select trace type "Generic CTF Trace"5) Add these 2 traces to experiment
Verify that statistics are shown per trace and per eventtype. Each trace has 80021 events. Verify that eventtypesENTER/RETURN/SEND/RECEIVE/INFO/after_fork_childare counted. Pass
2 Manage View
2.1 Delete view Close the 'Statistics' View Statistics' view is removed from perspective Pass
2.2 Open viewUse menu Window → Show View → Other … → Tracing →Statistics Statistics' view View is displayed and re-populated Pass See comment on step 1.2 about the path
Verify that statistics are shown per trace and per eventtype. Each trace has 80021 events. Verify that eventtypesENTER/RETURN/SEND/RECEIVE/INFO/after_fork_childare counted Pass
Randomly, the number of events in a trace stays at zerowhen the statistics view is opened. However, I can'treproduce the problem at will. Bug 436416
France : I have tried many times to open the view whenthe trace is already loaded and was not able to redo theproblem
3 Other
3.1 Build of statistic index Open traceVerify that 'Statistics' view is populated when indexingis finished Pass The view is populated gradually during indexation
3.2 Persistence of statisticsOpen same trace multiple times after indexing of trace wasfinished the first time
Verify that when opening the trace the x-times (x > 1),that the statistics appear right away without parsingthe trace again Pass
4 Range Synchronization
4.1External synchronization(full)
In any other view that supports range synchronization, selectthe full range of the trace.
Events in selected time range' is updated and equals'Events total' values Pass Bug 459571
4.2External synchronization(range)
In any other view that supports range synchronization, selecta new range.
Events in selected time range' is updated according tonew range Pass Bug 459571
5Multiple TraceSynchronization
Preparation
1) Download traces.zip (if necessary) and unzip into a localdirectory ${local}2) Import kernel trace ${local}/traces/import/kernel-overlap-testing3) Import UST ${local}/traces/import/trace ust-overlap-testing4) Create experiment with trace of 2) in it
5.1Open multiple traces (nooverlap) Open multiple traces that don't overlap in time View shows the last opened trace Pass
France : I am not sure what to do in this section (overlaping vs nonoverlaping)
5.2Change selected time andrange (no overlap)
In any other view that supports range synchronization, selecta new range
Events in selected time range' is updated according tonew range Pass
5.3Select other trace (nooverlap) Select different trace by clicking its Events editor tab
View is updated to show selected trace. 'Events inselected time range' is updated according to theselected trace's previously selected range. Pass
5.4Open multiple traces(overlap) Open multiple traces that overlap in time View shows the last opened trace Pass
5.5Change selected time andrange (overlap)
In any other view that supports range synchronization, selecta new range
Events in selected time range' is updated according tonew range Pass
5.6Select other trace(overlap) Select different trace by clicking its Events editor tab
View is updated to show selected trace. 'Events inselected time range' is updated according to the newlyselected time and range. Pass
5.7 Close all traces Close all Events editor tabs View is cleared. Pass
Section Pass Fail To Do Comment
TMF - Time Chart View 25 1 0 3
Target: Windows 7 64 bit
Step Test Case Action Verification Comment
1 Preparation
1.1 Preparation step 1 Open and reset LTTng Kernel perspective LTTng Kernel perspective opens with correct views. Pass
1.2 Preparation step 2 Show Time Chart View Time Chart view is shown Pass
2 Trace handling
2.1 Open trace Open an LTTng CTF Kernel trace #1Trace #1 entry added to Time Chart view. Trace #1 isselected entry. Range of view is full trace range. Pass
2.2 Open other trace Open an LTTng CTF Kernel trace #2
Trace #2 entry added to Time Chart view. Trace #2 isselected entry. Range of view is union of full traceranges. Pass
2.3 Open experiment Open an experiment
Experiment entry added to Time Chart view.Experiment is selected entry. Range of view is union offull trace ranges. Pass
2.4 Select other trace Select trace #1 by clicking its trace entry in Time Chart viewTrace #1 is selected entry. View range does not change.Trace #1 editor tab is brought to top. Pass
2.5Select other trace(external) Select trace #2 by clicking its editor tab Trace #2 is selected entry. View range does not change. Pass
2.6 Close view Close the Time Chart view Time Chart view is removed from perspective Pass
2.7 Open view Show Time Chart viewTime Chart view is displayed and re-populated withopened traces data Pass
2.8 Close trace/experiment Close trace #2 editor tab. Repeat with experiment editor tab.Trace entry is removed from Time Chart view. Range isview is union of remaining full trace ranges. Pass
2.9 Close last trace Close trace #1 editor tab View is cleared. Pass
3 Time Synchronization
3.1Mouse synchronization(single time) Left-click on the time chart. The selected time line is updated.
Other views are synchronized to the selected time.Event at or following the selected time is selected inthe event table. Pass
3.2Mouse synchronization(time range)
Shift-left-click or left-drag on the time chart. The selectedtime range is updated.
Other views are synchronized to the selected range.Event at or following the selected time is selected inthe event table. Pass
3.3External synchronization(single time) In event table, select an event.
Selected time line is updated to the event time. Ifnecessary, range is updated to show selected time. Pass
3.4External synchronization(time range) In event table, select an event range with shift-left-click. Selected time line is updated to the time range. Pass
4Zoom RangeSynchronization
4.1Mouse wheelsynchronization Zoom in/out with mouse wheel while holding Ctrl. Other views are synchronized to the new range Pass
4.2Mouse drag zoomsynchronization Drag zoom with right-button on time chart. Other views are synchronized to the new range Pass
4.3Mouse drag movesynchronization Drag move with ctrl-left or middle button on time chart. Other views are synchronized to the new range Pass
4.4Mouse full rangesynchronization Double-click with left button on time chart's time scale. Other views are synchronized to the full range Pass
4.5 External synchronizationIn any other view that supports range synchronization, selecta new zoom range. View range is updated to the new range Pass
5Event TableSynchronization
5.1 Search synchronization Enter a search regex in event table Matching events are marked in time chart Pass
5.2 Search cleared Clear the search regex in event table Marks are removed in time chart Pass France : I am not sure what to do in this section
5.3 Filter synchronization Enter a filter regex in event table Non-matching events are removed from time chart Pass
5.4 Filter cleared Clear the filter regex in event table All events are shown in time chart Pass
5.5Bookmarksynchronization Add a bookmark in event table Bookmarked event is marked in time chart Pass
5.6 Bookmark cleared Remove the bookmark in event table Mark is removed in time chart Fail
Bug 436324: Text is not seen as is it typed into the text field on GTK3
Bug 436323: Bookmark is not removed right away, only when the view is refreshed. This bug used to be GTK3 only but is reproducible with GTK 2.24.25 on Ubuntu 14.10
Section Pass Fail To Do Comment
TMF - Custom Parsers 27 0 0 3
Target: Windows 7
Step Test Case Action Verification Comment
0 Prerequisites
0.1 Get custom parser definition and logs Find text and XML test files.
1 View management
1.1 Open perspectiveOpen and reset Tracing perspective, andopen Time Chart view Time Chart view opens. Pass
1.2 Import tracesCreate a tracing project and import a textand XML custom trace Traces imported in Traces folder of project. Pass
2 Custom parser management
2.1 Open Manage Custom Parsers dialogOpen Manage Custom Parsers dialog inTraces folder context menu Dialog opens. Pass
2.2 New (text)
Select "Text" radio button, click New...button, enter Log Type, change stuff,click Next, click Finish Custom parser appears in list. Pass It is actually "Trace type" not "Log type"
2.6 Import (text)Click Import, find custom parserdefinition, click Open Imported custom parser appears in list. Pass
2.7 New (XML)
Select "XML" radio button, click New...button, enter Log Type, write an xml login the input,<a><b><c>1</c><d>1</d></b><b><c>2</c><d>1</d></b></a> then click onfeeling lucky. set c to timestamp loggedand d to message logged, set timestampformat to ss in both text boxes, click Next,click Finish Custom parser appears in list. Pass
France : I go stuck in the "New..." window (I was notable to click on Next or FInish button because I wasmissing info). Action description should be moreprecise.
2.11 Import (XML)Click Import, find custom parserdefinition, click Open Imported custom parser appears in list. Pass
3 Custom parser trace handling
3.1 Select trace type (text)
Select test file in Traces folder, right-click,select "Select Trace Type > Custom Text> (parser name)"
Trace type is assigned (re-open Select TraceType sub-menu to verify) Pass
3.2 Open trace (text) Double-click on test file in Traces folderEditor opens with events table, Time Chartview is populated. Pass
France : I could no test, was not able to load tracecorrectly because of the custom settings probably. Isuggest to clarify the action description of action 2.2("change stuff")Matthew: works but we should specify "valid trace"
3.3 Raw view (text) Right-click in editor, click Show Raw Editor is split with raw view on right pane. Pass
3.4 Time synchronization (text)Click in Time Chart view, select event ineditor table, select event in raw view
All three widgets synchronize to selectedtime. Pass
3.5 Select trace type (XML)
Select test file in Traces folder, right-click,select "Select Trace Type > Custom XML> (parser name)"
Trace type is assigned (re-open Select TraceType sub-menu to verify) Pass
3.6 Open trace (XML) Double-click on test file in Traces folderEditor opens with events table, Time Chartview is populated. Pass
3.7 Raw view (XML) Right-click in editor, click Show Raw Editor is split with raw view on right pane. Pass
3.8 Time synchronization (XML)Click in Time Chart view, select event ineditor table, select event in raw view
All three widgets synchronize to selectedtime. Pass
4 Raw viewer
4.1 Show Raw Viewer
1) Open Custom text trace2) Right-click in table and select "ShowRaw" Raw viewer is shown beside the events table Pass
4.2 Hide TableRight-click in table and select "HideTable"
Events table is hidden and only raw viewer isshown Pass
4.3 Show TableRight-click in table and select "ShowTable" Events table is shown beside raw viewer Pass
4.4 Select Event (Bug 457852) Select event in raw viewer
Correct event is select in table, timestamp ispropagated to other TMF views andProperties view shows content of selectedevent Pass
4.5Select Event using arrow keys(457852)
1) select event in raw viewer with mouse2) use arrow key down and up severaltimes
Correct event is select in table, timestamp ispropagated to other TMF views andProperties view shows content of selectedevent Pass
4.6 Hide Raw viewer Right-click in table and select "Hide Raw"Raw viewer is hidden and only events tableis shown Pass
Section Pass Fail To Do CommentTMF - State System Explorer 14 0 0
Target: Windows 7 64 bit
Step Test Case Action Verification Comment
1 Preparation
1.1Open TMF State System ExplorerView
Use menu Window → Show View → Other … → Tracing →State System Explorer Verify that 'State System Explorer' view is shown Pass
2 Manage View2.1 Delete view Close the State System Explorer' View 'State System Explorer' view is removed from perspective Pass
2.2 Open viewUse menu Window → Show View → Other … → Tracing →State System Explorer 'State System Explorer' view is displayed and re-populated Pass
2.3 Open Trace Open an LTTng Kernel Trace
Verify that view is populated with kernel state system(o.e.t.analysis.os.linux.kernel) and statistics state systems (o.e.l.tmf.statistics.*)of opened trace Pass Some state systems ID's should be renamed for Trace Compass
2.4Open view when trace is alreadyloaded
1) Close State System Explorer View2) Load LTTng trace3) Open 'State System Explorer' view Verify that view is populated with state systems from trace Pass (if the state system were already built)
2.5 Open Experiment Open Experiment with 2 or more LTTng tracesVerify that view is populated with all kernel state system and statistics statesystems of opened experiment (separated by trace) Pass
The values are only available for time ranges where the traceexists. Only after we've "visited" other timestamps, then theattributes show up and print "Out of range".http://eclip.se/443653
2.7 Select other trace Select different trace by clicking its Events editor tabView is updated to show selected trace. State values, start time and end time areupdated according to the selected trace's previously selected range. Pass
2.6 Restart Restart Eclipse Verify that view is populated with state systems from trace Pass
2.7 Close all traces Close traces and experiment one by one from the editor tab Verify that state system explorer view is cleared after closing the last trace Pass
3Timestamp / Time RangeSelection
3.1 Select timestampSelect time in another view (e.g Histogram view) that supportstime synchronization Verify that state values are updated Pass
3.2 Select time rangeSelect a time range in another view that supports timesynchronization
Verify that only the start of the range is taken in consideration (changing theend time of the range should not affect the displayed values) Pass France : I am not sure what to do here
4 Displaying of Changed Values
4.1 Highlighting of changed values Select many different timestamps one after the otherAttributes whose value changed in the last timestamp selection should behighlighted in yellow. Pass
4.2
“Only Display Changes at SelectedTimestamp” option with eventselection
Enable the “Only Display Changes...” option with the toolbarbutton. Select different Events from the Event Table.
Verify that only the state values that changed because of that event aredisplayed. Pass
“Only Display Changes...” withtimestamp selection
Enable the “Only Display Changes...” option. Select*timestamps* corresponding to state changes (for example,using the previous/next buttons in the Control Flow View). Verify that only the state values that changed at that timestamp are displayed. Pass
Section Pass Fail To Do CommentTMF - Call Stack View 22 0 0 8
Target: Windows 7 64 bit
Step Test Case Action Verification Comment0 Download the test resources Download this1 Preparation
1.1 Open TMF Call Stack ViewUse menu Window → Show View → Other … → Tracing →Call Stack Verify that 'Call Stack' view is shown Pass Path is actually Window -> Show view -> Tracing -> Call stack
1.2 Import generic traceImport a trace that does not have any call stack information, likea standard kernel trace
Verify that nothing is shown in the view, except “Stack info not available(<tracename>)” Pass
1.3 Import cyg-profile trace Import the trace in the "trace" directory of the downloaded zip Verify that the Callstack View is populated with some callstack information. Pass1.4 Import cyg-profile-fast trace Import a trace in the "trace-fast" directory of the downloaded zip Verify that the Callstack View is populated with some callstack information. Pass
2 Manage View2.1 Delete view Close the Call stack view' View 'Call Stack' view is removed from perspective Pass
2.2 Open viewUse menu Window → Show View → Other … → Tracing →Call Stack 'Call Stack' view is displayed and re-populated Pass See comment 1.1. about the path
2.3 Open Trace Open "trace(-fast)" trace Verify that view is populated with call stack information Pass
2.4 Open view when trace is already loaded
1) Close 'Call Stack' view2) Open "glxgears-cyg-profile(-fast)" trace located in the git inctf test3) Open 'Call Stack' view Verify that view is populated with call stack information Pass
2.5 Open ExperimentOpen Experiment with 2 or more Call Stack traces.(You can use both traces)
Verify that view is populated with all call stack information (separated bytrace). Pass
2.7 Select other trace Select different trace by clicking its Events editor tab View is updated to show selected trace. Pass2.6 Restart Restart Eclipse with Call Stack trace opened Verify that view is populated with call stack from trace Pass
2.7 Close all traces Close traces and experiment one by one from the editor tab Verify that Call Stack view is cleared after closing the last trace Pass
3 Navigation
3.1 Select time Click on random time in the time graph paneSelected time line is updated. Table is updated to show the full stackinformation at the selected time. Selected time is updated in other views. Pass
Previous or next call stack change is selected and corresponding active functionand stack depth is selected. Table is updated to show the full stack informationat the selected time. Selected time is updated in other views. Pass
3.3 Zoom to function (table) Double-click on a function in the table pane Time range is updated to the full duration of the selected function Pass3.4 Zoom to function (time graph) Double-click on a function (interval) in the time graph pane Time range is updated to the full duration of the selected function Pass
4 Synchronization
4.1 Time synchronization Select a random time in another view
Selected time line is updated. Table is updated to show the full stackinformation at the selected time. If selected time is outside current range, timerange is updated to include it. Pass The vertical scroll bar is not updated
4.2 Event synchronizationSelect a call stack-impacting event (function entry/exit) in eventstable
In addition to updating the selected time, the active function at the event time isselected. Vertical scroll bar is updated if necessary. Pass
4.3 Time range synchronization Select a new time range in Histogram view. Time range is updated. Pass The vertical scroll bar is not updated
5 Function name import - Text file
5.1 Invalid text file importClick the "Import a textfile..." button in the view. Select arandom file that does not contain any debugging info. The function addresses do not change. Pass France : I am not sure what to do here
5.2 Valid text file import Import a file "fibonacci.symbols"The view now displays function names instead of function addresses (both inthe timegraph and the call stack areas). Pass
The symbol mapping is applied on view level. If multiple tracesare opened, or if an experiment with multiple traces is opened,they cannot each have their own mapping. Bug 459909.France : I am not sure what to do here
Binary importClick the "Import Binary..." button in the view, select thefibonacci executable (fibonacci) The view now displays the function names for both traces Pass France : I am not sure what to do here
Section Pass Fail To Do Comment
TMF - Remote Fetching 53 0 0 5
Target:
Step Test Case Action Verification Type Comment
1 Preparation
1.1 Step 1 Open Trace Compass and reset Lttng perspective Lttng perspective opens with correct views Pass
2 Opening
2.1 Open Profile Editor 1Right-click on Traces Folder -> Fetch Remote Traces … ->Manage Profiles The Profile Editor of preference page opens SWTBot Pass
2.2 Open Profile Editor 2 Window -> Preferences-> Tracing -> Remote Profiles The Profile Editor of preference page opens SWTBot Pass
3 Edit Profile - Add/Delete
3.1 Create ProfileOpen Profile Editor > Click on 'Add' > Enter profile name,remote information, root path and trace pattern New Profile is created and template is provided SWTBot Pass
New Trace Group is created under the node and templateis provided SWTBot Pass
3.4 Add trace Select trace group > right mouse click > select 'New Trace'New Trace is created under Trace Group and template isprovided SWTBot Pass
3.5 Delete Trace Select trace > right mouse click > select Delete Trace is deleted SWTBot Pass
3.6 Delete Trace Group Select Trace Group> right mouse click > select Delete Trace Group is deleted Manual Pass
3.7 Delete Connection Node Select Connection Node > right mouse click > select Delete Connection Node is deleted Manual Pass
3.8 Remove Profile Select Profile > click on 'Remove' button Profile is deleted SWTBot Pass
4 Edit Profile - Reorder
4.1 Move profile up/downCreate at 2-3 profiles > select 2nd profile and press buttons'Move Up'/'Move Down' Profiles are moved up and down Manual Pass
4.2Move connection nodeup/down
Make sure that there are 2 or 3 connection nodes > select 1connection node > click buttons 'Move Up'/'Move Down' Connection Nodes are moved up and down within a profile Manual Pass
4.3 Move Trace Group up/downMake sure that there are 2 or 3 trace gropus > select 1 tracegropu > click buttons 'Move Up'/'Move Down'
Trace Groups are moved up and down within a connectionnode Manual Pass
4.4 Move Trace up/downMake sure that there are 2 or 3 trace gropus > select 1 traces> click buttons 'Move Up'/'Move Down' Traces are moved up and down within a Trace Group SWTBot Pass
5 Edit Profile - Copy, Cut, Paste
5.1 Copy/Paste Profile
Select Profile > click right mouse button on a profile > SelectCopy -> click right mouse button on other profile > SelectPaste Profile is pasted under the selected profile Manual Pass
5.2 Copy/Paste Profile (Keys) Redo 5.1 with CTRL+C and CTRL+V keys Profile is pasted under the selected profile Manual Pass
5.3 Copy/Paste Connection Node
Select Profile > click right mouse button on a ConnectionNode > Select Copy -> click right mouse button on otherConnection Node > Select Paste Profile is pasted under the selected Connction Node Manual Pass
5.4Copy/Paste Connection Node(Keys) Redo 5.3 with CTRL+C and CTRL+V keys Profile is pasted under the selected Connction Node Manual Pass
5.5 Copy/Paste Trace Group
Select Profile > click right mouse button on a Trace Group >Select Copy -> click right mouse button on other Trace Group> Select Paste Profile is pasted under the selected Trace Group Manual Pass
5.6 Copy/Paste Trace Group (Keys) Redo 5.5 with CTRL+C and CTRL+V keys Profile is pasted under the selected Trace Group Manual Pass
5.7 Copy/Paste Trace
Select Profile > click right mouse button on a Trace > SelectCopy -> click right mouse button on other Trace > SelectPaste Profile is pasted under the selected Trace SWTBot Pass
5.8 Copy/Paste Trace (Key) Redo 5.5 with CTRL+C and CTRL+V keys Profile is pasted under the selected Trace Manual Pass
5.9 Cut/Paste Redo 5.1 - 5.8 with cut and paste Successful cut and paste Manual Pass Trace (5.7) is done with SWTBot
6 Edit Profile - Adverserial
6.1 Error empty profile name Clear profile name Error message "Profile must not be empty" Manual Pass
6.2 Duplicate profile name Add profile with name of existing profile Error message "Duplicate profile name" Manual Pass
6.3Error empty Connection nodename Clear Connection node name Error message "Node name must not be empty" Manual Pass
6.4Duplicate Connection nodename
Within a profile, add Connection node with name of existingnode Error message "Duplicate node names" Manual Pass
6.5 Missing username in URI remove user name of a Connection Node Error message "URI must include user information" Manual Pass
6.6 Invalid URI add invalid URIError message "URI must include valid host and portnumber" Manual Pass
6.7 Error empty Trace Group Delete Trace Group name Error message "Trace Group name must not be empty" Manual Pass
6.8 Error empty Trace Delete File Pattern Error message "File name must not be empty" Pass
7.1 Export ProfileSelect multipe profiles > Click Export Button > Select Folderand enter file name > OK Only selected profiles are exported SWTBot Pass
7.2 Import Profile Click on Import Button > select profile XML file > OK Profiles are emported SWTBot Pass
7.3 Import Profile Redo 7.2after second import an error message appears "Duplicateprofile names" Manual Pass
8 Remote Fetch Wizard
8.1 Preparation
1) Import Test Profiles (test-profiles.xml) from test spec.template directory2) Extract test traces.zip from test spec. template directory3) Load custom text parsers located in traces.zip
8.2
Create and run Profile "newProfile" (syslog + synthetic CTFtrace in sub-directory)
1) Create traces in /tmp/traces/syslog and/tmp/traces/generated/synthetic-trace2) Create Profile with Local connection, 1 trace group (root/tmp/traces/) and 2 traces (.*syslog.* and .*synthetic.*) inthis group3) Select profile in Remote Fetch Wizard (Remote Page)4) Click on 'Next' button5) Click on 'Ok'
Verify that all test traces are imported with correct tracetypes assigned. Verify that folder structure is preserved. SWTBot Pass Local connection is used in SWTBot
Clear traces Delete all traces from Traces directory All traces deleted
8.3
Create and run Profile "newProfile" (syslog + synthetic CTFtrace in sub-directory), only 1trace selectted
1) Create traces in /tmp/traces/syslog and/tmp/traces/generated/synthetic-trace2) Create Profile with Local connection, 1 trace group (root/tmp/traces/) and 2 traces (.*syslog.* and .*synthetic.*) inthis group3) Select profile in Remote Fetch Wizard (Remote Page)4) Click on 'Next' button5) deslect the synthetic CTF trace5) Click on 'Ok'
Verify that only the selected traces are imported withcorrect trace types assigned. Verify that folder structure ispreserved. SWTBot Pass Local connection is used in SWTBot
Clear traces Delete all traces from Traces directory All traces deleted
8.4Re-run Profile"TestAllRecursive" (1)
1) Edit Profile to point root directory of extracted test tracesof traces.zip2) Select profile in Remote Fetch Wizard (Remote Page)3) Ckick on 'Next' button (enter password if needed)4) Click on 'Ok'5) In dialog box select 'Rename' for the first trace and'Rename ALL' for the second traces
Verify that all test traces are imported with correct tracetypes assigned (LTTng kernel, LTTng UST, custom text,custom XML). The file unrecognized.log is importeds withunrecognized trace type. Make sure that directorystructure is preserved. Manual Pass
8.5Re-run Profile"TestAllRecursive" (Rename)
1) Select profile in Remote Fetch Wizard (Remote Page)2) Click on 'Next' button (enter password if needed)3) Click on 'Ok'4) In dialog box select 'Rename' for the first trace and'Rename ALL' for the second traces
Verify that all test traces are imported with new name andcorrect trace types assigned (LTTng kernel, LTTng UST,custom text, custom XML). The file unrecognized.log isimporteds with unrecognized trace type. Make sure thatdirectory structure is preserved. Manual Pass
8.6
Re-run Profile"TestAllRecursive"(Overwrite)
1) Select profile in Remote Fetch Wizard (Remote Page)2) Click on 'Next' button (enter password if needed)3) Click on 'Ok'4) In dialog box select 'Overwrite' for the first trace and'Overwrite ALL' for the second traces
Verify that all test traces are imported with correct tracetypes is assigned where old traces are overwritten. (LTTngkernel, LTTng UST, custom text, custom XML). The fileunrecognized.log is importeds with unrecognized tracetype. Make sure that directory structure is preserved. Manual Pass
8.7Re-run Profile"TestAllRecursive" (Skip)
1) Select profile in Remote Fetch Wizard (Remote Page)2) Click on 'Next' button (enter password if needed)3) Click on 'Ok'4) In dialog box select 'Skip' for the first trace and `Skip ALL'for the second traces
Verify that all test traces are skipped and no trace isimported Manual Pass
8.8
Re-run Profile"TestAllRecursive" (Overwrite2)
1) Select profile in Remote Fetch Wizard (Remote Page)2) Select checkbox 'Overwrite traces without warning'3) Click on 'Next' button (enter password if needed)4) Click on 'Ok'
Verify that all test traces are imported with correct tracetypes assigned where old traces are overwritten (nodialog box opens). (LTTng kernel, LTTng UST, custom text,custom XML). The file unrecognized.log is importeds withunrecognized trace type. Make sure that directorystructure is preserved. Manual Pass
Clear traces Delete all traces from Traces directory All traces deleted
8.9Re-run Profile"TestAllRecursive" (2)
1) Select profile in Remote Fetch Wizard (Remote Page)2) Click on 'Ok'
Verify that all test traces are imported with correct tracetypes assigned. The second page is omitted. (LTTngkernel, LTTng UST, custom text, custom XML). The fileunrecognized.log is importeds with unrecognized tracetype. Make sure that directory structure is preserved. Manual Pass
Clear traces Delete all traces from Traces directory All traces deleted
8.10Run Profile"TestAllNonRecursive"
1) Select profile in Remote Fetch Wizard (Remote Page)2) Ckick on 'Next' button (enter password if needed)3) Click on 'Ok'
Verify that only traces from root path are imported(LTTng kernel, LTTng UST, custom text, custom XML). Thefile unrecognized.log is importeds with unrecognized tracetype. Make sure that directory structure is preserved. Manual Pass
Clear traces Delete all traces from Traces directory All traces deleted
8.11Run Profile"TestSpecificRecursive"
1) Select profile in Remote Fetch Wizard (Remote Page)2) Ckick on 'Next' button (enter password if needed)3) Click on 'Ok'
Verify that only kernel and custom text logs are importedfrom root and subdirectory. Make sure that directorystructure is preserved. Manual Pass
Clear traces Delete all traces from Traces directory All traces deleted
8.12Run Profile"TestSpecificNonRecursive"
1) Select profile in Remote Fetch Wizard (Remote Page)2) Ckick on 'Next' button (enter password if needed)3) Click on 'Ok'
Verify that only kernel and custom text logs are importedfrom root directory only. Make sure that directorystructure is preserved. Manual Pass
Clear traces Delete all traces from Traces directory All traces deleted
8.13
Run Profile"TestSpecificMutliGroupRecursive"
1) Select profile in Remote Fetch Wizard (Remote Page)2) Ckick on 'Next' button (enter password if needed)3) Click on 'Ok'
Verify that only traces from root path are imported(LTTng kernel, LTTng UST, custom text, custom XML). Thefile unrecognized.log is importeds with unrecognized tracetype. Make sure that directory structure is preserved. Manual Pass
8.14 Cancel Import
1) Create profile with directory with many CTF traces2) Click on 'Ok'3) Cancel import (red square or Cancel button) Verify that import operation is cancelled Manual Pass
Clear traces Delete all traces from Traces directory All traces deleted
8.15 Run Profile "TestMultiNodes"
1) Select profile in Remote Fetch Wizard (Remote Page)2) Ckick on 'Next' button (enter password if needed)3) Click on 'Ok'
Verify that only traces from root path are imported(LTTng kernel, LTTng UST, custom text, custom XML). Thefile unrecognized.log is importeds with unrecognized tracetype. Make sure that directory structure is preserved. 2nodes directories are created with the above traces stored Manual Pass
Create profile valid IP address. When asked for passwordenter invalid password
Operation to connect to remote node fails with time-outand error dialog is shown with detailed information. Notetime-out is as per remote development preferences Manual Pass
10 Other Remote Backends
10.1 Remote Fetch using RSECreate profile (see 7.3) with URI scheme rse (instead of ssh)and redo test 7.3
Verify that all test traces are imported with correct tracetypes assigned (LTTng kernel, LTTng UST, custom text,custom XML). The file unrecognized.log is importeds withunrecognized trace type. Make sure that directorystructure is preserved. Manual N/A RSE not available with o.e.remote 2.0.0
Clear traces Delete all traces from Traces directory All traces deleted
10.2 Remote Fetch using LocalCreate profile (see 7.3) with URI scheme file (instead of ssh)and node name Local and redo test 7.3
Verify that all test traces are imported with correct tracetypes assigned (LTTng kernel, LTTng UST, custom text,custom XML). The file unrecognized.log is importeds withunrecognized trace type. Make sure that directorystructure is preserved. SWTBot Pass See tests 7.2/7.3
Section Pass Fail To Do Comment
LTTng 2.0 - Control Flow View 45 0 0 2
Target: Windows
Step Test Case Action Verification Comment
0 Prerequisites
0.1 Import tracesImport LTTng Kernel traces in Tracingproject
0.2 Create experimentCreate an experiment with LTTng Kerneltraces
1 View management
1.1 Open perspective Open and reset LTTng Kernel Perspective Control Flow view opens. Pass
1.2 Open trace Open LTTng Kernel trace in Project Explorer
Control Flow view is populated withprocesses, sorted by Trace then TID. Childprocesses appear under their parent, sortedby birth time. Range is set to initial offset.Arrows are drawn between states of a CPU. Pass
1.2 Open experimentOpen experiment with LTTng Kernel tracesin Project Explorer
Control Flow view is populated withprocesses, sorted by Trace then TID. Childprocesses appear under their parent, sortedby birth time. Range is set to initial offset.Arrows are drawn between states of a CPU. Pass
1.3 Close view Close the Control Flow view View is closed. Pass
1.4 Open view Open the Control Flow viewControl Flow view is opened and populatedwith processes. Pass
2 View selection
2.1 Select process in table Select a process in the table Same process is highlighted in time graph. Pass
2.2 Select process in time graphSelect a process in the time graph (emptyregion)
Same process is highlighted in table.Selected time line is updated. Other viewsare synchronized to selected time. Pass
2.3 Select state in time graph Select a state in the time graph
Same process is highlighted in table. State ishighlighted in time graph. Selected time lineis updated. Other views are synchronized toselected time. Pass
3 Mouse handling
3.1 Drag move time rangeCtrl-Drag move time graph left and right withmiddle button
Time range is dragged. When mouse buttonis released, states are updated and new timerange is propagated to other views. Pass Dragging also works with Ctrl-Left
3.2 Zoom time range (mouse wheel)
Zoom with mouse wheel up and down,cursor inside time graph while holding the Ctlbutton
Time range is zoomed in and out, relative tomouse cursor. When mouse wheel is stoppedfor a short time, states are updated and newtime range is propagated to other views. Pass
3.3 Zoom time range (mouse drag)Drag in time graph scale left and right withleft button
Time range is zoomed in and out. Whenmouse button is released, states are updatedand new time range is propagated to otherviews. Pass
3.4 Mouse vertical scrollScroll with mouse wheel up and down,cursor outside time graph
Table and time graph scroll up and down andremain aligned. Selected process does notchange. Vertical scroll bar updated. Pass
3.5 Vertical scroll bar Click and drag vertical scroll bar
Table and time graph scroll up and down andremain aligned. Selected process does notchange. Pass
3.6 Drag select time range Drag select time graph with right button
Selection highlighted. When mouse button isreleased, time range is zoomed to selection,states are updated and new time range ispropagated to other views. Pass
3.7 Double-click reset time range Double-click left button on time scale
Time range is reset to full range, states areupdated and new time range is propagated toother views. Pass
3.8 Mouse hover (empty region)Hover mouse in time graph over emptyregion Tool tip shows process name only. Pass
3.9 Mouse hover (state) Hover mouse in time graph over state
Tool tip shows process name, state name,date, start time, end time, duration. ForUSERMODE state, CPU is shown. ForSYSCALL state, CPU and System Call isshown. For INTERRUPTED state, CPU isshown. Pass
3.10 Drag mouse selection Drag select time graph with left button
Selection highlighted. Status bar of Eclipse isupdated with time information: T, T1, T2 anddelta, where T is the time of the mouseposition, T1 the left most selected time, T2the right most selected time and delta thetime difference between T2-T1 Pass
3.11 Shift key selection
Click select with left button (begin time),press shift key and click select another time(end time)
Selection highlighted. Status bar of Eclipse isupdated with time information: T, T1, T2 anddelta, where T is the time of the mouseposition, T1 the left most selected time, T2the right most selected time and delta thetime difference between T2-T1 Pass
4 Keyboard handling
4.1Keyboard navigation in table(process selection)
With focus on table, use UP, DOWN, HOME,END keys
Selected process is changed. Time graphselection is updated. Vertical scroll barupdated. Pass
4.2Keyboard navigation in table (treeexpansion)
With focus on table,in Windows use LEFT, RIGHT keys whileparent or child process is selected
in Linux use SHIFT LEFT, RIGHT keys whileparent or child process is selected
For parent process, tree is expanded orcollapsed. Time graph item expansion isupdated. Vertical scroll bar updated. For childprocess, left changes selection to parent,time graph selection is updated. Verticalscroll bar updated. Pass Tested in Windows
4.3Keyboard navigation in time graph(process selection)
With focus on time graph, use UP, DOWN,HOME, END keys
Selected process is changed. Table selectionis updated. Vertical scroll bar updated. Pass
4.4Keyboard navigation in time graph(state selection)
With focus on time graph, use LEFT, RIGHTkeys
Previous or next state is selected. Selectedtime is updated in other views. Pass
5 Tool bar handling
5.1 Show Legend Click Show Legend buttonThe legend dialog is opened and can beclosed. Pass
5.2 Reset Time Scale Click Reset Time Scale button
Time range is reset to full range, states areupdated and new time range is propagated toother views. Pass
5.3 Select Previous/Next Event Click Previous/Next Event buttonPrevious or next state is selected. Selectedtime is updated in other views. Pass
5.4 Select Previous/Next Process Click Previous/Next Process buttonSelected process is changed in table andtime graph. Vertical scroll bar updated. Pass
5.5 Zoom In/Out Click Zoom In/Out button
Time range is zoomed in and out, relative tocenter of time range. States are updated andnew time range is propagated to other views. Pass
5.6 Filter Dialog Open Filter Dialog Verify that all buttons are working correctly Pass
5.7 Filter Processes
1) Open Filter Dialog2) Deselect several processes3) Press Ok
Verify that only selected processes aredisplayed in the view Pass
5.8 Hide Arrows Click Hide Arrows buttonVerify that arrows are not drawn in the timegraph Pass
5.9 Follow CPU ForwardWith focus on time graph, click Follow CPUForward button
Time graph is updated to show the next statefor this cpu following the arrow, the event isselected in the Events editor. Pass
5.10 Follow CPU BackwardWith focus on time graph, click Follow CPUBackward button
Time graph is updated to show the previousstate for this cpu following the arrow, theevent is selected in the Events editor. Pass
6 Synchronization
6.1 Time synchronization Select a random time in another view
Selected time line is updated. If selected timeis outside current range, time range isupdated to include it. Pass
6.2 Event synchronization
Select a state-impacting event(sched_switch, syscall, ...) in events table orin Resources view using SelectPrevious/Next event.
In addition to updating the selected time, theprocess containing the state change isselected. Vertical scroll bar is updated ifnecessary. Pass
6.3 Time range synchronizationSelect a new time range in Resources viewor in Histogram view. Time range is updated. Pass
6.4Time range selectionsynchronisation
In any other view that supports rangesynchronization, select a new range.
Selection is highlighted. If begin time (T1) ofselected time range is outside the currentrange, then time range is updated to includeit Pass
7 Multiple Trace Synchronization
Preparation
1) Download traces.zip (if necessary) andunzip into a local directory ${local}2) Import kernel trace${local}/traces/import/kernel-overlap-testing3) Import UST${local}/traces/import/trace ust-overlap-testing4) Create experiment with trace of 2) in it
7.1 Open multiple traces (no overlap)Open multiple traces that don't overlap intime View shows the last opened trace Pass
7.2Change selected time and range(no overlap) Select a time and new range
Selected time line and time range is updatedto selected time and new range. Pass
7.3 Select other trace (no overlap)Select different trace by clicking its Eventseditor tab
View is updated to show selected trace.Selected time line and time range arerestored to the selected trace's previouslyselected time and range. Pass
7.4 Open multiple traces (overlap) Open multiple traces that overlap in time View shows the last opened trace Pass
7.5Change selected time and range(overlap) Select a time and new range
Selected time line and time range is updatedto selected time and new range. Pass
7.6 Select other trace (overlap)Select different trace by clicking its Eventseditor tab
View is updated to show selected trace.Selected time line and time range are set tothe newly selected time and range. Pass
7.7 Close all traces Close all Events editor tabs View is cleared. Pass
8 Miscellaneous
8.1 Restart (Bug 409345)
1) Open LTTng Kernel Trace2) Select Control Flow View3) Restart Eclipse Verify that Control Flow View is populated Pass
Section Pass Fail To Do Comment
LTTng 2.0 - Resources View 36 0 0 2
Target: Windows 7
Step Test Case Action Verification Comment
0 Prerequisites
0.1 Import tracesImport LTTng Kernel traces in Tracingproject
0.2 Create experimentCreate an experiment with LTTng Kerneltraces
1 View management
1.1 Open perspectiveOpen and reset LTTng Kernel Perspective,and select Resources view Resource view opens. Pass
1.2 Open trace Open LTTng Kernel trace in Project Explorer
Resources Flow view is populated withprocesses, sorted by Trace then TID. Childprocesses appear under their parent, sortedby birth time. Range is set to initial offset. Pass
1.2 Open experimentOpen experiment with LTTng Kernel tracesin Project Explorer
Resource view is populated with traces(sorted by name) and their resources as treechildren (sorted by resource type thennumerically) Range is set to initial offset. Pass
1.3 Close view Close the Resources view View is closed. Pass
1.4 Open view Open the Resources viewResources view is opened and populatedwith processes. Pass
2 View selection
2.2 Select resource in time graphSelect a resource in the time graph (emptyregion)
Resource is highlighted. Selected time line isupdated. Other views are synchronized toselected time. Pass
2.3 Select state in time graph Select a state in the time graph
State is highlighted in time graph. Selectedtime line is updated. Other views aresynchronized to selected time. Pass
3 Mouse handling
3.1 Drag move time rangeCtrl-Drag move time graph left and right withmiddle button
Time range is dragged. When mouse buttonis released, states are updated and new timerange is propagated to other views. Pass
3.2 Zoom time range (mouse wheel)Zoom with mouse wheel up and down onheader or ctrl mousewheel in the time graph
Time range is zoomed in and out, relative tomouse cursor. When mouse wheel is stoppedfor a short time, states are updated and newtime range is propagated to other views. Pass
Zoom in and out with Ctlr + Mouse wheel. Consider addingthat detail to the action description to clariry
3.3 Zoom time range (mouse drag)Drag in time graph scale left and right withleft button
Time range is zoomed in and out. Whenmouse button is released, states are updatedand new time range is propagated to otherviews. Pass
3.4 Mouse vertical scrollScroll with mouse wheel up and down,cursor outside time graph (in name space)
Time graph scrolls up and down. Selectedprocess does not change. Vertical scroll barupdated. Pass
3.5 Vertical scroll bar Click and drag vertical scroll barTime graph scroll up and down and remainaligned. Selected process does not change. Pass
3.6 Drag select time range Drag select time graph with right button
Selection highlighted. When mouse button isreleased, time range is zoomed to selection,states are updated and new time range ispropagated to other views. Pass
3.7 Double-click reset time range Double-click left button on time scale
Time range is reset to full range, states areupdated and new time range is propagated toother views. Pass
3.8 Mouse hover (empty region)Hover mouse in time graph over emptyregion Tool tip shows resource name only. Pass
3.9 Mouse hover (state) Hover mouse in time graph over state
Tool tip shows resource name, state name,date, start time, end time, duration. For IRQstate, IRQ number is shown. ForIRQ_ACTIVE/SOFT_IRQ_ACTIVE state,CPU is shown. Pass
On usermode and syscall tool tip shows also shows hovertime, tid and process name.
When not zoomed enough, tool tip does not show CPU forIRQ_ACTIVE/SOFT_IRQ_ACTIVE state.
3.10 Drag mouse seleection Drag select time graph with left button
Selection highlighted. Status bar of Eclipse isupdated with time information: T, T1, T2 anddelta, where T is the time of the mouseposition, T1 the left most selected time, T2the right most selected time and delta thetime difference between T2-T1 Pass
3.11 Shit key selection
Click select with left button (begin time),press shift key and click select another time(end time)
Selection highlighted. Status bar of Eclipse isupdated with time information: T, T1, T2 anddelta, where T is the time of the mouseposition, T1 the left most selected time, T2the right most selected time and delta thetime difference between T2-T1 Pass
4 Keyboard handling
4.1Keyboard navigation in time graph(process selection)
With focus on time graph, use UP, DOWN,HOME, END keys
Selected process is changed. Vertical scrollbar updated. Pass
4.2Keyboard navigation in time graph(state selection)
With focus on time graph, use LEFT, RIGHTkeys
Previous or next state is selected. Selectedtime is updated in other views. Pass
5 Tool bar handling
5.1 Show Legend Click Show Legend buttonThe legend dialog is opened and can beclosed. Pass
5.2 Reset Time Scale Click Reset Time Scale button
Time range is reset to full range, states areupdated and new time range is propagated toother views. Pass
5.3 Select Previous/Next Event Click Previous/Next Event buttonPrevious or next state is selected. Selectedtime is updated in other views. Pass
5.4 Select Previous/Next Process Click Previous/Next Process buttonSelected process is changed in time graph.Vertical scroll bar updated. Pass
5.5 Zoom In/Out Click Zoom In/Out button
Time range is zoomed in and out, relative tocenter of time range. States are updated andnew time range is propagated to other views. Pass
6 Synchronization
6.1 Time synchronization Select a random time in another view
Selected time line is updated. If selected timeis outside current range, time range isupdated to include it. Pass
6.2 Time range synchronizationSelect a new time range in Control Flowview or in Histogram view. Time range is updated. Pass
6.3Time range selectionsynchronisation
In any other view that supports rangesynchronization, select a new range.
Selection is highlighted. If begin time (T1) ofselected time range is outside the currentrange, then time range is updated to includeit Pass
7 Multiple Trace Synchronization
Preparation
1) Download traces.zip (if necessary) andunzip into a local directory ${local}2) Import kernel trace${local}/traces/import/kernel-overlap-testing3) Import UST${local}/traces/import/trace ust-overlap-testing4) Create experiment with trace of 2) in it
7.1 Open multiple traces (no overlap)Open multiple traces that don't overlap intime View shows the last opened trace Pass
7.2Change selected time and range(no overlap) Select a time and new range
Selected time line and time range is updatedto selected time and new range. Pass
7.3 Select other trace (no overlap)Select different trace by clicking its Eventseditor tab
View is updated to show selected trace.Selected time line and time range arerestored to the selected trace's previouslyselected time and range. Pass
7.4 Open multiple traces (overlap) Open multiple traces that overlap in time View shows the last opened trace Pass
7.5Change selected time and range(overlap) Select a time and new range
Selected time line and time range is updatedto selected time and new range. Pass
7.6 Select other trace (overlap)Select different trace by clicking its Eventseditor tab
View is updated to show selected trace.Selected time line and time range are set tothe newly selected time and range. Pass
7.7 Close all traces Close all Events editor tabs View is cleared. Pass
8 Miscellaneous
8.1 Restart (Bug 409345)
1) Open LTTng Kernel Trace2) Select Resource View3) Restart Eclipse Verify that Resources View is populated Pass
Section Pass Fail To Do CommentLTTng 2.0 - Control View 108 0 0 19
For the tests below a Ubuntu machine with LTTng 2.0 installed(with lttng tools 2.0.x) is required. Either create a machineyourself or use machine vCloud machine 142.133.166.54.Make sure that the root session daemon is running (sudo lttnglist -k) and have one UST process running (e.g. from lttng-toolsgit repository under tests/hello.cxx)
LTTng Tracer Control User Guide:http://wiki.eclipse.org/Linux_Tools_Project/LTTng2/User_Guide#LTTng_Tracer_Control
0.1 Set Proxya) Window → Preferences → General → Network Connectionsb) Set “Active Provider” to “Direct”
1 General
1.1 Open perspective Open and reset LTTng Kernel PerspectiveLTTng Kernel perspective opens with correct Controlview on the left bottom corner Pass
2 Manage View2.1 Close view Close Control View Control view is removed from perspective Pass
2.2 Open Control viewUse menu Window → Show View → Other … → Lttng →Control Verify that Control view is shown Pass
3 Connection Handling
3.1 Create Host Connection
1) Click Button 'New Connection...'2) Select Tree item "Built-in SSH" and click on Create3) Enter Connection Name (e.g. MyHost), enter Host Name (aDNS name or IP address), username and password4) Click 'Finish'5) In Tree select the newly create connection and click on 'Ok'
Make sure that after 4) the new connection is shown inthe tree. Verify that the new host is shown in the Controlview (with 'Connection Name'. After Ssh connection hasbeen established, make sure that Provider and Sessionnodes are created in the Control view underneath thehost. Verify that all active Providers (Kernel and USTproviders) are shown under the 'Provider' node. Pass
3.2 Disconnecta) Select host to disconnect and click Button 'Disconnect'b) Redo test with context sensitive menu item 'Disconnect'
Verify that icon for the corresponding node changes tothe disconnect icon and all sub-nodes are removed. Pass
3.3 Connecta) Select host to connect and click Button 'Connect'b) Redo test with context sensitive menu item 'Connect'
Verify that icon for the corresponding node changes tothe connected icon and after successful SSH connectionall data is retrieved form the remote host (Providers,sessions etc). Pass
3.4 Select Host Connection
1) Restart Eclipse2) Click Button 'New Connection...'3) Select the host previously created4) Select 'Ok'. (Afterwards enter user ID and Password ifnecessary)
Make sure that SSH connection is established and alldata is retrieved from the remote host ( (Providers,sessions etc). Pass
3.5Node contexts sensitive menu (hostconnected)
1) Connect to remote host2) select connected node and click right mouse button
Verify that menu items are shown and enabled/disableddepending on state:'Connect' (disabled)Disconnect (enabled)Refresh (enabled)Delete (disabled) Pass
3.6View button enable state (hostconnected)
1) Connect to remote host (if necessary)2) select connected node
Verify enable state of view buttons:'New Connection...' (enabled)'Connect' (disabled)'Disconnect' (enabled)'Refresh' (enabled)'Delete' (disabled)'Start' (disabled)'Stop' (disabled)'Destroy Session...' (disabled)'Record Snapshot' (disabled)'Import...' (disabled) Pass
3.7Node contexts sensitive menu (hostdisconnected)
1) Disconnect from node2) select disconnnected node and click right mouse button
Verify that menu items are shown and enabled/disableddepending on state:'Connect' (enabled)'Disconnect' (disabled)'Refresh' (disabled)'Delete' (enabled) Pass
3.8View button enable state (hostconnected)
1) Disconnect to remote host (if necessary)2) select disconnected node if necessary
Verify enable state of view buttons:'New Connection...' (enabled)'Connect' (enabled)'Disconnect' (disabled)'Refresh' (disabled)'Delete' (enabled)'Start' (disabled)'Stop' (disabled)'Destroy Session...' (disabled)'Record Snapshot' (disabled)'Import...' (disabled) Pass
3.9 Delete
a) Select node to delete (state disconnected) and click onbutton 'Delete'b) Redo test with context sensitive menu item 'Delete'
Verify that host is removed from the control view. Verifythat host doesn't show up in available hosts whencreating a new connection (see 3.4) Pass
3.10 Create Host Connection with ssh portre-do 3.1 but this time specify a port number other than defaultSSH port 22
The connection should fail (unless remote is configuredfor the specified port) Pass
4.2 Sessions Context Sensitive Menu Select 'Sessions' in tree and click right mouse button
Verify that menu items are shown and enabled:'Refresh', 'Create Session...', 'Execute Command Script...' Pass
4.3 Create Session (default location)
1) Click right mouse button on 'Sessions'2) Select 'Create Session...' in the context sensitive menu3) Enter session name 'MySession', keep 'Session Path' empty4) Select 'Ok'
Verify that new session is added under the Session treenode. Verify properties in Properties view (by selectingthe session in the Control view):'Session name' (=MySession)'Session Path' (=/home/<user>/traces/MySession_<dateand time>) and 'State' (=INACTIVE) Pass
4.4 Create Session (custom location)
1) Click right mouse button on 'Sessions'2) Select 'Create Session...' in the context sensitive menu3) Enter session name 'MyOtherSession'4) enter custom path (/tmp/myTraces) for 'Session Path'5) Select 'Ok'
Verify that new session is added under the Session treenode. Verify properties in Properties view (by selectingthe session in the Control view):'Session name' (=MyOtherSession) 'Session Path' (=/tmp/myTraces) and 'State'(=INACTIVE) Pass
4.5Create Session – session already existsin GUI
1) Click right mouse button on 'Sessions'2) Select 'Create Session...' in the context sensitive menu3) Enter session name 'MySession', keep 'Session Path' empty
Make sure that an error message appears in themessage area of the dialog box with information thatsession 'MySession' already exists in the tree. Pass
4.6Create Session – session already existson node
1) login to the remote host using a command shell2) type lttng create newSession and press enter. This willcreate a session which is not know by the Control view.3) Click right mouse button on 'Sessions'4) Select 'Create Session...' in the context sensitive menu5) Enter session name 'MySession', keep 'Session Path' empty6) Select 'Ok'
Verify that an error dialog box will show with informationthat command to create a session failed. session alreadyexists on the node. Select 'Details': Verify that thecommand error detail is shown (with return value (28)) Pass
4.7Session Context Sensitive menu(session inactive) Select newly created session and click right mouse button
4.11View button enable state (sessionactive) Select started session
Verify enable state of view buttons:'New Connection...' (enabled)'Connect' (disabled)'Disconnect' (disabled)'Refresh' (enabled)'Delete' (disabled)'Start' (disabled)'Stop' (enabled)'Destroy Session...' (disabled)'Import...' (disabled) Pass
4.12 Destroy Session
1) In the Control view select session 'MyOtherSession'2) Click right mouse button3) select 'Destroy Session...' in the context sensitive menu4) Select 'Ok' in the confirmation dialog box Verify that session is removed from the control view. Pass
5 Kernel Channel Handling
5.1 Preparation1) Connect to remote host2) Create new Session 'MyOtherSession' - Pass
5.2Enable Channel on session level(default values)
1) Select session and right mouse click2) Select menu item 'Enable Channel...'3) Enter Channel name (e.g. myChannel) and keep defaultvalues4) Select Kernel5) Click on 'Ok'
Verify that domain 'Kernel' is created under session andchannel is added under the domain. Verify that defaultvalues for the channel are displayed in the Propertiesview after selecting the channel in the tree. Pass
5.3Enable Channel on domain level (defaultvalues)
1) Select domain 'Kernel' and right mouse click2) Select menu item 'Enable Channel...'3) Enter Channel name (e.g. MyOtherChannel)4) Change values5) Click on 'Ok'
Verify that channel is added under the domain. Verifythat correct values for the channel are displayed in theProperties view after selecting the channel in the tree. Pass
5.4Enable Channel – channel alreadyexists
1) Select domain 'Kernel' and right mouse click2) Select menu item 'Enable Channel'3) Enter Channel name (e.g. MyOtherChannel) and keepdefault values4) Click on 'Ok'
Verify that error dialog box is opened notifying thatchannel already exists. Pass
5.5 Domain Context Sensitive menu Select domain 'Kernel' and click right mouse button
5.7 Disable Channel1) Select channel 'MyChannel' and click right mouse button2) Select 'Disable' menu item
Verify that channel is disabled (disabled channel iconshown, state DISABLED shown in Properties view, menuitem 'Disable' is disabled and menu item 'Enable' isenabled Pass
5.8 Enable Channel1) Select channel 'MyChannel' and click right mouse button 2)Select 'Enable' menu item
Verify that channel is enabled (enabled channel iconshown, state ENABLED shown in Properties view, menuitem 'Disable' is enabled and menu item 'Enable' isdisabled Pass
6 UST Channel Handling
6.1Enable Channel on session level(default values)
1) Select session and right mouse click2) Select menu item 'Enable Channel...'3) Enter Channel name 'MyChannel'4) Select UST5) Click on Button 'Default'5) Click on 'Ok'
Verify that domain 'UST global' is created under sessionand channel is added under the domain. Verify thatdefault values for the channel are displayed in theProperties view after selecting the channel in the tree. Pass
6.2 Enable/Disable Channel Redo tests 5.7 and 5.8 with UST channel See 5.7/5.8 Pass
Pass
7 Kernel Event Handling
7.1Enable Event on session level (alltracepoints)
1) Select session and click right mouse button2) Select menu item 'Enable Events (default channel)...'3) Select 'Kernel'4) Select Radio button for 'Tracepoint Events'5) Select top level tree node 'All'6) Click on Ok
Verify that default channel (channel0) is create underdomain 'Kernel' and that all tracepoint events are addedunder the channel with state ENABLED. Verifyproperties view show correct values when selecting aevent in the tree (Event Type=TRACEPOINT,State=ENABLED) Pass
7.2 Enable Event on domain level (syscalls)
1) Select domain Kernel and click right mouse button2) Select menu item 'Enable Events (default channel)...'3) Select 'Kernel'4) Select Radio button for 'All Syscalls'5) Click on Ok
Verify that event with name syscalls is added under thedefault channel (channel0) with state ENABLED. Verifyproperties view show correct values when selecting aevent in the tree (Event Type=SYSCALL,State=ENABLED) Pass
7.3Enable Event on Channel level(Dynamic Probe)
1) Select a channel (e.g. channel0) and click right mousebutton2) Select menu item 'Enable Events...'3) Select Radio button for 'Dynamic Probe'4) Enter Event Name 'MyEvent' and Probe (e.g. 0xc0101280,see file /boot/System.map<kernel version>)5) Click on Ok
Verify that event with name 'MyEvent' is added under therespective channel with state ENABLED. Verifyproperties view show correct values when selecting aevent in the tree (Event Type=Probe, State=ENABLED,Address=0xc0101280, Event Name=MyEvent) Pass
address not allowed Command to change state oCommand failed! Command: lttng --mi xml enablError Ouptut:Error: Event myEvent: Non-default channel existsReturn Value: 83<?xml version="1.0" encoding="UTF-8"?><command><name>enable-event</name><outp
7.4Enable Event on Channel level(Dynamic Function Probe)
1) Select a channel (e.g. channel0) and click right mousebutton2) Select menu item 'Enable Events...'3) Select Radio button for 'Dynamic Function Entry/ReturnProbe'4) Enter Event Name 'MyOtherEvent' and Probe (e.g.create_dev, see file /boot/System.map<kernel version>)5) Click on Ok
Verify that event with name 'MyOtherEvent' is addedunder the respective channel with state ENABLED.Verify properties view show correct values whenselecting a event in the tree (Event Type=Function,State=ENABLED, Symbol=create_dev, Offset=0x0,Event Name=MyOtherEvent) Pass
Since LTTng Tools 2.2 the event type displayed in thelist command is function instead of probe.
Command to change state of events failedCommand failed! Command: lttng --mi xml enablError Ouptut:Error: Event bob: Non-default channel exists withiReturn Value: 83<?xml version="1.0" encoding="UTF-8"?><command><name>enable-event</name><outp
7.5 Disable Event
1) Select multiple events under a channel (not syscalls) andclick right mouse button2) Select 'Disable' menu item
Verify that all selected events are disabled (disabledevent icon is shown, state DISABLED is shown inProperties view, menu item 'Disable' is disabled andmenu item 'Enable' is enabled Pass
7.6 Enable Event1) Select multiple disabled events and click right mouse button2) Select 'Enable' menu item
Verify that selected events are enabled (enabled eventicon is shown, state ENABLED is shown in Propertiesview, menu item 'Disable' is enabled and menu item'Enable' is disabled Pass
7.7Enable Tracepoint Event using filter intree (Bug 450526)
1) Create Session2) Select session, right-mouse click and select 'Enable Events(default channel)'3) Enter a filter (e.g. sched) for the tracepoint tree and thenselect All4) Click on Ok
Verify that only the selected trace points (filtered) areenabled and not all UST trace poionts Pass
8 UST Event Handling
8.1Enable Event on session level (alltracepoints)
1) Select session and click right mouse button2) Select menu item 'Enable Events (default channel)...'3) Select 'UST'4) Select Radio button for 'Tracepoint Events'5) Select top level tree node 'All'6) Click on Ok
Verify that default channel (channel0) is create underdomain 'UST global' and that a wildcard event “*” iscreate under the channel with state ENABLED. Verifyproperties view show correct values when selecting aevent in the tree (Event Type=TRACEPOINT,State=ENABLED) Pass
8.2Enable Event on domain level(wildcards)
1) Select domain 'UST global' and click right mouse button2) Select menu item 'Enable Events (default channel)...'3) Select Radio button for 'Wildcard'4) Enter a wildcard (e.g. ust*)5) Click on Ok
Verify that event with wildcarded name (e.g ust*) isadded under the default channel (channel0) with stateENABLED. Verify properties view show correct valueswhen selecting a event in the tree (EventType=TRACEPOINT, State=ENABLED) Pass
8.3Enable Event on Channel level (loglevel)
1) Select a channel (create if necessary) and click right mousebutton2) Select menu item 'Enable Events...'3) Select Radio button for 'Log Level'4) Enter Event Name 'MyEvent'5) Select log level TRACE_ERR6) Select radio button for loglevel7) Click on Ok
Verify that event with name 'MyEvent' is added under therespective channel with state ENABLED. Verifyproperties view show correct values when selecting aevent in the tree (Event Type=TRACEPOINT,State=ENABLED, Log Level=<=TRACE_ERR, EventName=MyEvent) Pass
Note: In LTTng backend v2.4 and later provideinformation if a loglevel is for a range (e.g. <=TRACE_ERR) This will be displayed by the propertiesview now
8.4Enable Event on Channel level (log leveloly)
1) Select a channel (create if necessary) and click right mousebutton2) Select menu item 'Enable Events...'3) Select Radio button for 'Log Level'4) Enter Event Name 'MyOtherEvent'5) Select log level TRACE_INFO6) Select radio button for loglevel-olny7) Click on Ok
Verify that event with name 'MyOtherEvent' is addedunder the respective channel with state ENABLED.Verify properties view show correct values whenselecting a event in the tree (Event Type=TRACEPOINT,State=ENABLED, Log Level= ==TRACE_INFO, EventName=MyOtherEvent). Pass
Note: In LTTng backend v2.4 and later provideinformation if a loglevel is for a single level (e.g. ==TRACE_INFO) This will be displayed by the propertiesview now
8.5 Enable/Disable Event Redo tests 7.5 and 7.6 with UST events See 7.5/7.6 Pass
8.6Enable Tracepoint Event using filter intree (Bug 450526)
1) Create Session2) Select session, right-mouse click and select 'Enable Events(default channel)'3) Enter filter for the tracepoint tree and then select All4) Click on Ok
Verify that only the selected trace points (filtered) areenabled and not all UST trace poionts Pass
9 Contexts Handling
9.1 Add Context (to channel)
1) Select kernel channel and click right mouse button2) Select menu item 'Add Contexts...'3) Expand tree and select some contexts (e.g prio, procname,pid)4) Click on 'Ok'
Verify that command is successful (no error).NOTE: There is no way to retrieve added contexts fromthe trace. Therefore GUI cannot display this information. Pass
duplicated event, and gives a failure.Command to change state of eventsfailedCommand failed! Command: lttng --mixml enable-event log -u -sMyOtherSession -c Grimace --tracepointError Ouptut:Error: Event log: UST event alreadyenabled (channel Grimace, sessionMyOtherSession)Return Value: 55<?xml version="1.0" encoding="UTF-8"?><command><name>enable-event</name><output><events><event><name>log</name><type>TRACEPOINT</type><enabled>false</enabled><filter>false</filter><exclusion>false</exclusion><success>false</success></event></events></output><success>false</success></command>
9.2 Add Context (to channel)
1) Select UST channel and click right mouse button2) Select menu item 'Add Contexts...'3) Expand tree and select contexts procname, pthread_id, vpidand vtid4) Click on 'Ok'
Verify that command is successful (no error).NOTE 1: There is no way to retrieve added contextsfrom the trace. Therefore GUI cannot display thisinformation.NOTE2: For UST only contexts procname, pthread_id,vpid and vtid are supported Pass
9.3 Add Context (to event)
1) Select 1 Kernel tracepoint event and click right mousebutton2) Select menu item 'Add Contexts...'3) Expand tree and select some contexts (e.g prio, procname,pid)4) Click on 'Ok'Note: only when using LTTng Tools 2.0.x - 2.1.x. For v2.2 orlater this menu item has to be disabled
Verify that command is successful (no error).NOTE: There is no way to retrieve added contexts fromthe trace. Therefore GUI cannot display this information. N/A
Per event adding of context is not supported by LTTngTools anymore (starting from LTTng 2.2)
10 Enable Events (from Provider)
10.1 Enable Kernel Events
1) Create a new session2) Select multiple Kernel Tracepoint events under Providers →Kernel3) click right mouse button4) select menu item 'Enable Event...'5) Select newly created session6) Select 'Ok'
Verify that domain 'Kernel' is created under the newsession. Verify that default channel 'channel0' is createdunder the domain. Verify that selected events are addedunder the channel and are ENABLED. Pass
10.2 Enable UST Events
1) Make sure that UST application is running on remote host(see step 0)2) Create a new session3) Create a channel under domain 'UST global'4) Select multiple UST Tracepoint events under Providers -><UST Process>5) click right mouse button6) select menu item 'Enable Event...'7) Select newly created session8) Select newly created channel9) Select 'Ok'
Verify that selected events are added under the selectedchannel and are ENABLED. Pass
11 Importing to Project
11.1 Preparation
1) Create new session2) Enable all Kernel Tracepoint events3) Enable all Kernel sycalls4) Enable all UST events5) Start Tracing6) Stop Tracing after a few seconds7) Create new Tracing Project Pass
11.2 Import to project
1) Select session from 11.1 and click right mouse button2) Select 'Import...'3) Select Ok
After 2 verify that all traces are selected by default andalso that the tracing project with name 'Remote' isselected.
Verify that during import a progress dialog is opened toshow the progress of the import operation.
Verify that traces are imported to the project wiith nameRemote and its Traces folder. Verify that for the kerneltrace the trace type "LTTng Kernel Trace" is set and forthe UST traces the trace type "LTTng UST Trace" is set.
Create Experiment, select all traces and openExperiment. Make sure that all view are populatedcorrectly in the LTTng Kernel Perspective. Pass
11.3 Import to project (Overwrite)
1) Repeat step 1 – 3 of test case 11.22) In dialog box select 'Overwrite existing traces withoutwarning'3) Select Ok
Verify that traces are imported and existing traces areoverwritten Pass
11.4 Import to project (Rename)
1) Repeat step 1 – 3 of test case 11.22)Select Ok3) For each trace a confirmation dialog will open:Select 'Rename' and change trace name4) Select 'Ok' Verify that traces are imported with a different name Pass
11.4Import to project (OverwriteConfirmation)
1) Repeat step 1 – 3 of test case 11.22)Select Ok3) For each trace a confirmation dialog will open:Select 'Overwrite'4) Select 'Ok'
Verify that traces are imported and existing traces areoverwritten Pass
12 Refresh
12.1 RefreshPress refresh button and context sensitive menu item fordifferent selections Verify that the Control View is refreshed. Pass
13 Calibration
13.1 Preparation
1) Create new session2) Enable all Kernel Tracepoint events3) Enable all Kernel sycalls4) Enable all UST events
Pass
13.1 Calibrate
1) Start Tracing2) Select Domain 'Kernel' and click right mouse button3) Select menu item Calibrate4) Redo step 2-3 with domain 'UST global'5) Stop tracing
Verify that Calibrate command is executed without error.The test case is To Doed if no Error occurred.See also calibrate section in link below for a Use Case ofthat feature. http://lttng.org/files/doc/man-pages/man1/lttng.1.html Pass
14 Event Filtering (LTTng 2.1)
14.1
For the tests below a Ubuntu machine with LTTng 2.1 installed(with lttng tools 2.1.x) is required. Either create a VM machineyourself (e.g. on Virtualbox) or install it locally on your nativeUbuntu (if correct version). Make sure that the root sessiondaemon is running (sudo lttng list -k) and have one USTprocess running (e.g. from lttng-tools git repository undertests/hello.cxx)
14.2 Preparation1) Connect to remote host2) Create new Session 'FilterSession'
14.3 Enable UST Event on session level
1) Select session and click right mouse button2) Select menu item 'Enable Events (default channel)...'3) Select 'UST'4) Select Radio button for 'Tracepoint Events'5) Select one tracepoint6) Enter filter expression on a event field7) Click on 'Ok'
Verify that default channel (channel0) is create underdomain 'UST global' and that the corresponding event iscreated under the channel with state ENABLED.
Verify that Properties view shows correct values for thisevent (Event Type=TRACEPOINT, State=ENABLED,Filter=with filter) Pass
14.4 Enable UST Event from provider
1) Execute 14.32) Select one UST Tracepoint event under Providers -> <USTProcess>3) click right mouse button4) select menu item 'Enable Event...'5) Select newly create session and channel6) Enter filter expression on a event field7) Click on 'Ok'
Verify that selected event is added under the selectedchannel.
Verify that Properties view shows correct values for thisevent (Event Type=TRACEPOINT, State=ENABLED,Filter=with filter) Pass
14.5 Create trace
1) Start Tracing2) Stop Tracing after a view seconds3) Import Trace to Project4) Open Trace5) Destroy Session
Make sure that only events are shown in the eventstable that met the condition in the filter expressions Pass
For the tests below a Ubuntu machine with LTTng 2.1 installed(with lttng tools 2.1.x) is required. Either create a VM machineyourself (e.g. on Virtualbox) or install it locally on your nativeUbuntu (if correct version). Make sure that the root sessiondaemon is running (sudo lttng list -k) and have one USTprocess running (e.g. from lttng-tools git repository undertests/hello.cxx)
After 2) verify that advanced options are shown (e.g.Trace Path, Protocol, Address and Port)
After 3) verify that advanced option are not shown andonly basic options are there (Session Name and SessionPath) Pass
15.3
Create Session Dialog - Check box "Usesame protocol and address for data andcontrol"
1) Open Create Session Dialog box and select "Advanced>>>"2) Uncheck checkbox"Use same protocol and address for dataand control"3) Check checkbox "Use same protocol and address for dataand control"
After 2) verify that data Protocol and data Address isenabled. Note that the ports cannot be configured for netand net6 when this button is unchecked. -> port textfields are disabled
After 3) Verify that data Protocol and data Address aredisabled Pass
15.4 Create Session Dialog - Protocol list
1) Open Create Session Dialog box and select "Advanced>>>" Verify that the data protocol dropdown menu shows net,
net6 and file Pass
15.5 Create Session Dialog - Protocol list 2
1) Open Create Session Dialog box and select "Advanced>>>"2) Uncheck checkbox "Use same protocol and address fordata and control"
After 2) verify that the data protocol dropdown menushows net, net6, tcp and tcp6 Pass
15.6Create Session Dialog - Protocolpropagation
1) Open Create Session Dialog box, select "Advanced >>>"2) Select net6 for Control Protocol3) Select file for Control Protocol
After 2) verify that net6 is propagated to the dataprotocol and and that the data and control port text fieldsare enabledAfter 3) verify that file is propagated to the data protocoland that the data and control port text fields are disabled. Pass
15.7Create Session Dialog - Addresspropagation
1) Open Create Session Dialog box, select "Advanced >>>"2) Enter IP address
After 2) verify that the IP address is propagated to thedata address field Pass
15.8Create Session Dialog - Protocolpropagation 2
1) Open Create Session Dialog box and select "Advanced>>>"2) Uncheck checkbox "Use same protocol and address fordata and control"3) Select tcp for control protocol and tcp6 for data protocol4) Check checkbox "Use same protocol and address for dataand control"
After 4) make sure that both data and control protocolshow net Pass
15.9 Create trace with file protocol
1) Open Create Session Dialog box and select "Advanced>>>"2) Enter session name, select file protocol and enter directory/tmp/testTraces/ in address field and press ok3) Enable events, start tracing, wait for a few seconds, stoptracing4) Import traces to a existing tracing project5) Destroy session
Verify that the traces are stored on the remote hostunder /tmp/testTraces/<session name + date>/kerneland /tmp/testTraces/<session name +date>/ust/<application(s)> repectively.
After 2) make sure that the Session Path in the PropertyView shows the URL with the configured parameters
Verify that the remote import dialog box opens at step 4(as described in test cases 11.x) and it is possible totransfer the traces to the tracing project. Pass
15.10Create trace with file protocol and tracepath
1) Open Create Session Dialog box and select "Advanced>>>"2) Enter session name, select file protocol and enter directory/tmp/tmpTraces/ in address field, enter /newPath in "TracePath" text field and press ok3) Enable events, start tracing, wait for a few seconds, stoptracing4) Import traces to a existing tracing project5) Destroy session
Verify that the traces are stored on the remote hostunder /tmp/testTraces/newPath/kernel and/tmp/testTraces/newPath/ust/<application(s)>repectively.
After 3) make sure that the Session Path in the PropertyView shows the URL with the configured parameters
Verify that the remote import dialog box opens at step 4(as described in test cases 11.x) and it is possible totransfer the traces to the tracing project. Pass
After import the root directory is newPath. However Iexpected tmpTrace with sub-dir newPath. Needs to beinvestigated
15.11 Create trace with net protocol
1) Start relayd on Eclipse local machine (default settings: lttng-relayd)2) Open Create Session Dialog box and select "Advanced>>>"3) Enter session name, select net protocol and enter IPaddress of Eclipse local machine in address field and press ok4) Enable events, start tracing, wait for a few seconds, stoptracing5) Import traces to a existing tracing project6) Destroy session
Verify that the traces are stored on the Eclipse localmachine under /home/<user name>/lttng-traces/<remotemachine name>/<session name + date>/kernel and/home/<user name>/lttng-traces/<remote machinename>/<session name + date>/ust/<application(s)>repectively.
After 3) make sure that the Session Path in the PropertyView shows the URL with the configured parameters
After 5) Verify that dialog box for selecting a tracingproject is openend that after selecting a project andpressing next the default trace import wizard opens.Then verify that it is possible to transfer the traces to thetracing project. Pass
15.12 Create trace with tcp protocol and port
1) Uncheck checkbox "Use same protocol and address fordata and control"2 ) Start relayd on Eclipse local machine with specified ports(lttng-relayd -C tcp://0.0.0.0:1234 -D tcp://0.0.0.0:5678)3) Open Create Session Dialog box and select "Advanced>>>"4) Enter session name, select tcp protocol and enter IPaddress of Eclipse local machine in address field, specify dataand control ports and press ok5) Enable events, start tracing, wait for a few seconds, stoptracing6) Import traces to a existing tracing project7) Destroy session
Verify that the traces are stored on the Eclipse localmachine under /home/<user name>/lttng-traces/<remotemachine name>/<session name + date>/kernel and/home/<user name>/lttng-traces/<remote machinename>/<session name + date>/ust/<application(s)>repectively.
After 4) make sure that the Session Path in the PropertyView shows the URL with the configured parameters
After 6) Verify that dialog box for selecting a tracingproject is openend that after selecting a project andpressing next the default trace import wizard opens.Then verify that it is possible to transfer the traces to thetracing project. Pass
1) Start relayd on Eclipse local machine (default settings: lttng-relayd)2) Select Live Mode3) Open Create Session Dialog box and select "Advanced>>>"4) Enter session name, select net protocol and enter IPaddress of Eclipse local machine in address field, keepdefaults for Live Connection and Live Delay, and press ok5) Enable UST events (per UID channel), start tracing, wait fora few seconds, stop tracing6) Import traces to a existing tracing project7) Destroy session
Verify that session is created successfully. Verify thatafter 6) the trace appears in the Traces directory ofRemoter project. Verify that relevants views are updatedwhen new data arrives Pass
No way to specify destination in tracing project.No check for name collision of the trace nameNot possible yet to trace per PIDXML Analysis view cannot be opened
1) Start relayd on Eclipse local machine (default settings: lttng-relayd)2) Select Live Mode3) Open Create Session Dialog box and select "Advanced>>>"4) Enter session name, select net protocol and enter IPaddress of Eclipse local machine in address field, keepdefaults for Live Connection and Live Delay, and press ok5) Enable Kernel events, start tracing, wait for a few seconds,stop tracing6) Import traces to a existing tracing project7) Destroy session
Verify that session is created successfully. Verify thatafter 6) the trace appears in the Traces directory ofRemoter project. Verify that relevants views are updatedwhen new data arrives Pass Performance needs to be investigated.
16 Preferences
16.1 Open Preference DialogOpen Preferences (Menu -> Preferences -> Tracing -> LTTngTracer Control Preferences)
Verify that tracer control preferences exists and showsTracing Group, Logging, Log File (always disabled),Append, Verbose Level (None, Level 1, Level2 Level 3) Pass
16.2 Enable Logging In Tracer Control Prferences, check checkbox Logging Verbose Level radio buttons will be enabled Pass
16.3 Disable Logging In Tracer Control Prferences, uncheck checkbox Logging Verbose Level radio buttons will be disabled Pass
16.4 Test Logging level noneExecute 16.2 and execute some commands (e.g. createsession, enable event)
Make sure that log file is created and contains theexecuted commands and command replies Pass
Make sure that log file contains the executed commandswith -v option (e.g. lttng -v create session) and thecommand replies come with debug information Pass This makes no difference for Lttng 2.6 in mi mode
Make sure that log file contains the executed commandswith -vv option (e.g. lttng -vv create session) and thecommand replies come with debug information Pass This makes no difference for Lttng 2.6 in mi mode
Make sure that log file contains the executed commandswith -vvv option (e.g. lttng -vvv create session) and thecommand replies come with debug information Pass This makes no difference for Lttng 2.6 in mi mode
16.8 Append ModeCheck checkbox Append, restart Eclipse and open TracerControl Preferences
Verify that tracer control preferences are persisted andthe log file is opened in append mode (old file is notoverwritten) Pass
16.9 Change Tracing GroupChange Tracing group (e.g. tracing2) and execute a command(while logging enabled)
Verify that lttng command is executed with command lineoption -g <group>. Ignore any command reply errors (ifany) Pass Incorrect command-line was build (Bug 459444)
16.10 Change execution timeout Change Execution TimeoutAfter verify that values smaller than 5 and bigger than600 are rejected Pass
16.11 Reset Reset to defaults
Verify: Group=tracing, Logging is deselected, Append isdeselected, Verbose Level=None), and CommandTimout is 15 Pass
17Create Channel with advance features(LTTng 2.2 features)
17.1
For the tests below a Ubuntu machine with LTTng 2.1 installed(with lttng tools 2.1.x) is required. Either create a VM machineyourself (e.g. on Virtualbox) or install it locally on your nativeUbuntu (if correct version). Make sure that the root sessiondaemon is running (sudo lttng list -k) and have one USTprocess running (e.g. from lttng-tools git repository undertests/hello.cxx).
17.2 Configure Metadata channel (kernel)
1) Create and select session and click right mouse button2) Select menu item 'Enable Channel...'3) Select Checkbox 'Configure metadata channel'4) Update all text boxes5) Click on 'Ok'
Verify after 3) that 'Channel Name' is set to metadataand the correspondig textbox is disabled. Verify after 5)that metadata channel was created under the kerneldomain. Also verify in the properties view that allparameters are set correctly when selecting the channelmetadata. Pass
17.3 Configure Metadata channel (UST) 1) Re-do 17.2 with a UST channel
Verify after 3) that 'Channel Name' is set to metadataand the correspondig textbox is disabled. Verify after 5)that metadata channel was created under the domainUST global. Also verify in the properties view that allparameters are set correctly when selecting the channelmetadata. Pass
Command is successful. However tracer doesn't createmetadata channel
17.4 Configure File rotation (kernel)
1) Create and select session and click right mouse button2) Select menu item 'Enable Channel...'3) Fill in channel name4) Fill in 1048576 in 'Maximum size of trace files' and also 'SubBuffer Size'5) Fill in 2 in 'Maximum number of trace filesfiles'6) Click on 'Ok'7) Enable all kernel events8) Start, wait and stop tracing.
After 8) verify on the trace node that trace files are notbigger than 1048576 bytes Pass Kernel trace is generated corretly with LTTng 2.5.4
17.5 Configure File rotation (ust)
1) Create and select session and click right mouse button2) Select menu item 'Enable Channel...'3) Fill in channel name4) Select UST5) Fill in 262144 in 'Maximum size of trace files' and also 'SubBuffer Size'6) Fill in 2 in 'Maximum number of trace filesfiles'7) Click on 'Ok'8) Enable all UST events9) Start, wait and stop tracing.
After 9) verify on the trace node that trace files are notbigger than 262144 bytes Pass
17.6 Buffer Type - toggle UST/kernel
1) Create and select session and click right mouse button2) Select menu item 'Enable Channel...'3) Select UST4) Select Kernel5) Slect cancel
Verify after 2 and 4 that the radio buttons for the buffertype is disabled and the buffer type "Global sharedbuffers" is selected which is the value for the kerneltracer.Verify after 3) that the radio buttons are enabled an nobuffer type is selected Pass
17.7 Default UST Buffer Type
1) Create and select session and click right mouse button2) Select menu item 'Enable Channel...'3) Select UST4) Enter Channel Name5) Select 'Ok'
Verify after 5) that the default buffer type is configuredfor that channel (see properties view). Note for LTTngTools 2.2 the default is per-PID and for LTTng Tools 2.3and later it is per-UID Pass
17.8 per PID UST Buffer Type
Prequisite: Multiple UST Applications need to run1) Create and select session and click right mouse button2) Select menu item 'Enable Channel...'3) Select UST4) Select 'Per PID buffers'5) Enter Channel Name6) Select 'Ok'8) Enable all ust events9) Start, wait and stop tracing.10) Import trace
Verify after 6) that the per-pid buffer type is configuredfor that channel (see properties view). After 10) makesure that for each UST application one trace is created Pass
17.9 per UID UST Buffer Type
Prequisite: Multiple UST Applications need to run1) Create and select session and click right mouse button2) Select menu item 'Enable Channel...'3) Select UST4) Select 'Per UID buffers'5) Enter Channel Name6) Select 'Ok'8) Enable all ust events9) Start, wait and stop tracing.10) Import trace
Verify after 6) that the per-pid buffer type is configuredfor that channel (see properties view). After 10) makesure that only one trace is created even multiple USTapplications are running. Pass
18Snapshot Channel (LTTng 2.3features)Preparation Connect to a node with LTTng 2.3 installed
18.1 Create Snapshot Session
1) Click right mouse button on 'Sessions'2) Select 'Create Session...' in the context sensitive menu3) Enter session name 'MySession', keep 'Session Path' empty4) Select checkbox 'Snapshot Mode'5) Select 'Ok'
Verify that new session is added under the Session treenode. Verify properties in Properties view (by selectingthe session in the Control view):'Session name' (=MySession)'Snaphshot ID' (=1)'Snapshot Name' (=snapshot-1)'Session Path' (=/home/<user>/traces/MySession_<dateand time>) and 'State' (=INACTIVE)
Make sure that the button and menu item 'RecordSnapshot' is disabled Pass
18.2 Enable Kernel Event Enable all Kernel Tracepoint and syscall events Verify that channel and events a successful enabled Pass
18.3 Start Sessiona) Select session and click on button 'Start'b) Redo test with context sensitive menu item 'Start'
Verify that Session icon changes to 'ACTIVE' icon. Verifythat property view shows 'ACTIVE' for the session state
Make sure that the button and menu item 'RecordSnapshot' is enabled. Also make sure that the Buttonand menu item 'Import' is enabled. Pass
18.4 Record snapshot
select session and record 2 snapshots: Once with button'Record Snapshot' and once with context-sensitive menu item'Record Snapshot' Commands succeed without error Pass
18.5 Create another snapshot session session name ustSession (as described in 18.1) Make sure that snapshot session is created successfully Pass
18.6 Enable UST Events Enable all UST events Verify that channel and events a successful enabled Pass
18.7 Start UST session see 18.3 see 18.3 Pass
While doing this I found a few bugs but it ended up working. See https://bugs.eclipse.org/bugs/show_bug.cgi?id=469425 and https://bugs.eclipse.org/bugs/show_bug.cgi?id=469424
18.8 Record snapshot over multiple sessionsSelect kernel and ust session (see 18.1 and 18.5) and click on'Record snapshot' button Command succeeds without error Pass
18.9 Import traces Open Import dialog (see 11.2)
Verify that 4 snapshots are available (3 kernel and 1UST). Verify that all snapshots are imported to theselected tracing project Pass
18.10 Stop and destroy sessions Stop and destroy both sessions Verify that sessions are destroy successfully Pass
18.11 Network snapshot session
1) Start relayd on Eclipse local machine (default settings: lttng-relayd)2) Open Create Session Dialog box, select 'SnapshotMode'and select "Advanced >>>"3) Enter session name, select net protocol and enter IPaddress of Eclipse local machine in address field and press ok4) Enable events (UST and Kernel), start tracing, and recoreda few snapshots, stop tracing5) Import traces to a existing tracing project6) Destroy session
Make sure that all steps were successfull. Also, importthe traces using the standard import instead of theremote import Pass
lttng-consumerd crashed after a couple of snapshots buteverything worked on Trace Compass side
19 Command Script
19.1 Execute command sriptCreate a command script to create a session with kernel andust events enabled.
Make sure that each command of script is executed andscript execution is without errors Pass
Section Pass Fail To Do Comment
GDB Tracing 26 0 0 1
Target: Ubuntu 15.04 64 bit
Step Test Case Action Verification Comment
1 Preparation
1.1 Step 1 Open and reset the GDB Trace perspective GDB Trace perspective opens with correct views Pass
1.2 Step 2 Open Navigator View (used for independent verification) Navigator View opens Pass
2 Project Creation
2.1 New Project Wizard Open New Tracing Project Wizard Tracing Project Wizard opens Pass
2.2 Create project Specify a project name and finish Tracing project appears in Project Explorer Pass
2.3 Project structure Close and open the new Tracing project Project contains the Traces folder Pass
3 Traces Folder
3.1 Traces Folder menu Select the Traces folder and open its context menu Correct menu opens (Open Trace, Import, New Folder, …) Pass
3.3 Import traces Select a GDB Trace from samples directory and finish Imported traces appear in Folders with proper icon Pass
4 Trace Configuration
4.1 Project/executable selection Double-click on an un-configured traceVerify that an Error Dialog opens that notfiies the user to selectthe trace executable Pass
4.2 Select Trace Executable
1) Right mouse click on trace2) Select menu item "Select Trace Executable"3) Fill in the proper values in dialog and finish Trace is configured (4.3 is successful, when 4.2 was successful) Pass
4.3 Open configured trace Double-click on a configured trace Trace is opened, events table and views are populated Pass
5 Source Code Lookup
5.1 Select event With mouse select an event in events tableThe corresponding source code location is selected in the sourcecode file. Pass
5.2 Select another event redo 5.1The corresponding source code location is selected in the sourcecode file. Pass
6 Events Table Navigation
6.1 Arrow keys Update the current event using up/down keys within windowEach keystroke modifies the selected event and the correspondingsource code location is selected in the source code file. Pass
6.2 Scrolling Update the current event using up/down keys outside windo
Table is refreshed to display new current event and thecorresponding source code location is selected in the source codefile Pass
6.3 PgUp/PgDn Update the current event using PgUp/PgDn keys Table is scrolled accordingly Pass
6.4 Home/End Update the current event using Home/End keysTable jumps from first to last event and the corresponding sourcecode location is selected in the source code file Pass
7 Events Searching & Filtering
7.1 Search In the search bar, enter some RE Events corresponding to the RE are highlighted Pass
7.2 Navigation Navigate through highlighted events using Enter/Shift-Enter Next/previous highlighted event selected accordingly Pass
7.3 Un-search In the search bar, clear the RE Events are displayed normally Pass
7.4 Filter In the filter bar, enter some RE Only events matching RE are displayed Pass
7.5 Un-filter Ithe filter bar, clear the RE Events are displayed normally Pass
7.6 Filter & Search In the filter bar, enter some RE; likewise in the search bar Events are filtered and highlighted accordingly Pass
7.7 Search & Filter In the search bar, enter some RE; likewise in the filter bar Events are filtered and highlighted accordingly Pass
8 Events Synchronization
8.1 Synch from Events View Click on an event in the Events View Trace Control View is updated; Debug View is updated Pass
8.2 Synch from Trace Control Go up/down from the Trace Control View Events View is updated accordingly Pass
Color issues on GTK3, https://bugs.eclipse.org/bugs/show_bug.cgi?id=467933
Section Pass Fail To Do Comment
Tracing RCP 32 0 0 1
Target: Ubuntu 15.04
Step Test Case Action Verification Comment
1 Start RCP
1.1 Start Tracing RCP Open RCP from command line or file explorer Tracing RCP opens in default perspective Pass
1.2Start Tracing RCP with texttrace
Open RCP from command line with --open <trace name withabsolut path> Trace will be opened with auto-detected trace type Pass
1.3Start Tracing RCP withpreviously opened text trace
Open RCP from command line with --open <trace name withabsolut path>. Use same trace than 1.2
Verify that the same trace that was previously linked into theTraces folder is opened and not a new trace entry is created Pass
1.4Start Tracing RCP with KernelCTF trace
Open RCP from command line with --open <kernel tracename with absolut path>
Tracing RCP is opened, the trace is linked to the Tracing project,the kernel analysis trace type is selected and trace is opened. Pass
The kernel trace opens in an editor but the editor of the first tracegets activated. Bug 443461.
1.5
Start Tracing RCP withpreviously opened Kernel CTFtrace
Open RCP from command line with --open <kernel tracename with absolut path>. Use same trace than 1.4
Verify that the same trace that was previously linked into theTraces folder is opened and not a new trace entry is created Pass
1.6Start Tracing RCP with newtrace with name conflict
Open RCP from command line with --open <trace name withabsolut path>, where the name of trace is the same than 1.2,but the trace is located at a different location on disk
Verify that a new trace is linked to the Tracing project and trace isopened. Verify that the new trace name has a integer number asuffix added. Pass
1.7 Re-do 1.6
Open RCP from command line with --open <kernel trace withabsolut path>, where name of trace is the same than 1.4, butthe trace is located at a different location on disk
Verify that a kernel trace is linked to the Tracing project, thekernel analysis trace type is selected and trace is opened. Verifythat the new trace name has a integer number a suffix added. Pass
1.8Start Tracing RCP with non-trace file Open file that is not a trace Trace is imported (linked) however default icon (from Eclipse) is set Pass
2 File menu
2.1 Open Trace (File)Use Menu "File -> Open Trace …" In the file dialog select atext trace and select open. Trace will be opened with auto-detected trace type Pass
2.2Open Trace (File) withpreviously opened text trace
Use Menu "File -> Open Trace…". In the file dialog select atext trace and select open. Use same trace than 2.1
Verify that the same trace that was previously linked into theTraces folder is opened and not a new trace entry is created Pass
2.3 Open Trace (Directory)Use "Menu File -> Open Trace …" . In the file dialog select afile of Kernel CTF trace directory and select open.
Verify that the trace is linked to the Tracing project, the kernelanalysis trace type is selected and trace is opened. Pass
2.4
Open Trace (Directory) withpreviously opened Kernel CTFtrace
Use "Menu File -> Open Trace …" . In the file dialog select afile of Kernel CTF trace directory and select open. Use sametrace than 2.3
Verify that the same trace that was previously linked into theTraces folder is opened and not a new trace entry is created Pass
2.5Open Trace File with nameconflict
Use Menu "File -> Open Trace …" In the file dialog select atext trace and select open, where the name of trace is thesame than 2.1, but the trace is located at a different locationon disk
Verify that the new trace is linked to the Tracing project and thetrace is opened. Verify that the new trace name has a integernumber a suffix added. Pass
2.6 Re-do 2.5
Use "Menu File -> Open Trace …" . In the file dialog select afile of Kernel CTF trace directory and select open, where thename of trace is the same than 2.3, but the trace is located ata different location on disk
Verify that the kernel trace is linked to the Tracing project, thekernel analysis trace type is selected and trace is opened. Verifythat the new trace name has a integer number a suffix added. Pass
2.7 Open file Open file that is not a trace Trace is imported (linked) however default icon (from Eclipse) is set Pass
2.8 Restart Use Menu File -> RestartVerify that RCP is restarted with the previously open perspectiveand trace Pass
2.9 Exit Use Menu File -> Exit Tracing RCP exits Pass
3 Window Menu
3.1 Open PerspectiveUse Menu Window -> Show Perspective -> TracingPerspective Tracing perspective is opened Pass
3.2 Open ViewUse Menu Window -> Show View -> Select Tracing ->Sequence Diagram Sequence diagram view is shown Pass
3.3 Preferences Use Menu -> Preferences Preferences dialog is shown Pass
3.4 Save Perspective As
Make changes of perspective by moving views and use menuWindow -> Save Perspective As. Enter a perspective nameand select Ok Perspective with new name is stored Pass
3.5 Reset PerspectiveMake changes of perspective by moving views and use menuWindow -> Reset Perspective.
After confirming the reset operation the perspective is reset to thedefault layout. Pass
4 Help Menu
4.1 Help Contents Use Menu -> Help -> Help ContentsHelp content browser is opened. All Tracing related help isincluded Pass
4.2 Help Contents (shortcut) Use key F1Help content browser is opened. All Tracing related help isincluded Pass
4.2 Install new SoftwareUse Menu -> Help -> Install New Software… to install newEclipse feature Installation is successful Pass
4.4 About Use Menu -> Help -> AboutAbout dialog is opened all relevent information (e.g. version,copyright years etc) is up-to-date and correct. Pass
4.5 Version + Copyright Use Menu -> Help -> About -> Installation detailsGo over all tracing features and plug-ins and verify that all have thecorrect version and copyright years Pass
5 Content
5.1 TMF presence Open Tracing perspective Tracing perspective opens Pass
6.1Upgrade from previousrelease Use Help -> Check For Updates RCP is upgraded Pass
Section Pass Fail To Do CommentLTTng 2.0 - MemoryAnalysis 16 4 0 6
Target:
Step Test Case Action Verification Comment
0 Prerequisites
0.1 Download traces
Download UST trace with memory eventsfromhttp://secretaire.dorsal.polymtl.ca/~gbastien/traces/eclipse_mem_ust.tar.gz
0.2Import trace with memoryevent
Import the LTTng UST trace downloadedabove in Tracing project
0.3Import trace withoutmemory event
Import one of the LTTng UST trace thatdoes not contain the memory events, forexample, the one used for the callstackview
0.4 Import non-UST trace Import one LTTng Kernel trace
1 Project View
1.1Check analysis canexecute
In the project explorer, expand the tracethat contains the memory events "Ust Memory" analysis is present and "normal" Pass
1.2Verify help message whenapplicable
In the project explorer, open and expandthe trace that contains the memory events,right-click the memory analysis and selectHelp
A generic help message appears with the name of theanalysis. Pass
1.3Check analysis cannotexecute
In the project explorer, expand the USTtrace that does not contain memory events "Ust Memory" analysis is present, but striked-out Pass
1.4Verify help message whennot applicable
In the project explorer, open and expandthe UST trace that does not containmemory events, right-click the memoryanalysis and select Help
The help message mentions the analysis is impossible toexecute and contains the requirement that is not fulfilled Pass
1.5Check analysis for anothertrace type
In the project explorer, expand a LTTngKernel trace "Ust Memory" analysis is not present Pass
2 View Management
2.1 Populate analysis's view
Open the UST trace with memory eventsand expand the "UST Memory" analysis inthe project explorer "Ust Memory Usage" View appears under the analysis Pass
2.2 Open viewDouble-click the UST Memory View underthe memory analysis
The UST Memory Usage view opens and triggers the memoryanalysis. After the analysis, the XY chart is populated Pass
2.3 Close trace Close the trace The UST Memory Usage view is emptied. Fail
Axises need to be clearedhttps://bugs.eclipse.org/bugs/show_bug.cgi?id=469644
2.4 Open traceWith the view already opened, open thetrace The UST Memory Usage view is populated. Pass
2.5 Close view Close the UST Memory Usage view The view is closed. Pass
2.6 Re-open view
Double-click the UST Memory Usage viewunder the memory analysis in projectexplorer. The view opens and is automatically populated. Pass
3 Mouse handling
3.1 Drag move time rangeDrag move xy chart left and right withmiddle button
Time range is dragged. When mouse button is released, theview refreshes with the new time range Pass But while dragging, nothing visible happen
3.2Zoom time range (mousewheel)
Zoom with mouse wheel up and down,cursor inside xy chart
Time range is zoomed in and out, relative to mouse cursor.When mouse wheel is stopped for a short time, series areupdated and new time range is propagated to other views. Pass
3.3 Drag select time range Drag select time graph with right button
Selection highlighted. When mouse button is released, timerange is zoomed to selection, series are updated and new timerange is propagated to other views. Pass
3.4 Mouse hover Hover mouse in xy chart anywhere Tool tip shows values for each thread at the given timestamp Pass
3.5 Drag mouse selection Drag select xy chart with left button
Selection highlighted. Status bar of Eclipse is updated withtime information: T, T1, T2 and delta, where T is the time of themouse position, T1 the left most selected time, T2 the rightmost selected time and delta the time difference between T2-T1 Fail Status bar is not updated
3.6 Shift key selection
Click select with left button (begin time),press shift key and click select another time(end time)
Selection highlighted. Status bar of Eclipse is updated withtime information: T, T1, T2 and delta, where T is the time of themouse position, T1 the left most selected time, T2 the rightmost selected time and delta the time difference between T2-T1 Fail
Second click-select just select the timestamp,no range
4 Synchronization
PreparationHave the Histogram and UST MemoryUsage views both visible
4.1 Time synchronization Select a random time in another viewSelected time line is updated. If selected time is outside currentrange, time range is updated to include it. Pass Clicking outside range does not work
4.2 Time range synchronizationSelect a new time range in UST MemoryUsage view or in Histogram view. Time range is updated. Pass
4.3Time range selectionsynchronisation
In any other view that supports rangesynchronization, select a new range.
Selection is highlighted. If begin time (T1) of selected timerange is outside the current range, then time range isupdated to include it Fail View does not include T1 outside current range
In the project explorer, expand a LTTngKernel trace "CPU usage" analysis is present and "normal" Pass
1.2Verify help message whenapplicable
In the project explorer, open and expand theLTTng kernel trace, right-click the CPU usageanalysis and select Help
A generic help message appears with the name of theanalysis Pass
1.5Check analysis for anothertrace type
In the project explorer, expand a non-LTTngKernel trace "CPU usage" analysis is not present Pass
2 View Management
2.1 Populate analysis's viewOpen an LTTng kernel trace and expand the"CPU usage" analysis in the project explorer "CPU Usage" View appears under the analysis Pass
2.2 Open viewDouble-click the CPU usage View under theCPU usage analysis
The CPU usage Usage view opens and triggers the cpuanalysis. After the analysis, both tree viewer and xy chartsare populated. Pass
2.3 Close trace Close the trace The CPU Usage view is emptied. Fail
axises need to be resethttps://bugs.eclipse.org/bugs/show_bug.cgi?id=469644
2.4 Open trace With the view already opened, open the trace The CPU Usage view is populated. Pass
2.5 Close view Close the CPU Usage view The view is closed. Pass
2.6 Re-open viewDouble-click the CPU Usage view under theCPU usage analysis in project explorer. The view opens and is automatically populated. Pass
3 View selection
3.1 Select an entry Select an entry in the tree viewer sectionA new series is added to the xy chart, corresponding to theselected TID Pass
3.2 Select another entry Select another entry from the tree viewerA new series is added to the xy chart, and the previous TID'sseries is not displayed anymore Pass
4 Mouse handling
4.1 Drag move time rangeDrag move xy chart left and right with middlebutton
Time range is dragged. When mouse button is released,series are updated and new time range is propagated toother views. Pass But while dragging, nothing visible happens
4.2Zoom time range (mousewheel)
Zoom with mouse wheel up and down, cursorinside xy chart
Time range is zoomed in and out, relative to mouse cursor.When mouse wheel is stopped for a short time, series areupdated and new time range is propagated to other views,including the tree viewer beside the chart. The selectedprocess remains the same. Pass
4.3 Mouse vertical scrollScroll with mouse wheel up and down, cursoroutside xy chart
Table scroll up and down. Selected process does notchange. Vertical scroll bar updated. Pass
4.4 Vertical scroll bar Click and drag vertical scroll barTree viewer scrolls up and down. Selected process does notchange. Pass
4.5 Drag select time rangeDrag select time graph with right button in xychart
Selection highlighted. When mouse button is released, timerange is zoomed to selection, series are updated and newtime range is propagated to other views. Selected processremains the same. Pass
4.6 Mouse hover Hover mouse in xy chart region anywhereTool tip shows the total and selected process (if any) cpuusage at the time Pass It would be nice to display the process name i
4.7 Drag mouse selection Drag select xy chart with left button
Selection highlighted. Status bar of Eclipse is updated withtime information: T, T1, T2 and delta, where T is the time ofthe mouse position, T1 the left most selected time, T2 theright most selected time and delta the time differencebetween T2-T1 Fail Status bar is not updated
4.8 Shift key selection
Click select with left button (begin time), pressshift key and click select another time (endtime)
Selection highlighted. Status bar of Eclipse is updated withtime information: T, T1, T2 and delta, where T is the time ofthe mouse position, T1 the left most selected time, T2 theright most selected time and delta the time differencebetween T2-T1 Fail
It would also be nice to crop the percentage
Shift key does not work in xy chart and status bar not updated
4.9 Sort columns Click on column headers once then twiceEntries are sorted in ascending then descending order onthe column value. Selected process does not change. Pass
5 Keyboard handling
5.1Keyboard navigation in treeviewer
With focus on table, use UP, DOWN, HOME,END keys
Selected process is changed. xy chart selection is updated.Vertical scroll bar updated. Pass
6 Synchronization
6.1 Time synchronization Select a random time in another viewSelected time line is updated. If selected time is outsidecurrent range, time range is updated to include it. Pass
No update if selected time outside currentrange
6.2 Time range synchronizationSelect a new time range in CPU usage view orin Histogram view. Time range is updated. Pass
6.3Time range selectionsynchronisation
In any other view that supports rangesynchronization, select a new range.
Selection is highlighted. If begin time (T1) of selected timerange is outside the current range, then time range isupdated to include it Pass
xy chart range does not include T1 ousidecurrent range
CPU usage works withexperiments Fail
Section Pass Fail To Do Comment
Trace Synchronization 12 1 0 2
Target:
Step Test Case Action Verification Comment
0 Prerequisites
0.1 Import tracesImport the scp_dest and scp_src traces in thesynctraces.tar.gz file
0.2 Create experiment 1 Create an experiment containing those 2 traces0.3 Create experiment 2 Create an experiment with any other trace1 View Management
1.1Open SynchronizationView
Use menu Window → Show View → Other … →Tracing → Synchronization Verify that 'Synchronization' view is shown Pass This view should be in properties
1.2 Delete view Close the Synchronization View Synchronization' view is removed from perspective Pass The view also makes no sense to mere mortals.
1.3 Open viewUse menu Window → Show View → Other … →Tracing → Synchronization Synchronization' view is displayed and remains empty Pass
1.4 Open ExperimentOpen the experiment containing the 2synchronizable traces Verify that the view is still empty Pass
1.5 Synchronize experimentRight-click on the experiment and select'Synchronize experiment'
After a time, the view is populated with synchronizationresult that say 'accurate'. And one of the original traceshas been replace by a trace with the same name, butwith an '_' at the end. Pass
1.6Open view when trace isalready loaded
1) Close Synchronization View2) Load LTTng experiment3) Open 'Synchronization' view
Verify that view is populated with synchronization datafrom currently opened experiment Pass
1.6.5Synchronize experimentwith constant offset Try to offset a trace by a second
Visually verify that a synchronized trace is nowoffsetted Pass
1.7 Open trace Open an Lttng Kernel trace Synchronization view is empty Pass
1.8 Re-open experimentOpen the experiment containing the 2synchronized traces View shows synchronization data from the experiment Pass
1.9 Restart Restart EclipseVerify that view is populated with synchronization datafrom experiment Pass
2 Functionnalities
2.1 Open experiment 2Open the experiment containing traces that do notsynchronize Verify that the 'Synchronization' view is empty Pass
2.2Go back to previousexperiment
Re-open the experiment with the synchronizabletraces
Verify that the 'Synchronization' view contains the datafrom the experiment Pass
2.3 Synchronize experimentRight-click on the experiment and select'Synchronize traces'
After a time, the view is populated and thesynchronization quality says 'Absent' Fail Absent is not displayed
Section Pass Fail To Do CommentXML analysis 37 2 0 4
Download the test XML file here:http://secretaire.dorsal.polymtl.ca/~gbastien/Xml4Traces/Kernel.Linux.xml
0.3Make sure the XML file doesnot exists in the project
The XML files are located in <workspacedirectory>/.metadata/.plugins/org.eclipse.tracecompass.tmf.analysis.xml.core/xml_files. Delete the linuxkernel XML file if it exists.
1 XML file import
1.1 Verify analysis not presentIn the project Explorer, expand any LTTng kerneltrace Verify that there is no 'Xml kernel State System' analysis Pass
1.2 Import XML fileRight-click the Traces folder, select Import XMLanalysis and select the Kernel.Linux.xml file
Verify that the 'Xml kernel State System' analysis is now presentunder a LTTng kernel trace Pass
2 View management
2.1 Populate the views Open an LTTng kernel trace
The 'Xml kernel State System' analysis should have a + next toit, expand it and there should be 2 views under it: 'Xml ControlFlow View' and 'Xml Resources View' Pass
2.2Open the 'Xml Control FlowView'
Double-click the 'Xml Control Flow View' under theanalysis
A view titled 'Xml Control Flow View' should open and itshould look quite similar to the Control Flow View Fail
2.3 Open another XML viewDouble-click the 'Xml Resources View' under theanalysis
The new view replaces the 'Xml Control Flow View' and thetitle changes to 'Xml Resources View'. This view is quite similarto the Resources view's CPU entries. Pass
After opening the resources view and goingback to the Control Flow view the legendshows an extra entry (for value 4). This isdue to a concorrency bug.
2.4 Close view Close the XML view The view is closed Pass
2.5Open view when trace isalready loaded Double-click one of the views under the analysis The view opens with the correct title and is correctly populated. Pass
2.6 Close traces Close all opened traces The view is emptied. Pass2.7 Open trace Open an LTTng Kernel trace The view is populated Pass2.8 Open another trace Open a non-LTTng Kernel trace The view is emptied. Pass2.9 Open LTTng Kernel trace Open an LTTng Kernel trace The view is populated. Pass3 View selection
3.1 Select an entry in the table Select an entry in the table Same entry is highlighted in time graph. Pass
3.1 Select entry in time graph Select an entry in the time graph (empty region)Same entry is highlighted in table. Selected time line is updated.Other views are synchronized to selected time. Pass
2.3 Select state in time graph Select a state in the time graph
Same entry is highlighted in table. State is highlighted in timegraph. Selected time line is updated. Other views aresynchronized to selected time. Pass
4 Mouse handling
4.1 Drag move time rangeDrag move time graph left and right with middlebutton
Time range is dragged. When mouse button is released, statesare updated and new time range is propagated to other views. Pass
4.2Zoom time range (mousewheel)
Zoom with mouse wheel up and down, cursor insidetime graph
Time range is zoomed in and out, relative to mouse cursor.When mouse wheel is stopped for a short time, states areupdated and new time range is propagated to other views. Pass
4.3Zoom time range (mousedrag) Drag in time graph scale left and right with left button
Time range is zoomed in and out. When mouse button isreleased, states are updated and new time range is propagated toother views. Pass
there are entries such as Unknown display quark for xxxx
4.4 Mouse vertical scrollScroll with mouse wheel up and down, cursor outsidetime graph
Table and time graph scroll up and down and remain aligned.Selected entry does not change. Vertical scroll bar updated. Pass
4.5 Vertical scroll bar Click and drag vertical scroll barTable and time graph scroll up and down and remain aligned.Selected entry does not change. Pass
4.6 Drag select time range Drag select time graph with right button
Selection highlighted. When mouse button is released, timerange is zoomed to selection, states are updated and new timerange is propagated to other views. Pass
4.7 Double-click reset time range Double-click left button on time scaleTime range is reset to full range, states are updated and newtime range is propagated to other views. Pass
4.8 Mouse hover (empty region) Hover mouse in time graph over empty region Tool tip shows entry name only. Pass
4.9 Mouse hover (state) Hover mouse in time graph over stateTool tip shows entry name, state name, date, start time, endtime, duration. Pass
4.10 Drag mouse seleection Drag select time graph with left button
Selection highlighted. Status bar of Eclipse is updated with timeinformation: T, T1, T2 and delta, where T is the time of themouse position, T1 the left most selected time, T2 the right mostselected time and delta the time difference between T2-T1 Pass
4.11 Shift key selectionClick select with left button (begin time), press shiftkey and click select another time (end time)
Selection highlighted. Status bar of Eclipse is updated with timeinformation: T, T1, T2 and delta, where T is the time of themouse position, T1 the left most selected time, T2 the right mostselected time and delta the time difference between T2-T1 Pass
5 Keyboard handling
5.1Keyboard navigation in table(entry selection)
With focus on table, use UP, DOWN, HOME, ENDkeys
Selected process is changed. Time graph selection is updated.Vertical scroll bar updated. Pass
5.2Keyboard navigation in table(tree expansion)
With focus on table,in Windows use LEFT, RIGHT keys while parent orchild process is selected
in Linux use SHIFT LEFT, RIGHT keys while parentor child process is selected
For parent process, tree is expanded or collapsed. Time graphitem expansion is updated. Vertical scroll bar updated. For childprocess, left changes selection to parent, time graph selection isupdated. Vertical scroll bar updated. Pass
5.4Keyboard navigation in timegraph (process selection)
With focus on time graph, use UP, DOWN, HOME,END keys
Selected process is changed. Table selection is updated. Verticalscroll bar updated. Pass
5.4Keyboard navigation in timegraph (state selection) With focus on time graph, use LEFT, RIGHT keys
Previous or next state is selected. Selected time is updated inother views. Pass
6 Tool bar handling
6.1 Show Legend Click Show Legend button The legend dialog is opened and can be closed. Fail Not all displayed colors are in the legend
6.2 Reset Time Scale Click Reset Time Scale buttonTime range is reset to full range, states are updated and newtime range is propagated to other views. Pass
6.3 Select Previous/Next Event Click Previous/Next Event buttonPrevious or next state is selected. Selected time is updated inother views. Pass
6.4 Select Previous/Next Process Click Previous/Next Process buttonSelected process is changed in table and time graph. Verticalscroll bar updated. Pass
6.5 Zoom In/Out Click Zoom In/Out button
Time range is zoomed in and out, relative to center of timerange. States are updated and new time range is propagated toother views. Pass
6.6 Filter Dialog Open Filter Dialog Verify that all buttons are working correctly Pass More filter buttons are available in cfv
6.7 Filter Processes
1) Open Filter Dialog2) Deselect several processes3) Press Ok Verify that only selected entries are displayed in the view Pass
7 Synchronization
7.1 Time synchronization Select a random time in another viewSelected time line is updated. If selected time is outside currentrange, time range is updated to include it. Pass
7.2 Time range synchronizationSelect a new time range in Resources view or inHistogram view. Time range is updated. Pass
7.3Time range selectionsynchronisation
In any other view that supports range synchronization,select a new range.
Selection is highlighted. If begin time (T1) of selected timerange is outside the current range, then time range is updated toinclude it Pass With T1 outside current range, the time range is not updated to include it.
Section Pass Fail To Do Comment
Network Trace analysis 11 0 0 0
Target:
Step Test Case Action Verification Comment
0 Prerequisites
0.1 Import traces Import the trace linked here1 Trace Import
1.1Open the Network Tracingperspective
In the project Explorer, expand any LTTngkernel trace
Verify that the events view, the properties andstream list are displayed Pass
1.2 Open trace Double-click on the "TeamSpeak2.pcap" trace
The trace is given a "network" icon. Whenopenned, the events view and histogram view isopened Pass
2 View management
2.1 Populate the views Open the "TeamSpeak2.pcap" The views are updated Pass
2.2 Look up stream Open the Stream listOne stream is available with endpoint A beingfe:ff:ff:ff:ff:ff Pass
2.3 Close the trace The stream list is emptied Pass
2.4 Close view Close the view The view is closed Pass
2.5Open view when trace isalready loaded Re-open the trace. Open The Stream List
The view opens with the correct title and iscorrectly populated. Pass
2.6 Open a non pcap trace The stream list is emptied Pass
3 Stream List
3.1 Re-open trace Ensure only "TeamSpeak2.pcap" is opened The trace is opened Pass
3.1Create a filter from thestream list Right click on stream 0, and select "create filter"
A filter named "FILTER stream eth 00:0c:29..." iscreated Pass
3.2 Apply filterIn the events table, right click on an event andselect "Apply preset filter->00:0c:29..." 24/24 events pass the filter Pass
Sequence Diagram 5.23[TMF] Sequence Diagram Overview featurenot working well on recent platform versions https://bugs.eclipse.org/bugs/show_bug.cgi?id=436442 Open
[TMF] Time range selection outside currentrange should update current range in timegraph views https://bugs.eclipse.org/bugs/show_bug.cgi?id=436855 Open
RCP 1.4[lttng rcp] Opening a second trace with --openactivates the wrong editor https://bugs.eclipse.org/bugs/show_bug.cgi?id=443461 Open
Project View 6.5[TMF] Original experiment reappears afterrename and copy https://bugs.eclipse.org/bugs/show_bug.cgi?id=436888 Open
Sequence Diagram 3.1Sequence diagram interaction tooltip is hardto read on Ubuntu https://bugs.eclipse.org/bugs/show_bug.cgi?id=455523 Open
Sequence Diagram 5.24Button gets disabled in print dialog ofsequence diagram after clicking on it https://bugs.eclipse.org/bugs/show_bug.cgi?id=455546 Open
Time Chart 5.6Bookmark is not removed right away, onlywhen the view is refreshed. https://bugs.eclipse.org/bugs/show_bug.cgi?id=436323 Open
Histogram View 3.7, 4.5[TMF] Selection not updated in Histogramview when using right arrow key https://bugs.eclipse.org/bugs/show_bug.cgi?id=468074 Open
GDBTracing 7.1[GTK][GTK 3.14] Search highlights are notdrawn https://bugs.eclipse.org/bugs/show_bug.cgi?id=467933 Open
Control view 17.9 NPE trying to destroy a session https://bugs.eclipse.org/bugs/show_bug.cgi?id=469424 Open
Control view 17.9SWTException widget is disposed trying toimport trace from Control view https://bugs.eclipse.org/bugs/show_bug.cgi?id=469425 Open
Remote Fetch 9.2No password prompt when connecting with aremote profile https://bugs.eclipse.org/bugs/show_bug.cgi?id=469436 Fixed
CPU Usage 2.3,Memory Analysis 2.3
Common X time axises not cleared whentrace is close https://bugs.eclipse.org/bugs/show_bug.cgi?id=469644 Open