28
Kartik Manda, David Lange, Riley Edwards, Marcus Dersch, and Ryan Kernes FRA Tie and Fastener BAA – Industry Partners Meeting Incline Village, NV 7 Oct 2013 Vertical Load Path Analysis
Kartik Manda, David Lange, Riley Edwards, Marcus Dersch, and Ryan Kernes
FRA Tie and Fastener BAA – Industry Partners Meeting
Incline Village, NV
7 Oct 2013
Vertical Load Path Analysis

Slide 2Vertical Load Path Analysis
Outline
• Objectives
• Background
• Instrumentation Overview
• Defining the vertical load path
• Understanding rail seat loads
• Fraction of vertical load
• Vertical tie deflections
• Effect on rail seat load
• Dynamic wheel loads
Slide 3Vertical Load Path Analysis
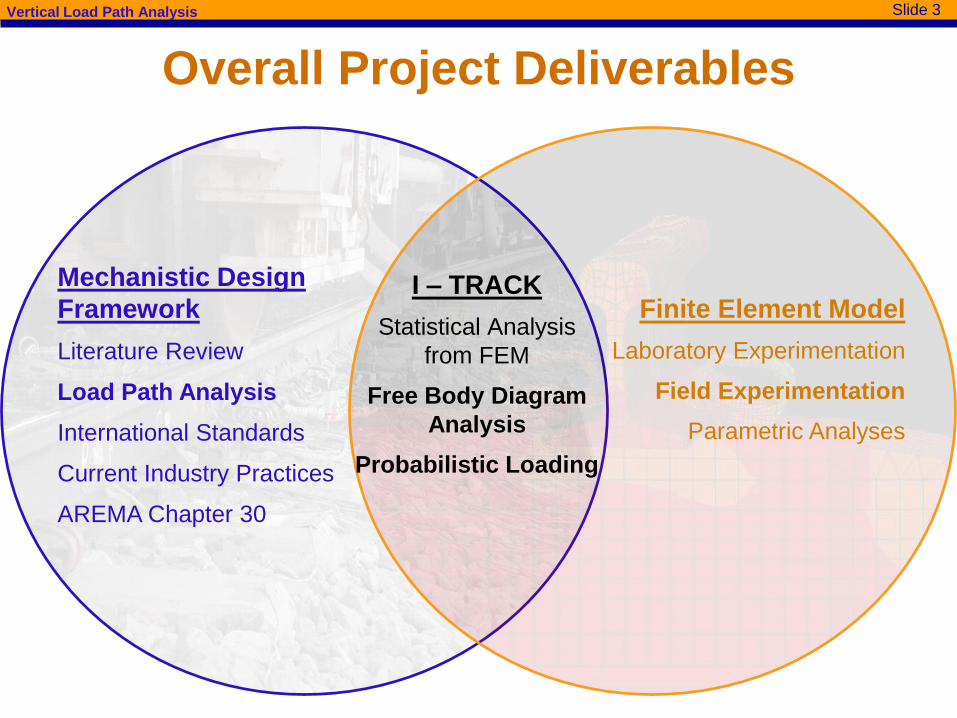
Mechanistic Design
Framework
Literature Review
Load Path Analysis
International Standards
Current Industry Practices
AREMA Chapter 30
Finite Element Model
Laboratory Experimentation
Field Experimentation
Parametric Analyses
Overall Project Deliverables
I – TRACK
Statistical Analysis
from FEM
Free Body Diagram
Analysis
Probabilistic Loading

Slide 4Vertical Load Path Analysis
Purpose of Vertical Load Path Analysis
• Identify the load path of vertical forces through the
concrete crosstie and fastening system
• Quantify the demands on each component in the
system
• Determine how crosstie support variability effects the
demands on the components within the vertical load
path
• Provide vital inputs to the development of a finite
element (FE) model and method of performing
mechanistic design of the concrete crossties and
fastening systems
• Provide insight for future field testing in revenue
service applications

Slide 5Vertical Load Path Analysis
Background Knowledge and Findings• Field experimentation and
modeling show that vertical
load is distributed over
multiple ties
• Rail seat load is of more
relevance than the wheel
load with respect to the
design of the concrete
crosstie and fastening
system
• Stiffness of each
component is critical to the
system and contributes to
overall behavior

Slide 6Vertical Load Path Analysis
July 2012 Field Instrumentation
First stage of field instrumentation conducted to capture
loads and understand the behavior of the system
Findings:
• Global tie displacements are
important to understand load
distribution
• Highest loads were imparted by
the locomotives and leading
axles of railcar trucks
Limitations:
• Comparison and validation
through FEM analysis
• Lateral load path not effectively
understood
Partially Instrumented Rail Seat
Fully Instrumented Rail Seat
MBTSS Instrumented Rail Seat

Slide 7Vertical Load Path Analysis
Field Instrumentation Locations
• TTCI (Pueblo, CO)
• High Tonnage Loop (HTL)
– Curve (2-3°)
– Safelok I Fasteners
• Railroad Test Track (RTT)
– Tangent
– Safelok I

Slide 8Vertical Load Path Analysis
Field Instrumentation Locations
• TTCI (Pueblo, CO)
• Railroad Test Track (RTT)
– Tangent
– Safelok I Fasteners

Slide 9Vertical Load Path Analysis
2 4 A B C D G H1 3 E I 5 6 7 8
9 10 11 12 P QR
S T U V W X Y Z 13 14 15 16
Rail Displacement Fixture
Rail Longitudinal Displacement/Strains
Pad Assembly Longitudinal Displacement
Insulator Longitudinal Displacement
Insulator Vertical Displacement
Steel Rods MBTSS
Embedment Gages, Vertical Circuit,
Clip Strains
Vertical Web Strains
Shoulder Beam Insert (Lateral Force)
Pad Assembly Lateral Displacement
Vertical and Lateral Circuits
F
Crosstie Surface Strains
Field Instrumentation Strategy (May 2013)

Slide 10Vertical Load Path Analysis
Vertical Tie Deflection
Vertical Load Path Instrumentation
Field Side
Slide 11Vertical Load Path Analysis
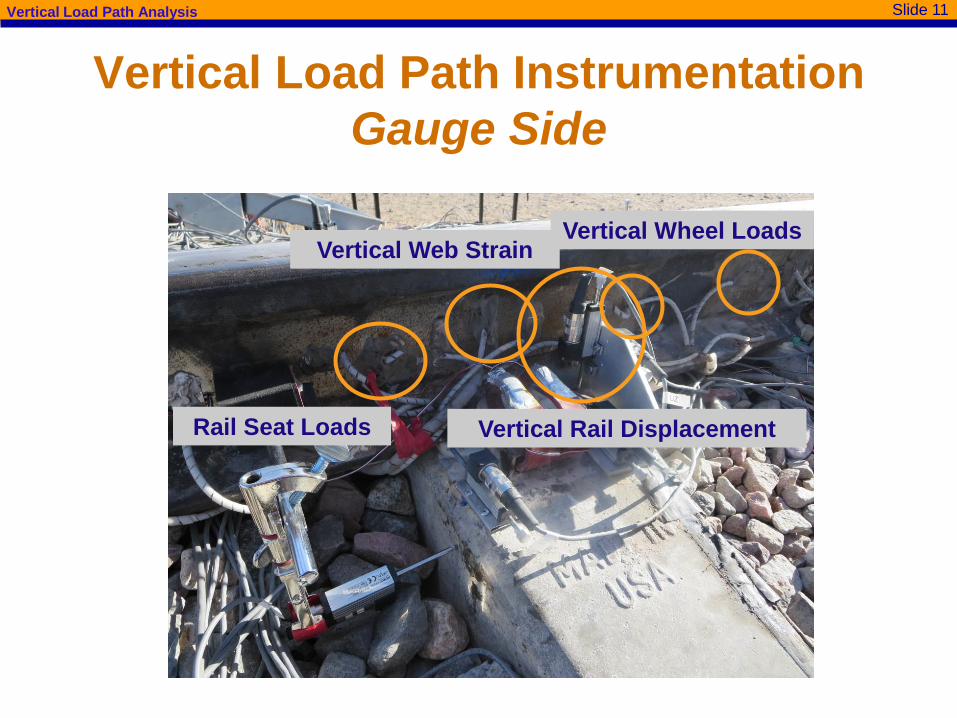
Vertical Rail Displacement
Vertical Web Strain
Rail Seat Loads
Vertical Wheel Loads
Vertical Load Path Instrumentation
Gauge Side
Slide 12Vertical Load Path Analysis
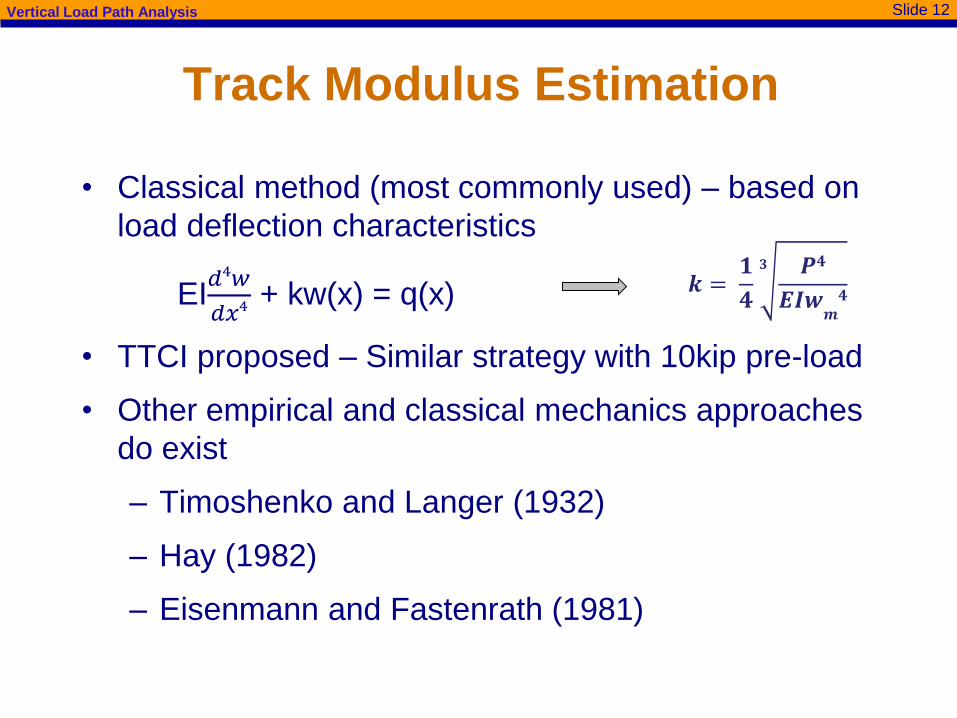
Track Modulus Estimation
• Classical method (most commonly used) – based on
load deflection characteristics
EI𝑑4𝑤
𝑑𝑥4+ kw(x) = q(x)
• TTCI proposed – Similar strategy with 10kip pre-load
• Other empirical and classical mechanics approaches
do exist
– Timoshenko and Langer (1932)
– Hay (1982)
– Eisenmann and Fastenrath (1981)
𝒌 =𝟏
𝟒
𝟑 𝑷𝟒
𝑬𝑰𝒘𝒎𝟒

Slide 13Vertical Load Path Analysis
Loading Environment
• Track Loading Vehicle (TLV)
– Static
– Dynamic
• Freight Consist
– 3, 6-axle locomotives on
HTL
– 4-axle locomotives on RTT
– 9 loaded and one empty
freight cars
• Passenger Consist
– 6-axle locomotive on HTL
– 4-axle locomotive on RTT
– 10 coaches
• FAST Train

Slide 14Vertical Load Path Analysis
Defining the Vertical Load Path

Slide 15Vertical Load Path Analysis
0
5
10
15
20
25
30
35
40
5 10 15 20 25 30 35 40
Rai
l Sea
t Lo
ad (
kip
s)
Vertical Load Applied (kips)
Load Applied
Rail Seat Load - E
Rail Seat Load - U
Rail Seat LoadsTangent Track, RTT

Slide 16Vertical Load Path Analysis
Defining the Vertical Load Path

Slide 17Vertical Load Path Analysis
Crosstie Support Variability: Vertical Crosstie Displacement
E
S U W
GC
• Curve track
• Static vertical loads
• Max applied load = 40 kips
• Low rail: soft support (slack or gap in support system)
• Modulus calculated as per classical method2,500 – 4,500 lb/in2
(except C =8500)
Low Rail
High Rail
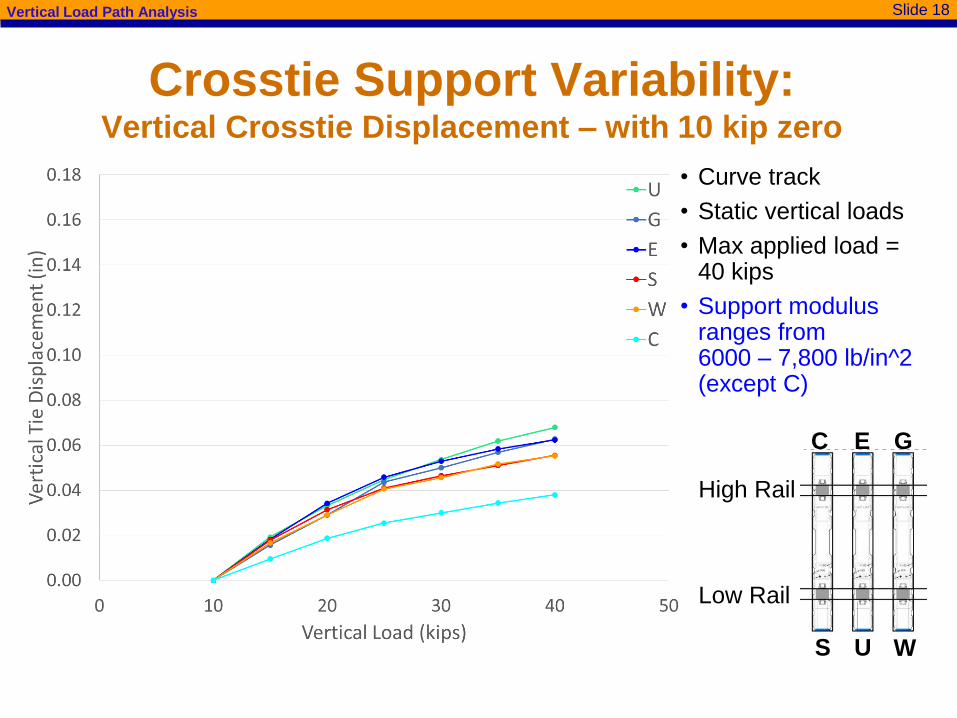
Slide 18Vertical Load Path Analysis
Crosstie Support Variability: Vertical Crosstie Displacement – with 10 kip zero
E
S U W
GC
• Curve track
• Static vertical loads
• Max applied load = 40 kips
• Support modulus ranges from 6000 – 7,800 lb/in^2 (except C)
Low Rail
High Rail

Slide 19Vertical Load Path Analysis
Rail Seat Loads and Deflection
0.00
0.02
0.04
0.06
0.08
0.10
0.12
0.14
0.16
0
5
10
15
20
25
30
35
40
5 10 15 20 25 30 35 40
Tie
Def
lect
ion
(in
.)
Rai
l Se
at L
oad
(ki
ps)
Vertical Load Applied (kips)
Load Applied
Rail Seat Load - E
Rail Seat Load - U
Tie Deflection - E
Tie Deflection - U

Slide 20Vertical Load Path Analysis
Vertical Wheel Loads - RTT
35
40
45
50
55
2 15 30 45 60 70
Ver
tica
l Lo
ad (
kip
s)
Speed (mph)
Vertical Loads on far rail (RTT, Freight)
35
40
45
50
55
2 15 30 45 60 70
Ver
tica
l Lo
ad (
kip
s)
Speed (mph)
Vertical Loads on near rail (RTT, Freight)
0
5
10
15
20
2 15 30 60 80 90 105
Ver
tica
l Lo
ad (
kip
s)
Speed (mph)
Vertical Loads on far rail (RTT, Passenger)
0
5
10
15
20
2 15 30 60 80 90 105
Ver
tica
l Lo
ad (
kip
s)
Speed (mph)
Vertical Loads on near rail (RTT, Passenger)

Slide 21Vertical Load Path Analysis
Conclusions• Observed Loads
• Dynamic wheel loads are not significantly higher
than static wheel loads
• Observed loads are similar to revenue service
loads, minus the impact loads
• Rail Seat Loads
• 30-80% of the vertical wheel load is resisted by
each
rail seat (high variability)
• Ballast stiffness plays key role
• Vertical rail seat load is independent of lateral loads
• Tie Deflection
• Tie deflections are highly affected by track stiffness
• Static deflection is considered an important system
parameter for design

Slide 22Vertical Load Path Analysis
Future Work
• Continue analysis of data to understand the governing
mechanisms of the tie and fastener system
• Continue to compare and validate the FE model
• Relate ballast stiffness to the tie deflections
• Create empirical models relating stiffness to loading
demands on each component (rail pad, rail seat, etc.)
• Investigate the influence of lateral loads on the
vertical load path
• Conduct small-scale, evaluative revenue service
testing on Class I railroads

Slide 23Vertical Load Path Analysis
Acknowledgements
• Funding for this research has been provided by the
Federal Railroad Administration (FRA)
• Industry Partnership and support has been provided by
– Union Pacific Railroad
– BNSF Railway
– National Railway Passenger Corporation (Amtrak)
– Amsted RPS / Amsted Rail, Inc.
– GIC Ingeniería y Construcción
– Hanson Professional Services, Inc.
– CXT Concrete Ties, Inc., LB Foster Company
– TTX Company
• Transportation Technology Center, Inc.
– Dave Davis, Justin Penrod
• For assistance in instrumentation preparation:
– Harold Harrison, Mike Tomas
FRA Tie and Fastener BAA
Industry Partners:
Slide 24Vertical Load Path Analysis
Kartik Manda
Graduate Research Assistant
Railroad Transportation and Engineering Center – RailTEC
email: [email protected]
Office: (217) 419-0220
Questions or Comments?

Slide 25Vertical Load Path Analysis
Appendix
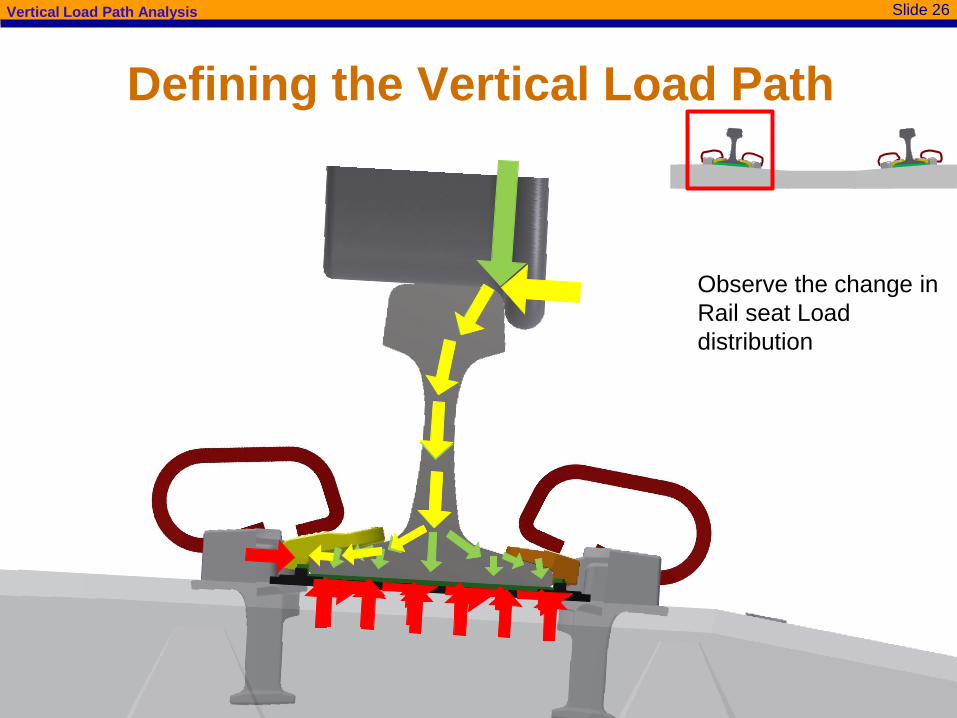
Slide 26Vertical Load Path Analysis
Defining the Vertical Load Path
Observe the change in
Rail seat Load
distribution
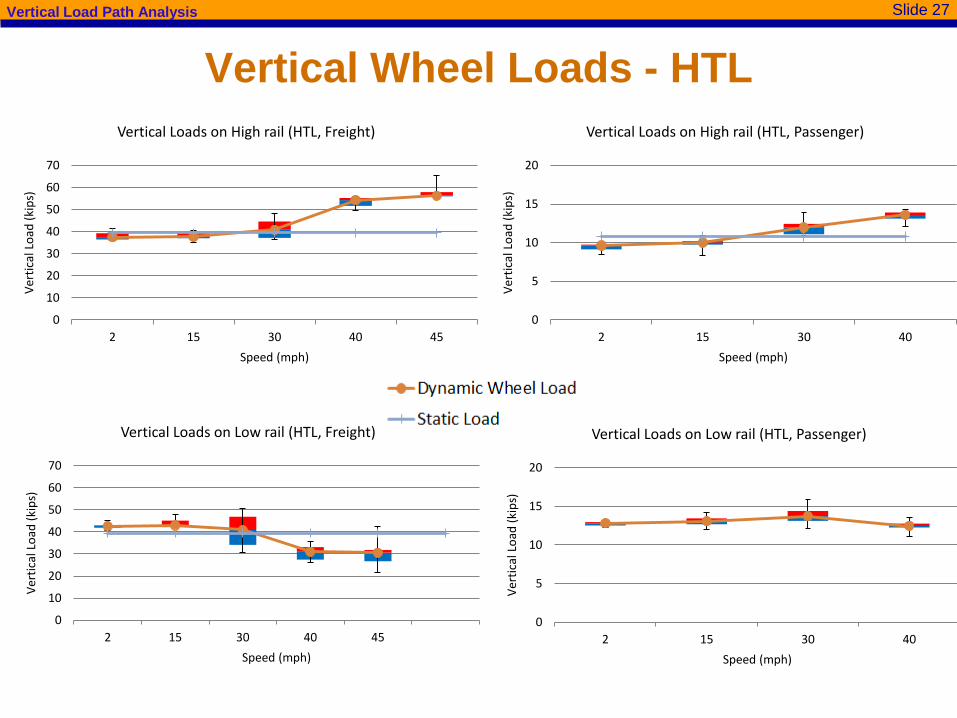
Slide 27Vertical Load Path Analysis
Vertical Wheel Loads - HTL
0
10
20
30
40
50
60
70
2 15 30 40 45
Ver
tica
l Lo
ad (
kip
s)
Speed (mph)
Vertical Loads on High rail (HTL, Freight)
0
10
20
30
40
50
60
70
2 15 30 40 45
Ver
tica
l Lo
ad (
kip
s)
Speed (mph)
Vertical Loads on Low rail (HTL, Freight)
0
5
10
15
20
2 15 30 40
Ver
tica
l Lo
ad (
kip
s)
Speed (mph)
Vertical Loads on High rail (HTL, Passenger)
0
5
10
15
20
2 15 30 40
Ver
tica
l Lo
ad (
kip
s)
Speed (mph)
Vertical Loads on Low rail (HTL, Passenger)

Slide 28Vertical Load Path Analysis
0
10
20
30
40
50
60
2 15 30 45 60 70
Rai
l Sea
t l
Load
(ki
ps)
Speed (mph)
Rail Seat Loads on near rail (RTT, Freight)
Rail Seat Load - RTT
0
10
20
30
40
50
60
2 15 30 45 60 70
Speed (mph)
0
10
20
30
40
50
60
2 15 30 45 60 70
Rai
l Sea
t Lo
ad (
kip
s)
Speed (mph)
Rail Seat Loads on far rail (RTT, Freight)
0
2
4
6
8
10
12
14
16
18
2 15 30 60 80 90 105
Rai
l Sea
t L
oad
(ki
ps)
Speed (mph)
Rail Seat Loads on far rail (RTT,Passenger)
0
2
4
6
8
10
12
14
16
18
2 15 30 60 80 90 105
Rai
l Sea
t Lo
ad (
kip
s)
Speed (mph)
Rail Seat Loads on near rail (RTT, Passenger)
0
2
4
6
8
10
12
14
16
18
2 15 30 60 80 90 105
Rai
l Sea
t L
oad
(ki
ps)
Speed (mph)
Rail Seat Loads on far rail (RTT,Passenger)
0
2
4
6
8
10
12
14
16
18
2 15 30 60 80 90 105
Rai
l Sea
t Lo
ad (
kip
s)
Speed (mph)
Rail Seat Loads on near rail (RTT, Passenger)
0
10
20
30
40
50
60
2 15 30 45 60 70
Rai
l Sea
t Lo
ad (
kip
s)
Speed (mph)
Rail Seat Loads on far rail (RTT, Freight)


