Version 21_12_2009 Page 1 Veterinary Field Epidemiology in Action Course Notes COURSE NOTES VETERINARY FIELD EPIDEMIOLOGY IN ACTION An Introductory Short Course: Principles and Practices for Animal and Zoonotic Diseases 4 to 29 January 2010 Bangkok, Thailand
Transcript
Version 21_12_2009 Page 1
Veterinary Field Epidemiology in Action Course Notes
COURSE NOTES
VETERINARY FIELD EPIDEMIOLOGY IN ACTION
An Introductory Short Course: Principles and Practices for Animal and Zoonotic Diseases
4 to 29 January 2010
Bangkok, Thailand
Version 21_12_2009 Page 2
Veterinary Field Epidemiology in Action Course Notes
1.1 The human-animal interface and why it is important; 1.2 Basic epidemiology concepts and essential definitions including disease
causation; 1.3 Basic measures and tools of descriptive epidemiology. 1.4 How epidemiology supports government regulatory services.
Module 2: Assessing population health and disease status by conducting surveys
and surveillance.
2.1 Purpose and uses of surveys and surveillance; 2.2 Properties of diagnostic tests, perform basic calculations and interpret test
results; 2.3 Design, develop and deliver a useful questionnaire; 2.4 Sampling design, basic sample size calculations and surveillance data
analysis.
Module 3: Conducting epidemiological investigations of a disease outbreak.
3.1 Goals and foundation of a disease outbreak investigation; 3.2 Implementing the steps in preparing for, conducting and assessing a disease
outbreak investigation; 3.3 Applying basic descriptive statistics to accurately describe a disease
outbreak event; 3.4 Basic types of observational studies and their use in epidemiology.
Module 4: Communicate results and make practical recommendations to
stakeholders.
4.1 Presenting descriptive data in oral and written formats and making recommendations.
Glossary of Essential Terms and Definitions in Field Epidemiology
Selected References
Course Instructors
Field Activities
Version 21_12_2009 Page 3
Veterinary Field Epidemiology in Action Course Notes
Introduction The purpose of this international short course in veterinary field epidemiology is to introduce you to concepts that will be useful for you to apply in your work to prevent and control the presence of disease agents that have an effect on the health of animals, humans and the environment they live in. Every day veterinarians working for governments and private industry use the principles of epidemiology in some way in their work and this course is intended to expand capacity and capability in this area. Field epidemiologists form the front line against emerging infectious diseases including highly pathogenic avian influenza virus. The ultimate goal of field epidemiology is to provide practical and useful information that can protect the lives, businesses and the quality of life of people. Veterinary Field Epidemiology in Action introduces basic concepts and methods of epidemiology in a practical way and so the course provides trainees with an opportunity to apply epidemiological concepts through both classroom instruction and field exercises. Your active participation is needed so that you can apply and use what you have learned when you return to your place of work. Many opportunities will be presented for you to practice, exercise, discuss and explore the ideas and methods you are presented with so you are greatly encouraged to take full advantage through active participation. This training course is meant to be practical and at the end of this course you should be able to do the following: 1. Explain basic concepts and approaches of epidemiology; 2. Explain and assess the health status or disease status of a population using surveys and
surveillance; 3. Explain and conduct a disease outbreak investigation; 4. Be able to effectively communicate the results of an assessment or an investigation. Last but certainly not least, this course is intended to promote the formation of a network of veterinary field epidemiologists learning and working together. The relationships you form at this course are vital to the success of this training since field epidemiology requires teamwork. Together all will continue learning following this course. We hope that you are challenged and enjoy learning about field epidemiology and that you will continue to grow in knowledge and experience over time as part of a network of like-minded colleagues. We wish you an enjoyable and rewarding experience! Note from the Editor: The training curriculum for this course is based upon the results of a Regional Needs Assessment conducted during 2008. Every effort has been made to provide relevant and accurate information for trainees including carefully referenced examples. Acknowledgement is extended to the many epidemiologists from animal health and human health fields that have contributed to this important effort. David M. Castellan, DVM, MPVM, ACVPM, ACPV
Version 21_12_2009 Page 4
Veterinary Field Epidemiology in Action Course Notes
Module 1.1 The Human Animal Interface and Why it is Important Subhash Morzaria Regional Manager Emergency Center for Transboundary Animal Diseases (ECTAD) Food and Agriculture Organization of the United Nations (FAO) One World, One Health The concept of one health seeks to integrate the goals and activities of human health, animal health and environmental health within a multi-disciplinary framework. The one health, one world concept is not new but it is receiving renewed attention by the international community in light of the emergence of diseases such as HPAI H5N1 Eurasian subtype, SARS (Severe Acure Respiratory Syndrome) and Nipah virus during the past decade. One world, one health is of importance to field epidemiologists since they represent the front line force that will deal with emerging infectious diseases or EID. In recent years, approximately one new EID is occurring each year. Greater than 70% of all known EID are zoonotic. The challenge remains and the need for competent veterinary field epidemiologists is even greater in order to address this issue. FAO held meetings in 2005 and 2007 in Beijing and New Delhi, respectively in order to channel funding for HPAI including capacity building. The focus of international efforts is now broadened to all EID and not just HPAI as a result of the recommendations of the New Delhi meeting. This course represents one outcome from these recent investments. Although HPAI remains entrenched in some countries such as Bangladesh, PR China, Egypt, Indonesia and Viet Nam, many lessons have been learned including the following:
Disease is related to the level of economic development; There is a delicate balance between the need to control disease and the need to provide
livelihoods and food protein for humans; The important role of wildlife and disease transmission; The need to better understand the epidemiology of EID; EID require cross-sectoral collaboration and political commitment; Effective communication strategies are needed
Focus of EID EID occur at the interface of humans, animals and the environment, are transboundary in nature and result in wide ranging impacts. It is estimated that the global cost of pandemic influenza would be US$2 trillion USD making prevention a very cost-effective option for countries to consider. The cost of SARS alone is estimated to have been between US$30 and US$50 billion while the cost of FMD in the UK was estimated to have cost USD$25 to $30 billion. The impacts are very severe at the local level as well.
Version 21_12_2009 Page 5
Veterinary Field Epidemiology in Action Course Notes
Drivers for Emergence, Spread and Entrenchment of EID The following factors are related to the emergence, spread and entrenchment of EID.
Human Factors
o Over 90% of the world’s population growth is occurring in Africa, Asia and Latin America
o Poverty is rising o Rapid economic development is occurring o The demand for livestock products is increasing in huge amounts
In 2007 21 billion food animals were produced for over 6 billion people By 2020 the demand for animal protein will increase by 50%
o Farming systems are evolving very rapidly
Wildlife Factors
o Forest encroachment o Consumption of bush meat (HIV and chimpanzees) o Exotic animal farming (SARS) o Trade in exotic animals (Monkey Pox and Psitticosis)
37.8 million counted animals were imported into the USA from 163 countries from 200 to 2004
Climate Change
o Change in vector ecology and distribution o Pathogen adaptation to new vectors o Migratory patterns
Spread of Pathogens
o International air travel increases by 5% per year o Air travel increasingly involves animals o Animals can travel faster than the incubation period of many epizootic diseases o EID stay entrenched in poor farming communities
Pathogen Factors
o Although most pathogens isolated from humans are bacteria, viruses are the major form of EID
Viruses
o Both DNA and RNA viruses are represented o RNA viruses are more likely to be involved as an EID
High mutation rate Commonly present Includes Ebola, Marburg, Nipah, Hendra, Lassa, Hanta, Influenza, Polio,
Hepatitis, FMD, West Nile, Rabies, Yellow fever, SARS
Version 21_12_2009 Page 6
Veterinary Field Epidemiology in Action Course Notes
Goal in Addressing EID The goal of current strategies is to decrease the threat and minimize the impacts of epidemics and pandemics due to highly infectious and pathogenic diseases of humans and animals. The broader vision is to improve public health and food safety, ensure food security and protect the livelihoods of poor and vulnerable people. International efforts are now aimed at the following:
Preventive action to address root causes and drivers of EID; Building stronger public health and animal health systems; Strengthening national and international emergency response capabilities; Addressing the needs of the poor; Promote cross-sectoral and multi-disciplinary approach; Conducting strategic research.
Country level activities in the long term are focused on improving disease control capacity and governance. Country and regional activities in the short to medium term are focused risk-based surveillance to identify “hotspots”. International efforts are medium to long term and focus on support countries and control infectious diseases (e.g. Global Early Warning System). The strategy for EID must also consider the following cross-cutting issues for the sectors involved:
Surveillance and disease intelligence at the human-animal-environmental interface; Biosecurity; Bioterrorism; Socio-Economics; Development issues; Communications strategies; Private-public partnerships; Monitoring and evaluation.
Institutional issues are essential to implementation of a strategy to deal with EID including collaboration through a multi-sectoral approach. Financing and funding of prevention, evaluation and emergency response activities is also needed and the cost for supporting one world one health approach is far less than the alternative in allowing disease outbreaks to occur. Conclusion The local, national, and regional perspectives support the global recognition that HPAI and EID are complex problems requiring multi-disciplinary and multi-sectoral approach as well as strong partnerships. FAO, OIE, WHO, UNICEF, UNSIC and World Bank are cooperating and collaborating to develop strategies for EID that promote improved capacity at the national and local levels. Lesson Summary:
1. Over 70% of new diseases are EID. 2. The effects of EID are global in nature.
Version 21_12_2009 Page 7
Veterinary Field Epidemiology in Action Course Notes
3. EID are transboundary in nature. 4. EID can have huge economic impacts.
5. Rapid economic growth, poverty and increased demand for livestock products have
contributed to the spread of EID.
6. Most of the EID discovered occur in developing countries where poverty is at higher levels than in developed countries.
7. Both natural and human factors are responsible for emergence of EID.
Version 21_12_2009 Page 8
Veterinary Field Epidemiology in Action Course Notes
Module 1.2 Basic Introductory Concepts and Definitions of Epidemiology for Field Veterinarians David Castellan, FAO Regional Veterinary Epidemiologist Definition of Epidemiology Epidemiology is focused on the health and disease status of a population of animals, humans, plants or other living things. While clinical medicine focuses on the individual animal or person, epidemiology also considers the individual as one part of the population it belongs to. Epidemiology can be defined using the following key words:
Epidemiology plays a leading role in promoting and protecting the health of animal and human populations. Field Epidemiology When there is a health emergency or an immediate need to understand the health status of a population, Field Epidemiology is the “front line” that can best deal with emerging infectious diseases (EID). Field responses are challenging because when they are discovered there is very limited or no information, especially when dealing with an EID. Consider the following description of the importance of field epidemiology: “…the early investigative activities surrounding the identification of a possibly emergent disease must be carried out in the field and not the laboratory. This is the world of shoe-leather epidemiology…molecular microbiology and virology.” (Murphy, 1998) Application of basic epidemiologic principles under field conditions has very practical benefits. Consider how field epidemiology gives a practical working definition of the theoretical definition of epidemiology stated above using the following key words: Discipline: the general approach is to creating order and structure from incomplete knowledge; Study: combines learning about epidemiology theory with on-the-job field application; Frequency: means that we count characteristics in a population of people or animals; Distribution: describes the patterns of disease in a population, in a particular place during a period of time;
Epidemiology… is a scientific discipline…
that involves the study of… the frequency…
and distribution… of health and disease…
in populations… in order to find risk factors… for prevention and control.
Version 21_12_2009 Page 9
Veterinary Field Epidemiology in Action Course Notes
Health: refers to measures of optimum productivity due to lack of disease – for example, measuring output of meat, eggs or milk; Disease: refers generally to an imbalance in the health status of individuals or populations that result in decreased productivity, illness or death; Populations: refers to the group of individual animals or people that are considered or affected; Risk Factor: risk is the probability that a factor the population is exposed to be associated with the occurrence of disease – for example, recent introduction of animals into a herd or flock; Prevent: means not providing the opportunity for a disease to occur – for example by applying bio-exclusion or biosecurity principles; Control: methods to reduce the extent of disease in a population or area (see below) – for example culling, disposal, movement controls (quarantine, road closures), vaccination. Field epidemiology is really a type of applied field research since we are trying to uncover what exists in an uncontrolled situation. The field epidemiologist attempts to gather and organize data to bring order and meaning to it when there is an urgent need for it. Field epidemiology can be applied to disease outbreaks, situation assessments and policy evaluation. Field epidemiology relies on a systematic approach to gather and organize data in a way that will support a better understanding of a disease situation. Once a disease agent(s) is/are identified a positive “case” is defined by establishing “case definition”. Even if the agent is not yet identified the following basic disease methods of disease control methods can be effectively to control the disease:
Movement controls Stamping out Applying bio-exclusion and biosecurity principles Risk communication Vaccination may not likely be used for a new disease agent
Learning from history is important. While control measures can be taken in the short term to control the disease, the field epidemiologist’s job is not only to help control the disease but to understand the how the disease occurred in order to prevent it from happening again in the future. This is a challenging task that uses both information and data. Obtaining information from animal owners is the process that provides data. For data to be useful, it must be collected, organized, summarized and reported in a systematic way. What data needs to be collected? Three initial questions need to be asked by the field epidemiologist so that the appropriate data is collected (Gregg, 2008): 1. How large is the disease problem? Where does it exist and where does it not exist? First we
seek and describe what we observe. Case finding and surveillance are key activities. 2. How did the situation arise and what led to its presence? A thorough investigation is required
followed by preliminary analysis. 3. What can we do to better prevent and control the disease in the future? Further analysis of
the findings of investigations and studies is needed. Descriptive and Analytical Epidemiology Epidemiology addresses the three questions above using both descriptive and analytical approaches:
Version 21_12_2009 Page 10
Veterinary Field Epidemiology in Action Course Notes
Firstly, it is important to fully describe what we can discover and observe. Descriptive epidemiology involves describing what is known as fully as possible in order to find patterns of the disease among individuals in the population. In order to review what is known we combine unstructured information to create order in the data (adapted from Gregg, 2008): Describe what events occurred; Describe who is involved including both animals and humans; Describe when events occurred in time; Describe where events occurred including man-made and natural environments. By describing events as fully as possible it is possible to identify initial clues that will be a guide the next steps of a disease assessment. It is important to include additional information needed to more fully describe events. The results of gathering descriptive information should lead to formation of hypotheses (theories) of what factors led to the events that we can then test further. Descriptive epidemiology data can be used for the following purposes (MMWR, 2004):
Detection of individual cases Detection of outbreaks Measuring the impact of disease Understand the nature of a disease Understand the way that disease spreads and is distributed Generate hypotheses and ideas for further research Evaluation of prevention and control measures Support planning activities for animal health programs
Analytical epidemiology analyzes the results from descriptive epidemiology to address the following questions (adapted from Gregg, 2008): Determines how events occurred in order to adjust policy and response; Assesses the data collected to determine why the events occurred to prevent and control. Key Message: Every investigation and assessment is an opportunity to increase our understanding of the disease and how to prevent and control it more effectively in the future. The field epidemiologist’s responsibility is to fully describe events, make an initial field analysis and make recommendations to decision makers. In order to conduct successful investigations and assessments we need to understand the disease in question, apply basic epidemiological principles and tools. More complex analyses including observational studies can be conducted to test hypotheses further (more on this later). Frequency and Distribution Epidemiology is a quantitative science that strongly relies on data, biostatistics and data management. Since epidemiology works at the population level, it is essential to keep track of individuals within groups by counting and organizing them into sub-groups or categories. This implies that we are measuring according to some unit of measure by the type of animal, human, time, or location. It is important to describe events as specifically as possible. For example, in the table below there were 18,000 cattle located in District A sometime in the year 2005.
Version 21_12_2009 Page 11
Veterinary Field Epidemiology in Action Course Notes
Planning what data is needed is essential in order to obtain useful data. Data should be collected, counted and organized to answer specific questions that are planned in advance of collection. Consider the following example of an animal census conducted in 10 districts during the year 2005 and how it might be useful: Example 1:
District Cattle Sheep Swine Poultry TOTAL A 18,000 4,224 4,581 1,556 28,361 B 15,000 6,336 120 133 21,589 C 12,000 71 27 379 12,477 D 60,000 6,722 2,362 764 69,848 E 55,000 3,601 1,561 1,552 61,714 F 7,000 1,607 1,128 6,133 15,868 G 44,000 4,138 913 459 49,510 H 32,000 11,146 358 43,504 I 18,000 9,418 2,408 4,961 34,787 J 67,000 7,055 143 359 74,557
TOTAL 328,000 54,318 13,243 16,654 412,215 (Source: Castellan, DM) From a census, data for each animal species can be divided into subgroups according to the production type ONLY IF care is taken to plan to collect the data at that level from the start. Address the following issues BEFORE considering collection of field data:
The purpose and final uses of the data The level of detail required (e.g.) By Animal - species, breed, strain, sex, production type;
(e.g.) By Location - country, province/state, district, village, farm/house, etc. Determine if the data already exists Assess the resources needed to collect the data Determine the best way to collect, record, store, manage, retrieve and analyze the data
Key Message: Planning which data to collect is the first and most important step in making sure that it will be useful in the end. Light highlighted data was collected and is shown below:
District Total Cattle
Beef Cattle
Milking Dairy Cows Sheep Swine Broilers
Egg Layers TOTAL
A 18,000 8,000 500 4,224 4,581 1,556 28361 B 15,000 10,000 6,336 120 133 21,589 C 12,000 1,000 3,300 71 27 150 229 12,477 D 60,000 16,000 17,900 6,722 2,362 764 69,848 E 55,000 20,000 16,200 3,601 1,561 1,552 61,714 F 7,000 4,000 1,607 1,128 6,133 15,868 G 44,000 25,000 4,138 913 459 49,510 H 32,000 9,000 10,200 11,146 358 43,504 I 18,000 10,000 9,418 2,408 510 4,451 34,787 J 67,000 46,000 7,055 143 359 74,557
TOTAL 328,000 149,000 48,100 54,318 13,243 660 15,994 412,215
Version 21_12_2009 Page 12
Veterinary Field Epidemiology in Action Course Notes
This slightly more detailed data can be used as part of the basis for disease surveillance for particular diseases. Basic counts are useful but they are not able to reveal all the important information about what the numbers really mean. In order to get more meaning from numbers we must compare with other numbers. When disease cases are counted it is essential to define exactly what is meant by a positive case by creating a case definition. At the very beginning of a disease outbreak it is THE ESSENTIAL INITIAL STEP for the field epidemiologist to define a positive case in a practical way. In dealing with uncertainties about the disease status of a group of animals different case definitions can be applied as follows: Presumed Positive Case:
Clinical signs are consistent with the suspect disease; Rapid screening test properly applied is consistent with the suspect disease; Gross pathology is consistent with the suspect disease; Results of the Gold Standard Test are not yet available.
Confirmed Positive Case:
The index case in an area must be confirmed using the gold standard test; Clinical signs are consistent with the suspect disease; Rapid screening test properly applied is consistent with the suspect disease; Gross pathology is consistent with the suspect disease; Results of the gold standard test are positive.
Suspect Case Requiring Confirmation:
Animals that may have had direct or indirect contact with a confirmed positive case (dangerous contacts);
Animals at high risk of exposure to the disease agent from confirmed positive cases; Cases that are not yet assessed.
Case definitions for the same disease may also vary in detail for each production system. For example, commercial poultry mortality records can also be used to define a presumptive case since the level of information available is usually much better. In addition case definitions can be adjusted for each outbreak depending on the level of risk posed to animals in an area. Once a positive case is confirmed in a densely populated area, the criteria for defining a case may become broader to include more possible cases (e.g. clinical signs and rapid test positive). Key Message: Case definitions must be clearly established at the beginning of a disease event and they should be reviewed and modified when it is necessary to do so.
Version 21_12_2009 Page 13
Veterinary Field Epidemiology in Action Course Notes
Example 2: Consider the number of cases of HPAI H5N1 over a 13 week period in the following outbreak. What is your assessment?
It appears that the number of cases is declining but is always important to put case counts into some sort of context. For example how many samples were collected during each week of the outbreak? Did the number of cases counted decline because there were fewer cases or fewer samples were submitted? When we calculate the percentage (or proportion) of all samples submitted to the laboratory that were positive during the same time period (2 extra weeks are also included), here are the results:
Example 3:
In conclusion, even as the number of positive cases dropped, the percentage of all laboratory samples submitted that were positive remained very high and remained greater than 50% most of the time. The percentage of positive samples the laboratory received includes voluntary samples through passive and active surveillance. Passive surveillance means samples are voluntarily submitted through existing systems. Active surveillance is actively looking for cases such as going from house to house looking for diseases animals. For this example, the percentage of positive cases is as follows: % Positive Cases = No. Confirmed Positive Samples/Week (numerator) X 100
Total No. Samples Tested/Week (denominator)
Version 21_12_2009 Page 14
Veterinary Field Epidemiology in Action Course Notes
The lesson of this example is that all frequency counts can be misleading if they are used alone. Another reason for expressing counts as a percentage or proportion is to be able to compare disease in two different populations. We also need to consider how to count positive cases in time. If we are counting the number of new cases over a period of time (there were 297 new positive cases during week 5) then these cases are called incident cases. If instead, we are counting the number of existing cases at one point (No. Positive cases right now) or during a period of time (a total of 949 cases existed between week 1 and week 13) these cases are called prevalent cases. The previous example demonstrates the need to carefully define which cases (incident versus prevalent) we are counting and over what time period. In order to compare the number of incident cases or prevalent cases of a disease in two locations or populations then it is important to only compare the same type of case during the same time period. More information on incidence and prevalence will be presented in the module on basic measures and tools of epidemiology. In a disease outbreak or when conducting disease surveys it is essential to count cases and describe them according to the person/animal involved, the place where the cases occurred and the time period in which they occurred. This approach in epidemiology is called “person-place-time”. Example 4: Outbreak histogram of virulent Newcastle disease according to place (premises) and time (week):
(Source: Castellan, DM) The outbreak shows two patterns including propagated and point source. In this case it is important to ask what happened in week 7 that might be related to the surge in new cases observed during weeks 9 and 10. It turns out that the case during week 7 was a poultry farm that was also an egg processor and marketer. The virus likely spread through marketing channels once it occurred at that farm where marketing also occurred. Example 5: Timeline of AI and vND in an Area
Version 21_12_2009 Page 15
Veterinary Field Epidemiology in Action Course Notes
(Source: Castellan, DM) Example 6: According to person and time. The following example describes the number of ill slaughter plant workers who had positive fecal samples for Salmonella spp. using standard bacteriological methods over a 20 week (5 month) period (Kotova, 1988). The slaughter plant had 250 employees. 100 people were initially positive so one can conclude that 5 of 100 people still carry Salmonella (carriers) at 20 weeks following exposure. This is a very simple and practical application of counting cases that assists in understanding the disease in the population. Example 7: According to person, place and time. The following example shows how poultry workers can spread avian influenza virus (McCapes et al., 1986).
Weeks Following Infection # Salmonella Positive Fecal 2 92
4 41 9 17 10 12 20 5
TOTAL POSITIVE 167
Version 21_12_2009 Page 16
Veterinary Field Epidemiology in Action Course Notes
In Example 7, poultry workers moving from farm to farm were spreading the virus. Due to the long time period of cases between cases, this epidemic was spread slowly over time in a propagated manner. Other modules in this course will deal with ways that we compare groups using biological, statistical and scientific reasoning. Health and Disease Epidemiology is used to assess both the health and disease status of a population. Epidemiology can be used to maximize the health of animals in order to increase milk, meat or egg production which will benefit human health as well. Alternatively, epidemiology is commonly used to prevention and control animal diseases affecting either animals or humans requiring close collaboration between government and animal producers. Key Message: The health and disease status of animals, humans and the environment are closely related to each other and must be considered together. The following are examples of measuring the health status of animals:
Health Indicator Production Index Reproductive Health - Calving to conception interval - No. eggs/100 hens/day Udder Health - Somatic cell count Growth Rate - Kg. weight gain/animal/week Feed efficiency - Kg. weight gain/animal/Kg. feed/week
Diseases at the individual animal level are commonly grouped into the following categories according to their origin using the following memory tool: Degenerative (arthritis) Anomalies (genetic), Autoimmune Metabolic Neoplasia, Nutritional Infectious, inflammatory, immune-mediated, iatrogenic (caused by humans), idiopathic (unknown) Toxic, traumatic At the population level disease can occur at different levels including sporadic, epidemic or endemic patterns. These patterns may suggest some possible types of sources of the disease to investigate more fully.
Sporadic Epidemic Endemic
Version 21_12_2009 Page 17
Veterinary Field Epidemiology in Action Course Notes
Epidemic patterns of disease can be sub-divided into at least 4 different types which can also be combined together:
Propagated Point Source Propagated-Point Seasonal
Source Mix Epidemiology uses a framework to explain why diseases occur in a population. It is called the epidemiological triad. The triad (3 points) is a changing relationship between disease agent, host and environment which determines the ecology of a disease.
Disease agents include the following types:
Biological (infectious agents) – each agent survives best in a preferred ecology o Viruses o Bacteria o Parasites o Other – Prions
Chemical – the availability of each chemical to a host is determined by its chemical form, its half-life (T1/2) and the dose received
o Natural toxins – sources include algae, toxic plants, shell-fish o Man-made – Dioxins, melamine o Inorganic versus Organic – examples are Selenium toxicity and Zearalenone
(moldy maize) toxicity respectively Physical
o Foreign bodies o Trauma o Radiation o Lightning o Electricity
Biological disease agents assure their survival by living in balance with their hosts. Therefore it is a disadvantage for the disease agent to be able to survive if it kills all of the host animals. Host factors that are associated with the occurrence of disease events follow:
Environment Host
Agent
Version 21_12_2009 Page 18
Veterinary Field Epidemiology in Action Course Notes
Demography o Age o Sex o Species o Breed o Production type o Production level o Density
Biology o Genetics (physiology, anatomy) o Behavior
Management o Intensive (housing) versus extensive (free roaming) rearing system o Nutrition o Hygiene o Husbandry o Mobility o Health including use of vaccination and medication
Marketing o Profitability related to prices (economics) o Distance from market
Herd Immunity o Innate (genetic capability) o Acquired through vaccination or deliberate exposure o Proportion of total population that is resistant to a disease agent
Susceptibility o Lack of resistance to the disease agent
Key Message: Epidemics are driven by the introduction of a disease agent into a susceptible population. The size and extent of an epidemic depends on the number of susceptible individuals and the effective rate of contact between infected and susceptible individuals (related to density of the animal population). A natural host is a host where the agent has adapted itself and co-exists in balance in the host. An example includes wild waterfowl which are the natural host of avian influenza virus. An atypical host is an unusual host where the disease agent is not normally encountered; The environment may include natural and human aspects and it is a critical part of understanding the ecology and survival of disease agents. Some examples of both follow: Natural Human-Related Geography Animal management systems
Climate Marketing systems and economics Season Government policies pH Ammonia concentration Water activity Ultraviolet light Organic matter
Version 21_12_2009 Page 19
Veterinary Field Epidemiology in Action Course Notes
Population and Population at Risk A population is a collection of individual living organisms including humans, animals or plants. The population at risk (PAR) is a collection of individuals that can be affected by (they can be exposed to and are susceptible to) the disease of concern. The characteristics of the population at risk should be defined specifically as possible by describing the following: Population Type: the species, breed, production type (beef/diary); Population Size: the number of animals/humans can be small (greater than or equal to one) or very large (millions of animals); Population Changes: animals may be part of a closed population or the population may be open one that includes animals that enter or leave the population during a time period we are observing them. Population Distribution: the location of the animals/humans can be a house, a village, a farm or a wider area such as province/state, country, region or global population; Population Time Period: can mean the time period when the population existed, the age of the susceptible population or a time period during which the population was at risk. Consider the following data:
(Source: Castellan, DM) The more we know about the population at risk before an emergency occurs it is possible to use this information to prevent disease and contain disease rapidly rather than using only disease control methods. The most complete way to define the PAR is by conducting regular census. Often it is not possible to conduct a census or test all animals so scientifically valid sampling must be conducted instead (refer to lectures on surveys and surveillance). Epidemiological “Unit of Interest” The case definition specifies what is considered a positive case but the unit of interest (also called the “unit of concern”) focuses of what we are counting. For example, unit of interest could be an individual animal or person, herd or flock, or it could be a village or location. The herd or flock level is the most important and commonly used “unit of interest” when sampling to detect
Version 21_12_2009 Page 20
Veterinary Field Epidemiology in Action Course Notes
evidence of disease agents. It is critical to define the unit of interest when planning to conduct any survey, surveillance or disease investigation. Assessing Risk Factors What is risk? Risk is defined as the probability that an event will occur. Risk can be assessed either subjectively (qualitatively) or objectively (quantitatively). In the early stage of an animal disease outbreak we often assess risk qualitatively but the goal of the field epidemiologist is always to gather count data that will allow for quantitative assessment of risk. To assess risk quantitatively we must move the discussion from counts to fractions. The simplest example of probability is the experiment of tossing a coin. Assuming the coin is balanced and since there are only two sides, the probability that a coin flipped 100 times will land on either heads or tails will be approximating 50% (100 coin flips divided by 2 equal choices). When there are only two clear choices, the distribution of results is called binomial (bi - means two; - nomial refers to number). Results that are binomial are “either-or” situations. Examples of binomial data used in animal health work include the following choices: yes/no; alive/dead; positive/negative; sick/healthy. In order to assess risk quantitatively for one population and to compare the risk of a disease to another population it is necessary to interpret count data in relation to a denominator, the populations (PAR) where they come from. More attention will be given to quantitative risk later during the course but a basic formula is given below:
Risk = R = # Events in a unit of time (between time 0 and time “t”) PAR at time 0 (beginning)
In Example 6, the risk of becoming a positive case according to the case definition (fecal culture positive) is as follows:
Risk = R = 167 total persons infected from time 0 to 20 weeks 250 total persons at risk on day 0
R = .67 Conclusion: The proportion of the population at risk (PAR) that became Salmonellosis cases is .67 What is the risk of being a Salmonella carrier? There were 5 persons of 100 positive persons with a positive stool culture for Salmonella 20 weeks after an outbreak. In this case:
R = 5 positive samples at 140 days (20 weeks) 100 people were exposed and positive on day 0 R = .05 over 20 weeks
(Or as % R = .05 X 100 = 5% over 20 weeks) Conclusion: The proportion of persons exposed and positive for Salmonella at the beginning of an outbreak who were culture positive 20 weeks following exposure was 0.05. Five percent of the population remained Salmonella carriers at 20 weeks following exposure.
Version 21_12_2009 Page 21
Veterinary Field Epidemiology in Action Course Notes
Key Message: Count data must have a reference point in order to be able to compare two populations and the denominator MUST be considered in order to correctly interpret counts. Disease Prevention and Control In order to prevent and control a disease agent we must understand the disease agent, its ecology (how it survives) and how it is transmitted among host populations. Understanding the type of disease agent we are dealing with assists in developing a strategy to effectively deal with it. Infectious disease agents can be categorized as follows:
Agent Type Epidemiological Implications
Bacteria - Replicates outside of host - Short generation time
- Cell wall - Acquired Resistance to antibiotics
- Host adaptation varies (Typhoidal versus non-typhoidal Salmonella spp.) - Acute versus chronic effects in host vary
Viruses - Must replicate in a host
- DNA versus RNA virus replication - Enveloped versus non-enveloped
- Antiviral treatment not feasible - Host adaptation varies - Acute versus chronic effects in host
vary
Parasites - May require both primary intermediate and end hosts to reproduce and survive - Resistance to treatment develops over time - Acute versus chronic effects in host vary Prions - Origin and pathogenesis incompletely understood - Related to feeding practices in animals - Chronic degenerative process in host
Key Message: Know and understand the enemy (disease agent). When production drops, animals become ill or die the effect of a disease in individuals and in the population may become evident if they are carefully observed. Although an infectious disease agent may be present the effects may not be visible in some animals as illustrated by the Iceberg Principle. To apply the iceberg principle it is important to ask why disease may not appear to be evident. Here are some possible answers why we fail to detect disease:
1. The disease agent does not exist in an unexposed population;
Version 21_12_2009 Page 22
Veterinary Field Epidemiology in Action Course Notes
2. The disease agent has just been introduced and is present at a low level; 3. The disease agent is present subclinically in many individuals within the population; 4. Our methods to detect the disease are limited.
(Source: Images, Google.com) The methods used to define a case determine how large we think the iceberg is. The test used may also exaggerate the extent of the disease agent in a population. For example PCR can detect nucleic acids from both viable and dead organisms in the environment. Example 8: Iceberg principle of disease
Clinical “Case”
Subclinical “Cases” (carriers)
Assumed “Negative”
(Adapted: Gay, JM) The case definition will determine how much of the true disease is apparent or detected in the population. The number of prevalent cases could be described in 3 different ways depending on how a case is defined. Consider for example, a chronic disease such as tuberculosis. Case Definition Diagnostic Criteria Prevalent Cases Based on clinical signs Age, body score, herd history 1/21 = 0. 04 Based on subclinical intradermal test Reaction to tuberculin CC test 9/21 = 0.43 Based on clinical/subclinical Both criteria above 10/21 = 0.48 Assumed negative Other than above 11/21 = 0.53
Version 21_12_2009 Page 23
Veterinary Field Epidemiology in Action Course Notes
Steps in the Disease Process: Agent Source >
Exposure > Host Susceptibility >
Outcome (Clinical/Subclinical) 1. Sources of infectious disease agents include the following:
Environment – land, water, air; Live Animals – infected tissue (skin) and contaminated secretions (tears) and
discharges (oozing wounds, cuts); Dead animals – carcasses; Feed and Water; Animal products – milk, meat, eggs, other; Animal by-products – manure, feces, litter, offal (slaughter waste); Introduced through human intervention (Iatrogenic); Reservoir – includes wild animals, insects and other living sources of disease
agents for the population at risk prior to exposure; Fomites – inanimate objects (clothing, equipment, vehicles) contaminated with
disease agents; Vectors – insects and other living organisms can transmit disease agents either
mechanically or biologically where the agent replicates within the vector. 2. An opportunity for exposure occurs: It is important to consider the way exposure occurs as well as the timing of exposure. Exposure to disease agents occur in the following ways:
Initial introduction into the population Transmission within the population (individual to flock/herd to larger population) Direct transmission between infected host and susceptible host within the same
population or among different populations o Horizontal o Vertical e.g. Brucellosis, tuberculosis
Indirect transmission through contaminated clothing, equipment and vehicles o Marketing systems
Exposure dose of disease agent Route of exposure (oral-fecal versus venereal) within host population Animal density increases chances for secondary transmission in the PAR
The way that a disease agent is introduced into a population can often be different from the way a disease agent is transmitted afterwards within the population. For example, the initial introduction of HPAI by wild birds followed by secondary spread through poultry marketing channels or human movement. The timing of exposure is a critical piece of information that must understood in order to define disease events. Certain time periods in the infectious process are as follows:
Survival time of the disease agent in the environment and host Frequency of exposure Critical periods for apparent infections when clinical signs are observed:
o Incubation period related to introduction of new animals or other contacts
Version 21_12_2009 Page 24
Veterinary Field Epidemiology in Action Course Notes
o The shedding period is developed through experimental studies o The period of clinical signs and recovery period can be observed visually when
evident; sometimes animals die very suddenly without observing previous clinical signs
o Carrier state can be assessed through sampling at time intervals Incubation period (acute diseases) or Latency period (chronic diseases)
Initial Shedding period
Period of clinical signs
Recovery period
Carrier period (or death)
Exposure Moving animals during the incubation period while a virus is replicating in host tissues can result in a high level of virus exposure and transmission. To counteract this possibility quarantine is applied for at least the maximum known incubation period of a disease. Note that individuals in a population with subclinical infections contribute to the presence of the disease agent as “inapparent” carriers and disease are managed based on this information. 3. Host susceptibility varies due to differences in the following characteristics:
Species, breed, strain Age Sex Genetics Animal management and husbandry
The effects of a disease agent in a host population may include either one of or a combination of mild, moderate or severe. Morbidity refers to illness in a population while mortality refers to deaths.
Version 21_12_2009 Page 25
Veterinary Field Epidemiology in Action Course Notes
4. Assessing Disease Outcomes It is important to measure disease outcomes using practical, available data including existing records, conducting surveys and surveillance to determine the number of either incident or prevalent cases. The ability to define a case appropriately will affect whether disease control or disease eradication is possible. Basic measures (indices) used to assess health and disease outcomes include productivity, morbidity and mortality. Important data that can be used in production systems include production records, treatment records, and mortality records. Outcomes can only be assessed if we collect these data. In quantitative terms we can also assess the effect of an infectious disease agent upon a host population using the following proportions:
Infectivity = # Infected following exposure Total PAR at exposure
Pathogenicity = # Clinically Affected following exposure
Total # Infected at exposure
Virulence = Total # Severe or Fatal Cases following exposure Total # Clinically Infected Cases at exposure
Measuring these effects quantitatively obviously depends on collecting both numerator and denominator data over a certain time period for a certain population at risk. Causation Causal Reasoning In order to prevent and control disease it is necessary to understand which factors are associated with the presence of the disease agent. It is not possible to prove cause and effect with absolute certainty using epidemiology but it is possible to calculate the risk or probability of disease associated with various risk factors. Koch’s Postulates and Hills Criteria of Causation are general conditions use the following reasoning to establish whether a factor is a cause of disease:
The agent o Is present when the disease exists o Is absent when the disease does not exist o The agent can be isolated in pure culture and results in disease when it is given to
exposed animals Exposure
o Occurs before the disease occurs Consistency
o The disease is reproducible in different populations at different times Strength of statistical association
o The results are not due to chance Dose-response
o Increase in exposure leads to increase in disease Removal or change in the factor
o Decrease in exposure leads to less disease Consistent with current knowledge
Version 21_12_2009 Page 26
Veterinary Field Epidemiology in Action Course Notes
o Results agree with other studies or knowledge
Some factors must be present in order for the disease to occur and are called necessary causes. The presence of the disease agent is a necessary cause and for example, the bacterium Brucella abortus is a necessary cause for the disease Brucellosis to occur in cattle. Sufficient causes are factors that either may or may not be present in order for disease to occur. Immune-suppressive viruses such as Gumboro virus (infectious bursal disease), chicken anemia virus, virulent Newcastle virus in chickens can be a sufficient causes for observing clinical signs and production drops associated with infectious bronchitis virus. Infectious diseases seldom occur due to one factor alone. Instead, many factors are associated with the occurrence of infectious diseases and they are considered as a web of causation as seen in the following example of Salmonella transmission on a poultry farm.
(Source: Castellan, DM) Factors and outcomes that may be associated with disease are called variables. In the example provided above, we can group possible causal factors according to two categories called exposure variables and outcome variables:
Hens Wildlife Insects In field investigations, the investigator cannot conduct a controlled experiment and so must rely on developing a hypothesis based observations and patterns observed from the field using counts and comparing counts and calculate proportions from positive cases and negative cases.
Version 21_12_2009 Page 27
Veterinary Field Epidemiology in Action Course Notes
The null hypothesis is the scientifically accepted way to test the relationship between exposure variable and outcome variable. It must be simple, clear and stated in the negative sense. Example 9: 80 poultry farms were observed over a 5 month period and were regularly tested for vND. Owners were asked whether they observed loose chickens from the area on the farm during that period and data was collected. The results are presented in a 2 x 2 table below. Step 1: Develop the null hypothesis (HO) HO: Free roaming (loose) chickens within 2 km of positive poultry farm are NOT associated with the risk of being positive for vND over a 5 month period of time. The alternative hypothesis is: HA: Free roaming (loose) chickens within 2 km of positive poultry farm ARE associated with the risk of being positive for vND over a 5 month period of time. Step 2: Compare the risk of an exposure variable (loose chickens) in for the outcome variable by comparing the proportion of farms that are positive or negative for the outcome variable. Comparison using 2x2 Table:
Exposure Disease + No Disease - Total Yes-
Loose Chickens
10 22 32
No- Confined Chickens
11 37 48
Total 21 59 80
What is the risk of vND positive farms observing loose chickens (exposed) over a 5 month period?
Risk Exp = R Exp = # vND cases with loose chickens in a 5 month period Total # vND cases observing loose chickens (Exposed)
R Exp = 10 cases of vND with loose poultry over a 5 month period 32 vND cases observing loose chickens R Exp = 10/32 = 0.31 = 31% What is the risk of vND positive farms not observing loose chickens (unexposed) over a 5 month period?
Risk Unexp = R Unexp = # vND cases with loose chickens in a 5 month period Total # vND cases with no loose chickens (unexposed)
Version 21_12_2009 Page 28
Veterinary Field Epidemiology in Action Course Notes
R Unexp = 11 cases of vND with loose poultry over 5 months
48 vND cases with no loose chickens over 5 months R Unexp = 11/48 = 0.23 = 23% It appears at first glance that the risk of being positive for vND may be associated with vND positive farms where free roaming chickens were observed. How do we interpret the findings? It is necessary to systematically evaluate every result in order to have confidence that the differences observed are real or if there may be other reasons for the differences observed. Initial results may be misleading and can be assessed using the approach presented below:
1. The differences observed could be due to chance and may not be real differences. This must be addressed by performing statistical tests to determine whether the results are due to chance. In this case a Chi-square (Fisher’s Exact) test of association is done. Conclusion: The proportion of vND positive farms observing loose chickens was not significantly different from the proportion of vND positive farms not observing loose chickens and so any differences observed are due to chance (p = 0.4449,two-tailed test). Therefore we accept the null hypothesis in this case.
2. The sample size (80 farms) could be too small to measure a difference between both exposure groups.
3. The results must make sense biologically (plausible). In this case, it seems reasonable
that infected free roaming chickens could transfer vND virus to susceptible poultry on farms either directly (contact) or indirectly (contaminated feces transferred to poultry).
4. The results could be statistically non-significant but economically significant.
5. The farms we selected for our comparison were not representative of the overall
population and could have given biased results. Bias is a systematic error that affects our ability to objectively relate exposure variable with the outcome variable and there are many kinds of bias to consider. In the example given above, Selection bias is the systematic error of including or excluding farms used to evaluate the exposure factor and the outcome variable.
6. It could be that confounding is involved. The age of farm flocks or free ranging
chickens may be more highly associated with being a positive case of vND. In this situation age is associated with the outcome but it may not be the cause of vND in these flocks. A confounder is a factor that is independently associated with a disease outcome variable (vND) and a risk factor but is not a cause of the disease. Confounders are variables that are distributed unevenly in different exposure groups (farms observing loose chickens and farms not observing loose chickens). Confounders can be dealt with in several ways and will be discussed in future lectures.
Free ranging chickens vND Positive Farm
Age
Version 21_12_2009 Page 29
Veterinary Field Epidemiology in Action Course Notes
Confounding Example: Older people may be at a higher risk for cancer than younger people since they have long exposure period to risk factors for cancer, but they do not get cancer due to their age alone. Age is associated with both the exposure factors (smoking, genetics, pollution etc.) and outcome (cancer).
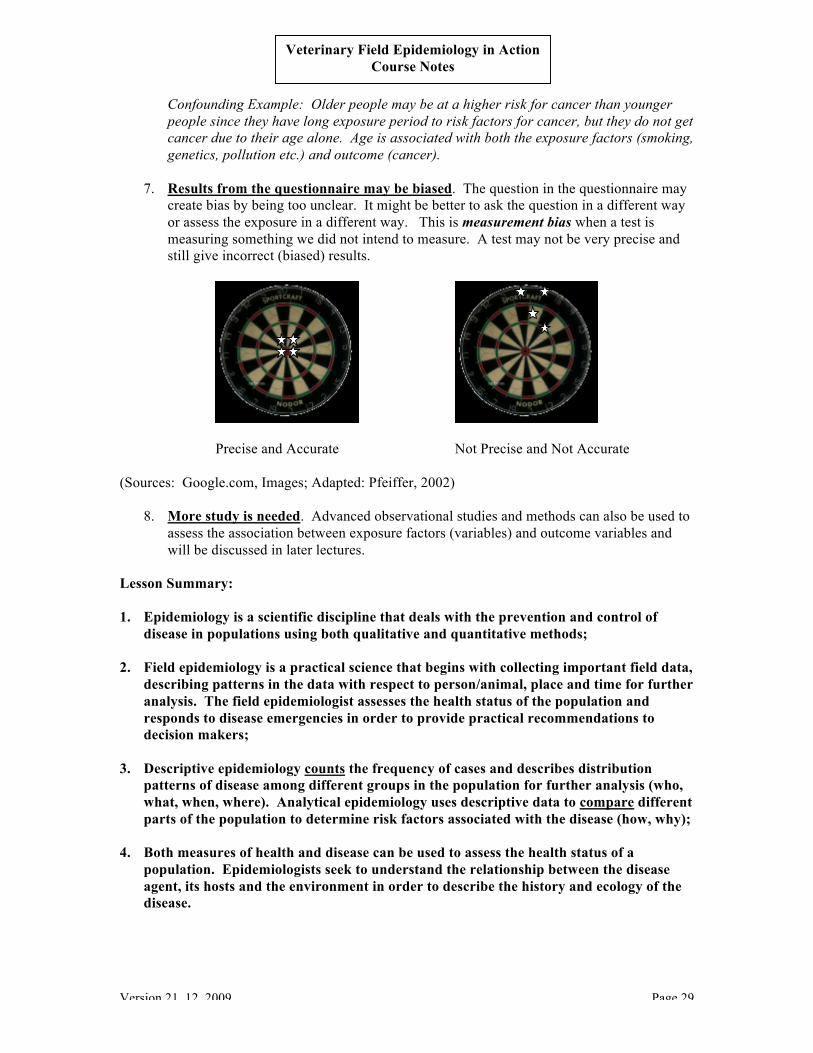
7. Results from the questionnaire may be biased. The question in the questionnaire may create bias by being too unclear. It might be better to ask the question in a different way or assess the exposure in a different way. This is measurement bias when a test is measuring something we did not intend to measure. A test may not be very precise and still give incorrect (biased) results.
Precise and Accurate Not Precise and Not Accurate (Sources: Google.com, Images; Adapted: Pfeiffer, 2002)
8. More study is needed. Advanced observational studies and methods can also be used to assess the association between exposure factors (variables) and outcome variables and will be discussed in later lectures.
Lesson Summary: 1. Epidemiology is a scientific discipline that deals with the prevention and control of
disease in populations using both qualitative and quantitative methods; 2. Field epidemiology is a practical science that begins with collecting important field data,
describing patterns in the data with respect to person/animal, place and time for further analysis. The field epidemiologist assesses the health status of the population and responds to disease emergencies in order to provide practical recommendations to decision makers;
3. Descriptive epidemiology counts the frequency of cases and describes distribution
patterns of disease among different groups in the population for further analysis (who, what, when, where). Analytical epidemiology uses descriptive data to compare different parts of the population to determine risk factors associated with the disease (how, why);
4. Both measures of health and disease can be used to assess the health status of a
population. Epidemiologists seek to understand the relationship between the disease agent, its hosts and the environment in order to describe the history and ecology of the disease.
Version 21_12_2009 Page 30
Veterinary Field Epidemiology in Action Course Notes
5. Proving that a factor causes a disease is not possible. Disease most often occurs due to
the presence of many exposure factors and epidemiology relies on measuring the strength of association between each possible factor and the disease outcome measure. Biostatistics and application biological and scientific reasoning provide evidence that may support a causal association. The importance of a factor in causing disease is established carefully over time by conducting scientific studies including many disciplines as well as epidemiology.
6. Question results and understand the limitations of each field study. One study alone
can never provide enough data to make a conclusion with complete certainty. 7. A 2 X 2 contingency table is the most common way in field epidemiology to measure the
association between a risk factor (present/absent) and the disease outcome (positive/negative). A general form of the contingency table is presented below:
8. Bias means errors in accuracy including how subjects or samples are selected, exposures
or outcomes are measured and errors due to confounding. 9. The field epidemiologist uses each disease outbreak and health assessment is an
opportunity to collect data that will increase understanding of the way the disease interacts with a population in order to support science-based policies.
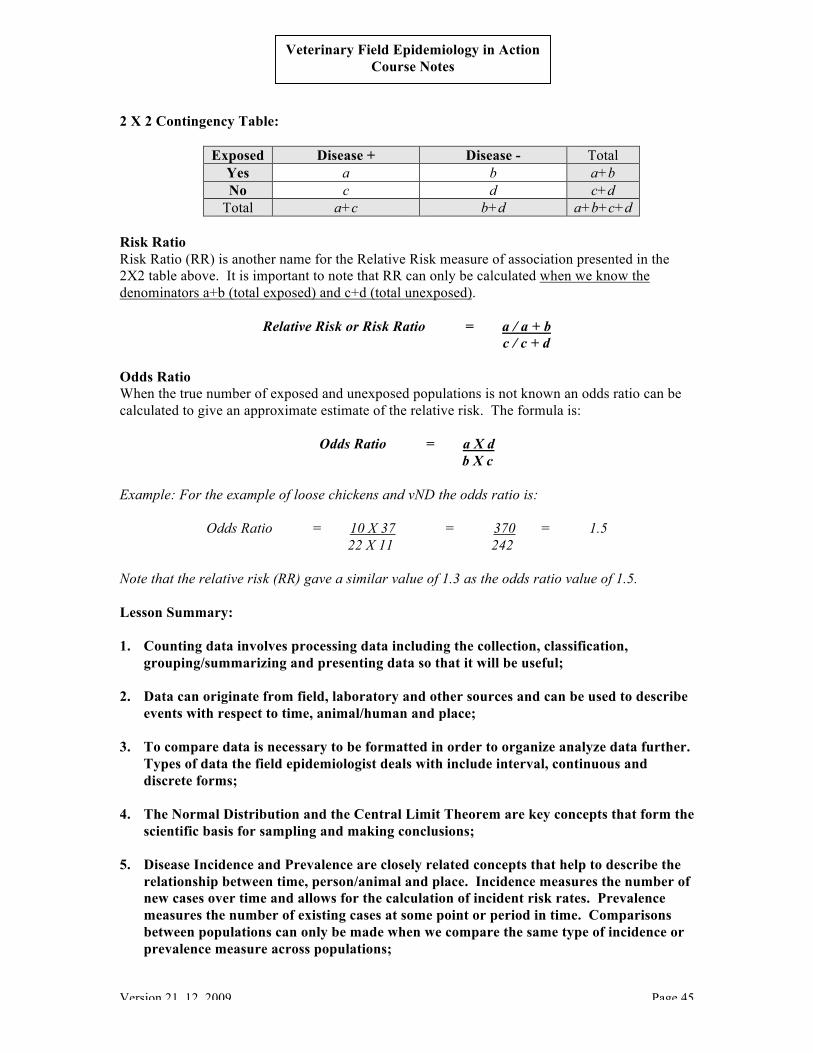
Exposed Disease + Disease - Total Yes a b a+b No c d c+d
Total a+c b+d a+b+c+d
Version 21_12_2009 Page 31
Veterinary Field Epidemiology in Action Course Notes
Module 1.3 Basic Measures and Tools of Descriptive Epidemiology David Castellan, FAO Regional Veterinary Epidemiologist Basic Measures and Tools of Descriptive Epidemiology Data collection, classification/organization, summarizing and presentation of findings form the process that is essential to descriptive epidemiology. To understand this process it is necessary to consider the different data types and how they are applied. Since data is intended to be used and shared to some degree it must be dependable, have a clear meaning, be organized and understandable to the person or organization receiving the data. Accurate data measures exactly what is meant to be measured. If a laboratory test is accurate then it will demonstrate no cross-reactivity or inappropriate response. Tests for brucellosis often cross-react with Yersinia spp. and so it is not very accurate nor is it very specific to detection of brucella bacteria. A question in a questionnaire is able to provide the appropriate answer to the question that is asked. Precise data results when a test produces consistent results each time the test is repeated on the same animals. Laboratory tests clinical evaluation, post-mortem pathology or questions on a questionnaire can all be considered as “tests” that gives a specific result. Quantitative laboratory test data such as fecal coliform count, rabies antigen titer, Hemagglutinin (HI) titer produce a ratio that is based on the number of dilutions. A quantitative question on a questionnaire would be to ask how many cattle are younger than 18 months of age. Semi-quantitative data include numbers or scores where things are ranked in some order. Semi-quantitative laboratory tests such as the enzyme linked immunosorbent assay (ELISA) are measured subjectively using optical density and color change to estimate the amount of antigen present. Qualitative laboratory tests include subjective assessment. An example of qualitative data in a questionnaire would be to assess muscle mass in a carcass (gross pathology) or ask an animal owner to give an opinion on the level of herd health at a point in time as being better or worse than a previous time period. Data Collection Field data must go through a process in order to be useful and can be shown as follows:
In order to collect useful data it is important to collect the right data in the right format. Data must be collected for a specific reason in terms of the hypotheses you intend to test. Data may originate from the field or from laboratory results. Most field data is collected in real time and in a future direction (prospective) while laboratory data can also be assessed in the past in a
Version 21_12_2009 Page 32
Veterinary Field Epidemiology in Action Course Notes
retrospective way. Interviewing an animal owner too long following an event will result in poor memory of the event that can result in recall bias. Can you think of other examples where the method of data collection could create a bias of our interpretation of the data? Usefulness of Data In order to make sure that data is useful, the following issues should be carefully considered BEFORE collecting any data:
WHY ? o Why do you need the data? o Why have you selected this disease and population at this time?
WHAT? o What data is needed to achieve your purpose? o What data can you realistically collect? o What are the costs involved? o What are the practical limitations in terms of manpower and resources
(vehicles)? HOW?
o How will the data be processed and used? o How will funding and community support be obtained?
WHO? o Are the animal and human populations being included? o Who will coordinate field and laboratory activities? o Who will need to support the effort? o Who will receive the results? o Who will support field activities?
WHEN? o Will a plan be developed with timelines and target dates? o Is the project targeted in time/season? o Will the results be made available?
WHERE? o Will the location of field activities provide challenges and opportunities for
collecting data?
Data Types Recall that data can be in the form of numbers (Excel spreadsheets), in writing (reports), maps (paper/electronic), images (diagrams) and graphic symbols. Interval data This includes data that covers a specific period of measure in time or space as follows:
Time o Chronological time in a general sense - hour, day, week, month, year or longer
can be analyzed to look for short, medium term and long term trends (Time Series Analysis)
o Biological time – production cycle (open period for breeding cows), age range Space
o Linear distances, radius, diameter, polygons o Geographic coordinates – latitude and longitude
Version 21_12_2009 Page 33
Veterinary Field Epidemiology in Action Course Notes
Counts Counts are collections of individual numbers related to a disease or condition of interest within a population. A census or survey is an example of useful counts to describe a population however as seen an Example 2 of module 1.2, counts can be very misleading when describing the level of disease in a population. Nominal and Ordinal Data Nominal and ordinal data are examples in the use of coded data, where responses are represented by numeric values that have meaning attached to them (not simply count data of individual animals). Numbers can represent categories of animals (e.g. dairy [1], beef [2], water buffalo [3]) are called nominal data where each number represents one category with no order to them. Counts can also represent ranked or ordered choices where the sequence of the number is attached to a characteristic of an animal and are called ordinal data. The sequence of clinical signs observed in an animal could be ranked in order from first to last in an ordinal set of data. An example of one series of clinical signs could include the following order: lack of appetite [0], depression [1], nervous signs [2], collapse [3], death, [4]. Missing data should always be represented by a meaningless number to identify it as missing [-99]. Continuous Data Continuous data form part of a set of data that can take any value within a series of numbers that run together. Unlike data that is group into categories, continuous data values are unique although some values may be duplicated. Some examples of continuous data include temperature and exact distance from a positive village with a disease. After recording continuous data, various data can be assessed and compared using measures of central tendency, including mean, median, and mode. Many variables found in nature are distributed according to and can be described by a normal distribution as shown below:
(Source: Adapted from www.itl.nist.gov/div898/handbook/pmc/section5/pmc51.htm) Assumptions:
1. µ is the mean of a standard normal population; 2. Observations are independent of each other; 3. 68% of the values lie within one standard deviation (unit of variation) from the mean; 4. 95% of the values lie within two standard deviations from the mean.
The normal distribution is used extensively in biostatistics to describe variability of a set of data distributed according to a standard normal distribution.
Version 21_12_2009 Page 34
Veterinary Field Epidemiology in Action Course Notes
If we select subjects randomly, the measurements we take should also approach the true normal distribution (some assumptions also apply) and the samples should represent of the population as a whole. This is possible because of the statistical principle called the Central Limit Theorem. The central limit theorem allows us to make conclusions by selecting subjects randomly from a population that will represent the whole population (assuming we control for bias and other sources of error). The goal is to select a “representative” sample of the population as a whole. This principle is applied every time animals are randomly selected for surveillance purposes. Subjects can either be selected only once (without replacing them) or repeatedly (with replacement). Measures of Central Tendency Consider the following set of data describing the age distribution of 11 cows: 1,2,3,4,5,6,7,8,9,10,11 Arithmetic Mean Is average measurement taken and is used when the data is distributed normally with a moderate amount of variability. It is calculated as follows:
M = Sum value of all measurements Total No. of measurements
= 66 = 6.6
11 Geometric Mean The mean can also be calculated to compare ratios such as antibody titers (geometric mean titers) that change exponentially. The geometric mean is the average of the logarithmic values converted back to base 10 numbers: Example: four HI titers are given as the following dilutions: 2, 4, 8, and 16
GM = (x1,x2,x3, x4… xn)1/n
= (2* 4*8*16)1/4 = 5.66 Median This is the mid-point between the minimum value and maximum of a range of data and the median is often used when the data has a wide range of values and varies greatly. In the example with 10 cows the median (middle) value is 6. Mode Is the value that occurs most frequently and it is used to highlight a common data point. In the examples above, there is no mode value. Various statistical tests can be applied to compare whether the null hypothesis that the means or medians from two populations are not the same and this will be covered later in the course. Measures of Disease Frequency Ratio A ratio is a way to compare two counts and is expressed as a fraction where the numerator is separate from and not included in the denominator.
Version 21_12_2009 Page 35
Veterinary Field Epidemiology in Action Course Notes
Ratio = a / b
Assumption:
1. The numerator is not included in the denominator Application: A field epidemiologist counts 1020 ducks and 310 geese in one village. There are many more ducks than geese present and it can be expressed clearly using numbers in the form of a ratio. The ratio of ducks to geese is as follows:
Ratio (ducks/geese) = 1020 / 310 = 3.3 There are 3.3 many times more ducks as there are geese in this village. Proportion A proportion is used to compare one part to a larger population from which it comes where the numerator is also included in the denominator. Note that proportions do not consider time in the equation so we must specify using words what time period the proportion is applicable to. Using the same village count data a field epidemiologist may want to know what proportion of all waterfowl in a village are geese.
Proportion = a / a+b
Proportion = 310 / 310+1020 = .23 (23%) Approximately 23% of the waterfowl in the village are geese at this time. Therefore the percentage (proportion) of remaining waterfowl that are ducks is 77% (0.77). In addition to these simple use for counts, a proportion can also be applied to calculate and compare probabilities for two different exposure groups within a population (as seen in the two by two table presented in the previous lecture). To review:
Exposure Factor
Disease + No Disease - Total
Yes -Loose
Chickens
10 22 32
No- Confined Chickens
11 37 48
Total 21 59 80
Pr(Loose/D+) = 10/21 = .48 (48% of D+) Pr(Confined/D+) = 11/21 = .52 (52% of D+)
TOTAL = 1.00 (100% of D+ farms)
Pr(Loose/D-) = 22/59 = .37 (37% of D-) Pr(Confined/D-) = 37/59 = .63 (63% of D-)
TOTAL = 1.00 (100% of D- farms)
Version 21_12_2009 Page 36
Veterinary Field Epidemiology in Action Course Notes
Combined Probabilities Recall that risk is measured in terms of probabilities that are expressed as a proportion. When it is necessary to consider risks together and combine them, there are two mathematical rules for combining risks, the additive rule and the multiplicative rule to consider. The additive rule is used when we use several probabilities in an “either/or” situation. Here is an example: What is the probability that observing loose chickens are associated with either vND disease positive farms or vND disease negative farms?
Pr (loose/ D+ or D-) = p1 + p2 = .48 + .37 = 0.85 The multiplicative rule is used when we combine several probabilities using the word “and”. What is the probability that observing loose chickens is associated with both vND disease positive farms and vND disease negative farms?
Pr (loose/ D+ and D-) = p1 X p2 = .48 X .37 = 0.18 These calculations agree with what you would expect using common sense reasoning. Rates A rate is a risk (probability) that is calculated over a given time period. A rate describes how quickly cases are developing over time. We can use either an approximate method or an exact method to calculate an Incident Rate (Dohoo et al, 2003). For the approximate method used to calculate incident rate the denominator is the size of the population at risk (PAR) at the midpoint in the time period. This method is convenient and used often when we have a population that is changing frequently (open population) over a period of time. Because the incidence is considered over a longer time period it is also called a Cumulative Incidence Rate (disease incidence that builds up over time).
(Cumulative) Incident Rate = IR = # Events in a specific time period Average PAR at mid-point
Assumptions: 1. All animals are negative for the disease in question at the beginning of the time period; 2. All animals that died are due to the disease (although mixed infections do occur); 3. The number of animals at the beginning and midpoint are known.
Application: There were 40 new cases of rabies diagnosed in cattle in a district over a one year period. The cattle population was estimated to be 1,000 in January at the beginning of the year but many cattle were marketed in May of that year leaving 660 cattle remaining by the end of June.
IR = 40 rabies cases = .06 660 cattle
The cumulative incident rate is .06 with no unit of measure.
Version 21_12_2009 Page 37
Veterinary Field Epidemiology in Action Course Notes
The result can be difficult to interpret by itself so it is most useful when we compare one IR with another. If we multiply the incident rate by some standard population size then we can compare incident rates in two different populations by creating a very basic type of standardized rate. Standardized rates will also be discussed below but it is important to note that we can only compare incident rates from two populations if they are standardized using the same method. The simplest way to standardize the example given above is to multiply the incidence rate (IR) by either 100, 1000 or 10,000 or some other number (human health incidence rates are often compared per 100,000 population). There were 60 cases of rabies in cattle per 1,000 head of cattle in a one year period in this district (IR per 1,000 = .06 X 1000 = 60).
A more exact method for defining Incident Rate the denominator is given in “animal count-time” units, which is the product of the count and the time period:
Incident Rate = IR = # Events in a specific time period PAR X specific time period
In Module 1.2, Example 6 the risk of becoming a positive case according to the case definition (fecal culture positive) without animal-time units was calculated as seen below:
Risk = R = 167 total persons infected on day 0 250 total persons at risk on day 0
R = .67 Using the exact method, the rate of risk for developing Salmonellosis in workers is given by the following risk rate:
IR = 167 total persons infected over 4 months 250 total persons at risk over 4 months
IR = 167 cases (250 persons X 4mo) IR = .167 cases per person-month The meaning of the values obtained is made useful by comparing the risk of two or more populations. Incidence Disease Incidence means the number of NEW cases that develop over a certain time period. Incident cases and time at risk can be shown using either a graph or a spreadsheet table. The unit of “animal-time” is very similar meaning to the human resource measure of “person-years” (or PY) that a manager might use to calculate workload demand among several workers. Incident-time calculations can take some time to calculate when the population changes a great deal.
Version 21_12_2009 Page 38
Veterinary Field Epidemiology in Action Course Notes
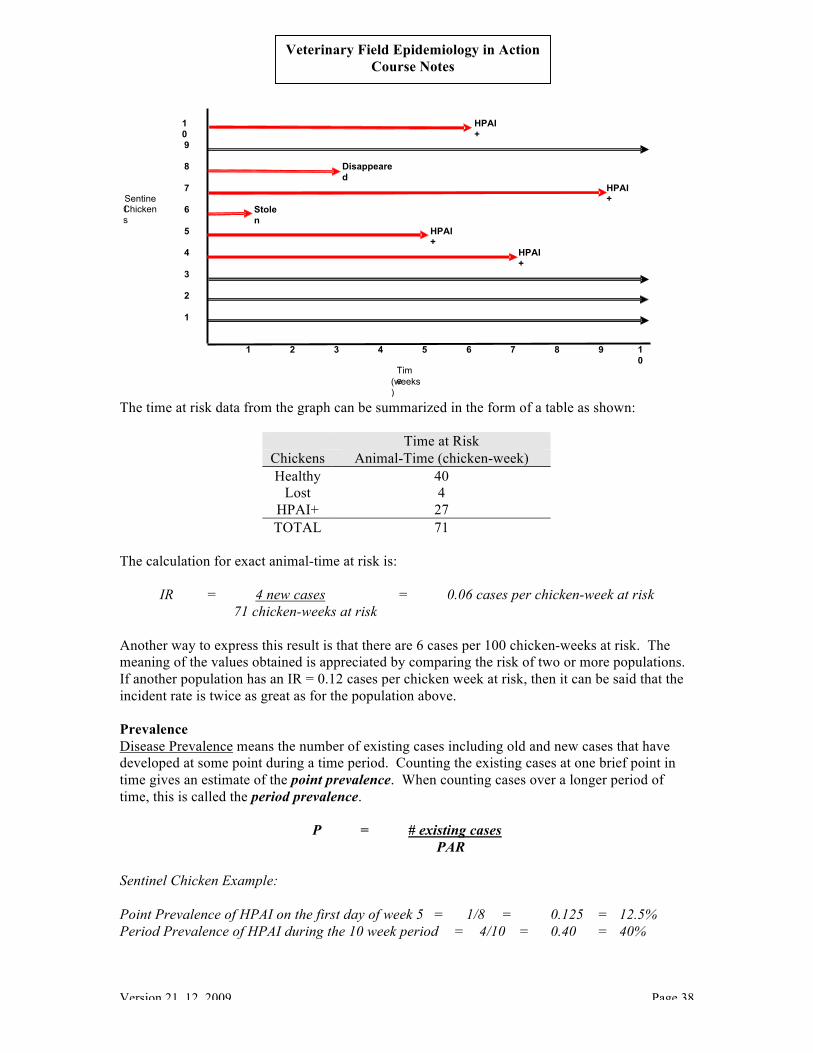
The time at risk data from the graph can be summarized in the form of a table as shown:
Time at Risk
Chickens Animal-Time (chicken-week) Healthy 40
Lost 4 HPAI+ 27 TOTAL 71
The calculation for exact animal-time at risk is:
IR = 4 new cases = 0.06 cases per chicken-week at risk
71 chicken-weeks at risk
Another way to express this result is that there are 6 cases per 100 chicken-weeks at risk. The meaning of the values obtained is appreciated by comparing the risk of two or more populations. If another population has an IR = 0.12 cases per chicken week at risk, then it can be said that the incident rate is twice as great as for the population above. Prevalence Disease Prevalence means the number of existing cases including old and new cases that have developed at some point during a time period. Counting the existing cases at one brief point in time gives an estimate of the point prevalence. When counting cases over a longer period of time, this is called the period prevalence.
P = # existing cases PAR
Sentinel Chicken Example: Point Prevalence of HPAI on the first day of week 5 = 1/8 = 0.125 = 12.5% Period Prevalence of HPAI during the 10 week period = 4/10 = 0.40 = 40%
10
HPAI+
9 8 Disappeare
d 7 HPAI
+ Sentinel Chickens
6 Stolen
5 HPAI+
4 HPAI+
3 2 1
1 2 3 4 5 6 7 8 9 10
Time (weeks
)
Version 21_12_2009 Page 39
Veterinary Field Epidemiology in Action Course Notes
Relationship between Incidence and Prevalence The prevalence of a disease in a population is dependent on the incidence rate as depicted below (Adapted from Toma, 1999)
In quantitative way, prevalence relates to incidence of new cases in the following way:
P = I X D I X D+1
Where: P is prevalence I is incidence D is duration of time Assumptions:
1. The population is stable 2. The incidence of disease remains constant
Unless these two assumptions can be met, then it is difficult to estimate disease prevalence from incidence data. Example: The sub-clinical incidence rate of udder infection in a goat herd was 0.07/goat-year (7 new cases/100 goats). The mean duration of udder infection is 1.5 months (0.125 years) and the population is stable.
P = 0.07 X 0.125 = 0.0088 = 0.11 = 11% 0.07 X 0.125+1 0.0788 At any time, 11% of the goats in this herd can be expected to have sub-clinical udder infection. In a highly susceptible population, as the incidence of a disease increases, the disease prevalence increases greatly to the point that eventually there are very few susceptible animals remaining and
Incidence
Prevalence
New Cases
> Recovery > Carrier > Re-emergence > Death
Version 21_12_2009 Page 40
Veterinary Field Epidemiology in Action Course Notes
the incidence also decreases for this reason. The extreme case is when the disease is fatal for a high percentage of the population. Deciding Whether to Calculate Incidence or Prevalence Whether to measure incidence or prevalence will depend on the disease and how it exists in the population over time.
For a disease that may develop quickly (e.g. HPAI) it would be better to measure either disease incidence (cumulative or incidence density) or point prevalence. Period prevalence could under-estimate the amount of disease present in the population depending on how it is applied;
For a disease where the animal recovers and can become re-infected, it is important to identify and separate new incident cases from repeat incident cases (e.g. mastitis in cattle);
For a disease that takes a long time to develop (e.g. BSE, TB), prevalence estimates or incidence could both be appropriate to use depending on what question you are trying to answer.
Crude Rates and Adjusted Rates
1. Crude Morbidity Rate: Describes the number of cases that are clinically affected of the population at risk over some identified time period.
Morbidity Rate = # clinically ill PAR
Example: Morbidity Rate = 150 ill = 13.6% 1100 at risk 2. Crude Mortality Rate: Describes the number of deaths in the PAR over some identified
time period.
Mortality Rate = # deaths PAR
Example: Mortality Rate = 50 dead = 4.5% 1100 at risk
3. Infection Rate: Describes the number of infected individuals in the PAR over some
identified time period.
Infection Rate = # infected PAR
Example: Infection Rate = 20 = 67% 30
4. Secondary Attack Rate: Describes how much the disease agent spreads to other animals (secondary cases) over a certain period of time.
Version 21_12_2009 Page 41
Veterinary Field Epidemiology in Action Course Notes
6. Specific Rates: Describes the number of clinical cases or deaths within a certain part of
the population being considered based on sex, age, breed, production level, etc. Example: The crude mortality rate in a flock of pekin ducks was 50 / 1100 = 4.5%. The farmer is sure that more ducklings died than adult ducks. Before the disease occurred, 20% of the population was ducklings and 30 of 50 deaths occurred in ducklings (a duckling is defined as a duck less than 20 weeks of age). The age-specific rate in this case is as follows: Duckling Age-Specific Mortality Rate = 30 = 13.6% of ducklings died 1100 X 0.2 Duck Age-Specific Mortality Rate = 20 = 2.3% of adult ducks died 1100 X 0.8
7. Other Rates and Measures: Depending on the purpose and target group there are many other rates can be calculated using a 2 X 2 table. Several other commonly used measures of risk are presented below:
Relative Risk What is the risk of being a positive case if exposed to a risk factor or not exposed to a risk factor? This is measured by calculating the relative risk:
Relative Risk = Risk exposed / Risk unexposed Attributable Risk How much of the risk of being a positive case is due to exposure to the risk factor? This risk is measured by calculating the attributable risk:
Veterinary Field Epidemiology in Action Course Notes
Recall Lesson 1, Example 9: vND and Loose Chickens
Exposure Disease + No Disease - Total Yes-
Loose Chickens
10 22 32
No- Confined Chickens
11 37 48
Total 21 59 80 R Exposed = 10/32 = 0.31 R Unexposed = 11/48 = 0.23 Relative Risk = .31 / .23 = 1.3 The relative risk for vND positive cases is 1.3 times higher when loose chickens are observed than when loose chickens are NOT observed. Attributable Risk = .31 - .23 /.31 = 0.26 The proportion of vND positive cases attributed or associated with observing loose chickens is 0.26. These basic calculations have allowed a clearer understanding of the importance of the risk (exposure) factor in quantitative terms. The result can still be considered for further discussion. As noted previously it may be necessary to change the type of data or the way we collect the data in order to more fully assess the risk factor. Gathering useful data can be a trial and error process but the work of the field epidemiologist is to collect the best data possible to address the Null Hypotheses under field conditions. Stratification Previously we compared the rate of disease in two age groups of ducks in order to determine if they were different. This is a way of comparing of the data that will provide meaning to organized data. Many risk associations are hidden when the population is considered as a whole and so it is necessary to separate or stratify the data into layers or levels as we did for different age groups. The most important assumption is that the population at risk (PAR) is well defined (a census to provide a population estimate for an area). Consider the following example of stratified data:
Raw Data Strata
Ruminant Farms
Non-Ruminant
Farms Species Total # Farms
5040 200 Cattle 1000 Sheep 40 Pigs 200 Goats 4000
Version 21_12_2009 Page 43
Veterinary Field Epidemiology in Action Course Notes
The unit of interest is “farm”. Stratifying data into levels is very useful for several reasons:
1. Stratification allows us to determine if differences in the rates observed are real or whether they are an effect of age, sex, species, breed or other factors that describe the population. Stratification separates out effects due to age, sex, breed and other possible disease risk factors that can be assessed for each sub-group.
2. By separating out risk factors, stratification allows us to control for confounding factors
such as age. There is no way to test for confounding but stratification will allow is to see whether confounding may be present and to control confounding. (Recall: A confounder is a factor that is independently associated with a disease outcome variable and a risk factor but is not itself a cause of the disease).
Standardized Rates In order to compare the rate of disease in two areas the first step is to stratify both populations as done in the example above.
Overall Crude Incidence Rate = 4% Overall Crude Incidence Rate = 17% Note that Area 2 has five times more animals than Area 1 but they have roughly the same number of cases. There are two ways to standardize the incidence rates for Area 1 with Area 2 so that they can be compared.
1. Direct Standardization: Use a standard (reference) populations of 10,000 farms for each species and multiply by species specific rates above:
Adjusted Crude Incidence Rate = 30% Adjusted Crude Incidence Rate = 43% Note that the unadjusted crude rates are different from the adjusted crude incidence rates.
Version 21_12_2009 Page 44
Veterinary Field Epidemiology in Action Course Notes
2. Indirect Standardization: The specific rates from one area are used as the standard
reference rates and are applied to the other area so that the number of outbreaks is adjusted so that they can be compared on the same number of cases for each species.
The expected crude incidence rate = 497 / 1140 = 44% in Area 2. Conclusion:
1. The expected adjusted rate for Area 2 (44%) is very similar to the adjusted result using direct standardization (43%).
The original crude incidence rate compared with the expected incident rates for Area 2 can be expressed as a ratio called the Comparative Incidence Ratio:
Comparative Incidence Ratio Area 2 = Crude IR / Expected IR
CIR Area 2 = 17 / 44 = 0.4 Conclusion:
1. The crude IR for Area 2 is under one half (0.4) the value of the expected adjusted rate. Introduction to Measures of Association
Version 21_12_2009 Page 45
Veterinary Field Epidemiology in Action Course Notes
2 X 2 Contingency Table:
Exposed Disease + Disease - Total Yes a b a+b No c d c+d
Total a+c b+d a+b+c+d Risk Ratio Risk Ratio (RR) is another name for the Relative Risk measure of association presented in the 2X2 table above. It is important to note that RR can only be calculated when we know the denominators a+b (total exposed) and c+d (total unexposed).
Relative Risk or Risk Ratio = a / a + b c / c + d Odds Ratio When the true number of exposed and unexposed populations is not known an odds ratio can be calculated to give an approximate estimate of the relative risk. The formula is:
Odds Ratio = a X d b X c Example: For the example of loose chickens and vND the odds ratio is:
Odds Ratio = 10 X 37 = 370 = 1.5 22 X 11 242 Note that the relative risk (RR) gave a similar value of 1.3 as the odds ratio value of 1.5. Lesson Summary: 1. Counting data involves processing data including the collection, classification,
grouping/summarizing and presenting data so that it will be useful; 2. Data can originate from field, laboratory and other sources and can be used to describe
events with respect to time, animal/human and place; 3. To compare data is necessary to be formatted in order to organize analyze data further.
Types of data the field epidemiologist deals with include interval, continuous and discrete forms;
4. The Normal Distribution and the Central Limit Theorem are key concepts that form the
scientific basis for sampling and making conclusions; 5. Disease Incidence and Prevalence are closely related concepts that help to describe the
relationship between time, person/animal and place. Incidence measures the number of new cases over time and allows for the calculation of incident risk rates. Prevalence measures the number of existing cases at some point or period in time. Comparisons between populations can only be made when we compare the same type of incidence or prevalence measure across populations;
Version 21_12_2009 Page 46
Veterinary Field Epidemiology in Action Course Notes
6. Incidence Rates and Risk Rates are specific tools that allow comparison of risks for
different populations. Risk rates are stratified and adjusted directly or indirectly according to specific characteristics such as age, sex, etc. Stratified and adjusted rates reveal hidden associations and deal with confounding;
7. Measuring the association between exposure (risk) factors and outcomes is commonly
assessed by the field epidemiologist using a 2 X 2 Contingency Table. The 2 X 2 table allows for the calculation of Risk Ratios and/or Odds Ratios. These ratios provide initial risk estimates for the exposure factors and their association with disease outcomes.
Version 21_12_2009 Page 47
Veterinary Field Epidemiology in Action Course Notes
Module 1.4 How Epidemiology Supports Government Regulatory Services Wantanee Kalpravidh FAO Regional Project Coordinator for HPAI Workshop Notes:
Version 21_12_2009 Page 48
Veterinary Field Epidemiology in Action Course Notes
Module 2.1 Explain the Purposes and Use of Surveys and Surveillance Suwicha Kasemsuwan Faculty of Veterinary Medicine Kasetsart University Definition of and Purpose of Animal Health Surveillance Surveillance is the systematic ongoing collection, collation and analysis of data and the timely dissemination of information to those who need to know so that action can be taken (OIE Terrestrial Animal Health Code - 2007). In this sense, surveillance is very practical and results-oriented. The goals of animal health surveillance are presented below:
1. Demonstrate absence of disease or infection; 2. Show the occurrence or distribution of the disease or infection; 3. Early detection of exotic or emerging diseases. (Terrestrial Animal Health Code - 2007)
An animal health surveillance system involves one or more activities that produce information on the health, disease or zoonosis status of animal population. A survey is an investigation in which information is systematically collected using samples from a defined population group within a defined time period.
Version 21_12_2009 Page 49
Veterinary Field Epidemiology in Action Course Notes
While surveillance uses targeted data collection and analysis that leads to specific actions, monitoring is the ongoing effort to collect data to detect changes or trends in the occurrence of a disease that is of interest. Surveys are used to evaluate the health status of a population or to evaluate policies related to disease control and prevention. The purpose of surveillance is to assess and manage risk effectively in order to minimize negative impact on public health, trade in animals and animal products and animal health and welfare (Pfeiffer, 2008). Specific objectives of surveillance are as follows:
1. Detect diseases (early); 2. Monitor disease trends; 3. Control disease (endemic and exotic); 4. Support claims of being free from a disease; 5. Provide data to conduct risk analysis for animal or human health; 6. To support policy development; 7. Detect newly emerging diseases, vectors and provide an early warning system; 8. Monitor for endemic diseases and vectors; 9. Assess the impact of disease and control measures used; 10. Provide data for further analysis including risk assessment and disease management
(OIE Terrestrial Animal Health Code - 2007) Components of a Surveillance System A surveillance system can gather data from the following sources:
Clinical signs Export control Slaughterhouse Diagnostic laboratories Surveys
A surveillance system component (SCC) is a method of surveillance that includes one or more activities that produces information on the health, disease or zoonotic status of animal populations (OIE Terrestrial Animal Health Code - 2007). The SCC has the ability to detect new disease, can demonstrate disease freedom and includes either active or passive surveillance.
Version 21_12_2009 Page 50
Veterinary Field Epidemiology in Action Course Notes
Characteristics of Surveillance Programs Surveillance programs have the following characteristics:
Objectives are defined; Hazards are defined; Define cases using a case definition – unit of interest, diagnostic methods are specified to
classify an animal or epidemiological unit* as a case; Target population defined by type (area, species, etc.), sampling intervals and timing; Data is collected and processed; Data is analyzed; Communication of results (Pfeiffer, 2008).
*An epidemiological unit (unit of interest) can be animals or groups of animals affected by a hazard that data will be collected from. Recall that a case can be an animal with or without clinical signs that the disease agent can be isolated from. An outbreak is an occurrence of at least one case of disease or infection within the unit of concern (epidemiological unit).
Surveillance Data Data used to develop surveillance programs should describe the epidemiology of infection (agent-host-environmental interactions), animal movements and trading patterns, national animal health regulations, history of imports and biosecurity measures taken. A flow chart can be constructed to identify the points in the food chain where the hazard may occur between the farm and the human consumer. Sources of data may include the following:
Veterinary Field Epidemiology in Action Course Notes
Identifying the National Stakeholders In order for a surveillance system to be successful all persons having an interest in the outcomes must be willing to cooperate and comply with requirements for testing, etc. This requires an inter-disciplinary approach. Technical aspects (tests) must be transferable and useful under field conditions.
Interpreting Results of the SCC Sources of error that must be considered include the following:
o Case detection o Selection of subjects o Information – case definition, diagnostic tests, methods for data collection
Validity Bias can arise in passive surveillance by the level of case reporting and the diagnostic tests used. Bias can arise in conducting active surveillance in how subjects are selected, the diagnostic tests used and how data is collected. Selection Bias Cause: Systematically choosing subjects that do not represent the population. Result: Cannot extend the results to the whole population. Solution: Select subjects randomly from a complete sampling frame of a representative sample. Bias and Diagnostic Tests Causes: Since no test is perfect, inaccurate or unreliable test methods are an issue to be dealt with. Result: Misclassification of positive and negative animals due to poor sensitivity or specificity.
Version 21_12_2009 Page 52
Veterinary Field Epidemiology in Action Course Notes
Solution: Calculate test sensitivity or specificity to quantify bias. Overview of Surveillance Program Components
Version 21_12_2009 Page 53
Veterinary Field Epidemiology in Action Course Notes
Types of Surveillance Surveys can be structured so that subjects are chosen randomly such as systematic sampling at slaughter houses and random surveys. Surveys can also be structured where subjects are chosen non-randomly including the following examples:
Passive disease reporting Disease control programs Targeted screening Ante and post-mortem inspection Laboratory records Biological specimen banks Sentinel units Field observations Farm production records
Data may be collected actively by seeking samples or passively by waiting for volunteered samples to arrive. Data may also be collected for a specific disease or to profile the occurrence of more than one disease in the population (e.g. serological profiles). Surveillance Data Collection In order to get up to date, unbiased and representative data, both passive (scanning) and active (targeted) methods can be used. Active surveillance can be based on probability based sampling, purposive sampling and expert opinion. Data Collection Methods
Scanning (passive) o laboratory submissions / veterinary reporting
participatory surveillance • community animal health service
o syndromic surveillance o molecular surveillance
Strategic/Targeted (active)
Version 21_12_2009 Page 54
Veterinary Field Epidemiology in Action Course Notes
o probability-based
observational and intervention studies o purposive
o expert opinion Sentinel Surveillance A sentinel herd or flock is a cohort (group) of animals selected at selected locations either randomly for endemic disease or purposefully for risk based surveillance of exotic disease. Sentinels are monitored at intervals over a certain time period in order to target surveillance using a risk-based strategy. The objectives of sentinel surveillance for endemic diseases are to monitor temporal (over time) occurrence, to assess the impact of the control efforts and the risk of exposure. For exotic diseases, the objective is to detect the disease agent when it first arrives and to detect the presence of the vector that may be involved. Sentinel animals must be unexposed to the disease agent and are placed in areas where the risk is considered to be greatest. Examples of sentinel surveillance include Bluetongue in Germany and Arbovirus in Australia. Syndromic Surveillance Syndromic surveillance is part of an early warning system that permits faster detection of outbreaks based on symptoms. Use of cold medication is monitored by human health officials to assess for the presence of Influenza season. When animals are sick, producers and veterinarians may use more antibiotics or vaccines to treat animals. Syndromic surveillance relies on the availability of data for drug sales outlets, hospitals, and laboratories. Although it is a sensitive method, it is important to verify the true cause through further investigation and analysis including application of statistics. Other public health examples include:
911 calls Drug sales Absent from work Emergency admissions Emergency discharge records Managed care records
The U.S. Center for Disease Control and Prevention (CDC) has developed a BioSense System and Molecular Surveillance Systems (e.g. FoodNet).
Version 21_12_2009 Page 55
Veterinary Field Epidemiology in Action Course Notes
Other Surveillance Approaches Participatory Disease Surveillance (PDS/R) Approach These are community based health systems that are developed at the local level that includes active case searching by local residents. The approach takes into account local concerns, culture and includes informal interviews with local residents. Several different methods are used to verify the accuracy and reliability of the data including follow-up with traditional epidemiological investigations. PDS uses mapping to trace interactions between animal owners. Integrating Data into the Surveillance System Data processing systems are developed to enter, store and retrieve data for further analysis that can be applied at national, regional and global levels. Data can also be shared among human and animal health agencies at these levels. Examples include GLEWS and OFFLU. Lesson Summary:
1. Surveillance is the systematic ongoing collection, collation and analysis of data and the timely dissemination of information to those who need to know so that action can be taken (OIE Terrestrial Animal Health Code - 2007).
2. The goals of animal health surveillance are to demonstrate absence of disease or
infection, show the occurrence or distribution of the disease or infection and early detection of exotic or emerging diseases. (Terrestrial Animal Health Code - 2007).
3. A survey is an investigation in which information is systematically collected using
samples from a defined population group within a defined time period.
4. A surveillance system can gather data from the following sources: clinical signs, export control, slaughterhouse, diagnostic laboratories, and surveys.
5. A surveillance system component (SCC) is a method of surveillance that includes
one or more activities that produces information on the health, disease or zoonotic status of animal populations (OIE Terrestrial Animal Health Code - 2007).
6. Surveys can be structured so that subjects are chosen randomly such as systematic
sampling at slaughter houses and random surveys. Surveys can also be structured where subjects are chosen non-randomly.
7. Sources of error that must be considered include random error (chance) and
systematic error (bias).
8. Data can be collected either passively (scanning) or actively (targeted). Sentinel and syndromic surveillance are two examples of targeted surveillance.
9. Participatory approaches are culturally adapted and developed at the local level to
provide active case searching by local residents.
Version 21_12_2009 Page 56
Veterinary Field Epidemiology in Action Course Notes
Module 2.2 Properties of Diagnostic Tests Dr. Kachen Wongsathapornchai Epidemiologist, Thailand Department of Livestock Development Reliability
How the test give consistent results when the test is performed more than once on the same individual under the same conditions.
Repeatability How the test give consistent results when the test is performed more than once under the
different conditions. Validity
The validity of a test measures how well the given test reflects the true status of an animal (or another test of known greater accuracy).
The indication of which the test is capable of differentiating the presence or absence of a disease concerned
2 x 2 table
Disease status
D+ D-
T+ TP FP Test status
T- FN TN Notation:
‘D+’: Disease present ‘D-’: Disease absent ‘T+’: Positive test result ‘T-’: Negative test result TP: True positive o FP: False positive TN: True negative FN: False negative
Sensitivity The ability of a test to detect individual who actually has the disease Know that individual is diseased See if the test will correctly identify as diseased
Disease status
D+ D-
Test status T+ TP FP
Version 21_12_2009 Page 57
Veterinary Field Epidemiology in Action Course Notes
T- FN TN Sensitivity (Se) = Probability that infected animals are correctly identified as positive by a test = P(T+ | D+) = TP/(TP+FN)
Specificity The ability of a test to correctly identify individual who actually does not have the
disease Know that individual is healthy see if the test will correctly identify as healthy
Disease status
D+ D-
T+ TP FP Test status
T- FN TN Specificity (Sp) = Probability that non-infected animals are correctly identified as negative by a test = P(T- | D-) = TN/(TN+FP)
Note Sensitivity and specificity are inversely related and in the case of test results measured on
a continuous scale they can be varied by changing the cut off value In doing so an increase in sensitivity will often result in a decrease in specificity Increasing the cutoff
o More difficult to classify as test positive o Increase test specificity, Decrease test sensitivity
Decreasing the cutoff o More animals are classified as test positive o Increase test sensitivity, Decrease test specificity
Choice of a cutoff depends on several factors o Purpose of testing e.g. screening o Relative impact of FP, FN
Economics Social or political
Depends on the diagnostic strategy To find the diseased animal: FALSE NEGATIVE are to be minimized and a limit
number of false positive is acceptable (a test with high sensitivity and good specificity is required)
To make sure that every test positive is “truly disease” : minimized FALSE POSITIVE and limited number of false negative is acceptable (a high specificity and good sensitivity is required)
Biological factors affecting Se Stages of infection Johne’s disease
Version 21_12_2009 Page 58
Veterinary Field Epidemiology in Action Course Notes
o Stage I (preclinical and not shedding bacteria) o Stage II (preclinical and shedding) Stage III (clinical and shedding)
§ No relationship between Se and disease prevalence exists. However, distribution of biological factors (stage of disease etc) may be different between high and low prevalence populations
§ Eradication process Removing TP and FP FP gone => Decrease in prevalence and increase in Sp Decrease in Sp in population that has experienced a recent epidemic (but has
recovered) § Decrease in Sp between experimental trials and when taken to the field
Experimental animals are often pathogen-free animals Apparent prevalence (AP)
Proportion of animals positive to the test TP+FP/N
§ True prevalence (P) Proportion of animals that are truly infected TP+FN/N
§ Prevalence estimation o AP+Sp-1/Se+Sp-1
Predictive Value Sensitivity & specificity
o Know true status of animals See how a test is performed Predictive values
o Know a test results want to know the probability of that animal being truly infected
Positive Predictive Value (PPV) Proportion of test-positive animals that are truly infected
= TP/(TP+FP)
=
Negative Predictive Value (NPV) Proportion of test-negative animals that are truly not infected
= TN/(TN+FN)
=
Effect of Prevalence on Predictive Values
Version 21_12_2009 Page 59
Veterinary Field Epidemiology in Action Course Notes
Relationship between PPV and Specificity
Relationship between NPV and Sensitivity
Use a test with High Se and High NPV to:
Reduce the number of false negatives Avoid the introduction of a disease
Use a test with High Sp and High PPV to:
Confirm a diagnosis Avoid the unnecessary slaughter of animals
Version 21_12_2009 Page 60
Veterinary Field Epidemiology in Action Course Notes
Using Multiple Tests
Why use more than 1 test? To increase Se To increase Sp To compare diagnostic tests
How? Two tests at the same time One test after the other
Problem Test dependency
Testing in Series
1st Test 2nd Test Conclusion
Positive Positive Positive
Positive Negative Negative
Negative Not done Negative
The results of all tests must be positive A second test will only be applied if the result to the previous test was positive You wish to increase specificity (Sp) and the positive predictive value (PPV)
Testing in Parallel
1st Test 2nd Test Conclusion
Positive Not done Positive
Negative Positive Positive
Negative Negative Negative
The results of all tests must be negative A second test will only be applied if the result to the previous test was negative You wish to increase sensitivity (Se) and the negative predictive value (NPV)
Lesson Summary:
1. Reliability refers to consistent results when the test is performed more than once on the same individual under the same conditions.
2. Repeatability is when the test gives consistent results when the test is performed
more than once under the different conditions.
3. Validity of a test measures how well the given test reflects the true status of an animal (or another test of known greater accuracy).
Version 21_12_2009 Page 61
Veterinary Field Epidemiology in Action Course Notes
4. Sensitivity is the ability of a test to detect individual who actually has the disease. 5. Specificity is the ability of a test to correctly identify an individual who actually does
not have the disease.
6. Predictive value is the probability of that animal being either truly infected or truly not infected.
Version 21_12_2009 Page 62
Veterinary Field Epidemiology in Action Course Notes
Module 2.3 Design, Develop and Deliver a Useful Questionnaire Dr. Theera Rukkwamsuk Faculty of Veterinary Medicine Kasetsart University Use of Questionnaires Questionnaires are used to assess outcomes from studies and investigations, for quality assurance, to determine health care needs (needs assessment) and to assure client satisfaction with services delivered. Ideally questionnaires help to answer research questions and define exposure (independent) variables associated with a health outcome. Useful questionnaires are valid (measure what we intend to measure) and reliable (consistent) and should be cost and time effective (practical) to deliver. Questionnaires can also be use to assess effect modification which measures the effect of exposure variables on outcome variables among various subgroups of a population (e.g. age, breed, etc.) The method used to deliver a questionnaire should achieve the highest response rate possible in order to avoid obtaining biased results. A useful questionnaire should collect unbiased information to address the research question (null hypothesis) by assessing exposure (independent) variables, the outcome (dependent) variables, confounding factors related to both and effect modification. Design of Questionnaires Design and delivery of questionnaires is very challenging and takes practice to improve over time. The goals and objectives of the questionnaire should first be clearly defined. The initial step in designing the questionnaire itself is to make a list of exposure variables and outcome variables you want to assess when deciding which questions and how many questions to include. A brief and targeted questionnaire is far more useful than a long and vague questionnaire. In addition, note that the responders may develop “survey fatigue” or tiredness in answering too many unnecessary questions. Delivery Modes Self Administered Questionnaires may be delivered where persons provide answers using either mail out questionnaire or internet based “self-administered” types. Response rates for successful self-administered questionnaires commonly achieve a 65% response rate (No. returned/No. mailed out). Interviewer Questionnaires may be delivered in person either using a face to face or telephone interviews. The non-response rate for each may differ.
Version 21_12_2009 Page 63
Veterinary Field Epidemiology in Action Course Notes
Answer Formats Answers can be obtained by structuring responses as either closed formatted or open formatted questions. Closed Format Closed formatted questions are formatted by the researcher before the questionnaire is presented to the responder. Closed formatted questions force the responder to choose from a selected number of responses that may either be presented as nominal or ordinal coded data that is coded before the questionnaire is delivered. The data may be considered as categorical data or as simple count data depending on the question asked. Advantages:
They can be answered quickly; Easy to code data; Does not depend on ability of responder to express themselves; Collection of data categories instead of specific numbers helps to ensure the privacy and
confidentiality of data collected. Disadvantages:
Conclusions are limited based on the initial choices (options) provided in the questionnaire;
Some responses may require qualification or explanation. Open Format An open ended question is asked of the responder and this method allows for gathering information as free text. Responses are coded after the responses are received by the researcher. Advantages:
Answers are not restricted by the researcher Greater freedom of expression Reduced bias due to unlimited response range Answers can be qualified and explained
Disadvantages:
Responses may be difficult to code, categorize and analyze quantitatively; The researcher may misclassify the responses when coding creating misclassification
bias; It is time intensive and expensive to enter data.
Structuring Questionnaires Cover Letter or Handout and Thank You (Note) It is important to provide a cover letter (self administered) or handout (face to face) that explains the purpose of the questionnaire, the stakeholders, and confidentiality of data collected, and explain the final use of information provided. Privacy and confidentiality should be dealt with proactively to encourage participation as much as possible. It cannot be overstated that a useful questionnaire should be as brief as possible in order to achieve the most important questions of interest.
Version 21_12_2009 Page 64
Veterinary Field Epidemiology in Action Course Notes
Questionnaires require that the responder volunteer their time to provide responses. A thank you (sometimes as a note) should be provided to all responders for taking the time and care to complete the questionnaire. Questions Begin the questionnaire with interesting, easy and non-threatening questions in order to engage the responder and encourage cooperation. You may group questions under various headings to make the questionnaire easier to answer. Avoid the use of “leading questions” that influence people to provide a particular answer that is biased by the way the question is asked. Study the examples below and provide alternative questions. Example: Bringing animals from outside your farm into your herd can introduce disease. How many animals have you brought onto your farm during the past 12 months? Writing Good Questions Seek Truthful Answers Questions should obtain a truthful answer. Make it clear that all responses are confidential and that only combined results are presented in when reporting the findings. Avoid asking questions with consequences (legality of a behavior). Self administered questionnaires may result in more honest answers as long as the questionnaires are coded to be anonymous (use a number instead of a name to identify responders). Ask for Small Pieces of Information at One Time Put questions in a logical order and avoid asking responders to fill out a large table in self administered questionnaires. Allow for all Possible Answers For closed format questions allow for choices such as:
Other (please specify) ____________ None of the above A combination of the above
Allow for positive and negative responses in an equal way. Be Clear and Avoid Ambiguous Questions
Questions should be stated objectively without subjective values or emotion; All responses should be unique and exclude other possible answers (mutually exclusive); Avoid the use of jargon and “buzz words” that responders will not understand (e.g.
anthelmintic). Avoid Questions Related to Social Desirability and Culture Avoid social judgment on issues such as drugs, smuggling, and other illegal or activities with social implications. It is also important to be culturally sensitive. Concentrate on Factual Questions with Clear, Objective Answers It is best to stay focused on obtaining objective information. Assessing attitudes is a branch of questionnaire design that will require expertise of social scientists.
Version 21_12_2009 Page 65
Veterinary Field Epidemiology in Action Course Notes
Standardization and Quality Control of Questionnaires Useful questionnaires are ones that give truthful, clear and accurate information when they are given to all responders. The way that the questionnaire is designed and delivered determines the usefulness of the data generated. Standardization and quality control are necessary to ensure the results are accurate and valid related to their intended purpose. Conduct a Pre-Test of the Questionnaire Every questionnaire MUST be pre-tested before it is used to collect official data. Ideally the questionnaire will be administered to 20 to 30 test responders. Make changes in the questionnaire based on its performance and feedback from responders. The structure and methods of the questionnaire must be appropriate for the target group. Specific areas to assess include the following:
The presence of sensitive questions; Complex or poorly explained topics; Using jargon or technical terms; Presented in understandable language; Must be organized and easy to complete.
Field testing the questionnaire for the purpose of pre-testing can be done using expert reviews, structured cognitive interviews or a full pre-test. Expert Reviews:
Include experts in that field; Is structured and systematic; Assesses wording, format, omissions, clarity; Can be done rapidly but lacks the extensive review of a full pre-test Can be used in addition to a full pre-test
Cognitive Interview:
Used extensively in social science interviews that measure health behaviors and practices;
Is structured and systematic; Explores the way that respondents answer each question; Difficult to maintain flow of the interview due to probing questions to understand how
the person responded the way they did; The responders reaction is important in assessing the effectiveness of the questionnaire.
Full Pre-Test:
The sample frame represents the population as a whole; The pre-test occurs as the responders agree to participate (at the same time); Behavior and responses can be coded beforehand; Structured follow up at the end of the interview; Interviewers are interviewed for feedback as well.
Failure to Pre-Test a questionnaire can result in the results being unreliable, invalid and not representative of the target population and may not give truthful responses.
Version 21_12_2009 Page 66
Veterinary Field Epidemiology in Action Course Notes
Interviewing Method Face to Face When it is essential to obtain owner trust and establish working relationships such as when conducting an outbreak investigation, this is the only method to use. It establishes rapport with the responder, creates trust, allows for more complex questions, allows the interviewer to illustrate, clarify and explain and allows for longer interviews. Face to face interviews are expensive and may be difficult to obtain truthful answers especially when regulatory action may be taken (e.g. culling birds). Telephone The advantages of telephone interviews are as follows:
Establish faster contact with participants; Better to obtain sensitive information; Results are immediately available; Telephone numbers can be randomly selected from existing databases
Disadvantages:
Many people are converting to mobile cell phones and may not be selected for that reason;
More expensive than mail surveys; Difficulty in reaching participants during work days.
Mail Survey Advantages:
Cheap and easy to send out Requires addresses of participants People can respond when it is convenient; Less intrusive; Eliminates interviewer bias.
Disadvantages:
Low response rate; Difficult to detect skip bias (omitting to answer questions); Responder may not be the same as the intended targeted person; Assumes the population has a basic level of literacy.
Self Administered Web-Based Survey Advantages:
Does not require data entry or editing; Better responses to sensitive questions; Removes interviewer bias; Can follow skip patterns; People can respond when it is convenient.
Disadvantages:
Assumes the responders have computers; Must possess E-mail addresses; Lower response rate; May only partially complete the questionnaire.
Version 21_12_2009 Page 67
Veterinary Field Epidemiology in Action Course Notes
Collecting Information and Assembling Data Non-Response People may not respond to questionnaires for unavoidable reasons due to personal unavailability or health reasons. People may also not respond to a questionnaire because it is difficult to complete (too long, complicated or distressing), vague or may not consider it as being important or relevant to them. Non response is a major cause of bias and must be addressed in the design, implementation and analysis of surveys. The results of not response include reduced sample size, reduced statistical power of the study and lack of precision of the final results. Improving non-response rate can be done using the following methods:
Improving the questionnaire; Send a preliminary letter to ask for their upcoming support or in an industry magazine if
available; Offer incentives for participating; Stress confidentiality of results.
Despite one’s best efforts, participation will usually fall below what you intended to collect. Successful questionnaires occur when issues are relevant to the target group and the researcher understands the target well enough to construct a questionnaire that will give clear and useful results. It is important to describe which groups in the population did not respond in order to understand the usefulness of the survey. Lesson Summary:
1. A useful questionnaire should collect unbiased information to address the research question (null hypothesis) by assessing exposure (independent) variables, the outcome (dependent) variables, confounding factors related to both and effect modification.
2. Questionnaires can be delivered either as self-administered or face to face
interviews.
3. The method used to deliver a questionnaire should achieve the highest response rate possible in order to avoid obtaining biased results due to non-response.
4. Questionnaires may be structured either in closed or open format.
5. A cover letter/handout and thank you are essential supports to encourage current
and future cooperation from responders.
6. Structure the questionnaire to be brief, targeted and easy to complete.
7. Standardization and quality control are necessary to ensure the results are accurate and valid related to their intended purpose.
8. Field testing the questionnaire for the purpose of pre-testing can be done using
expert reviews, structured cognitive interviews or a full pre-test.
Version 21_12_2009 Page 68
Veterinary Field Epidemiology in Action Course Notes
9. Failure to Pre-Test a questionnaire can result in the results being unreliable, invalid
and not representative of the target population.
10. Questionnaires can be given face to face, by telephone or by internet and each method with its advantages and disadvantages.
11. The result of non-response includes reduced sample size, reduced statistical power
of the study and lack of precision of the final results.
12. Despite one’s best efforts, participation will usually fall below what you intended to collect. Successful questionnaires occur when issues are to relevant to the target group and the researcher understands the target well enough to construct a questionnaire that will give clear and useful results.
Version 21_12_2009 Page 69
Veterinary Field Epidemiology in Action Course Notes
Module 2.4 Sampling Techniques Dr. Kachen Wongsathapornchai, Epidemiologist, Thailand Department of Livestock Development Why Is Sampling Required?
We wish to make inferences about a population. o The investigator may desire to estimate certain population characteristics. o The investigator may wish to evaluate particular associations between events or
factors in the population (hypothesis testing). It is usually either impossible, or impractical, to assess the entire population.
o If information concerning the entire population is collected, this is known as a census.
A sample is a representative subset of the population that provides information from which inferences concerning the population may be made.
Sampling, therefore, is the process by which the sample is selected. Sampling Considerations
Different types (Hierarchy) of populations o External population – the population to which it might be possible to extrapolate
results from a study o Target population – the immediate population to which the study results will be
extrapolated o Study population – the population of individuals selected to participate in the
study Sampling frame is essentially a list of all the sampling units in the target population. A
complete list is necessary for selecting a simple random sample but may not be for other sampling designs
Types of error – inferences based on sample data are subject to error. There are two types of error, conveniently, Type I and Type II.
o Type I error – Conclude that something is true when in fact it is not true o Type II error – Conclude that something is false when in actuality it is true
Sampling Strategies
A sample must be representative of the population if it is to lead to valid inferences. A basic requirement of statistical estimation and statistical analysis (hypothesis testing) is
that randomness is built into the sampling design so that the properties of the estimators or the statistical outcome can be assessed probabilistically.
o Recognize that a p-value is a statement of probability. o Randomness is the result of a process that ensures that individual biases (known
or unknown) do not influence the selection of sample members or observations. If this is achieved, the laws of probability apply and can be used in drawing inferences.
Version 21_12_2009 Page 70
Veterinary Field Epidemiology in Action Course Notes
Probability Sampling
Sample designs based on planned randomness are called probability samples. The 'classic' formula for variance (and the related standard deviation and standard error)
that has been presented to you in various courses and that is 'inside' your computer assumes that your observations were collected using simple random sampling technique. You should be aware that if you use another sampling technique, and plan to provide estimates of population characteristics (mean and standard error) then the formula used to calculate standard error may be different! Check with your local epidemiologist, statistician or sampling text.
Simple Random Sampling A fixed percentage of the population is randomly selected. A particular sample of n subjects is chosen randomly from a population if:
o Every member of the population has the same chance of being included in the sample
o The members of the sample are chosen independently of one another (the selection of a given subject from the population is not dependent on which other subjects have been selected).
Each possible sample of n subjects from the population must have the same chance of being selected.
Sampling Techniques 'Random' is NOT equivalent to haphazard! A formal process must be used to randomly select n individuals from a population of N. Consider:
random number tables (consult the back of any statistical text) spreadsheet programs (e.g. Excel) computer programs (e.g. Minitab, SigmaStat, StatView, others)
Advantages Simple to set up... Useful for certain situations e.g. selecting a sample of 10% of records of canine hospital
admissions over the last 10 years
Disadvantages Some knowledge of all the members of the population is required - for instance,
identification numbers must be known in advance, so that the random selection may be made from those numbers.
May be impractical, particularly in field situations: e.g. selecting 5% of dairy cows milked on one shift for milk culture - it would be easy to lose count of the animals; or, if referring to a list of ear tags, it's sometimes hard to keep up, or numbers are misread, or eartags invisible, or ...
Stratified Sampling
Simple Stratified Sampling A simple stratified random sample is obtained by separating the population elements into
non-overlapping groups, called strata, then selecting a simple random sample from each stratum (equal numbers from each stratum).
Reasons for using simple stratified sampling instead of simple random sampling include:
Version 21_12_2009 Page 71
Veterinary Field Epidemiology in Action Course Notes
o Increased precision of resulting population estimates may be obtained because
the variance within each stratum is usually less than the overall population variance.
o Within-stratum information (estimates) are available. o This type of sampling may be convenient and less expensive to perform.
Technique: The population is divided into strata according to factors expected to influence the
outcome of interest. If a stratified sampling technique has been used, and a population estimate is of interest,
then appropriate formulae for calculation of population mean and standard error must be used. It is NOT appropriate to plug the data into the 'regular' formulae for mean and standard error. Please, refer to your local epidemiologist, statistician or sampling text for help.
Advantages: As listed under reasons for using the procedure.
Disadvantages: The status of the elements of the populations must be known in advance, in order to place
them into strata from which samples may be selected. Multiple factors may affect the outcome of interest yet it is rarely practical to stratify on
more than one or two factors. Poor choice of factors for stratification may lead to erroneous conclusions, and a decrease
in precision of estimates.
Proportional Stratified Sampling This is similar to Simple Stratified Sampling except that the number of elements selected
from each stratum is proportional to the size of the stratum.
Stratified Sampling - Other Two techniques for dividing the total sample size n among the various strata have been
mentioned (simple - equal numbers; and proportional). Factors that may influence the technique of dividing up total n include:
o Total number of elements in each stratum o The variability of observations in each stratum o The cost of obtaining an observation from a stratum (sometimes this is known in
advance and varies between strata). If you need to apportion n amongst strata according to any of these factors, please, check
with your local epidemiologist, statistician or sampling text.
Cluster Sampling A cluster sample is a probability sample in which each sampling unit is a collection, or
cluster, of elements. The initial sampling unit (cluster) is therefore larger than the element of concern, which is usually an individual. Once the cluster is selected, all individuals in each cluster are evaluated.
o If the unit of concern is the group, then this is not considered a cluster. For instance, one might wish to categorize herds as positive or negative for the disease of interest. The individual status of herd members is not the issue.
Examples of naturally occurring clusters include litters (of puppies), pens of sheep, and herds of cows.
'Artificial' clusters include geographic regions, administrative units (counties, territories).
Version 21_12_2009 Page 72
Veterinary Field Epidemiology in Action Course Notes
Technique:
The following may be used for selecting the clusters : o Simple random sampling o Stratified random sampling o Systematic random sampling
Once selected, all members of the cluster are evaluated. If a cluster sampling technique has been used, and a population estimate is of interest,
then appropriate formulae for calculation of population mean and standard error must be used. It is NOT appropriate to plug the data into the 'regular' formulae for mean and standard error. Please, refer to your local epidemiologist, statistician or sampling text for help.
Advantages: This strategy may be very cost-effective
Disadvantages: The effect of clustering must be accounted for in the analyses. The appropriate analytical techniques are not trivial - ask for help.
Systematic Sampling A 1-in-k systematic sample with a random start is obtained by randomly selecting one
element from the first k elements, then every kth element thereafter. Sampling in this manner is a form of probability sampling if the starting point of the
selection process is chosen at random.
Advantages: Systematic sampling is widely used because it simplifies the selection of samples.
o It is easier to perform in the field than simple random sampling. It is often cheaper to perform than simple random sampling. The sampling structure guarantees that the selection is spread over the population
(whereas this may not always occur with simple random sampling) so may provide better overall population information than simple random sampling.
Less information in advance is required about the members of the population from which the sample is to be selected.
Disadvantages: If the characteristic being estimated is related to the interval selected (even though that
interval was selected at random), a biased result will be obtained. o Suppose Mondays were randomly selected as the day on which spot checks of
hospital cleaning procedures are to be performed. This will only provide an accurate overall assessment if the cleanliness status of Mondays is representative of the other days. It may not be, if the identify of the cleaning crew over the weekend is different than during the week, or if the decreased person and animal presence over the weekend allowed the crew to do a better job.
Strictly speaking, it is not possible to accurately estimate the variance using only one systematic sample. However, the standard formula for variance used for simple random sampling is used. Be aware that if the members of the population are not randomly presented (but instead are ordered or fluctuate periodically) then the estimate of the variance given by the formula for simple random sampling will likely provide an under- or over-estimate of the population variance.
Version 21_12_2009 Page 73
Veterinary Field Epidemiology in Action Course Notes
Multistage Sampling
Multistage sampling is similar to cluster sampling except that, instead of all individuals in a cluster (primary unit) being sampled, a random selection of individuals (secondary units) is taken from each cluster.
Multistage sampling can be extended to 3 or even more stages. The sampling units within each stage should be selected with probability proportional to the number of individuals contained.
Advantages: This can be a very cost-effective technique. The relative numbers of primary and
secondary units selected can be varied to minimize overall costs (and increase information acquired per unit cost) and, if desired, to minimize overall variability.
Disadvantages: In order to achieve the same precision for a population estimate that could be achieved
with simple random sampling, it may be necessary to sample a larger number of total individuals using multistage sampling.
Non-Probability Sampling If a formal randomization process was not used in the process of sample selection, then the sample cannot be considered a probability sample. The laws of probability cannot be assumed to apply, and statistical inferences cannot be extended to the whole population.
Judgment Sampling Sample units are selected by the investigator. Investigators may believe they are capable
of selecting representative samples, but this should be questioned. Results are often biased.
Convenience Sampling Sample units are selected according to convenience.
o Consider sampling 10 from 100 horses. If you take the first 10 you catch, do you think they are likely representative of the rest?
Results are often biased.
Purposive Sampling Sample units are selected according to presence or absence of some characteristic of
interest (i.e. exposure or disease status). This is the basis by which subjects are selected for analytic observational studies such as
case-control and cohort studies. o It is not appropriate to estimate population characteristics when purposive
sampling was used.
Version 21_12_2009 Page 74
Veterinary Field Epidemiology in Action Course Notes
Summary Table: Population Characteristics and Sampling Techniques Appropriate for Each Population Type Population Characteristic Example of Population Type Appropriate
Sampling Technique
Population is generally a homogeneous mass of individual units.
Number of breeding rams of a particular breed housed in a specific pasture from which random animals are selected for testing the presence/absence of Brucella ovis.
Simple random sampling
Population consists of definite strata, each of which is distinctly different, but the units within the stratum are homogeneous as possible.
A particular bull stud farm in which the total population consists of three breeds (strata), each with equal number of bulls. A sample is needed to evaluate the sexual libido of bulls on the farm.
Simple stratified sampling
Population contains definite strata with differing characteristics and each stratum is in different ratio to the total numbers of the population in all strata.
A county in which the total dairy population consists of farms of three different herd sizes.
Proportional stratified sampling
Population consists of clusters whose characteristics are similar yet whose unit characteristics are as heterogeneous as possible.
A survey of the small animal wards in a large teaching hospital to evaluate the presence/absence of antibiotic resistance bacterial spp. All wards are similar in atmosphere, purpose, design, etc. Yet the patients differ widely in individual characteristics: species, breed, sex, reason for hospitalization, and so forth.
Cluster sampling
Sample Size Determination Introduction This page is filled with formulae. We apologize in advance if your page loads slowly, or if any of the images are fuzzy. In addition, although every effort has been made to reproduce the formulae correctly, it is possible that human error has allowed some gremlins to creep in. In some cases, there are slight variations in formulae between sources, and that might explain some differences.... If you find an error, however, assume it is ours and let us know! Please note: you are NOT expected to memorize any of these formulae. You are, however, expected to be able to choose the appropriate formula, and to be able to apply it.
Why Consider Sample Size?
Version 21_12_2009 Page 75
Veterinary Field Epidemiology in Action Course Notes
It is almost impossible for a grant proposal to be accepted without evidence of sample
size consideration. Studying too few subjects may result in a true difference between study groups remaining
undetected (Type II error). o The study will lack power (the ability to detect a difference if it is present).
Studying too many subjects is wasteful of resources.
What Affects Sample Size?
Size of the difference. o Big differences are easier to detect and require fewer subjects to do so than do
small differences. Of course, if you knew the size of the difference, you wouldn't need to do the study. Nevertheless, unless it is a ground-breaking study in a completely new area, you will likely have some idea of the expected difference or effect size.
Variability of the data. o If the data is very variable, it can be hard to see the 'signal' for the 'noise' and
more subjects will be required in order to detect the effect. Desired power.
o The desired power of the study should depend on the magnitude of the consequences of a Type II error. If it is really important that a true difference does NOT go undetected, then you need a study with high power and consequently will require more subjects.
o Remember, power = 1 - beta; and beta is often arbitrarily chosen to be 4 x alpha. Therefore, a beta of 0.2 is often used with alpha of 0.05, so a power of 0.80 would result.
Prerequisites of Sample Size Calculations
Identity of Statistical Test o The formula used for sample size calculation is dependent on the identity of the
statistical test to be applied to the data. o If several objectives are being addressed in a study, several different statistical
tests may be used. Certain objectives may require more subjects than others. You should probably focus on calculating sample size for the most important objective.
Choice of alpha and desired beta Guestimate of expected difference and expected variability of the data.
Types of Sample Size Calculations There are 5 common situations requiring sample size calculation for veterinary field studies: 1. Calculation of the minimum sample size needed to detect disease or a condition in a given
population, at a specified level of significance given a certain disease prevalence or level of infection.
2. Finding the minimum sample size required to estimate the population proportion having a characteristic of interest at a specified level of significance and within desired limits of error.
3. Finding the minimum sample size required to estimate the population mean of a characteristic of interest at a specific level of significance and within desired limits of error.
Version 21_12_2009 Page 76
Veterinary Field Epidemiology in Action Course Notes
4. Finding the minimum sample size required to detect the difference between two population
proportions that one regards as important to detect, at a stated level of significance and desired power.
5. Finding the minimum sample size required to detect the difference between two population means that one regards as important at a specified level of significance and desired power.
Implications of Sample Size Calculations
You are forced to be specific in your objectives. You must state them down to a statistically-testable level in order that the statistical test to be used can be identified.
You have a stated recruitment goal. If this seems unrealistic (i.e. no way in the world that that many subjects are going to come your way within the study period) then you may need to revisit the logistics of the study.
Encourages development of appropriate timetables and budgets: o Is it possible to perform this many evaluations within the allotted time period? o Will you need to hire additional helpers? o Have you allowed sufficient monies for purchase of the animals? For board? ) o Are you going to be able to perform the analyses yourself or will you need to pay
an epidemiologist or statistician to help you? Discourages the conduct of small, inconclusive trials.
Common Mistakes Related to Sample Size 1. No discussion of sample size. 2. Unrealistic assumptions (e.g. disease incidence, prevalence, size of expected differences). 3. Failure to explore sample size for a range of values (i.e. what if the actual effect was smaller
than this? What if the data is more variable?). 4. Failure to state power for a completed study with negative results. (If the power of the
completed study was low, that may be a little embarrassing to you, but it is certainly should be mentioned as a possible reason for the unexpected negative result).
5. Failure to account for attrition by increasing the sample size above calculated size. o The size of the sample is what you need to end up with not what you start out with! o This can be very difficult to arrange - 'you mean I need an extra HORSE? We're lucky to
get this many!'
Factors Contributing to Inadequately Sized Studies 1. Failure to document sample size at all. 2. Use of sample size of convenience, or one that is 'accepted'.
o For instance, in some large animal areas, it is almost 'traditional' to use 4 - 6 horses or cows. (Horses are expensive...) However, the power of some of those studies is amazingly low.
3. Lack of adequate financial support. o Is it better to complete the study with as many subjects as you can afford, realizing that
the power will be low, or should you not do the study at all? 4. "Publish or perish" mentality. 5. Lack of rigorous editorial policy of journal.
Where to get Help with Calculating Sample Sizes
Epidemiologist or statistician. Computer software - e.g. EpiInfo, Power Pack, Solo.
Version 21_12_2009 Page 77
Veterinary Field Epidemiology in Action Course Notes
Texts Fleiss JL. Statistical methods for rates and proportions. 2 ed. New York: John Wiley &
Sons, 1981;1-321. Norman GR, Streiner DL. Biostatistics: the bare essentials. 1 ed. St. Louis: Mosby-Year
Book, Inc., 1994;1-260. Examples of Determination Of Sample Size In Comparative Trials
Estimation of a Population Proportion (P) when Sample is to be Selected by Simple Random Sampling
Let:
Current estimate of population proportion P (if you have no idea, use 0.5. You'll end up with a 'safe' i.e. largish estimate of sample size required). Often, you'll be using a value obtained from another study.
Population size
Bound on the error of estimation
Formula:
Example: An investigator wishes to estimate the proportion of cats in Colorado that are infected with Cryptosporidium spp. From a small pilot study, it is suspected that approximately 10% of the cats in Colorado are infected. It is decided that a random sample of cats can be obtained. (What do you think of this assumption??) The investigator will be content if her sample estimate is within 5% of the true population proportion P. How large a sample of cats needs to be examined?
0.10
0.90
50,000
0.05
0.00625
Version 21_12_2009 Page 78
Veterinary Field Epidemiology in Action Course Notes
Detection of the Difference Between Two Population Proportions (Equal Sample Sizes) Please note: Many statistical tests provide tables that do this for you! The answers may not be exactly the same as that provided by the formula, but will probably be close enough. It's just an estimate, after all.
Let:
Current estimate of population proportion P1 (Non-Exposed or Control Group)
Current estimate of population proportion P2 (Exposed or Treated Group)
Estimated average of P1 and P2
Estimated average of Q1 and Q2
This is the Z value corresponding to the alpha error. When looking this up in a table, you must always use the two-tailed value, unless you have a good reason for choosing a 1-sided test. For example, if alpha is 0.01, 0.05, or 0.10, the corresponding (two-tailed) Z values are 2.58, 1.96, and 1.65, respectively.
This is the Z value corresponding to the beta error. The Z-value for beta is always based on a one-tailed test (ask if you are really interested in why!). So, if beta is 0.05, 0.10, 0.20, or 0.30, the corresponding Z values are 1.65, 1.28, 0.85, and 0.52 respectively.
Formula:
Note this formula doesn't include what is known as a 'continuity correction'. (The continuity correction brings normal curve probability in closer agreement with binomial probabilities). Applying the correction will increase the 'n' slightly. Note that the results are expressed as number of subjects per group. To incorporate the continuity correction, let the n we have just calculated become n' (temporary n) and the final sample size becomes n. Then:
Version 21_12_2009 Page 79
Veterinary Field Epidemiology in Action Course Notes
Example: An investigator wants to determine if the mortality rate in calves raised by farmer's wives differs from the mortality rate in calves raised by hired managers. He/she hypothesizes a calf mortality rate of 0.25 for calves raised by farmer's wife and 0.40 for calves raised by hired managers. The level of significance, alpha, is stated to be 0.01, and the desired power of the test is 0.95. How many calves should be included in the study?
0.40
0.60
0.25
0.75
0.325
0.675
2.58
1.65
Therefore, a minimum of 344 calves in each group is required! If we apply the continuity correction formula, our final estimate of the n for each group is 357 calves.
Detection of the Difference Between Two Population Proportions (Unequal Sample Sizes)
Let:
Current estimate of population proportion P1 (Non-Exposed or Control Group)
Version 21_12_2009 Page 80
Veterinary Field Epidemiology in Action Course Notes
Current estimate of population proportion P2 (Exposed or Treated Group)
Estimated average of P1 and P2, calculated as
Estimated average of Q1 and Q2, calculated as
This is the Z value corresponding to the alpha error. When looking this up in a table, you must always use the two-tailed value, unless you have a good reason for choosing a 1-sided test. For example, if alpha is 0.01, 0.05, or 0.10, the corresponding (two-tailed) Z values are 2.58, 1.96, and 1.65, respectively
This is the Z value corresponding to the beta error. The Z-value for beta is always based on a one-tailed test (ask if you are really interested in why!). So, if beta is 0.05, 0.10, 0.20, or 0.30, the corresponding Z values are 1.65, 1.28, 0.85, and 0.52 respectively.
Required sample size (n1) from N1.
This is the value by which n1 is to be multiplied to give n2. i.e. n2 = rm
Formula:
To incorporate the continuity correction, let the m we have just calculated become m' (temporary m) and the final sample size becomes m. Then:
Example: The case-fatality rate among cancer patients undergoing standard therapy is 0.90, and is 0.70 for cancer patients receiving a new treatment. Find the required sample size to test a hypothesis that the case-fatality rate differed between groups at the stated level of significance, alpha = 0.05, and desired power of the test, 0.90. (Remember, beta = 1 - power). For consistency, by using survival rates rather than case-fatality rates, P2 will be larger than P1.
0.10
Version 21_12_2009 Page 81
Veterinary Field Epidemiology in Action Course Notes
0.90
0.30
0.70
0.23
0.77
1.96
1.282.
2
If we apply the continuity correction, our estimate of m becomes 39. So, if this calculation is correct, we need 39 patients in group 1, and 78 patients in group 2. What if we were to use equal sample sizes? We'll leave that as an exercise for you to work out.
Calculating the Power of a Test with Given Sample Sizes It is relatively easy (for those who enjoy algebraic gymnastics) to rearrange any of these sample size formulae to obtain a estimate of the power of a test, given the sample sizes used and the effect size observed. From the previous example, suppose you are limited to 20 patients in each group by cost considerations. What power would you be working with? The first step is to locate the formula for sample size, then convert it to provide an estimate of power. In this case, we need the formula for equal sample sizes:
Version 21_12_2009 Page 82
Veterinary Field Epidemiology in Action Course Notes
Rearranging this provides:
Remember, this particular equation can ONLY be used to calculate the power of a test of the difference between two proportions with equal sample sizes. Putting the information into the table:
0.10
0.90
0.30
0.70
0.20
0.80
1.96
n 20
Now, we must refer to a table of normal values to interpret this Z value. Remember, is one-sided. A value of 0.40 corresponds to an area under (half) the normal curve of 0.1554. This is where it gets really confusing: the area to the right of this is the value of beta. Here, this is 0.3446. This, then, corresponds to a power (1 - beta) of 0.6554 or roughly 65%.
Version 21_12_2009 Page 83
Veterinary Field Epidemiology in Action Course Notes
Determination of Sample Size Requirements for Cohort Studies
Let
Incidence of disease among the Non-Exposed (hypothesized or known)
R Relative Risk of disease regarded as important to detect
This is the Z value corresponding to the alpha error. When looking this up in a table, you must always use the two-tailed value, unless you have a good reason for choosing a 1-sided test. For example, if alpha is 0.01, 0.05, or 0.10, the corresponding (two-tailed) Z values are 2.58, 1.96, and 1.65, respectively
This is the Z value corresponding to the beta error. The Z-value for beta is always based on a one-tailed test (ask if you are really interested in why!). So, if beta is 0.05, 0.10, 0.20, or 0.30, the corresponding Z values are 1.65, 1.28, 0.85, and 0.52 respectively.
Formula
Again, note that this provides an estimate of the required number of subjects PER GROUP.
Determination of Sample Size Requirements for Case-Control Studies
Let
F The prevalence of exposure to the factor in the population. In most epidemiologic studies of rare diseases, the prevalence of the exposure factor in the control group provides a good approximation of f.
R Relative Risk of disease regarded as important to detect
Prevalence of the exposure factor among the cases. It is estimated as
Version 21_12_2009 Page 84
Veterinary Field Epidemiology in Action Course Notes
This is the Z value corresponding to the alpha error. When looking this up in a table, you must always use the two-tailed value, unless you have a good reason for choosing a 1-sided test. For example, if alpha is 0.01, 0.05, or 0.10, the corresponding (two-tailed) Z values are 2.58, 1.96, and 1.65, respectively
This is the Z value corresponding to the beta error. The Z-value for beta is always based on a one-tailed test (ask if you are really interested in why!). So, if beta is 0.05, 0.10, 0.20, or 0.30, the corresponding Z values are 1.65, 1.28, 0.85, and 0.52 respectively.
Formula
Again, note that this provides an estimate of the required number of subjects PER GROUP.
Detecting the Difference Between 2 Population Means
Let
Estimate of the mean population value of the control group
Estimate of the mean population value of the treated group
Pooled estimate of the standard deviation. The assumption is that
This is the Z value corresponding to the alpha error. When looking this up in a table, you must always use the two-tailed value, unless you have a good reason for choosing a 1-sided test. For example, if alpha is 0.01, 0.05, or 0.10, the corresponding (two-tailed) Z values are 2.58, 1.96, and 1.65, respectively
This is the Z value corresponding to the beta error. The Z-value for beta is always based on a one-tailed test (ask if you are really interested in why!). So, if beta is 0.05, 0.10, 0.20, or 0.30, the corresponding Z values are 1.65, 1.28, 0.85, and 0.52 respectively.
Formula
Example
Version 21_12_2009 Page 85
Veterinary Field Epidemiology in Action Course Notes
From the results of a pilot study, an investigator assumes that the gizzard weights of a certain strain of turkeys are normally distributed with mean of 30 grams and a variance of 23 grams. A study is being conducted to examine the effect of a new feed formula on gizzard weight. It is hypothesized that due to the new feed formula, treated turkeys have gizzard weights greater than 30 grams on the average. We wish to test the following null hypothesis at a 5% level of significance. HO: The mean gizzard weight of treated turkeys is less than or equal to the mean gizzard weight of the control group. HA: The mean gizzard weight of treated turkeys is greater than the mean gizzard weight of the control group. Note that this is a one-sided pair of hypotheses. The investigator must choose a difference that is biologically relevant. Suppose this difference is thought to be 2 grams. The sample size question then becomes ' how many turkeys must be chosen for the experimental and control groups in the feed trial in order to have a "high probability" of detecting a 2 gram difference in gizzard weights?'
30
32
1.65 (because this is a one-tailed test. If it were a two-tailed test, it would be 1.96)
1.28 Well, the question told us they wanted a 'high probability' of detecting this difference, if it is present. So, let's give them a power of 90% (beta of 0.10).
The required number of turkeys needed to have a high probability of detecting the hypothesized 2 gram difference in gizzard weights is 100 per group, making a total of 200 birds. Of course, you'd want to start with more, so that you end up with at least that many in each group. Lesson Summary: 1. Sampling is the process by which the sample is selected. 2. Sampling frame is essentially a list of all the sampling units in the target population. 3. Sample designs based on planned randomness are called probability samples.
Version 21_12_2009 Page 86
Veterinary Field Epidemiology in Action Course Notes
4. If a formal randomization process was not used in the process of sample selection, then
the sample cannot be considered a probability sample. The laws of probability cannot be assumed to apply, and statistical inferences drawn from such a sample are suspect.
5. There are 5 common situations requiring sample size calculation for veterinary field
studies.
Version 21_12_2009 Page 87
Veterinary Field Epidemiology in Action Course Notes
Module 3.1 Goals and Foundation of a Disease Outbreak Investigation Potjaman Siriarayaporn Medical Epidemiologist, International FETP Bureau of Epidemiology, Thailand Ministry of Public Health Introduction Principles of outbreak investigation will be elaborated upon using a case study approach. Case Study On May 18 2007 the Bureau of Epidemiology (BOE) received notification from Chiang Rai province that 24 patients with symptoms of nausea, vomiting, palpitations and cyanosis were treated at Wiangkan hospital. Laboratory tests confirmed methemoglobinemia. The event occurred during a cooking class in Village A. A local investigation team suspected nitrate poisoning from cooking ingredients following their initial investigation. Here is a brief history:
Cooking class were held during 8th -10th of May, 2007 at Cooperatives A, around 30 persons attended the class
Most of participants were member of cooperatives The class was taught by teacher from Chiang Rai vocational college All of them tasted the food after finished cooking
Is this an Outbreak? The first question to address is how we will respond to this report and whether it is considered a disease outbreak. An outbreak can be defined as the occurrence of more cases of disease than expected in a given area in a particular population over a particular period of time. It can also be considered when two or more linked cases of the same illness occur. Excess of normal could mean one of the following: The number of cases exceeds the median number of cases during the previous 5 year
period. This implies that disease monitoring is in effect; The number of cases exceeds 2 standard deviation units from the mean value of cases
during the past 5 year period; A single case of a new disease that has never been detected before (e.g. first case of H5N1
in a small boy in Hong Kong in 1997). Recall that to investigate disease we ask basic question to describe (what, when, where, who) and to analyze (why, how) an event. The basic purpose of an investigation is to define how to react or respond to the event.
Version 21_12_2009 Page 88
Veterinary Field Epidemiology in Action Course Notes
Outbreak investigations are challenging since they are unexpected events, there is a need to act quickly, a need to control the outbreak rapidly and to work under field conditions. Since there are many uncontrolled aspects to disease outbreak investigations it is important to take a systematic approach in the investigation. Steps of an Outbreak Investigation
1. Prepare for field work; 2. Verify the existence of an outbreak; 3. Verify the diagnosis; 4. Establish working case definition(s); 5. Find cases systematically and record observations; 6. Describe the outbreak; 7. Develop hypotheses; 8. Conduct analytical studies to test the hypothesis; 9. Conduct special studies (e.g. environmental); 10. Implement control measures; 11. Communication including the outbreak report.
Cases are detected through the following channels:
Routine surveillance Routine clinical examinations or laboratory submissions Notifications from the general public; Media reports.
The time period between the initial case until it is detected and controlled varies depending on many factors involved with detection, reporting, sample collection, laboratory analysis, laboratory reporting and initiation of response activities. Generally, the time period will be shorter for familiar diseases and longer for unknown or rare diseases. Once an outbreak is confirmed it is important to initiate both immediate control measures and further investigation simultaneously. Control measures could include prophylaxis (vaccination), exclusion or isolation, public warning and application of hygienic measures. The decision to undertake further investigation is dependent upon the following disease related factors:
Unknown etiology; Severity of cases; Ongoing, continuing cases are occurring; Public pressure; Training opportunity; Scientific interest.
The investigation team for zoonotic diseases may include the following disciplines:
Epidemiologist; Microbiologist; Environmental specialist; Government ministries; Communications officer; Sometimes one person must play more than one role;
Version 21_12_2009 Page 89
Veterinary Field Epidemiology in Action Course Notes
Others.
Version 21_12_2009 Page 90
Veterinary Field Epidemiology in Action Course Notes
Module 3.2 Implementing the steps in preparing for, conducting and assessing a disease outbreak investigation Potjaman Siriarayaporn Medical Epidemiologist, International FETP Bureau of Epidemiology, Thailand Ministry of Public Health Preparing for Field Work The first step is to understand the disease(s) under consideration as the most likely causes of the outbreak. In the example of nitrate poisoning presented in Module 3.1 the following basic facts are reviewed by the medical team concerning methemoglobinemia:
§ A disorder characterized by the presence of a higher than normal level of methemoglobin in the blood;
§ Methemoglobin is a form of hemoglobin that does not bind oxygen; Methemoglobinemia is acquired most commonly after ingestion or inhalation of an
oxidizing agent, such as nitrates or nitrites; Symptoms observed:
Conc. Level of Met-Hb Signs
0-15% no signs or symptoms
16-20% results in chocolate brown blood and central cyanosis
21-45% Symptoms of hypoxia such as dyspnea, fatigue and headache
An initial approach could include the following steps:
Assess situation; Examine available information;
Version 21_12_2009 Page 91
Veterinary Field Epidemiology in Action Course Notes
Formulate a preliminary hypothesis; Case definition;
o Standard set of criteria for deciding if a person should be classified as suffering from the disease under investigation.
o Clinical criteria, restrictions of time, place, person o Simple, practical, objective o Sensitivity versus specificity
Case finding; The next step would be to describe the events in terms of person/animal, place and time.
For the example presented a case definition would be as follows: A person who participated in a cooking class at 9th -10th May 2007 and had at least two symptoms from these followings:
headache dizziness palpitation sweating cyanosis pale
In addition, several case categories can be constructed:
Possible o Patient with at least two symptoms as above
Probable o Patient with central cyanosis and epidemiological link with other cases
Confirmed o Patient with concentration level of Met-Hb>15%
For this case the following steps were taken to conduct a descriptive study:
Reviewed medical records of patients that related to cooking class at Cooperatives A; Interview patients and clinician; Interview participants about training course at Cooperatives A during May 8th -10th and
cooking process of suspected food items. In addition a laboratory study was conducted that involved collection of food samples and salt powder to be analyzed for nitrite concentration (performed by local SRRT) and fried chicken was made following the same recipe and sent to the laboratory. To identify cases were identified using different sources including clinical cases from hospitals, laboratories, schools and workplace. Identifying information for cases included demographic information (age, place of residence, etc.) are combined with clinical details and questions are asked in order to identify risk factors later on in the analysis. Finally cases are described in terms of person/place/time in order to verify the agent, its source and possible modes of transmission (point source and continuing common source). Plotting the outbreak curve can give us useful information concerning the incubation period of the agent as seen in the outbreak curve below.
Version 21_12_2009 Page 92
Veterinary Field Epidemiology in Action Course Notes
One can use the information from literature concerning minimum and median incubation period for the agent in order to estimate the time of initial exposure to the disease agent. Food that was prepared at the cooking school includes the following:
Date Food in class May 8th Porkball
May 9th Fried bean
May 10th Paprika fried chicken*
* Had sodium nitrite in the recipe Initial Results of the Investigation
24 people met the case definition (AR=77%) Age (median) = 40.5 yrs (range 9-64 yrs) Male: female = 1:3 Median incubation period 20 mins (ranges 10-100 mins) All cases developed symptoms on May 10th, 2007 11 hospitalized cases, 4 were referred to a provincial hospital, no death Most of them recovered within 24 hours
Version 21_12_2009 Page 93
Veterinary Field Epidemiology in Action Course Notes
Version 21_12_2009 Page 94
Veterinary Field Epidemiology in Action Course Notes
Laboratory analysis also revealed the following data:
Sodium nitrite (NaNo2) were introduced by teacher and used as ingredients of Fried chicken;
Chemical powder were purchased from a chemical store in Chiang Rai under instruction of the teacher, but information about concentration of nitrite powder was wrongly use
(> 100 time higher than the original recipe) A hypothesis is formulated using the following reasoning:
Who is at risk of becoming ill? What is the disease causing the outbreak? What is the source and the vehicle? What is the mode of transmission?
It is also important to compare the hypothesis with known facts and test the hypothesis by conducting either a case-control study or cohort study. An initial analysis of relative risk of eating different food follows:
Version 21_12_2009 Page 95
Veterinary Field Epidemiology in Action Course Notes
We can support causation by showing a dose response effect in this case as well from the data presented below:
Conclusions
There were cluster of 24 persons suffered from methemoglobinemia after attended the cooking class at Cooperatives A on May 10th 2007;
The cause of the outbreak was the ingestion of fried chicken with high concentration level of sodium nitrite due to wrongly used formula in the recipe.
Recommendations
All chemical products packs should be labeled clearly and give adequate information about usage;
Version 21_12_2009 Page 96
Veterinary Field Epidemiology in Action Course Notes
§ Increasing concerns of responsible organization about unnecessary and improper using
of sodium nitrite as food additives among food producers or cooking class in educational institute;
To remind general practitioner to consider met-Hb as diagnosis in any patient with significant central cyanosis or other sign such as headache, dizziness or palpitation, especially in case they had history of ingestion meat products.
It is important to implement control measures even during the outbreak itself by interrupting transmission or modifying the host response. Control measures should consider the following actions:
Remove source of contamination Remove persons from exposure Inactivate/ neutralise the pathogen Isolate and/or treat infected persons Interrupt environmental sources Control vector transmission Improve personal sanitation Immunise susceptibles Use prophylactic chemotherapy
The investigation finally includes the following approach:
Prepare written report Communicate public health messages Convince public health policy Evaluate performance
Lesson Summary:
1. The steps in a disease investigation are as follow:
• Prepare for field work • Establish the existence of an outbreak • Verify the diagnosis • Construct a working case definition • Find case systematically and record information • Perform descriptive epidemiology • Develop hypothesis • Analytical studies to test hypotheses • Special studies (e.g. environmental study) • Implementation of control measures • Communication, including outbreak report
Version 21_12_2009 Page 97
Veterinary Field Epidemiology in Action Course Notes
Module 3.3
Apply Basic Descriptive Statistics to Accurately Describe an Outbreak Event Wandee Kongkaew Thailand Department of Livestock Development Lecture Outline Review:
- Outbreak, scope of an outbreak investigation, steps of an outbreak investigation - Descriptive epidemiology - Descriptive statistics
Assess data quality Describe the outbreak by three epidemiological parameters;
- Time - Place - Person/animal
Outbreak An outbreak is an increase in the number of cases over past experience for a given population, time and place. Scope of an Outbreak Investigation 1. Epidemiological investigation 1.1 Descriptive epidemiological investigation 1.2 Analytical epidemiological investigation 2. Environmental investigation 3. Laboratory investigation Descriptive Epidemiology Once data from outbreak event have been collected, we can begin to characterize (describe) an outbreak to provide a picture of the outbreak by three important epidemiological parameters; time, place, and person/animal. Characterizing an outbreak by these variables is called descriptive epidemiology, because we describe what has occurred in the population under study. Careful descriptive and characterization of the outbreak is an important first step of any epidemiological investigation. We can assess description of the outbreak in light of what is known about the disease e.g. usual source, mode of transmission, risk factors and populations affected, etc., be able to develop causal hypotheses, and further design analytical epidemiology to test the hypotheses.
Version 21_12_2009 Page 98
Veterinary Field Epidemiology in Action Course Notes
Basic Steps of an Outbreak Investigation 1. Verify the Outbreak Investigation of a potential outbreak starts with the assessment of all available information; this should confirm or refute the existence of an outbreak (the diagnosis, the magnitude of the problem) and allow a working case definition to be established. 2. Establish a Case Definition Once the outbreak has been confirmed, a group of initial cases should be identified and interview in order to provide a picture of the clinical and epidemiological features of the affected group. A case definition is a set of criteria for determining whether a person/animal should be classified as being affected by an illness or condition under investigation. It is an epidemiological tool for counting cases, generally it should be simple and practical and include the following components: 1) Clinical and laboratory criteria to assess whether a person/animal has an illness or condition under investigation. The clinical features should be significant signs of an illness or condition under investigation; 2) Defined period of time during which cases of illness are considered to be associated with the outbreak; 3) Restriction by place; 4) Restriction by person/animal’s characteristics. 3. Identify Cases and Obtain Information The cases that prompt an outbreak investigation often represent only a small fraction of the total number of affected population, an active search for additional cases and unreported cases should be undertaken. 4. Analyze and Describe the Data by Time, Place, and Characteristics or Pattern of Affected Person or Animal This is described in detail below. 5. Develop or Adjust (Tune) an Existing Hypothesis With the established facts, determine the following: the type of outbreak whether it is point source or propagated; the source of outbreak whether it is common source or multiple exposures; and the possible mode of spread whether it is direct contact, vector, fomite, vehicles, etc. At this point, we should be able to make recommendations for action and preventive measures. 6. Intensive Follow-up Decide whether further studies are needed to test the hypotheses. 7. Share (Disseminate) the Results Share the results of your findings through writing official reports and scientific publications.
Version 21_12_2009 Page 99
Veterinary Field Epidemiology in Action Course Notes
Descriptive Statistics Descriptive statistics are used to describe the basic features of the data gathered from outbreak sources in various ways. They provide a general summarize about the events and the measures. Together with simple graphic analysis, they form the basis of virtually quantitative analysis of data. The techniques include in descriptive analysis are: 1. Tabular descriptive data in summary tables; 2. Graphical display of data in which graph summarize the data or facilitate comparison; 3. Summary statistics (single number) which summarize the data. The measures in descriptive statistics include: 1. Frequency; 2. Measure of central tendency (mean, median, mode); 3. Measure of dispersion (range, standard deviation, variance, correlation coefficient); Assess Data Quality Once data has been gathered from outbreak sources; affected population, laboratory, it should be checked and amended for any needed, missing, or unexpected values. Data should be coded and edit in line list format. Data quality may be assessed and improved before and during descriptive analysis. Describing the Outbreak by Time, Place, and Person/Animal Temporal Distribution of the Disease Generally, it is unlikely that cases of a disease occur at random intervals in a population of persons/animals. The timing of onset of disease rather follows one of three patterns: sporadic, endemic, or epidemic. Sporadic Cases may occur irregularly and do not seem to be associated with any other factor. There is no discernable pattern. Often, the disease agent is common, but the development of clinical disease is dependent on other factors. Endemic Cases may occur regularly. There are many predictable patterns of diseases. Disease which occurs regularly is said to be endemic. Regular, predictable patterns of disease occurrence represent a long term balance between agent and host. Disease can be at a low, moderate or high rate. Epidemic Cases may occur in clusters in time. This pattern is typical of outbreaks or epidemics. A useful way to represent this pattern of temporal distribution is to construct an epidemic curve. An epidemic is present when the frequency of cases clearly exceeds the normal level for a given area and season. If an epidemic takes on international proportions, it is termed a pandemic.
Version 21_12_2009 Page 100
Veterinary Field Epidemiology in Action Course Notes
Produce an Epidemic Curve An epidemic curve (epidemic curve) is a graphical depiction of the number of cases of illness by the date of illness onset. The epidemic curve represents in a graphic form the onset of cases of the disease, either as a histogram, a bar graph, or a frequency polygon. The frequency of new cases is plotted on the vertical (y) axis, while the horizontal (x) axis has a time scale on it. Epidemic curves may be done by hand or with software such as Microsoft Excel, Microsoft PowerPoint or Epi Info. The typical epidemic curve has four segments: Segment 1 - the endemic level This segment represents the expected level of disease, and should be drawn first. Segment 2 - the ascending part of the curve If transmission is very efficient and the incubation period of disease is short, then this limb (part) of the curve will be steep compared to diseases with less efficient transmission or longer incubation periods. In point source epidemics, where large numbers of animals are exposed all at once to a common source, the ascending branch of the curve is almost vertical. This is typical of food-borne or waterborne diseases. In propagated epidemics, the agent is spread, directly, or indirectly, from one animal to another, and the slope will be less steep. Slope is dependent on factors like the agent's ability to survive outside the host, probability of effective contact between hosts, etc. Segment 3 - the plateau Segment 4 - the descending branch The extent of the plateau and the descending branch are dependent on the availability of susceptible animals, which in turn is dependent on herd immunity, vaccination, quarantine, therapy, and other interventions to control the epidemic. Segment 5 - the secondary peak The secondary peak is usually due to the introduction of new susceptible into the epidemic area or the movement of infected animals from the epidemic area and contact with new susceptible animals. The main peak of an epidemic curve can be preceded by a small peak which could represent the index case(s), the first cases to occur. The interval from the beginning of the first peak to the beginning of the main peak could indicate the incubation period. Steps in Creating an Epidemic Curve (Source: CDC, mini-module on “Constructing an Epidemic Curve”) 1. Identify the date of onset for the first case in the curve. 2. Set the time interval. 3. Create X-axis lead and end periods. 4. Draw tick marks and label the time intervals.
Version 21_12_2009 Page 101
Veterinary Field Epidemiology in Action Course Notes
5. Assign the area that is equal to one case on the Y-axis. 6. Plot the cases on the graph. 7. Mark the critical events on the graph and add graph labels. Step 1: Identify the date of onset To draw an epidemic curve, you first should identify the date of onset of illness for each case. In addition, for a disease with a very short incubation period, you should also identify the time of onset to produce an epidemic curve with enough detail to discern patterns in the outbreak. If you do not know the date of onset, then you can use one of the following dates: date of report, date of death, or date of diagnosis. Below is a portion of the line listing from the smallpox outbreak noting date of onset.
Case Number Affected Area Date Of Onset
1 Kosovo 3/15/1972 2 Kosovo 3/15/1972 3 Other 3/15/1972 4 Kosovo 3/16/1972
Step 2: Set the time interval Next, you should set the time interval for the X-axis. The time intervals are preferably based on the incubation period of the disease, if known. The time interval is critical because intervals that are too short (e.g., hours, for diseases with long incubation periods) or too long may obscure the underlying pattern of the outbreak. As a rule of thumb, you will usually select a unit of about 1/3 or less of the incubation period for the time interval on the X-axis. Step 3: Create X-axis lead and end periods When creating an epidemic curve, it is important to illustrate the time period before and after the concentration of cases to possibly reveal source cases, secondary transmission, and other outliers of interest. The following steps can be used when establishing lead and end periods. 1. From your line listing, find the first and last dates of onset. 2. To create the lead period, extend the scale back two incubation periods from the first date of onset. 3. To create the end period, extend the scale forward two incubation periods after the last case.
In our example of smallpox in Yugoslavia: The first date of onset is February 16, 1972. The last date of onset occurred on April 11, 1972. The incubation period used is 12 days. Therefore, the appropriate time frame for the X-axis, with lead or end periods equal to two incubation periods, includes: a lead period dating back to January 23, 1972
Version 21_12_2009 Page 102
Veterinary Field Epidemiology in Action Course Notes
an end period going forward to May 5, 1972
Step 4: Draw tick marks and label time intervals As mentioned earlier, time intervals by which onset dates are grouped are shown on the X-axis. Now draw the tick marks on the X-axis according to the interval you have chosen (1 day). You may also begin putting labels on the X-axis, such as the interval or date markers (i.e. dates of onset). For example: dates of onset: February 16, 1972 to April 11, 1972 lead period: January 23, 1972 end period: May 5, 1972 time interval: 1 day
Step 5: Assign area equal to one case You may need to draw the graph on paper. In that case, you will need to assign the area that will be equal to one case on the X-axis, which is usually square or rectangular.( = 1 case).
Step 6: Plot the cases on the graph Now you can plot the cases on the graph. There should be no gaps between adjacent time intervals, as this is a histogram, not a bar graph.
Step 7: Mark the critical events on the graph and add graph labels Labels are a useful tool to identify or highlight events and cases of importance. In addition, title, legend, and axis labels help provide the reader with visual aids to assist them in interpreting the curve. In the smallpox example, two critical events that occurred during the outbreak are: 1. The period of time the index case was in Iraq (where the exposure occurred) 2. The initial onset of illness for the index case
Version 21_12_2009 Page 103
Veterinary Field Epidemiology in Action Course Notes
As a result, the following graph now indicates the critical events that took place, as well as the title and axes labels.
When the Disease is Unknown Unfortunately, we often need to draw an epidemic curve when we do not know the incubation periods and/or the disease. Step 2 (Setting the Time Interval) and Step 3 (Creating the Lead and End Periods on the X-axis) will be slightly different in that case. Lead and End Periods When the incubation period is unknown, use 1 to 2 weeks for the lead and end periods. Time Intervals If the disease is unknown, a good way to set the time interval is to create at least three epidemic curves, each with a different time interval. For our example, we use: 1 day, 4 days, and 1 week.
Version 21_12_2009 Page 104
Veterinary Field Epidemiology in Action Course Notes
Interpreting an Epidemic Curve Interpretation of the epidemic curve can prove to be very helpful in determining the source of the outbreak. Through review of the different patterns illustrated in an epidemic curve, it is possible to hypothesize: 1. How an epidemic spread throughout a population; 2. At what point you are in an epidemic; 3. The diagnosis of the disease by establishing the potential incubation period. When analyzing an epidemic curve, it is important to consider the following factors to assist in interpreting an outbreak.
Version 21_12_2009 Page 105
Veterinary Field Epidemiology in Action Course Notes
1. The overall pattern of the epidemic; 2. The time period when the persons were exposed; 3. If there are any outliers (extreme values). Classification of Epidemic Curves Typically, epidemic curves fall into three different classifications: 1. Point Source In a point source epidemic, persons are exposed to the same exposure over a limited, defined period of time, usually within one incubation period. The shape of this curve commonly rises rapidly and contains a definite peak at the top, followed by a gradual decline. Sometimes, cases may also appear as a wave that follows a point source by one incubation period or time interval. This is called a point source with secondary transmission. The graph below illustrates an outbreak of gastrointestinal illness from a single exposure. While there are outliers to this dataset, it is clear that there is an outbreak over a limited period of time, and the shape of the curve is characteristic of one source of exposure. 2. Continuous Common Source In a continuous common source epidemic, exposure to the source is prolonged over an extended period of time and may occur greater than one incubation period. The down slope of the curve may be very sharp if the common source is removed or gradual if the outbreak is allowed to exhaust itself. The data below is from the well-known outbreak of cholera in London that was investigated by the "father of epidemiology," John Snow. Cholera spread from a water source for an extended period of time. Note that the typical incubation period for cholera is 1 to 3 days that the duration of this outbreak was more than 1 month.
Version 21_12_2009 Page 106
Veterinary Field Epidemiology in Action Course Notes
3. Propagated (Progressive Source) A propagated (progressive source) epidemic occurs when a case of disease serves as a source of infection for subsequent cases and those subsequent cases, in turn, serve as sources for later cases. The shape of the curve usually contains a series of successively larger peaks, reflective of the increasing number of cases caused by person-to-person or animal-to animal contact, until the pool of susceptible animals/humans is exhausted or control measures are implemented. The graph below illustrates an outbreak of measles. The graph shows a single common source (the index case), and the cases appear to increase exponentially. Measles is caused by person-to-person contact. Its incubation period is typically 10 days but may be 7--18 days.
Version 21_12_2009 Page 107
Veterinary Field Epidemiology in Action Course Notes
Most types of outbreaks are affected by geography. Common source epidemics are usually found in one place or contiguous locations, while a propagated epidemic can be found in multiple locations, often spread from person-to-person contact. In the smallpox outbreak, although we have determined the type of epidemic curve, it is difficult to determine how the outbreak might have spread throughout the population. Assessing an Epidemic Curve by Characteristics Stratification is a mainstay of epidemiologic analysis because it provides an investigator with a different perspective on key variables. In the process of viewing an epidemic curve, it can be helpful to divide a population into several subgroups to illustrate a pattern contained in potentially unmeasured characteristics such as geography or job classification, or provide a uniform baseline for comparison. Characteristics of a Population To divide the population into subgroups, you should understand the characteristics of the population including; number of confirmed, clinical, and suspected cases, number of deaths associated with the disease or illness, demographic information, e.g., age, gender, and job classification, geographic information. Of these characteristics, geography is commonly used to compare populations to determine if an outbreak contains similar or unusual patterns within an epidemic curve.
An unfortunate chain of events led to the spread of the smallpox outbreak outside the Kosovo region. A school teacher from a village near Novi Pazar, just north of the Kosovo region, went to Djakovica on February 21 to enroll at school. He came into contact with the index case and, after his return to Novi Pazar, became feverish on March 3. He developed a rash on March 5 and went to a local medical center. On March 7, he went with his brother by bus to a hospital in Cacak. He was then transferred to Belgrade Dermatology and Venereal Diseases Department on March 9. After developing hemorrhagic complications, he was taken to the Surgery
Version 21_12_2009 Page 108
Veterinary Field Epidemiology in Action Course Notes
Department, where he died on March 10. In none of these medical establishments was the patient diagnosed with smallpox. The patient's brother developed a rash on March 20 after medical personnel were aware of the outbreak. He was diagnosed on March 21 and it was not until then that the school teacher's death was attributed to hemorrhagic-type smallpox. A retrospective epidemiologic investigation discovered that this patient infected 38 persons, 8 of whom died.
Geographic Example: Below is the smallpox example, this time the epidemic curve has been grouped by geographic location (Kosovo, Belgrade and Other Areas in Yugoslavia). Smallpox cases by date of onset--- Yugoslavia, February--May 1972
Version 21_12_2009 Page 109
Veterinary Field Epidemiology in Action Course Notes
There are many tools to assist you in interpreting an epidemic curve. The key is to ask the right questions of the population in order to gather characteristics that can be used in the interpretation of an epidemic curve. Time Series Analysis If an epidemic curve extends over a relatively long period of time, and is based on frequent observations at short intervals, it may be examined for patterns including seasonal variation, cyclical trends, or secular trends. 1. Seasonal Variation - Changes in disease frequency with "ups" and "downs" that coincide with seasons (dry vs. wet season, winter vs. summer, etc.) 2. Cyclical Variation - Cyclical variation occurs when there are regular changes in disease frequency. These periodic changes can occur as a result of the interplay of many factors. The intervals are usually longer than seasons, for example, the cyclical variation in fox rabies in Europe. 3. Secular Trends - occur over a long period of time. They are superimposed on other temporal patterns. 4. Erratic Variations - change in disease frequency with time that occur in totally unpredictable fashion. The variation left over after cyclical, seasonal and secular trends have been accounted for. Techniques to Characterize Temporal Patterns 1. Free hand plots of frequency versus time 2. Rolling averages 3. Linear regression 4. Time series analysis
Version 21_12_2009 Page 110
Veterinary Field Epidemiology in Action Course Notes
Spatial Distribution of Disease Knowledge of the frequency of disease according to place is an essential step in understanding the distribution and determinants of disease. Distribution may be specified by pen or farm, or by larger geographic regions, depending on the purpose of the investigation. Cartographic Methods 1. Spot Maps
Plot of location of cases Shows distribution of diseases but contains no information about the rate of disease since
it is not based on rates Shows number of cases only (the numerator in incidence and prevalence measures) a series of spot maps over time can show rate of disease spread
2. Maps of Disease Rate
Plot rates or adjusted rates or standardized morbidity or mortality ratios using different colors or shading
3. Isodemic Maps (population based maps)
The size of the region on the map corresponds to the size of the population at risk in the area as opposed to its physical size
Difficult to draw
Analytic Methods Sometimes a spot map of cases will indicate clustering, suggesting spread from farm to farm. It is often difficult to rule out chance in the apparent spatial clustering of disease events. The clustering may be an artifact due to the distribution of farms, or it may be real. Method based on "mean distances" Compares the mean distance between any two infected farms to: a) The mean distance between randomly selected non-infected farms and the closest infected farm b) The mean distance between two randomly selected non-infected farms If farm to farm spread is important, you would expect the average distance between pairs of infected farms to be less than the average distance between a non-infected farm and the nearest infected farm. Interpretation of Clustering Once a relationship between disease and a geographic area has been established, then you need to determine whether animal characteristics (host factors) explain the geographic variation. Evidence for geographic association
Do animals leaving the high risk area develop a lower risk of disease after leaving? Do healthy animals coming into the high risk area develop a higher risk of disease?
Version 21_12_2009 Page 111
Veterinary Field Epidemiology in Action Course Notes
Animals in the suspect area have a higher frequency of disease than animals of the same species, breed, and age outside the area. Animals with different host characteristics all have a higher risk of disease inside the suspect area. Characteristics of the Affected Population (persons/animals) Affected persons/animals may be characterize and describe by various variables; age, sex, occupation, class, species, clinical manifestation, etc. Lesson Summary:
1. An outbreak is an increase in the number of cases over past experience for a given population, time and place.
2. An outbreak is described using three epidemiological parameters; Time, Place,
Person/animal.
3. An outbreak investigation includes epidemiological, environmental and laboratory components.
4. Steps of an outbreak investigation include the following: Confirm the outbreak;
establish case definition; identify cases; describe the outbreak according to time, place, and person/animal; develop a hypothesis; intensive follow-up; share results.
5. Collection of data is very resource demanding. Ensure the quality of data collected.
6. Constructing an outbreak curve and mapping are fundamental parts of descriptive
epidemiology.
7. Person/animal characteristics should be described in detail and stratified accordingly.
Version 21_12_2009 Page 112
Veterinary Field Epidemiology in Action Course Notes
Module 3.4 Observational Studies and Their Use in Epidemiology Dr. Kachen Wongsathapornchai, Epidemiologist, Thailand Department of Livestock Development Applied Research Epidemiology must deal with the natural state of the world where many factors cannot be controlled. Field research involves problem solving and takes place under real world conditions and usually a clinical or field setting. Case reports and case series studies are limited in their size and scope and do not support conclusions about the relative efficacy of treatment, cause of disease or risk factors for the disease. Therefore applied, analytic research will be the focus of this module. A defining characteristic of an analytic study in is that a formal statistical comparison is made between at least 2 groups: the index group and the comparison group. Experimental Studies Experimental studies assess treatments and other interventions under controlled or semi- controlled conditions. Clinical trials and field trials to test new drugs and vaccines are common examples of experimental studies. Observational Studies Observational studies involve no intervention or interferences where the epidemiologist observes the normal course of events. - un-controlled environment - survey, cross-sectional, case-control, longitudinal, cohort
Definitions: Populations, Samples and Sampling Population = External Population = in sampling, the whole collection of units from which a sample could be drawn; Study Population = the Target Population = the subjects that are actually available for sampling, it is desired that they be representative of the population; Sample = the Study Sample = the subjects chosen for study, it is desired that they be representative of the study population Reference Population = group of individuals to which the results of a study can be inferred. With proper sampling inferences can be generalized from the sample to the target population. Inferences to the external population depend on proper sampling and being biologically reasonable. There are 2 basic types of Sampling: probability sampling (e.g. simple random sampling or stratified random sampling) and non-probability sampling (e.g. systematic or haphazard sampling, samples of convenience). A probability sample requires a formal random technique for selection of study subjects at some stage. The random technique assures that every subject within a block has the same probability of being selected for study. Random sampling is preferred when possible because it is more likely to be a representative sample.
Version 21_12_2009 Page 113
Veterinary Field Epidemiology in Action Course Notes
Analytical Studies These are designed to identify associations or correlations between independent and dependent variables but ASSOCIATION ≠ CAUSATION Note that because 2 things are associated (or correlated) does not necessarily mean there is a cause and effect relationship between them. Observational Studies Observations are made of the normal progression of events usually in a “real life” setting without interfering. It may be the only ethical way to study some disease, treatments or control measures. Observational studies are more susceptible to bias because randomization usually cannot be applied, often require more complex analyses and examine both exposure and disease outcome variables. examine exposures and disease outcomes
Observational studies have three aspects: 1) Timing = the temporal relationship between the planning/start of the study and the collection of data or occurrence of the events being studied (i.e. exposure and disease); 2) Directionality = the order in which exposure and outcome are studied; 3) Sample Selection = criteria by which subjects are selected, can be based on outcome, exposure or other criteria. Of these 3 aspects, sample selection criteria give the best characterization of an observational study and are the most meaningful for describing a type of study. NOTICE: Prospective Study and Retrospective Study are not meaningful characterizations for a type of study. Prospective is used to describe a study where all the relevant events (data collection, exposure, disease) occur after the start of the study and “retrospective” describes a study where these events occurred prior to the start/design of the study. Prolective has also been suggested as a term to describe studies in which data is collected after the start of the study with Retrolective being used to describe studies that rely on existing data sources. An Historical study is conducted using existing records to reconstruct information about exposure and/or disease status from the past, prior to the start of the study. A Longitudinal study follows subjects through time. Exposure and or disease status are measured at various points over time. *Although they may be used to further characterize a study, by themselves these terms are not adequate to identify what type of study was conducted!*
Version 21_12_2009 Page 114
Veterinary Field Epidemiology in Action Course Notes
Types of Observational Studies 1. Surveys Often descriptive in nature, surveys involve counting members of a population and measuring their characteristics. They are limited to measuring frequency of disease or exposure and not analytical in nature. They can be used as a tool for an analytical epidemiological study. Characteristics:
Descriptive only, no formal statistical comparisons are made; Advantages:
Analysis is usually straightforward; Can be used as a tool for analytic studies;
Disadvantages:
Sampling can be very complex; Do not provide evidence of associations between exposure and disease or efficacy of treatments.
Example: A questionnaire is mailed to veterinarians in private practice to identify antibiotics they use to treat respiratory, integumentary, orthopedic and multisystemic infections. 2. Cross-Sectional Study (Prevalence Study)
Sampling is independent of both exposure and disease status; Disease and exposure measured at the same point in time; Cannot establish which came first, exposure or disease; Provide weak evidence for causation.
Longitudinal Studies
Considered as a series of cross-sectional studies; Sampling is independent of both exposure and disease; Disease and exposure are measured at several points in time; Follow changes over time.
Characteristics: Sampling is independent of both exposure and disease; Usually conducted at one point in time.
Advantages: Simple, quick , cheap, usually few animals needed Good for chronic disease, static disease in static population with exposure factors that do not change (e.g., breed, gender)
Disadvantages: Temporal relationship between exposure and disease may not be clear.
Example: a sample of dogs from the local animal shelter is examined when they are admitted to the facility to determine their body condition and internal parasite burden.
Version 21_12_2009 Page 115
Veterinary Field Epidemiology in Action Course Notes
3. Case-Control Study
Sampling based on disease (outcome) status for cases first then the researcher looks at the exposure status
Can be historical, prospective, retrospective Compares exposures between 2 groups: cases and controls Cases and controls should be examined in the same way to determine exposure status Can identify associations between multiple exposures and disease Provide evidence to support preventive recommendations
Characteristics:
Sampling is based on disease (outcome) status.
Advantages:
Relatively inexpensive, quick, few animals needed; Good for screening large number of potential risk factors and single outcome; Efficient for the study of rare diseases.
Disadvantages:
cannot measure disease incidence since the entire population is not sampled; selection of controls can easily introduce
bias; difficult to establish temporal relationship between exposure and disease.
Example: Dogs with poor body condition are identified at the local animal shelter, the
parasite burden of these dogs is compared with that of dogs of the same age and day of admission in good body condition.
4. Cohort Study
Sampling starts with exposure then the researcher looks for the outcome; Compares outcome (incidence of disease) between 2 groups: exposed and unexposed; Establishes associations between exposures and outcomes (may or may not be causal); Exposed and unexposed subjects should be examined in the same way to determine disease status;
Characteristics:
Sampling is based on exposure status
Version 21_12_2009 Page 116
Veterinary Field Epidemiology in Action Course Notes
Advantages:
Measures disease incidence because the entire population is sampled; Establishes temporal relationship between exposure and disease; Provides good evidence for causal argument; Better for confirming specific hypotheses; Good for evaluating a large number of outcomes related to a single exposure.
Disadvantages:
relatively expensive, take time; Not useful for screening a large number of potential risk factors or exposures; Not efficient for the study of rare diseases so a larger number of animals needed.
Example: the parasite burden of dogs at a local animal shelter is determined when they arrive. After 6 months they are re-examined to determine body condition, the incidence of poor body condition is compared between dogs with high and low parasites. Lesson Summary:
1. Field research involves problem solving and takes place under real world conditions and usually a clinical or field setting.
2. A defining characteristic of an analytic study in is that a formal statistical
comparison is made between at least 2 groups: the index group and the comparison group.
3. Epidemiological studies include analytical and observational types.
4. Observational studies include four types; surveys, cross-sectional, case-control and
cohort studies. Each study type is designed to answer different questions and each type has its advantages and disadvantages.
Version 21_12_2009 Page 117
Veterinary Field Epidemiology in Action Course Notes
Module 4.1 Data Presentation and Report Writing Dr. Theera Rukkwamsuk Faculty of Veterinary Medicine Kasetsart University Data Presentation Presenting data that has been collected is an important process that is part of completing the work of field epidemiologists. What data is presented and how data is presented are important since this represents the work of data collection and preliminary analysis. Methods for Presenting Results The first part of presenting data is to explain clear and understandable way the components of descriptive epidemiology including person, place and time elements using tables, charts, graphs, maps, symbols and other illustrations of events. Here are some specific areas to take note of when presenting data:
Variables are properly labeled; Appropriate interval scales are used; Important differences are clearly evident; For outbreak data, state the date the graphic was prepared; Sources of data outside of your organization must be properly referenced.
The second part of presenting data is to draw conclusions and make recommendations for the prevention and control of the disease in question. Both conclusions and recommendations must come from the data presented keeping in mind that as more knowledge about the field situation develops, conclusions and recommendations must be changed. For this reason we can consider describing conclusions and recommendations as “preliminary” or “final” in nature. Common data terms used include the following:
Cells are spaces in the graphic where data are entered; Class interval is the system sub-grouping used such as quartiles, age interval, breed level,
production level, etc.; Scale is noted for continuous data such as temperature, weight, etc.; A coordinate is a data pair with a common point of intersection (on the x and y axis,
latitude and longitude); Discrete data can only be whole number; Frequency distribution includes a count of the number times an event occurs. A table is a set of data arranged in rows and columns (often referred to as “row and
column data”. Tables Tables are used to present the frequency of events or when comparing results for two groups. A well constructed table has the following characteristics:
Version 21_12_2009 Page 118
Veterinary Field Epidemiology in Action Course Notes
Clear and concise title; Simple with limited number of factors; Each row and column is labeled; Row and column totals are shown; Codes, abbreviations and symbols are explained in footnotes; Format the table using boxes and lines so it is easy to read.
Graphs It is said that “a picture is worth a thousand words” and a graph is a visual picture of data points which is very powerful and simple for the reader to understand. Here are some characteristics of a well-constructed graph:
Data is shown between at least two intersecting line (x and y axis); Each axis has a measurement scale and a label;
o Scale can include arithmetic, semi-logarithmic, histogram (bar graph), frequency polygon (unusual shaped graphs)
The horizontal, x axis often represents time; The vertical, y axis represents the frequency of occurrence of an event; Simple graphs are most effective; Every good graph should explain itself without additional detail required.
Charts Charts can be bar charts that show frequency distributions and time-series data. They also include geographic maps including spot maps and shaded density maps that show areas with varying levels of disease. A pictogram is similar to a bar chart but using symbols and pie charts divide proportions into wedge shaped pieces of a circle. Report Writing For the field epidemiologist, the report is not meant to sit on a shelf but to be used to support decisions. It is a tool to inform and advise decision makers as to what action to take in response to a question or significant event. Writing can be a difficult process and it is through a repetitive and persistent effort field epidemiologists must strive for clear communication of methods used, results obtained, conclusions drawn and recommendations for follow-up action. A report is a statement of the results or findings of an investigation or of any matter on which definite information is required. Reports are highly structured in format and by convention should include the way that information was gathered as well as the results themselves. The following statement expresses how a report should be written: “Write with precision, clarity and economy (to the point). Every sentence should convey the exact truth as simple as possible. (Instructions to authors, Ecology, 1964) A field epidemiology report should describe the field research activity, develop conclusions and recommendations for decision makers. Specifically,
When describing the field research activity define the problem that was studied, why it was important and how it fits into other related activities in this area;
Describe results for scientific and non-scientific terms; Draw conclusions from the results; Make practical recommendations from the conclusions for government reports.
Version 21_12_2009 Page 119
Veterinary Field Epidemiology in Action Course Notes
In the beginning stages of writing a report it is critical to just begin writing and capture ideas. The following steps are very useful to follow:
Start with an abstract that includes a thesis (argument) of what you want to explain; o Link your work with previous research and findings; o The argument or thesis should form the main foundation of the report;
Develop an outline of the report under the following headings; o Introduction; o Literature review; o Methodology; o Results; o Discussion; o Conclusions; o Recommendations for government reports;
Write an initial draft; Revise, revise, revise and revise!
Sections of the Report Develop a report structure that can be used consistently. Title Page: Should be short and meaningful and should include the disease agent, aspect of the study and the variables involved. Acknowledgements:
Include persons who supported the work but who were not authors; Authors are collaborators who contribute substantively to the content or reasoning of the
study; Table of Contents:
List of Tables List of Figures
Abstract:
A 200 to 300 word non-technical summary of the research project using brief statements; o Purpose of study (central question to address); o Methods; o Results: o Conclusions; o Make recommendations for government reports;
Introduction:
Introduce the background (literature review or relevant events) and significance (reason why the report is important) and state the general purpose and significance of the report.
Methods:
Describe methods and procedures used to collect data in detail so that the reader could undertake the same steps;
o Reasons for the approach used; o Hypothesis tested;
Version 21_12_2009 Page 120
Veterinary Field Epidemiology in Action Course Notes
o Describe the study in terms of Time (when), Place (where) and Person/Animal
(who); Describe methods and procedures used for epidemiological, environmental or laboratory
analyses; o Describe how the population was selected; o Describe the type and source of data; o Describe methods for collecting data; o Describe how data was analyzed;
Justify the methods used when appropriate; Results:
Present and summarize the main findings clearly and include other interesting findings of significance;
Accept or reject the Null Hypothesis (HO); Discussion:
Explain the significance of the results with other studies or field based findings; State the limitations of the study including methods used, analyses performed or
challenges in studying the population involved; Offer solutions to correct limitations in the study to improve the next study of this type;
Conclusions:
Restate the main problem to be studied; Summarize the main findings and their significance and meaning; Make conclusions based on the data presented that take into account the shortcomings of
the study; Propose what future approach or studies could be done to further address the problem
studied; Recommendations for Government Reports:
Reports of field investigations, situation assessments and disease assessments should include recommendations for decision makers that are similar scope to an abstract;
Recommendations should fit the conclusions of the study or investigation including the limitations identified and recommendations for the prevention and control of the disease;
Recommendations should be consistent with the findings, present the findings and must include the specific actions to be taken based on current understanding of the issue.
Note: Many factors enter into a final decision as to how recommendations from a field study or report are acted upon by a government or organization including political, social, economic and cultural reasons. It is the work of field epidemiologists to present science based decisions to decision makers for their consideration and ultimate action. Appendices:
Include any extra data that might be relevant. Endnotes:
Include anything that requires further explanation. References: (best to include them as you find references)
Include standard formatting for references and cite all articles and internet sources according to currently acceptable formats
Version 21_12_2009 Page 121
Veterinary Field Epidemiology in Action Course Notes
Presentations Computer software such as Microsoft PowerPoint® are powerful tools for sharing results among groups of stakeholders. Basic principles for using this type of software to present results form field activities follows:
Allow enough time to spend 1 to 2 minutes to view each slide and budget time accordingly;
Present an outline of topics to be covered at the beginning of the presentation; Include a slide to acknowledge contributors Use text from word processor software; Use an easy to read font and double space text, allowing enough space to see everything
clearly; Use consistent formatting of the title and body of each slide; Use the most appropriate tables, diagrams, photos and maps to illustrate key points
without the use of text where possible; Include a summary slide at the end to review main points.
Oral Presentations Developing skills in making oral presentations provide opportunities for career growth and development at work and for further educational opportunities. It is said that the secret to good public speaking is to talk about something you have earned the right to know and care about (Anon.). This should be easy work for field epidemiologists! Here are some tips on public speaking:
Lose yourself in your topic – talk about something you know and care about; Don’t worry about being a bit nervous – it provides good energy for the presentation
when it is under control; Often you will have 15 minutes to briefly outline the purpose, main methods, findings,
conclusions and recommendations (see below); Allow some time for questions and discussion; Inform the audience what you will discuss, discuss it, then review what you just said; Dress nicely; Speak slowly and clearly; Do not fidget (nervous movements); Move freely and relax; Use a podium if it is provided; Check you watch to gage the time remaining – it is considered rude to some audiences to
go over the time allowed. Oral presentations can be done by reading what is written on a page and seven double spaced pages may take 15 minutes or so to read. This method requires someone with a good speaking voice who is able to hold the interest of the audience. Reporting Scientific Results in a Presentation:
Explain the problem and its importance; Describe the setting and location using maps; Explain methods and reasons for using them;
Version 21_12_2009 Page 122
Veterinary Field Epidemiology in Action Course Notes
Describe and explain the results; Draw conclusions; Make recommendations to decision makers for prevention and control efforts.
Use of Presentation Graphics:
Graphics should be visible from far away; Select fonts that are clear and easy to read – minimum 20 font is best Read the main points from the screen; In a darkly lit room, dark color background works well; in a brightly lit room, light
background works best; Use simple backgrounds that do not compete with the information you are providing; Use the master slide to create consistent style; Maps and illustrations should look professional; Avoid the use of large tables – provide handouts instead; Follow the rule of thumb – allow 1 to 2 minutes per slide; Insert a blank slide when you want the audience to stop and listen; More than 4 lines of text are difficult to read; End with a blank slide or picture so that the blank PowerPoint slide is not the last thing
seen; At the end, ask whether there are any comments or questions: Do not leave until
interaction with the audience stops; You will know you have engaged your audience if you get good questions! Lesson Summary:
1. The first step of presenting data is to explain clear and understandable way the components of descriptive epidemiology including person, place and time elements using tables, charts, graphs, maps, symbols and other illustrations of events.
2. The second part of presenting data is to draw conclusions and make
recommendations for the prevention and control of the disease in question.
3. For government reports, conclusions and recommendations must come from the data presented keeping in mind that as more knowledge about the field situation develops, conclusions and recommendations must be changed. For this reason we can consider describing conclusions and recommendations as “preliminary” or “final” in nature.
4. “Write with precision, clarity and economy (to the point). Every sentence should
convey the exact truth as simple as possible. (Instructions to authors, Ecology, 1964)
5. Compile reports and presentations in a systematic way that is standardized, complete and easy to understand.
6. The secret to good public speaking is to talk about something you have earned the
right to share and that you care about (Anon).
Version 21_12_2009 Page 123
Veterinary Field Epidemiology in Action Course Notes
NOTES:
Version 21_12_2009 Page 124
Veterinary Field Epidemiology in Action Course Notes
Glossary of Some Essential Terms in Field Epidemiology
Accuracy means that results reflect what was intended to be measured. Adjusted risk is the risk adjusted according to a standard size population. Bias is a systematic error that affects our ability to objectively relate exposure variable with the outcome variable. Binomial is a mathematical distribution model defined by only two distinct choices, like when we flip a coin. Census is a complete counting of all known members of a population. Central Limit Theorum states that if we sample a population enough in a random way, the sampling results represent the true population estimate given certain assumptions. Coded data means that a specific number represents a response or result. Confounder is a factor that is independently associated with a disease outcome variable (vND) and a risk factor but is not a cause of the disease. Continuous data is data that can take on any value along a gradual scale of values. Crude risk is the original unadjusted proportion. Data is something that can be transferred in the form of numbers, writing, maps, images or symbols. Discrete data is data that falls into categories or choices rather than continuous. Case Definition means the clinical, pathological, laboratory and epidemiological characteristics that define a positive case. Confounder means an exposure variable (e.g. age) that is independently associated with a disease but is not the cause of the disease. Denominator is the lower half of a fraction. Disease is a state of reduced biological well-being due to imbalance in the relationship between a host, its environment and disease agents. Disease Ecology describes the way that a disease agent, its host and the environment interact. Emerging Infectious Diseases (EID) include disease agents affecting animals and/or humans that are completely new or are rapidly re-emerging. Endemic pattern of disease means that the number of incident disease cases remains present at an elevated level within a population. Epidemic pattern of disease means that there is a rapid and significant increase in the incident cases of a disease above an expected level. Epidemiology is a scientific discipline and the study of the frequency and distribution of disease and health in populations in order to prevent and control disease and to promote health. Epidemiological Triad is the changing relationship between disease agent, the host and the environment that may lead to disease. Exposure variable is a factor that may be associated with disease and with specific outcome variable(s). Fomites are inanimate object that are contaminated with disease agents Gold Standard Test is a confirmatory laboratory test that is considered the definitive test by international animal health organizations such as OIE and FAO when the test is conducted at a laboratory approved to conduct the test. Health is a state of optimal biological well-being and balance in an individual or population. Iatrogenic means the disease condition is caused by man. Iceberg Principle means that even though members of a population exposed to a disease agent may appear to be clinically normal but they still play an important role in the disease transmission cycle in a population. Incidence measures the number of new events or cases over time. Incident cases are the new cases detected over a specific time period. Index Case is the first known positive case of the disease in a defined outbreak.
Version 21_12_2009 Page 125
Veterinary Field Epidemiology in Action Course Notes
Individual is one member of a population. Clinical medicine and surgery deal with the health and disease status of the individual. Information is the act of transferring a message about something from one person to another. Measures of central tendency are ways to describe the average value of continuous data including mean, median and mode. Mean is the arithmetic average value of a series of numerical results. The geometric mean is the central measure for values that are ratios (e.g. titer results). Median is the middle value of a series of numerical results. Mode is the most commonly repeated value in s series of numerical results. Necessary causes are factors that must be present in order for disease to occur. Nominal data is a type of coded data where the numbers only have a meaning in relation to the result it represents. Normal distribution is a bell-shaped distribution that describes the way that many biological characteristics are distributed. Null hypothesis is a formal scientific statement presented in a negative sense that proposes an exposure variable is not associated with an outcome variable. Numerator is the upper half of a fraction. Ordinal data is a type of coded data where the order of numbers is used to produce a ranked score. Outcome variable is a result of a disease event. Population is a collection of individuals and is the main focus of epidemiology. Population at Risk (PAR) is a susceptible or at-risk population that is considered according to its characteristics. Precision means that test results are consistent when testing the same animal under the same conditions. Premises is a unique geographic location identified by latitude and longitude. Prevalence means the number of existing cases at some point or period of time. Prevalent cases are the existing cases detected over a specific time period. Probability is the likelihood of an event expressed as a proportion or ratio. Proportion is a fraction where the numerator is part of a combined denominator. Prospective data is collected from the current time into the future. Random selection means that every member of a population has an equal and independent probability of being selected. Rates is a risk (probability) that is calculated over a given time period. Ratio is a fraction where the numerator is not part of a combined denominator. Recall bias means that the accuracy of data is negatively affected by the ability to recall events due to time passing. Repeatable means that test results are consistent when testing under similar conditions. Reservoirs are living sources of disease agents including wild animals, insects and other life that act as a source of disease agents for the population at risk prior to exposure. Retrospective data is collected from historical sources. Selection bias is the systematic error of including or excluding subjects used to evaluate the exposure factor and the outcome variable. Sensitivity measures the ability of a test to detect an animal that is truly positive. Specificity measures the ability of a test to detect an animal that is truly negative. Sporadic pattern of disease means that the numbers of incident disease cases occur in isolation over time at few locations very rarely. Sufficient causes are factors that either may or may not be present in order for disease to occur. Unit of Measure is an identifying name or scale to describe person/animal, place and time. Unit of Interest means what is being sampled including individual animal/human level, or herd/flock level.
Version 21_12_2009 Page 126
Veterinary Field Epidemiology in Action Course Notes
Variables are either factors or outcomes that are associated with a disease.
Version 21_12_2009 Page 127
Veterinary Field Epidemiology in Action Course Notes
Selected References
Cameron, A. 1999: Survey Toolbox – A Practical Manual and Software Package Active Surveillance of Livestock Diseases in Developing Countries. ACIAR Monograph No. 54, 330 p. Claire Lecture. http://www.abdn.ac.uk/public_health/course-materials/ documents/ClaireLectureV4.ppt#329,18, Advantages/ Disadvantages Dohoo, I.R., Martin, S.W., Stryhn, H. 2003: Veterinary Epidemiological Research. AVC Inc. PEI, Canada, 706 p. FAO References:
The Global Strategy for Prevention and Control of H5N1 Highly Pathogenic Avian Influenza - October 2008 ftp://ftp.fao.org/docrep/fao/011/aj134e/aj134e00.pdf Biosecurity for Highly Pathogenic Avian Influenza: Issues and options ftp://ftp.fao.org/docrep/fao/011/i0359e/i0359e00.pdf Preparing for Highly Pathogenic Avian Influenza http://www.fao.org/docrep/010/a0632e/a0632e00.htm Wild bird highly pathogenic avian influenza surveillance: sample collection from healthy, sick and dead birds ftp://ftp.fao.org/docrep/fao/010/a0960e/a0960e00.pdf Wild birds and avian influenza: an introduction to applied field research and disease sampling techniques ftp://ftp.fao.org/docrep/fao/010/a1521e/a1521e.pdf
Fleiss, J.L. 1981. Statistical Methods for Rates and Proportions. 2 ed. New York: John Wiley & Sons, 321 p.
Gay, J. M. Epidemiological Concepts for Disease in Animal Groups. http://www.Vetmed.wsu.edu/courses-jmgay/EpiMod2.htm Green M.D., Freedman D.M., Gordis L. Reference Guide on Epidemiology. http://www.fjc.gov/public/pdf.nsf/f385048e0431aa3c8525679e0055d35c/e70fd809f2a7389485256a870045906b/$FILE/6.epide.PDF. Retrieved on 10 December 2008. Gregg, M. (Ed). 2008: Field Epidemiology, Third Edition. Oxford University Press. New York, 572 p. International Laboratory for Research on Animal Diseases. THEILERIOSIS in Eastern, Central and Southern Africa, proceedings of a workshop on East Coast fever immunization held in Lilongwe, Malawi 20-22 September 1988 Organized by The International Laboratory for Research on Animal Diseases, The Food and Agriculture Organization of the United Nations, The Organization of African Unity With support from The Government of Malawi Edited by T.T. Dolan. Published by THE INTERNATIONAL LABORATORY FOR RESEARCH ON ANIMAL DISEASESBOX 30709 · NAIROBI · KENYA
Version 21_12_2009 Page 128
Veterinary Field Epidemiology in Action Course Notes
Kaplan. http://rds.epi-ucsf.org/ticr/syllabus/courses/40/2008/08/27/Lecture/notes/kaplansylaug27.ppt Kelsey, J.L., Whittemore, A.S., Evans, A.S., Thompson, D.W. 1996: Methods in Observational Epidemiology, Second Edition. Oxford University Press. New York, 432 p. Kleinbaum, D.G., Kupper, L.L., Morgenstern, H., Mullen, K.E. Applied Regression Analysis and other multivariable methods. 2nd ed. Boston: PWS-Kent Publishing Co, 1988. Kotova A.L., Kondratskaya S.A, Yasutis I.M. Salmonella carrier state and biological characteristics of the infectious agent. J Hyg Epidemiol Microbiol Immunol 1988;32(1): 71-78. Martin, S.W., Meek, A.H., Willeberg, P. 1987; Veterinary Epidemiology Principles and Methods. Iowa State University Press. Ames, Iowa. 343p. Massey University. http://epicentre.massey.ac.nz/Portals/0/EpiCentre/ Downloads/Education/202-251/QuestionnairesJB_2008.ppt Mazet, J. “Outbreak Investigation”, (DVM, MPVM, PhD), Wildlife Health Center, School of Veterinary Medicine, University of California Davis, CA 95616, USA (lecture note) Morbidity Mortality Weekly Report, 2004;53 (No. RR-5) Murphy, F.A. Emerging Zoonoses. Emerging Infectious Diseases 1998;4(No3): 429-435. Norman, G.R., Streiner, D.L. 1994. Biostatistics: The Bare Essentials. 1st ed. St. Louis: Mosby-Year Book Inc., 260p.
OIE Terrestrial Animal Health Code 3.8 – 2007. Pfeiffer, D. U. 2002: Veterinary Epidemiology – An Introduction. http://vetschools.co.uk/EpiVetNet/epidivision/Pfeiffer/files/Epinotes.pdf Pfeiffer, D. U. 3 to 5 November 2008: Workshop on Surveillance and Qualitative Risk Assessment in Animal Health, Kasetsart University. Schoenbach, V.J., Rosamond, W.D. 2000. Understanding the Fundamentals of Epidemiology - An Evolving Text. Chapel Hill, North Carolina. http://www.epidemiology.net/evolving/Table of contents.htm Toma, B., Dufour, B., Sanaa, M., Benet, J-J., Ellis, P., Moutou, F., Louza, A. 1999: Applied veterinary epidemiology and control of disease in populations. Maisons-Alfort, France: AEEMA, 536 p. Tulane University. www.tulane.edu/~lamp/pdfs/how_to_write_a_research_ report_presentation.pdf University of Massachusetts. http://www.umass.edu/schoolcounseling/Welcometo AmherstMassachusetts/ReportingandPresentingData. ppt
Version 21_12_2009 Page 129
Veterinary Field Epidemiology in Action Course Notes
U.S. Center for Disease Control and Prevention, “Constructing an Epidemic Curve”, http://www.cdc.gov/cogh/dgphcd/modules/MiniModules/Epidemic_Curve/page01.htm, January 2009. U.S. Center for Disease Control and Prevention, “Constructing an Epidemic Curve”, http://www.cdc.gov/cogh/dgphcd/modules/MiniModules/Epidemic_Curve/page01.htm, January 2009. U.S. Center for Disease Control and Prevention, Updated Guidelines for Evaluating Public Health Surveillance Systems. 2001. U.S. Center for Disease Control and Prevention, Framework for Program Evaluation in Public Health. 1999. Protocol for NSU Evaluation of Animal Health Surveillance Systems United States Department of Agriculture, Animal and Plant Health Inspection Service. Animal Health Monitoring and Surveillance. Wikipedia, “Descriptive statistics”, http://www.en.wikipedia.org/wiki/Descriptive_statistics, January 2009.
Version 21_12_2009 Page 130
Veterinary Field Epidemiology in Action Course Notes
Course Instructors
To be provided
Version 21_12_2009 Page 131
Veterinary Field Epidemiology in Action Course Notes
Itinerary for Field Activities: Brucellosis Surveillance
To Be Provided
Field Activities: Brucellosis Surveillance (I)
Course Goal: Assess population health and disease status by conducting surveys and surveillance. Learning Objective: To experience trainees how to use their surveillance knowledge in the field situation: Essential Points to Learn: Define objectives and activities for surveillance system List of related activities and materials/equipment needed for each topic:
1. Group Discussion (Wednesday 4th evening) 1.1. Generate objectives of surveillance system in animal health - using survey data
(brucellosis in Daily) 1.2. Design surveillance system base on the objectives of the surveillance system (sero-
surveillance) 1.3. Data need
2. Field activities (Surveillance system for brucellosis in sub-district level) 2.1. Basic data collection (1/2 day in Provincial Livestock Office) 2.2. Field data collection 2.3. Collect data 2.4. Interview farmers (preparing for data need) 2.5. collect sample from herd for brucellosis testing 2.6. field testing (Rose Bengal test)
Instructor(s): FETPV Team
Field Activities: Brucellosis Surveillance (II) Course Goal: Assess population health and disease status by conducting surveys and surveillance. Learning Objective: To experience trainees how to use their surveillance knowledge in the field situation: Essential Points to Learn: Define data need, data collection, entry and analysis (descriptive analysis) List of related activities and materials/equipment needed for each topic: Field activities on data collection in daytime and discussion in evening Data collection by using designed questionnaire
1.1. Sample collection and testing 1.2. Data handling and entry
Version 21_12_2009 Page 132
Veterinary Field Epidemiology in Action Course Notes
2. Mentoring on analysis of surveillance data and preparing for presentation (Thursday 12th)
2.1. Appropriate data will be provided for analysis 2.2. Summarize and making recommendation from surveillance field activities
Version 21_12_2009 Page 133
Veterinary Field Epidemiology in Action Course Notes