29
VGI Partners Global & Asian Fund Updates FY21 Investor Briefing – 20 August 2021

VGI PartnersGlobal & Asian Fund UpdatesFY21 Investor Briefing – 20 August 2021

2
FY21 Summary for VG1 and VG8
Dividend
4% p.a. fully franked dividend yield targetFully franked final dividend of 5.5c for FY2130 Aug 2021 – DRP election due 29 Sep 2021 – payment date
VGI Partners Global Investments (VG1)FY21 net profit after tax: $153.9mFY21 portfolio return (net of fees and pre-tax): 25.6%FY21 total shareholder return: 36.3%
Dividend
4% p.a. fully franked dividend yield targetFully franked inaugural dividend of 5.5c1 Sep 2021 – DRP election due 29 Sep 2021 – payment date
VGI Partners Asian Investments (VG8)FY21 net profit after tax: $58.8mFY21 portfolio return (net of fees and pre-tax): 15.0%FY21 total shareholder return: 27.6%

3
Key VG1 and VG8 Initiatives
1 Excluding c.$15m of capacity in the Charitable Foundation Class of the VGI Partners Master Fund.
1. VG1 and VG8 Dividend Policy Targets
Intention to target a fully franked dividend yield of 4% p.a.
VG1 final dividend of 5.5c fully franked; VG8 final dividend of 5.5c fully franked
2. Enhanced Adviser Relations and Shareholder Communication
Recent hire of CEO and Sydney-based Head of Distribution to accelerate adviser engagement
Increased focus on large investors who can build stakes in VG1 and VG8 (noting VGI Partners’ is not currently seeking additional AUM from new clients1)
Monthly NTA now includes Top 10 Long positions (71% of VG1 NAV, 67% of VG8 NAV) and enhanced commentary
Quarterly portfolio update webcasts with the Senior Investment Team
3. Capital Management
VG1 on-market buy-back announced in August 2020 – over 26m shares or 6.4% of VG1 capital has been bought back
VG1 buy-back extended in August 2021 for a further 12 months

VGI PartnersThe Manager

5
Absolute return focus –10-15% p.a. compounding target, through the cycle
A long-term investment horizon provides a competitive advantage
Avoid permanent loss of capital
Winners are rare –deep research results in highly concentrated portfolios
Size of FUM provides flexibility
We are stewards of capital – total staff alignment with investors
Our Philosophy
6
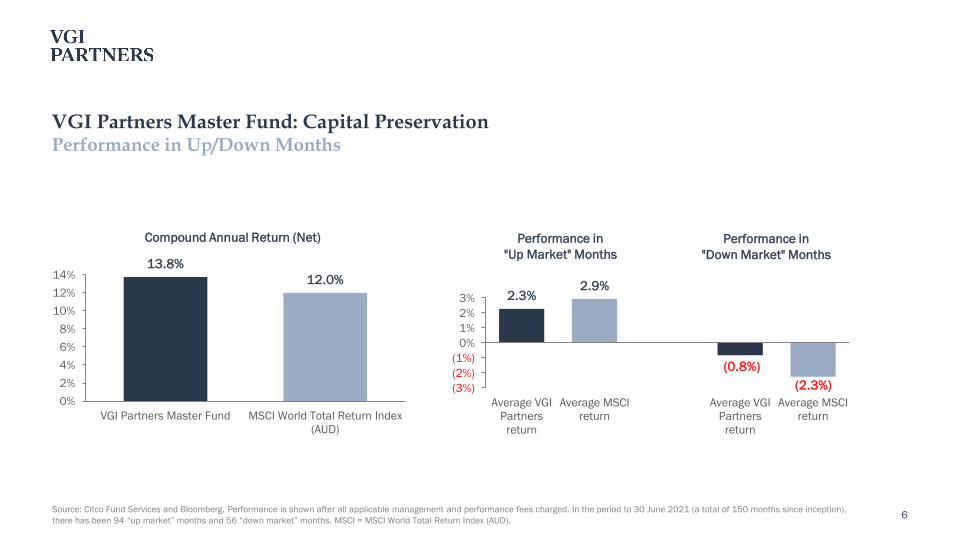
VGI Partners Master Fund: Capital PreservationPerformance in Up/Down Months
Source: Citco Fund Services and Bloomberg. Performance is shown after all applicable management and performance fees charged. In the period to 30 June 2021 (a total of 150 months since inception), there has been 94 “up market” months and 56 “down market” months. MSCI = MSCI World Total Return Index (AUD).
13.8%12.0%
0%2%4%6%8%
10%12%14%
VGI Partners Master Fund MSCI World Total Return Index(AUD)
Compound Annual Return (Net)
2.3%2.9%
(0.8%)(2.3%)(3%)
(2%)(1%)
0%1%2%3%
Average VGIPartners
return
Average MSCIreturn
Average VGIPartners
return
Average MSCIreturn
Performance in "Down Market" Months
Performance in "Up Market" Months

7
Earnings growth is the driver of stock performance – we call businesses with consistent earnings growth compoundersWe think there are three things which count i. Secular growth – as industries stagnate,
competition takes over and compresses returns
ii. Moat – high-growth, high-return businesses inevitably attract competition
iii. Management – as an industry evolves, a high-quality, long-term focused, management team can help navigate these currents
Identify unique businesses Analyse Build portfolio
Concentrated long investments: Typically, top 5 holdings represent c.40-50% of the portfolioSelect short positions: Short positions provide downside protection while also generating a positive expected returnUse of cash to manage risk and provide optionality. Very limited use of leverage
Build detailed model using VGI Partners’ proprietary templateAssess against checklistMeet with management, customers, suppliers, competitorsActive and continuous red teaming, a culture of yes men is dangerous
Portfolio ConstructionProcess

8
Qualitative Filters:Brands, industry, company meetings (500 per year average)
Target Listc. 400 companies (VG1), 90 companies (VG8)
Quantitative Filters:ROE, ROIC, liquidity
Proprietary Screen:Frauds, fads or failures
Shorts Identified:Red flags (10+) – insider selling, restatements, senior departures etc
Extensive Analysis / Intensive Forensic Analysis:20-40 Short opportunities
Long Short
Portfolio ConstructionProcess

VGI Partners Global Investments Limited (ASX:VG1)

10
North America 60%
UK/Europe 28%
Asia 12%
1 As at 13 August 2021, VG1 had net equity exposure of 85% (long 103%, short 18%).2 Asia includes ASX-listed securities.Source: VGI Partners, Citco Fund Services, Bloomberg.
VG1 Portfolio UpdateAs at 31 July 2021
Portfolio Value $999m
Month End Exposures1
Long Equity Exposure 107%
Short Equity Exposure (18%)
Net Equity Exposure 89%
Net Currency Exposure
AUD 100%
Investments
Number of Long Investments: 31
Number of Short Positions: 11
Top Ten Long Investments 71% of NAV
Long Portfolio by Location of Exchange Listing2

11Source: VGI Partners, Bloomberg. Sectors have been internally defined.
Portfolio Value $999m
Top 10 Long Investments Sector % of Portfolio
Amazon.com Inc. eCommerce & Internet 14%
Mastercard Inc. Payments 8%
Cie Financière Richemont SA Luxury 7%
CME Group Inc. Exchanges & Fin Services 7%
Pinterest Inc. eCommerce & Internet 7%
SAP SE Information Technology 7%
Olympus Corporation Medtech 6%
Qualtrics International Inc. Information Technology 6%
Otis Worldwide Corporation Industrials 5%
Active Position Not Disclosed 5%
Total 71%
VG1 Portfolio UpdateAs at 31 July 2021
Long Portfolio by Sector
eCommerce & Internet 29%
Information Technology 21%
Consumer Staples 9%
Exchanges & Financial Services 8%
Gaming & Entertainment 8%
Payments 7%
Medtech 7%
Luxury 7%
Industrials 5%
12
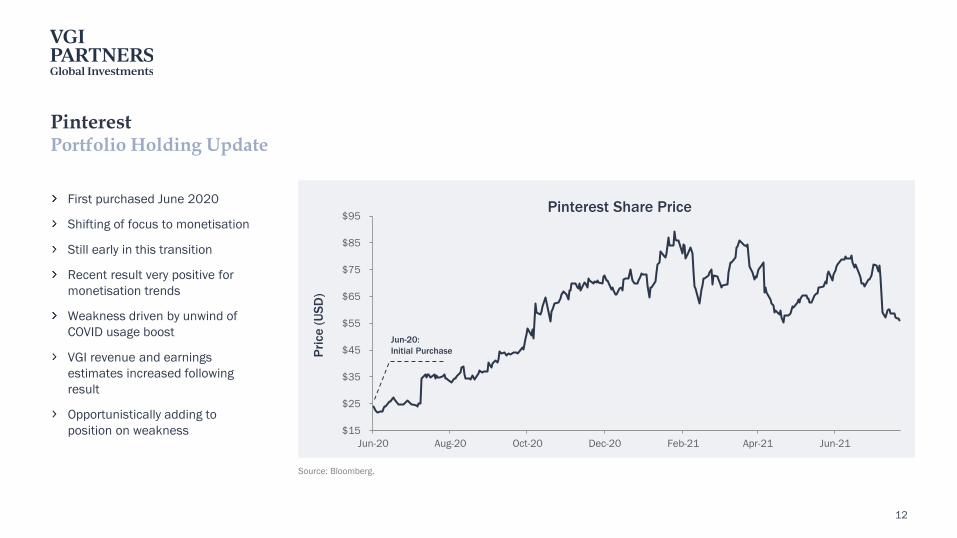
PinterestPortfolio Holding Update
First purchased June 2020
Shifting of focus to monetisation
Still early in this transition
Recent result very positive for monetisation trends
Weakness driven by unwind of COVID usage boost
VGI revenue and earnings estimates increased following result
Opportunistically adding to position on weakness $15
$25
$35
$45
$55
$65
$75
$85
$95
Jun-20 Aug-20 Oct-20 Dec-20 Feb-21 Apr-21 Jun-21
Pric
e (U
SD)
Pinterest Share Price
Jun-20:Initial Purchase
Source: Bloomberg.

13
PinterestPortfolio Holding Update
Highly differentiated platform
Moat has been tested and proven
Users have intent – very valuable for an advertiser
Users are undecided on final product
Safe space on internet with no violent, offensive or controversial content
Important for advertisers
Minimal regulatory risk
Optionality from Shopping and Creator ecosystem
Source: Pinterest. Kleiner Perkins Internet Trends Report.
Product uploads grew 50% in 2Q Creator content up 7x this year
0%
10%
20%
30%
40%
50%
60%
Pinterest Facebook Instagram Twitter LinkedIn Snapchat
Pinterest Users Have High Purchase Intent
% of users finding/shopping products on platform
14
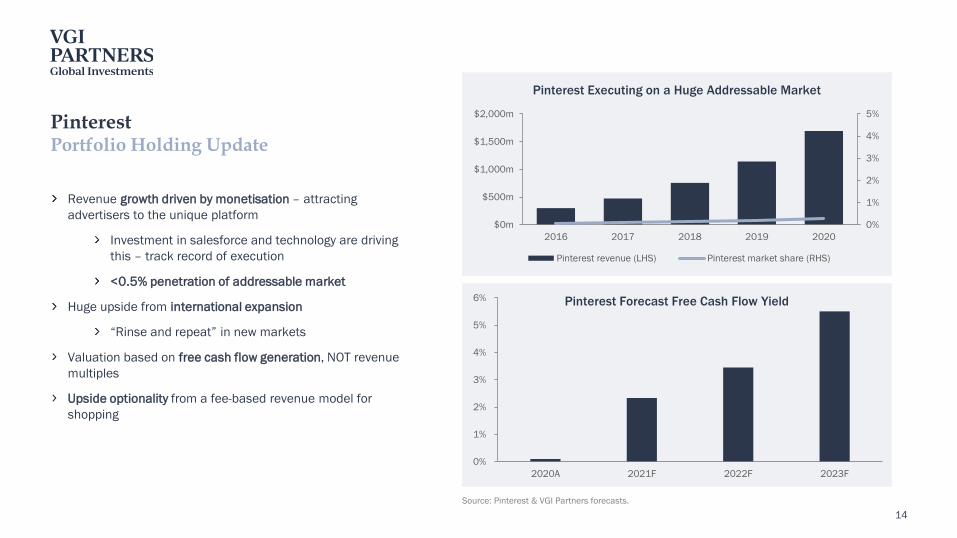
PinterestPortfolio Holding Update
Revenue growth driven by monetisation – attracting advertisers to the unique platform
Investment in salesforce and technology are driving this – track record of execution
<0.5% penetration of addressable market
Huge upside from international expansion
“Rinse and repeat” in new markets
Valuation based on free cash flow generation, NOT revenue multiples
Upside optionality from a fee-based revenue model for shopping
Source: Pinterest & VGI Partners forecasts.
0%
1%
2%
3%
4%
5%
$0m
$500m
$1,000m
$1,500m
$2,000m
2016 2017 2018 2019 2020
Pinterest Executing on a Huge Addressable Market
Pinterest revenue (LHS) Pinterest market share (RHS)
0%
1%
2%
3%
4%
5%
6%
2020A 2021F 2022F 2023F
Pinterest Forecast Free Cash Flow Yield

VGI Partners AsianInvestments Limited (ASX:VG8)

16
1 As at 13 August 2021, VG8 had net equity exposure of 90% (long 98%, short 8%).2 The revenue mix of each equity investment has been used as a proxy for regional exposure.Source: VGI Partners, Citco Fund Services, Bloomberg.
Portfolio Value $585m
Month End Exposures1
Long Equity Exposure 99%
Short Equity Exposure (8%)
Net Equity Exposure 91%Net Currency Exposure
AUD 100%
Investments
Number of Long Investments: 26
Number of Short Positions: 10
Top Ten Long Investments 67% of NAV
VG8 Portfolio UpdateAs at 31 July 2021
Long Portfolio by Regional Exposure – Proxied by Revenue2
Japan 36%
China 15%
Americas 13%
Other Asia 12%
Australia 11%
UK/Europe 9%
Other 4%

17Source: VGI Partners, Bloomberg. Sectors have been internally defined.
Portfolio Value $585m
Top 10 Long Investments Sector % of Portfolio
Cie Financière Richemont SA Luxury 11%
Olympus Corporation Medtech 10%
Nintendo Co. Ltd Gaming & Entertainment 8%
Yakult Honsha Co. Ltd Consumer Staples 7%
Rakuten Inc. eCommerce & Internet 7%
Alibaba Group Holding Ltd eCommerce & Internet 7%
Japan Exchange Group Inc. Exchanges & Fin Services 6%
Crown Resorts Ltd Gaming & Entertainment 4%
Active Position Not Disclosed 4%
Pernod Ricard SA Consumer Staples 4%
Total 67%
VG8 Portfolio UpdateAs at 31 July 2021
Long Portfolio by Sector
eCommerce & Internet 28%
Gaming & Entertainment 17%
Luxury 11%
Consumer Staples 11%
Exchanges & Financial Services 10%
Medtech 10%
Information Technology 9%
Industrials 3%
18
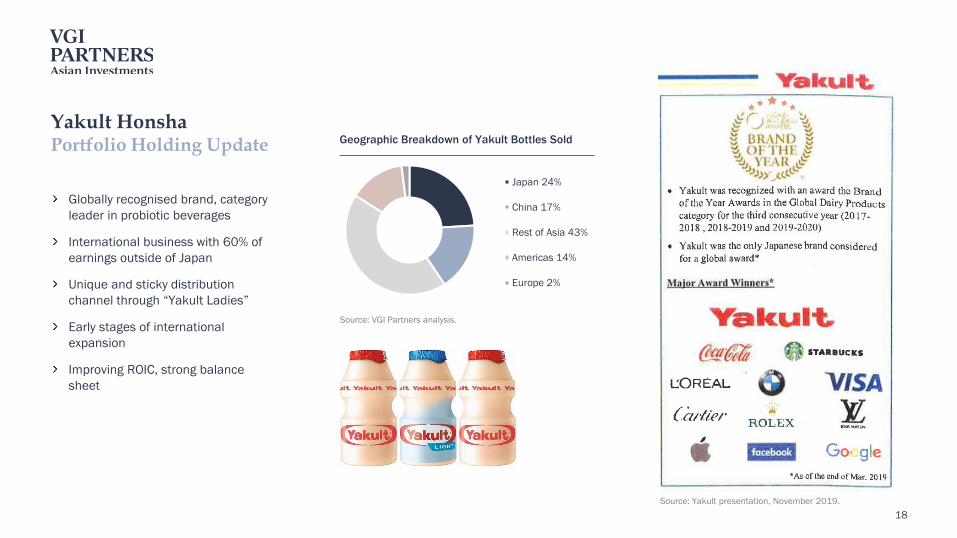
Yakult HonshaPortfolio Holding Update
Globally recognised brand, category leader in probiotic beverages
International business with 60% of earnings outside of Japan
Unique and sticky distribution channel through “Yakult Ladies”
Early stages of international expansion
Improving ROIC, strong balance sheet
Source: Yakult presentation, November 2019.
Source: VGI Partners analysis.
Japan 24%
China 17%
Rest of Asia 43%
Americas 14%
Europe 2%
Geographic Breakdown of Yakult Bottles Sold

19Source: VGI Partners analysis.
Yakult HonshaPortfolio Holding Update
Significant opportunity to:
Grow penetration internationally growth acceleration
Introduce premiumisation internationally large margin uplift
VGI actively engaging with Yakult management behind the scenes to improve shareholder value
VGI proposals:
Implementation of digital marketing strategy
International premiumisation
More shareholder-friendly capital allocation
Source: VGI Partners analysis.
Yakult Penetration Rate
Japan 7.5%South Korea 6.0%Philippines 3.0%Australia 1.0%Brazil 0.7%US 0.1%

Shareholder Engagement

21
Quarterly portfolio briefings
Monthly NTA commentary
Investor Letter each January and July
Annual national roadshow each October
AGM in November
Independent Research
Zenith
Independent Investment Research (IIR)
Shareholder Engagement for VG1 and VG8Please Elect Electronic Communications to Stay Informed
Head of Investor RelationsIngrid Groer, CFAPhone: 1800 571 917 (inside Australia)
+61 2 9237 8923 (outside Australia)Email: [email protected]
Investment Director – Distribution (for Financial Advisers)Matthew NewhamMobile: +61 481 187 178Email: [email protected]

Questions

23
VGI Partners Office Locations
VGI Partners LimitedABN 33 129 188 45039 Phillip StreetSydney NSW 2000Australiawww.vgipartners.com
AFSL No. 321789SEC Registered
VGI Partners Limited Representative OfficeLevel 8 Tri-Seven Roppongi7-7-7 Roppongi Minato-kuTokyo 106-0032Japan
VGI Partners, Inc. 600 Madison Avenue Suite 2101New York, NY 10022USA
Sydney New York Tokyo

Appendix

25
A. VG1 Investment Guidelines
Source: VGI Partners.
Exposure
Number of Long Investments Typically 10-25 (10-15 Core)
Concentration of Long Investments Top five 40-50% of NAV on average
Average Size of Long Investments Start at 1-3% and build to 4-10% of Portfolio’s NAV
Single Security Long Investment Limit 15% at purchase; maximum of 20%
Number of Short Equity Positions Typically 10-35
Average Size of Short Equity Positions Start at 0.5% and build to 1-2% of Portfolio’s NAV
Single Security Short Equity Position Limits 5% at purchase; maximum of 7.5%
Net Equity Exposure Limits Limited to 100% of Portfolio’s NAV; typically between 50-100%
Gross Exposure Limits Maximum of 150% of Portfolio’s NAV; typically between 80-120%

26
B. VG8 Investment Guidelines
Exposure
Number of Long Investments Typically 15-30
Concentration of Long Investments Top ten 40-50% of NAV on average
Average Size of Long Investments Start at 1-2% and build to 4-8% of Portfolio’s NAV
Single Security Long Investment Limit 8% at purchase; maximum of 20%
Number of Short Equity Positions Typically 5-25
Average Size of Short Equity Positions Start at 0.5% and build to 1-2% of Portfolio’s NAV
Single Security Short Equity Position Limits 5% at purchase; maximum of 7.5%
Net Equity Exposure Limits Limited to 100% of Portfolio’s NAV; typically between 50-100%
Gross Exposure Limits Maximum of 150% of Portfolio’s NAV; typically between 70-120%
Source: VGI Partners.

27
VGI Partners established Launch of VGI Partners Offshore Fund
New York Office established
Tokyo Office established
2008 2012 2018 2021A$3.2bn FUM1
13.8% p.a.global strategy2
2009 2017 2019VGI Global Investments Limited (ASX:VG1) lists on ASX with market cap of $550m
Launch of VGI Partners Master Fund
VGI lists on ASX (ASX:VGI)
VGI Asian Investments Limited (ASX:VG8) lists on ASX with market cap of $550m
1 As at 30 June 2021, per last published data to the ASX.2 Since inception to 30 June 2021.Source: VGI Partners, Citco Fund Services.
C. VGI Partners Timeline

28
Year to 30 JuneVGI Partners Master Fund Index Relative
Master FundNet Exposure
2009 (6 months) 2.3% (3.4%) 5.6% 15%2010 8.3% 5.1% 3.2% 76%2011 18.4% 3.2% 15.2% 88%2012 5.4% (0.6%) 5.9% 71%2013 27.5% 33.1% (5.6%) 77%2014 9.4% 20.1% (10.7%) 86%2015 38.1% 24.0% 14.1% 76%2016 13.0% 0.6% 12.4% 75%2017 5.9% 14.6% (8.8%) 58%2018 20.2% 15.4% 4.8% 54%2019 13.1% 12.1% 1.0% 62%2020 (7.2%) 4.6% (11.9%) 69%2021 24.7% 27.8% (3.1)% 76%Total return since inception 400.6% 312.0% 88.6% 70%Compound annual return 13.8% 12.0% 1.8%
D. VGI Partners Master FundReturns After All Applicable Fees
Source: VGI Partners and Citco Fund Services. Performance is shown after all applicable management and performance fees charged. The VGI Partners Master Fund inception date was 20 January 2009 and the Fund is AUD denominated. Past performance is not indicative of future performance. Index = MSCI World Total Return Index (AUD). The MSCI Index is 100% net invested at all times.

29
Disclaimer:VGI Partners Limited (ABN 33 129 188 450) (VGI Partners) is the holder of an Australian Financial Services Licence (No. 321789) and is SEC Registered. VGI Partners is the manager of VGI Partners Global Investments Limited (VG1) (ABN 91 619 660 721). VGI Partners Asian Investments Management Pty Ltd (ABN 84 635 179 538), a subsidiary of VGI Partners, is the manager of VGI Partners Asian Investments Limited (VG8) (ABN 58 635 219 484).
The information in this document (Information) has been prepared for general information purposes only and without taking into account any recipient’s investment objectives, financial situation or particular circumstances (including financial and taxation position). The Information does not (and does not intend to) contain a recommendation or statement of opinion intended to be investment advice or to influence a decision to deal with any financial product nor does it constitute an offer, solicitation or commitment by VGI Partners, VG1 or VG8.
The Information contains certain forward-looking statements that involve a number of risks and uncertainties. VGI Partners, VG1 and VG8 have based any forward-looking statements on current expectations and projections about future events, based on the information currently available to them. Recipients are cautioned not to place undue reliance on these forward-looking statements. Whilst due care has been used in the preparation of forward looking statements, actual results may vary in a materially positive or negative manner. Forecasts and hypothetical examples are subject to uncertainty and contingencies outside VGI Partners’, VG1’s and VG8’s control. Past performance is not a reliable indication of future performance.
It is the sole responsibility of the recipient to consider the risks connected with any investment strategy contained in the Information. Neither VGI Partners, VG1 nor VG8 nor any of their related parties, respective directors, employees, officers or agents accepts any liability for any loss or damage arising directly or indirectly from the use of all or any part of the Information. Neither VGI Partners, VG1 nor VG8 represent or warrant that the Information in this document is accurate, complete or up to date and accepts no liability if it is not. Neither VGI Partners, VG1 nor VG8 is under an obligation to update the Information and neither undertakes to do so. VGI Partners, VG1 and VG8 all strongly suggest that investors obtain professional advice prior to making an investment decision.
The Information may not be reproduced, disseminated, quoted or referred to, in whole or in part, without the express consent of VGI Partners, VG1 and VG8. This document is dated 20 August 2021.


