NRL Report 8012 00 VHF-UHF Aircraft Antenna FREDERICK FINE Aerospace Systems Branch 4<. Space Systems Division July 23, 1976 OCT. 19 'il 70 D.; NAVAL RESEARCH LABORATORY Wdhiton, D.C. BEST Appr . ove f ,or publi rek . dl,.,i,,t .. ,ir,,te. AVAILABLE COPY
Transcript
NRL Report 8012
00 VHF-UHF Aircraft Antenna
FREDERICK FINE
Aerospace Systems Branch
4<. Space Systems Division
July 23, 1976
OCT. 19 'il 70
D.;
NAVAL RESEARCH LABORATORYWdhiton, D.C.
BEST Appr .ove f ,or publi rek .dl,.,i,,t ..,ir,,te.AVAILABLE COPY
SECURITY CLASSIFICATION OF THIS PAGE fWhoen Date Entered)
REPORT DOCUMENTATION4 PAGE BEFORE COMPLETING FORM
111611,11111 -- mollGOVT ACCESSION NO. S. RECIPIENT'S CATALOG NUUUER
4.TITLE (andE S..&ttlo) S YEO EOTAPRO OEE
6 VHF-UHF AIRCRAFT ANTENNA,.
7* AUYNpR~e) 4 OTATO RN _ute
;, Frederick Fine 73
9. PERFORMING ORGANIZATION NAME AND ADDRESS Ia. PROGRAM ELEMENT. PROJECT.TAS-K
Naval Research Laboratory I 4 V60Q!1Washington, D.C. 20375/
11. CONTROLLING OFFICE NAME AND ADDRESS 12. REPORT DATE .
Naval Electronics Systems Command July 23, 197W'1/ -
Navy Space Projects Office (PME-106)Is uetOFP_Washington, D.C. 203803214 MONITORING AGENCY NAME A ADOIRESS(It iletent tain Controlling Office) 15. SECURITY CLASfWKNp
$a. DECLASSIFICATION/OOWNGRAO#NG* SCHEDULE
IS. DISTRIBUTION STATEMENT (of tis Report)
Approved for public release, distribution unlimited. 7I?. DISTRIBUTION STATEMENT (of th,. abstract entered In Block 20. If different hasm Report)
IS. SUPPLEMENTARY NOTES
This is a final report on this aspect of the overall problem; work on other aspects of the problemis continuing.
IS KEY WORDS (Conthnue on revese aide If necesar and identity by, block numer.)
SO. ARCT (Conthm n uemrse sfide liecossavy, And identity by block numnber)
broadband, circularly polarized antenna system suitable for use on WP-3 aircraft andoperating in the VHF-UTHF frequency region has been designed and fabricated. This airborneradiometer system will operate over a 3 to 1 frequency range without tuning. The installationcontains a high- and low-frequency hemispherical coverage antenna and a high- and low.frequency fan-beam array. The entire installation is designed to fit into the standard APS-20
(Continued)
DD 'P 1473 EDITION OF I NOV 5 5 I OSSLETE6/1, 010 2-014.50 6" 1A ~ rn 7
SECURITY CLASSIPICATIOtI Of THIS tee.R.DO MW-
-,_juITy CLASSIFICATION OF THIS PAGI(Whem Dola Ea11e
radome of the WP-3. Use has been made of a novel antenna element to achieve good patternperformance in such a confined space. Emphasis has been placed on low los and reliableoperation.
U. .OCT 19,"
I 'S O _ -I ,L L".
~( D
SECUNITY CLASSIFICATION OF THIS PAG3lMMa, O 3Uae
1
CONTENTS
INTRODUCTION 1..................
ANTENNA LOCATION AND GENERAL DESCRIPTION ....... 1
THEORY ................................... ,........ 4
THE RADIATING ELEMENT ............................6
ANTENNA SYSTEM RF NETW'ORK ...................... 10
An antenna system was designed and fabricated to be used in an airborne VHF andUHF radiometer system. This unusual radiometric antenna will operate without tuningover a 3 to 1 frequency band. The design incorporates two relatively high gain arrayantennas (14 to 20 dB gain) and two single radiating elements (5 to 8 dB gain). A gen-eral difficulty in regard to this task was that of isolating the antenna sufficiently fromthe aircraft structure to produce stable and predictable patterns.
To increase the isolation from the aircraft structure, the antenna is tilted downwardrelative to the aircraft wing and fuselage. Full azimuth coverage is obtained by flying theaircraft in a tight circle at a bank angle of 30 degrees. This places the peak of the antennabeam on the horizon. The type of radiating element employed in these antennas exhibitsintrinsic directivity so as to further isolate the antenna beam from nearby reflectingsurfaces.
ANTENNA LOCATION AND GENERAL DESCRIPTION
The WP-3 Lockheed Electra aircraft affords one reasonable location without airframemodification for the type of antenna system described in this report. The antenna ismounted within the radome that normally encloses the APS-20 radar antenna. Theradome is located approximately 7 meters aft of the aircraft nose and immediately belowthe fuselage. Figures 1 through 3 depict the randome location. The radome is approxi-mately 3.66 m in diameter, 1.22 m high, and has an elliptical cross section in the verticalplane.
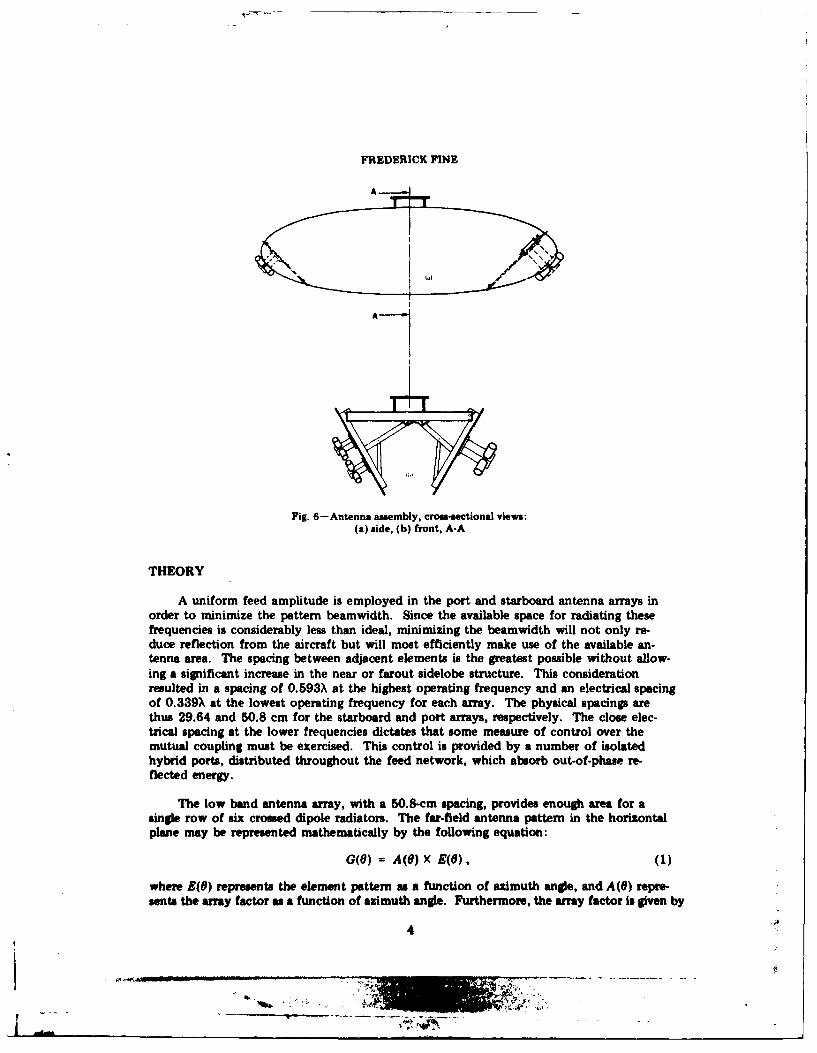
The antenna system is designed to maximize its reflector surfaces within the confinesof the existing radome and still perform its intended function. Two elliptically shaped
Fig. 1 -WP-3 Aircraft, side view
Manuscript submitted April 22. 1976.
t2 _-.1" . .. . . . . ... . .. . . . I
FREDERICK FINE
ZV#F -OUF ANTENNA
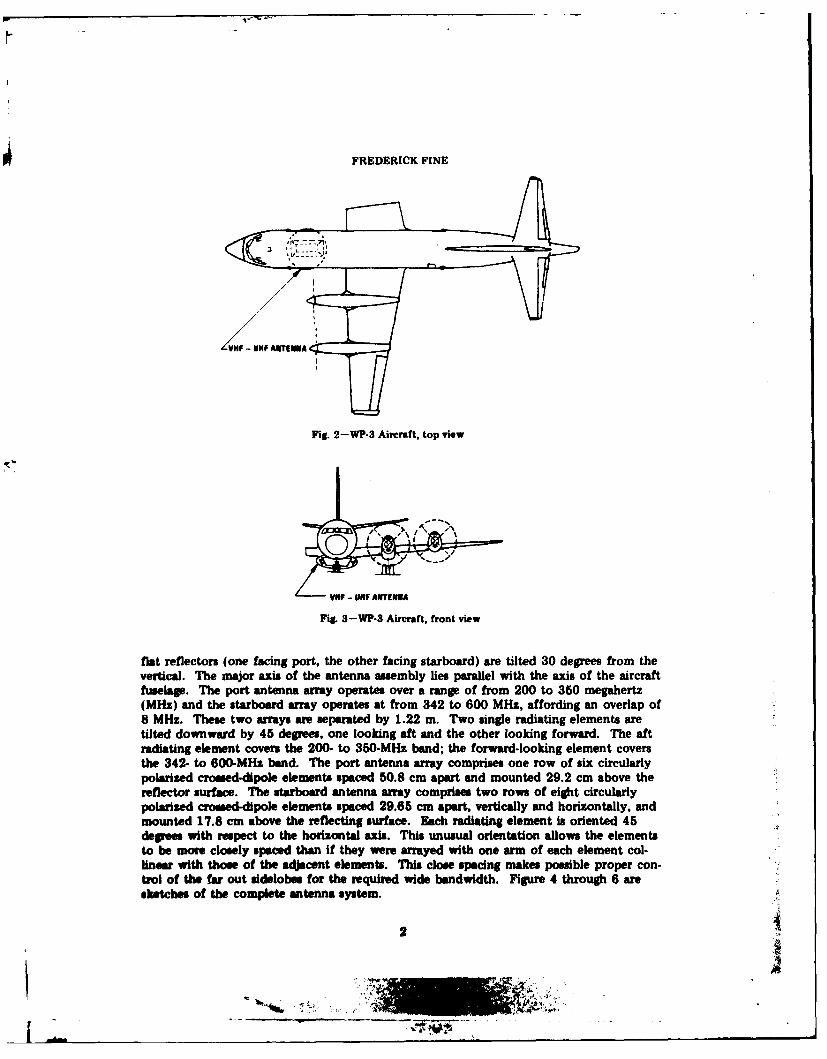
Fig. 2-WP-3 Aircraft, top view
V#F - OHF ANTENNA
Fig. 3-WP-3 Aircraft, front view
fiat reflectors (one facing port, the other facing starboard) are tilted 30 degrees from thevertical. The major axis of the antenna assembly lies parallel with the axis of the aircraftfuselage. The port antenna array operates over a range of from 200 to 350 megahertz(MHz) and the starboard array operates at from 342 to 600 MHz, affording an overlap of8 MHz. These two arrays are separated by 1.22 m. Two single radiating elements aretilted downward by 45 degrees, one looking aft and the other looking forward. The aftradiating element covers the 200- to 350-MHz band; the forward-looking element coversthe 342- to 600-MHz band. The port antenna array comprises one row of six circularlypolarized crossed-dipole elements spaced 50.8 cm apart and mounted 29.2 cm above thereflector surface. The starboard antenna array comprises two rows of eight circularlypolarized crossed-dipole elements spaced 29.65 cm apart, vertically and horizontally, andmounted 17.8 cm above the reflecting surface. Each radiating element is oriented 45degrees with respect to the horizontal axis. This unusual orientation allows the elementsto be more closely spaced than if they were arrayed with one arm of each element col-linear with those of the adjacent elements. This close spacing makes possible proper con-trol of the far out sidelobes for the required wide bandwidth. Figure 4 through 6 aresketches of the complete antenna system.
A uniform feed amplitude is employed in the port and starboard antenna arrays inorder to minimize the pattern beamwidth. Since the available space for radiating thesefrequencies is considerably less than ideal, minimizing the beamwidth will not only re-duce reflection from the aircraft but will most efficiently make use of the available an-tenna area. The spacing between adjacent elements is the greatest possible without allow-ing a significant increase in the near or farout sidelobe structure. This considerationresulted in a spacing of 0.593) at the highest operating frequency and an electrical spacingof 0.339) at the lowest operating frequency for each array. The physical spacings arethus 29.64 and 50.8 cm for the starboard and port arrays, respectively. The close elec-trical spacing at the lower frequencies dictates that some measure of control over themutual coupling must be exercised. This control is provided by a number of isolatedhybrid ports, distributed throughout the feed network, which absorb out-of-phase re-flected energy.
The low band antenna army, with a 50.8-cm spacing, provides enough area for asingle row of six crossed dipole radiators. The far-field antenna pattern in the horizontalplane may be represented mathematically by the following equation:
G(o) = A(6) X E(9), (1)
where E(8) represents the element pattern as a function of azimuth angle, and A(8) repre-sents the array factor a a function of azimuth angle. Furthermore, the array factor is given by
4
NRL REPORT 8012
A(O) = cos(Vi/2) + cos(30/2) + cos(50/2) (2)
/2 180d (sin 0),
where
0 = azimuth angle measured from broadside,
d = element spacing
= operating wavelength.
The element pattern must account for the feed gap in each set of dipole elements and forthe effect of the spacing of the dipole elements from the reflector. Thus,
E()= cos !(- sin) X sin (27r Cos) 0 X cos (w/2 sin ) (3)(X ) k XCos 0 ) 3
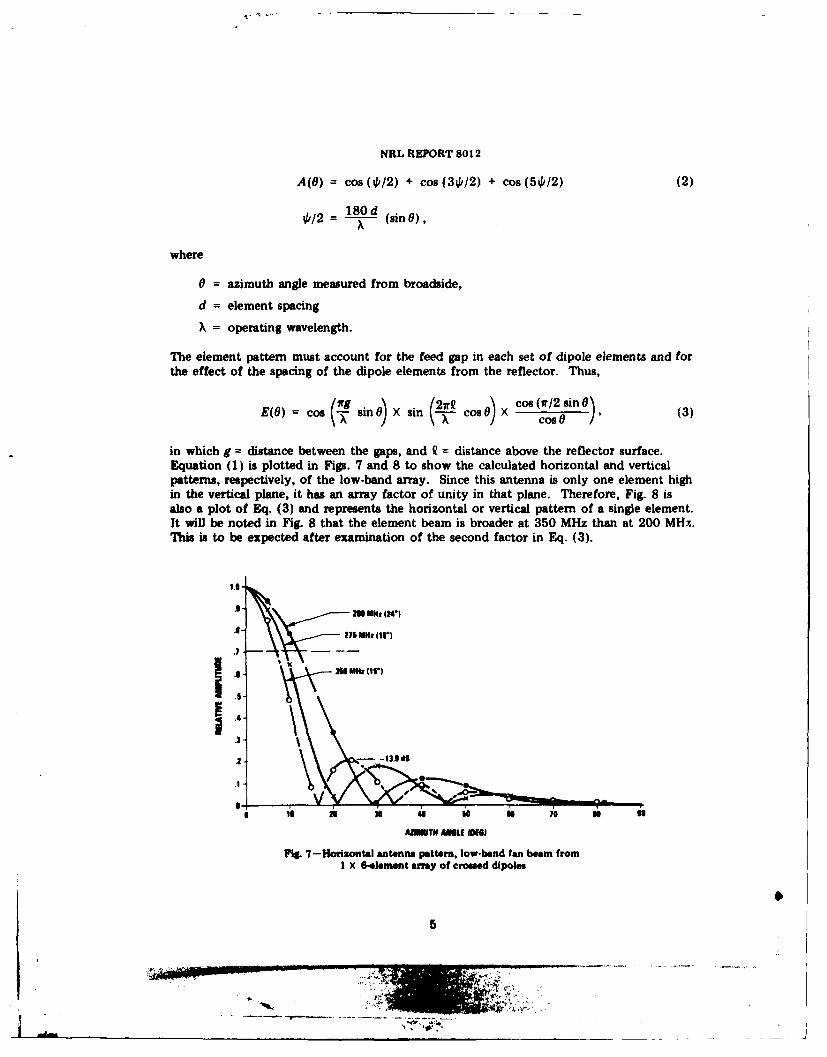
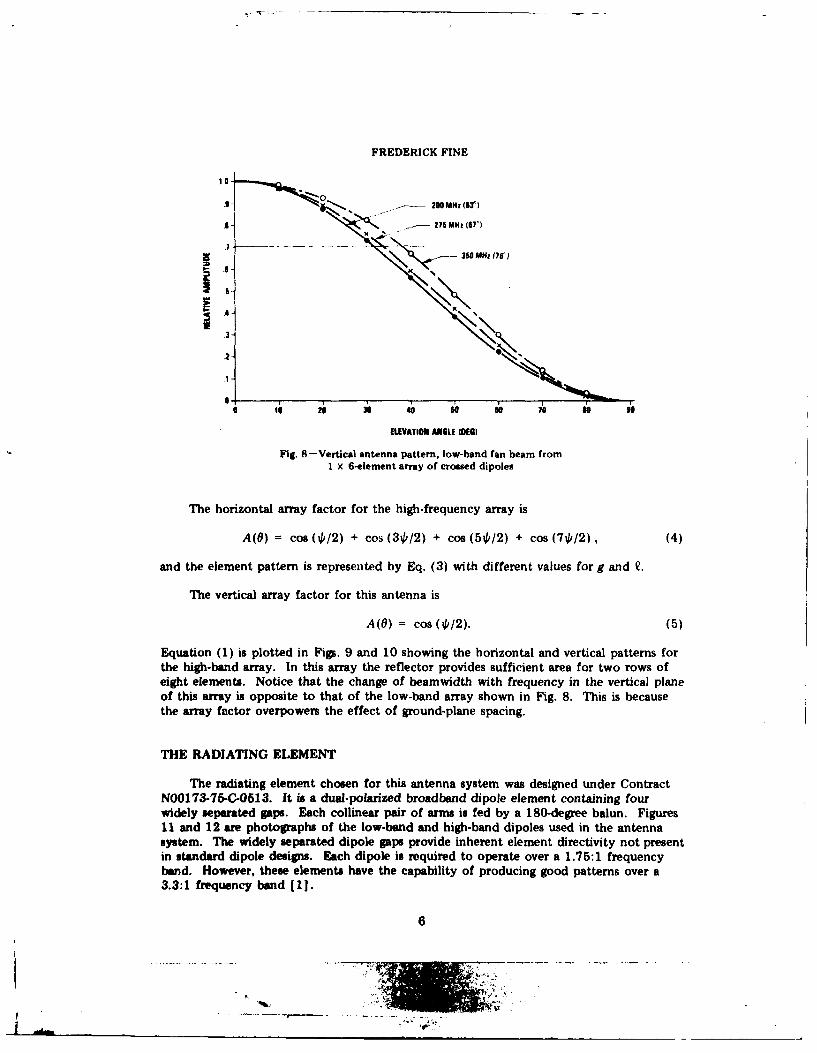
in which g = distance between the gaps, and R = distance above the reflector surface.Equation (1) is plotted in Figs. 7 and 8 to show the calculated horizontal and verticalpatterns, respectively, of the low-band array. Since this antenna is only one element highin the vertical plane, it has an array factor of unity in that plane. Therefore, Fig. 8 isalso a plot of Eq. (3) and represents the horizontal or vertical pattern of a single element.It will be noted in Fig. 8 that the element beam is broader at 350 MHz than at 200 MHY.This is to be expected after examination of the second factor in Eq. (3).
9- M MNlI (24)
J -- -3 A , r
32 - -J131dI
I
0 Is 5 31 48 U so 70 W 5
AMlUTH# AWLf W1Ks
Pig. 7-Horixontal antenna pattern, low-bend fan beam fromI X 6-element array of crossed dipoles
5
-... .,n
FREDERICK FINE
10
M Hz (76'-)
.3-
2-
ELEVATION ANGLE (DEB)
Fig. 8-Vertical antenna pattern, low-band fan beam from1 x 6-element array of crossed dipoles
The horizontal array factor for the high-frequency array is
A(O) = cos (/2) + cos (30/2) + cos (50/2) + cos (7tp/2), (4)
and the element pattern is represented by Eq. (3) with different values for g and Q.
The vertical array factor for this antenna is
A(0) = cos (4 /2). (5)
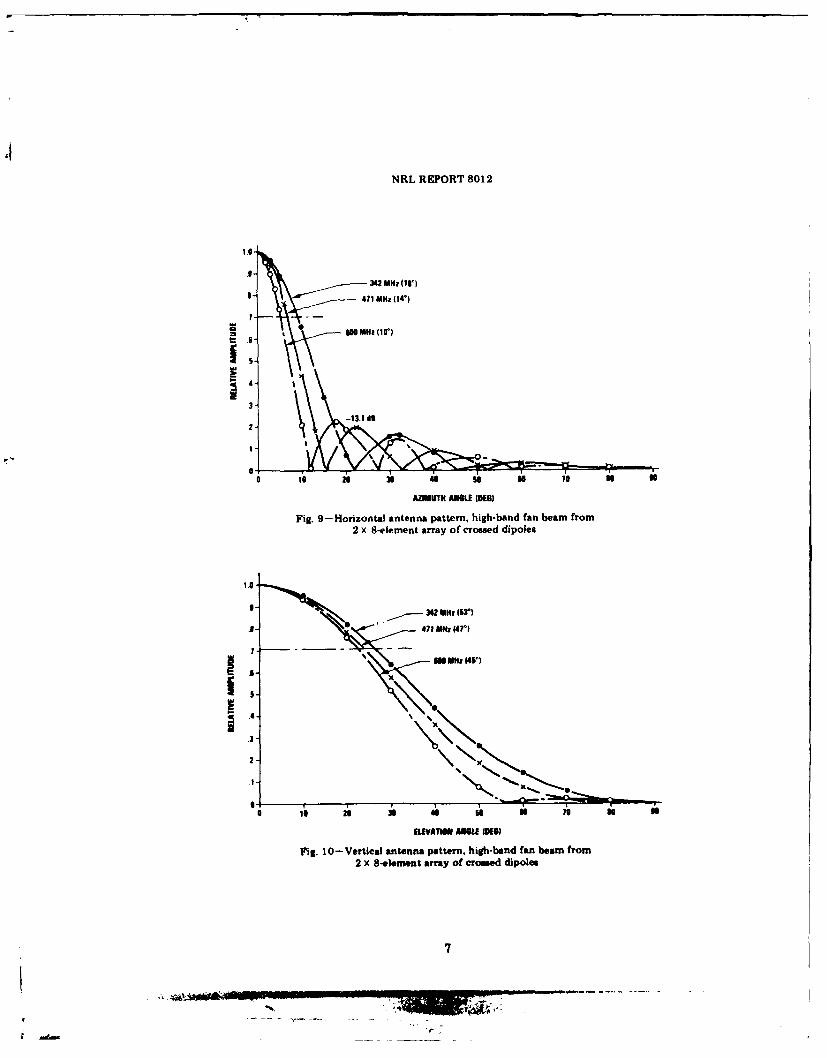
Equation (1) is plotted in Figs. 9 and 10 showing the horizontal and vertical patterns forthe high-band array. In this array the reflector provides sufficient area for two rows ofeight elements. Notice that the change of beamwidth with frequency in the vertical planeof this array is opposite to that of the low-band array shown in Fig. 8. This is becausethe array factor overpowers the effect of ground-plane spacing.
THE RADIATING ELEMENT
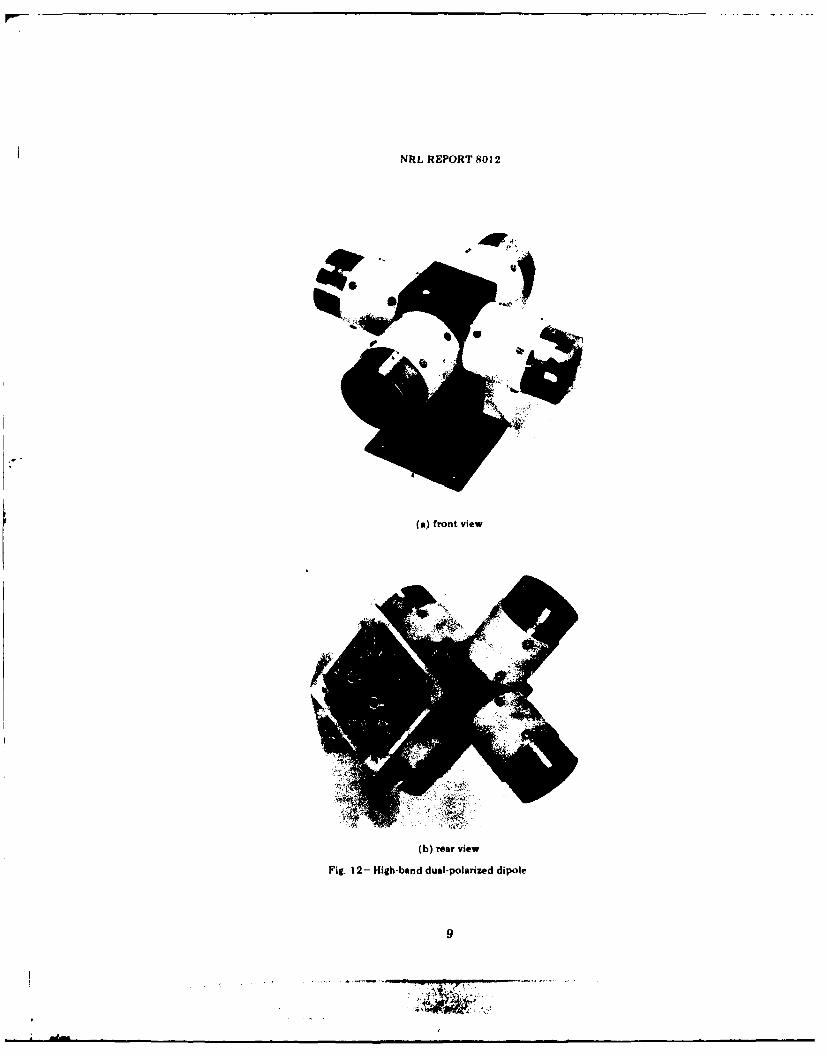
The radiating element chosen for this antenna system was designed under ContractN00173-75-C-0613. It is a dual-polarized broadband dipole element containing fourwidely separated gaps. Each collinear pair of arms is fed by a 180-degree balun. Figures11 and 12 are photographs of the low-band and high-band dipoles used in the antennasystem. The widely separated dipole gaps provide inherent element directivity not presentin standard dipole designs. Each dipole is required to operate over a 1.75:1 frequencyband. However, these elements have the capability of producing good patterns over a3.3:1 frequency band (1].
6
NRL REPORT 8012
32MMz (ISO)
S . -471 MHz JIVl
03 £0 MHz 0r)
3)2 -U3.1d42
2-j
0 10 n 38 8 16 U 1 16 N £
AZIMUTH AUG11 10161
Fig. 9- Horizontal antenna pattern, high-band fan beam from2 x 8-element array oftcrossed dipoles
3 42 MHz Is3)
471 MRSOz
.2-
ELEVATION ANGLE =186
Fig. 10- Vertical antenna pattern, high-band fan beam from
2 x 8-elemnent array of crossed dipoles
FREDERICK FINE
(a) rear view
(b) front view
Fig. I I -- ! 'A)w-band dual-polarized dipole element
NRL REPORT 8012
(a) front view
(b) rear view
Fig. 12- High-band dual-polarized dipole
FREDERICK FINE
Both elements are constructed of 0.381-mm stainless steel. The support shaft issquare in cross section, and each of the four radiating arms is cylindrical. The gaps areflared and shaped in order to control the gap impedance over the wide frequency rangeof operation.
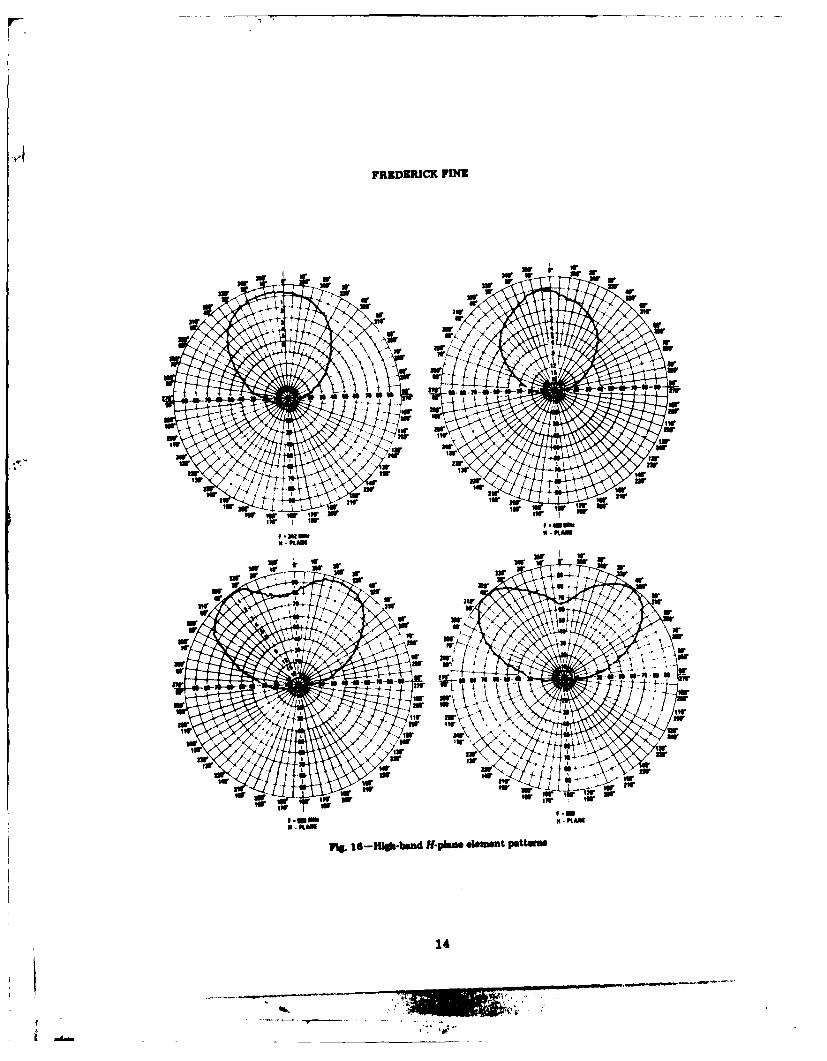
The low-band dipole is 35.6-cm high, has an arm length of 48.26 cm, and weighs3.15 kg (7 Ib). The high-band element is 22.9-cm high, has an arm length of 29.2 cm,and weighs 1.8 kg (4 Ib). In the frequency range of interest the low-band dipole inputVSWR varies from 1.6:1 to 2.0:1, and its calculated losses are 0.4 to 0.7 dB. The high-band dipole exhibits a 1.5:1 to 1.8:1 input VSWR, and its losses are 0.3 to 0.5 dB.Figures 13 and 14 show the E- and H-plane element patterns for the low-band element,and Figs. 15 and 16 show the corresponding patterns for the high-band element. Thesepatterns were measured over a 0.914-m by 1.22-m ground plane by the Alford Manufac-turing Company. The high-band element patterns show a partial main-beam breakup at500 MHz and above. This comes about because the height of the element above theground is approximately 25 mm (I in.) too great.
Measurements of boresight circularity taken at the dipole manufacturer's plant arehsted in Table 1.
ANTENNA SYSTEM RF NETWORK
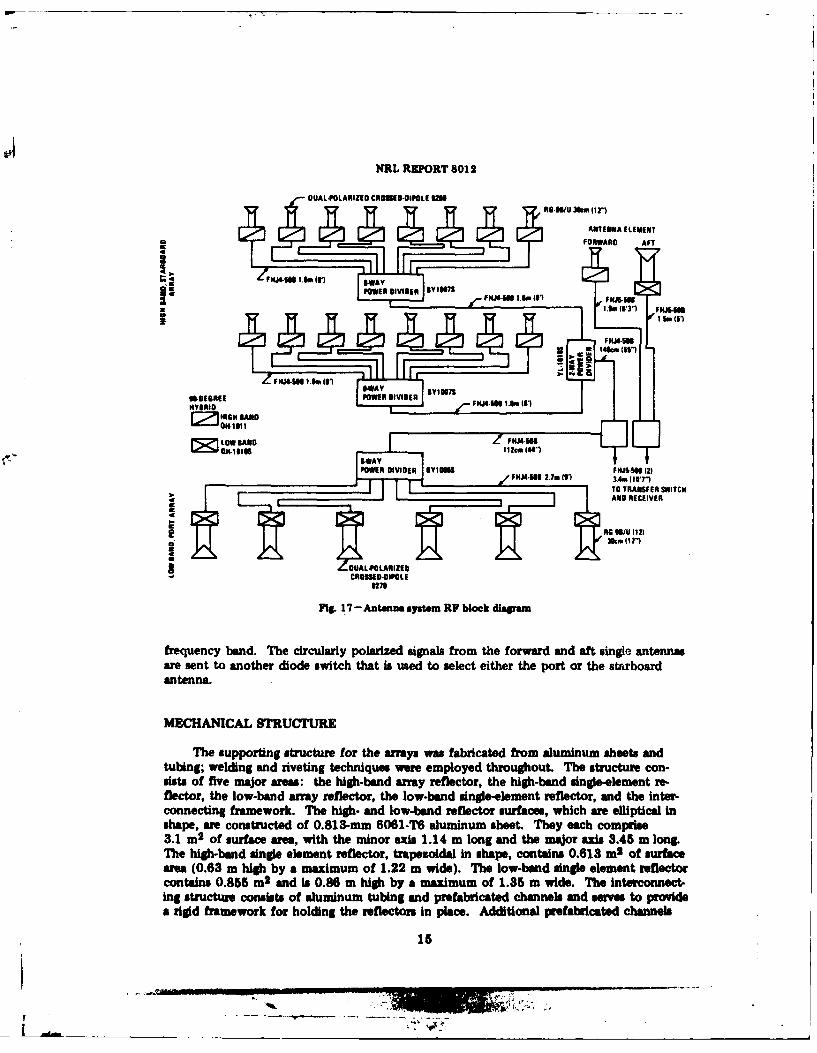
Figure 17 is an RF block diagram of the antenna system. Noise signals go to thedual-polarized crossed-dipole elements and are resolved into two orthogonal signals. Thesesignals then pass through a 90-degree, 3-dB hybrid in such a manner as to produce a right-hand circularly polarized output. Out-of-phase and unbalanced signals are absorbed by a1/8-w resistor located in the cancellation arm of the 3-dB quadrature hybrid. In the casesinvolving the port and starboard arrays, the noise signals are fed through equal lengths ofRF cable and summed at the output of a power divider network. The signal from eacharray is then fed to a diode switch which can be operated remotely to select the desired
Table 1--Element Boresight Circularity
Frequency Axial Ratio(MHz) (dB)
200 1.0
Low Band 250 0.6300 1.0350 1.0
342 1.3400 2.7
High Band 2.3500 2.3
600 1.7
10
NRL REPORT 8012
uNIVW3w w 3
3w W3W 3 r
u. ir * w
Aa w
-w w ur
aWr I ' 1t 1W
UW % ~ li m 11W 1w
A? x AT 3w
Flr 18L w band Urln eeet at
1w 11
lw w s tw "
FREDERICK FINE
w 3w fir W Ar3w ar for w
ur 3w 33F 3w war urfir aw 4r ur 4r
sw xw w for 4 Iwrw 3111'
4r IWW3w
w or ww A ar w sw
or ww or w ur
i w_111-M-40 - - - - I - a-M _mWn
4 - ow or owar urar IND,7 "Orr IWor I sw fw lwqw, -W 1wsw w
lw 24r 1w Isr IfIr
nr I ow twIsr x 23r lw nr
' , lar 2 wl; ar1w a- "rI 2w
2 IND 1w "r a lorfw for 2W 1w or IW
for for Isr IW IW rwr "r sw 1w ?wlAr I or 1pr I fw
N -PLAN 04-PLANF =Wb F-MM
3W w 3W 3w Sir ww 3w W W w
sww SW 31 3w 3$r 3r
aw sw W 32r 23r wsw Ar I 3W w
sw w 31rX 31or Or
w or
wow arw
waw w lww
tw 0-19
aw 1waw ur1w aw "rowow awar 2w fir
lwfarl4r Y, IN t3rImr 7
lw urI nr owow 1 149, 2w ar*Hwwr sw 14r fir
ow aw OWa 2w 1w SW wor np 1w aw"r OW or IW SW '"Wr "r
ow I tw
PUMN - PLAN 111. mob0 WIN
ft 14-Low-band M-PM* OW t P&ttwu
12
R.NU amm. IN 11"
NRL REPORT 8012
SW SW w
SW 3W SwWJ W
Jrl urn3r 33w -fWi 3w -f
4ig 15Kia-n 3.la esin pte
3rw w s18-1w-w- .33w x w 14
A~~~ ~ u.d __ ____________________
FREgDERICK FINE
AVV nW 4r
Ort WV
-414
~~d..m. or___________
NRL REMPORT 8012
DUAL-POLARIZED CROUEISOIPOLE UN5
"4FORWARD AFT
2
I tuozl ("1
_HJ1U21 W 3. (")
MECHANICl. (IRl
SIP- C RO IOERB111
5211
anEnna.OE f OA 'e
LOWHABANALZSTRUCFUR
The supporting structure for the arrays was fabricated from aluminum sheets andtuing; welding and riveting techniques were employed throughout. The structure con-sists of five major areas: the high-bend array reflector, the high-bend single-element re-flector, the low-band amry reflector, the low-band single-element reflector, and the inter-connecting framework. The high- and low-band reflector surface, which are elliptical inshape, are constructed of 0.813-mm 6061-T6 aluminum sheet. They each comprise3.1 ms of surface area, with the minor axis 1.14 m long end the major axis 3.45 m long.The high-hand single element reflector, trapezoidal in shape, contains 0.613 m3 of surfacearea (0.63 m high by a maximum of 1.22 m wide). The low-band single element reflectorcontains 0.855 m2 and is 0.86 m high by a maximum of 1.85 m wide. The interconnect.ing structure consists of aluminum tubing and prefabricated channels and semie to providea rlgld framework for holding the reflectors in place. Additonal prefabricated channels
15
"A - -
FREDERICK FINE
are used as strengthening members behind each radiating element. The completed antennasystem weighs 159 kg (350 ib).
MODEL MEASUREMENTS
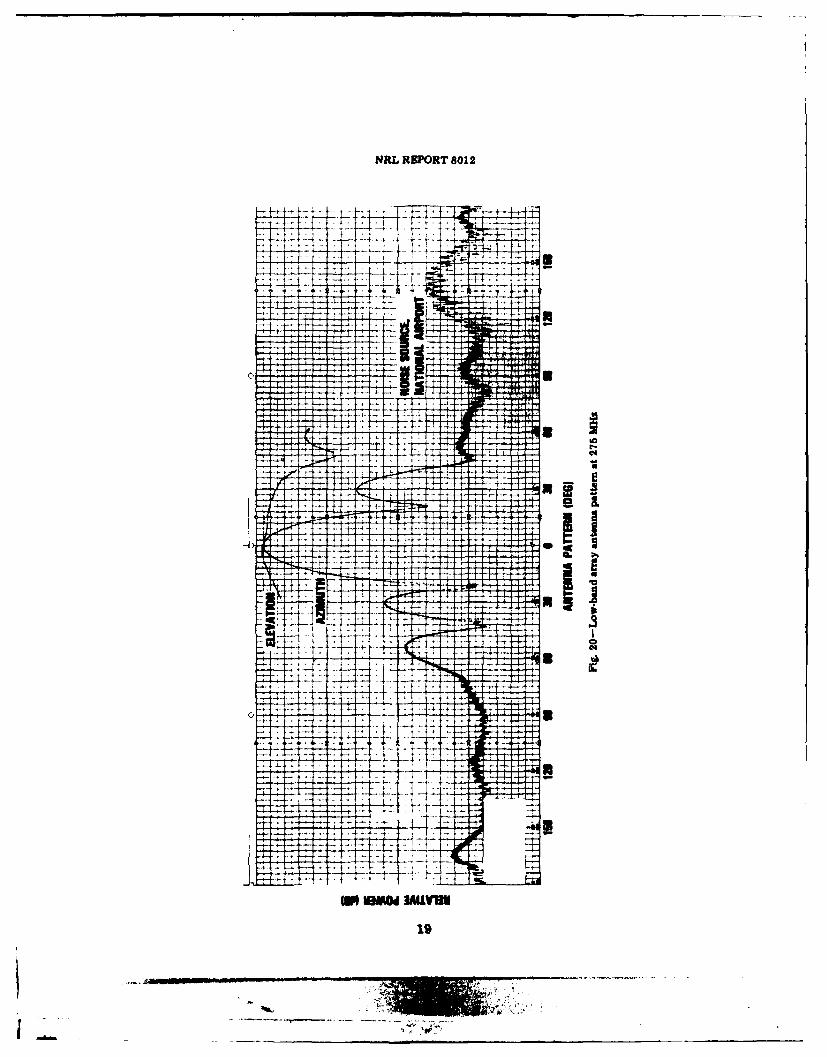
A scale model of the low-band antenna array was constructed to simulate this arrayat its center frequency. The array was mounted in a 1/18th scale model of the C-121aircraft. This aircraft, in the forward region, is similar to the WP-3 in many respects. Thescaled frequency of 5186.5 MHz corresponds to 275 MHz, full scale. Vertical and hori-zontal patterns of this scale-model antenna array agree closely with the calculated valuesfor the beamwidths (within 2 degrees). Measurements taken of the array mounted on theaircraft indicate a 130 (19%) narrowing of the 3-dB beamwidth in the vertical plane anda 1 (5%) narrowing in the horizontal plane. First sidelobe levels increased approximately3 dB, and pattern ripple increased 11h dB in the vertical plane. These distortions are at-tributed to the effects of aircraft structure. An additional 1.5-dB pattern distortion is dueto the effects of propeller modulation upon the vertical antenna pattern.
TESTING THE ANTENNA SYSTEM
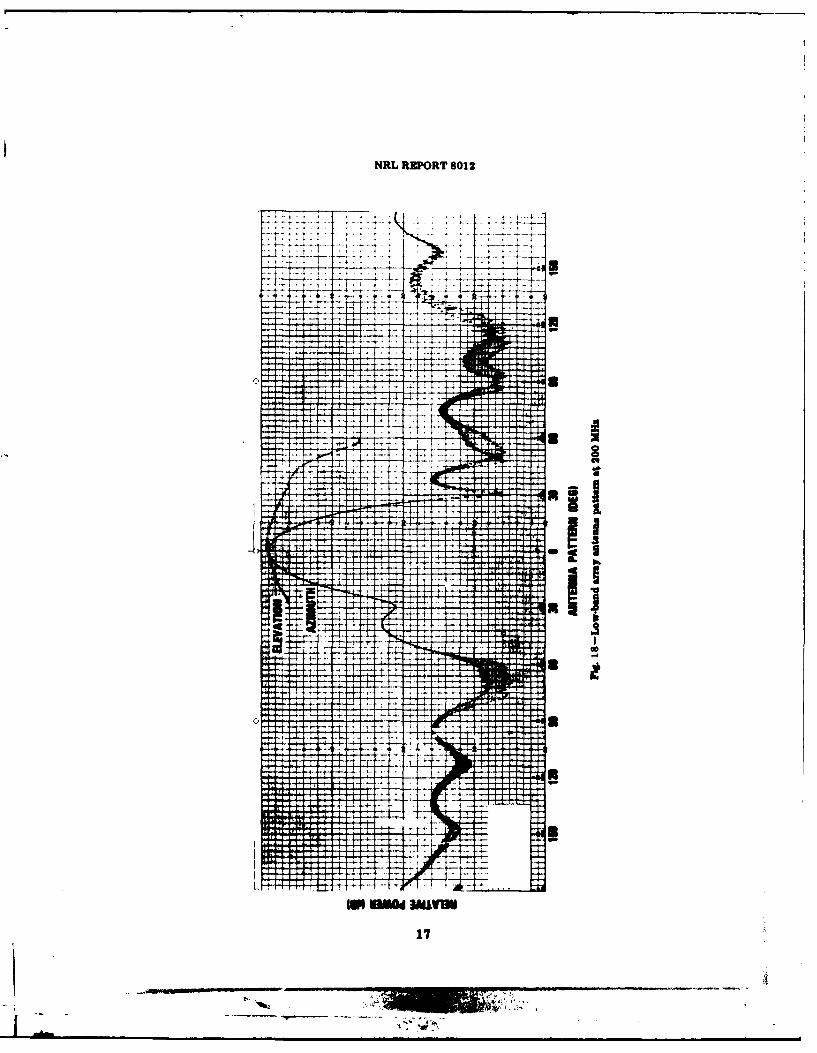
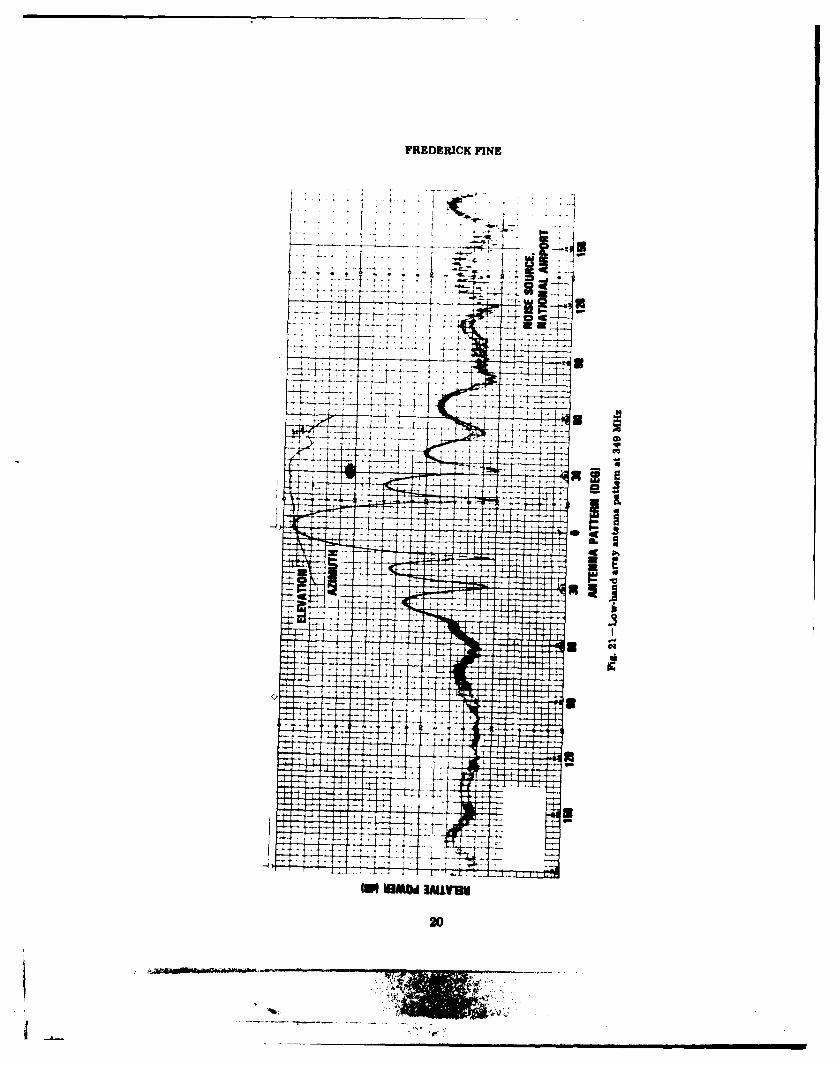
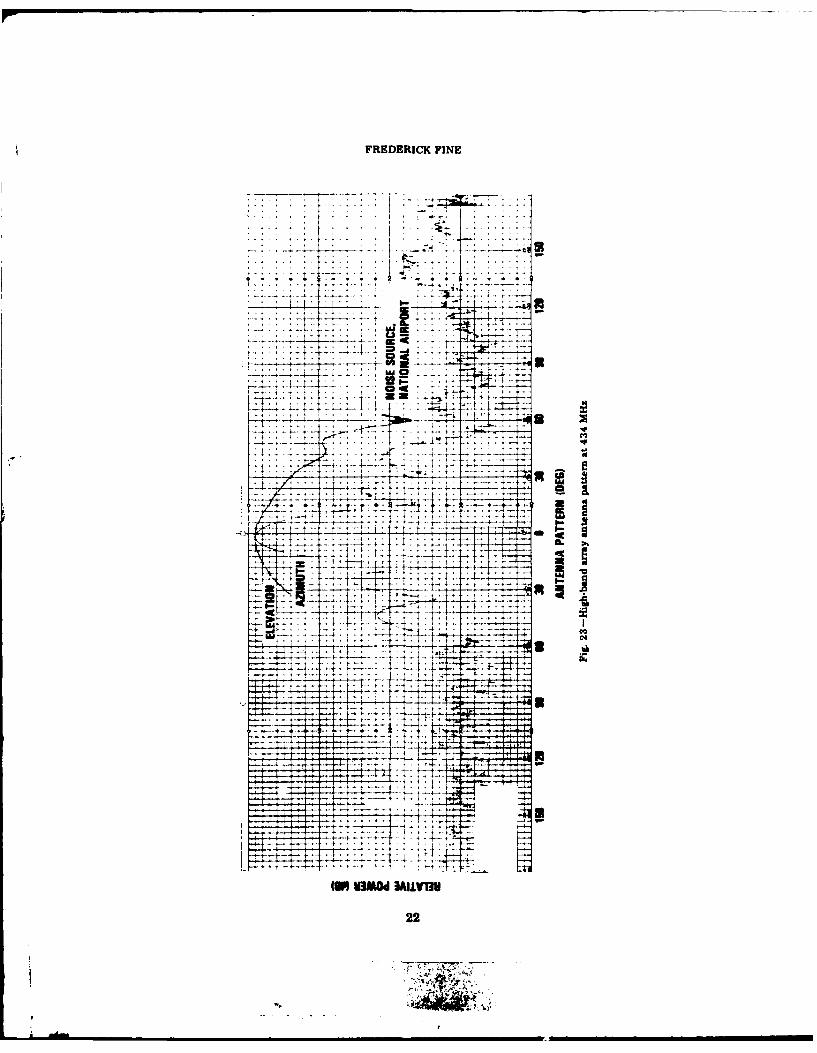
The complete antenna system was mounted in the inverted position above an MP-88antenna pedestal located on the roof of Building 208 at NRL. A log periodic antennaconnected to a transmitter was mounted on the top of a 6.7-m tower, 42.7 m away, toconplete the antenna measurement range. This antenna range, far from ideal, was theonly test range that was readily available. Figures 18 through 21 show the azimuth andelevation antenna patterns of the low-band array; Figs. 22 through 25 depict the high-bend array patterns. Elevation patterns for all bands cover only 90 degrees because ofpedestal limitations. All patterns were measured for right-hand circular polarization.Table 2 summarizes the 3-dB beamwidths, first sidelobe levels, and directive gains foreach array. The characteristics of the single-element ("hemispheric") antennas are sum-marized in Table 3.
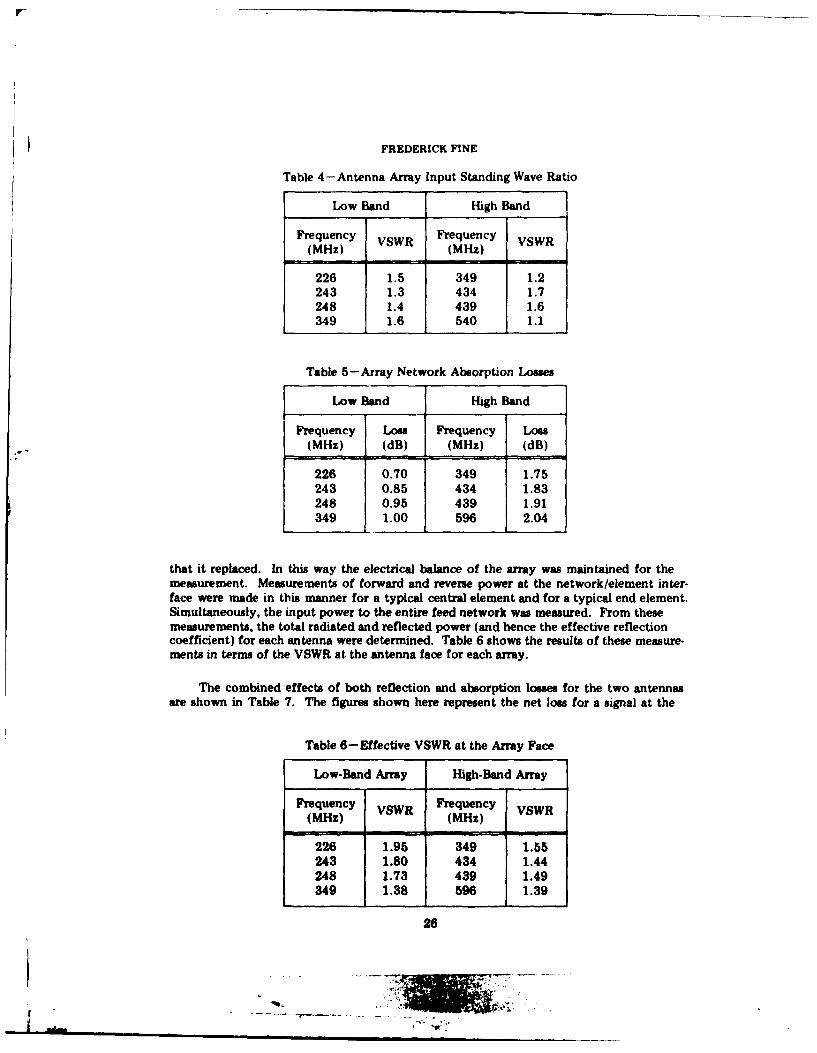
The input voltage standing wave ratio (VSWR) was measured for both antenna arrays.These measurements, referenced to a 50-ohm impedance, are summarized in Table 4.
The intended application of these antennas for measuring VHF-UHF noise requiredan accurate assessment of the losses and reflections in the antenna system. Measurementof the loses in the feed networks was accomplished by replacing the elements withmatched 50-ohm loads. The forward and reverse power at the input to the feed networkand the power delivered to a typical output port were then measured. From these meas-urements the input VSWR and the absorption loss of the feed network were determined.Table 5 summarizes these absorption losses for the feed networks of both the high-bandand low-bend arrays.
The effective reflection coefficient of each array was measured in the followingmanner. The feed network was reconnected to the radiating elements, except that thefeed line to one of the elements was replaced with a dual-directional coupler and a suitableshort length of cable. The length of this cable was carefully selected so that the path length,which included the directional coupler, exactly matched the electrical length of the cable
18
NRL REPORT 8012
i- -6 -t-
-44
EF 7H:M,0
TT ? i~i
++vu
T I1I
_ _ _ 4
FREDERICK FINE
44 - -4--'
4 ~14 H ,
4: 4. 4
ti-J- -T
.44F
NRL REPORT 8012
9L74 -V
-4-4
- UIM~dIA4AV1I
ii--
FREDERICK FINE
K 2>4.7
~C
i4a
(WM UMOd AUVMI
20
NRL REPORT 8012
-4--.
-4- 4-
-444
1, t - r-44r
+ iiid P4- i 4-
+ 4-I I
FREDERICK FINE
t. .
.... .* .-
+4 -t- lie
(80 .3-.- 3AUVB3
22----4 ~4
NRL REPORT 8012
rc 1
Ada
FREDERICK FINE
o w .......
* . . I
~7TIT *
=r
24-
NRL REPORT 8012
Table 2-Antenna System Array Characteristics
3-dB Beamwidths 1st Sidelobe Directive GainFrequency Pea
that it replaced. In this way the electrical balance of the array was maintained for themeasurement. Measurements of forward and reverse power at the network/element inter-face were made in this manner for a typical central element and for a typical end element.Simultaneously, the input power to the entire feed network was measured. From thesemeasurements, the total radiated and reflected power (and hence the effective reflectioncoefficient) for each antenna were determined. Table 6 shows the results of these measure-ments in terms of the VSWR at the antenna face for each array.
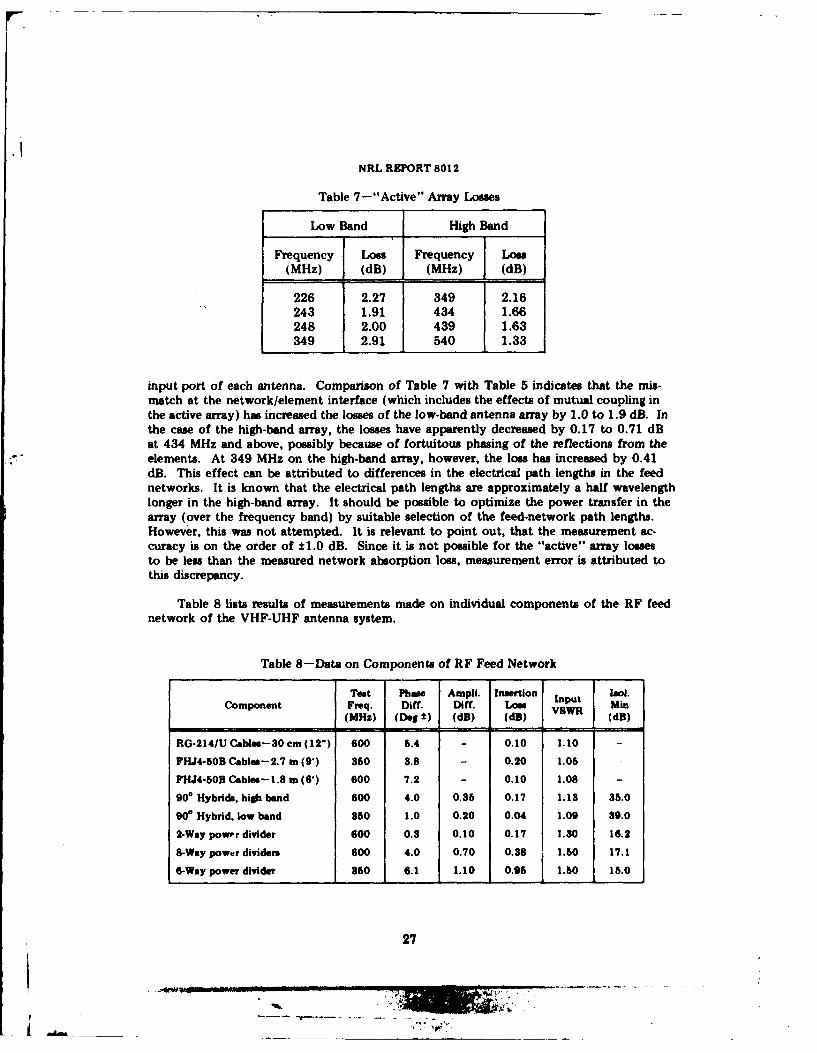
The combined effects of both reflection and absorption losses for the two antennasare shown in Table 7. The figures shown here represent the net loss for a signal at the
input port of each antenna. Comparison of Table 7 with Table 5 indicates that the mis-match at the network/element interface (which includes the effects of mutual coupling inthe active array) has increased the losses of the low-band antenna array by 1.0 to 1.9 dB. Inthe case of the high-band array, the losses have apparently decreased by 0.17 to 0.71 dBat 434 MHz and above, possibly because of fortuitous phasing of the reflections from theelements. At 349 MHz on the high-band array, however, the loss has increased by 0.41dB. This effect can be attributed to differences in the electrical path lengths in the feednetworks. It is known that the electrical path lengths are approximately a half wavelengthlonger in the high-band array. It should be possible to optimize the power transfer in thearray (over the frequency band) by suitable selection of the feed-network path lengths.However, this was not attempted. It is relevant to point out, that the measurement ac-curacy is on the order of ±1.0 dB. Since it is not possible for the "active" array lossesto be less than the measured network absorption loss, measurement error is attributed tothis discrepancy.
Table 8 lists results of measurements made on individual components of the RF feednetwork of the VHF-UHF antenna system.
Table 8-Data on Components of RF Feed Network
Test Phase Ampli. Insertion Input lo.Component Freq. Diff. Diff. Losw VSWt Min
(MHz) (De g) (dB) (dB) (dB)
RG-214/U Cbles-30 cm (12") 600 5.4 - 0.10 1.10 -
FHJ4-60BCab-les-2.7 m (9') 350 3.8 - 0.20 1.05
FHJ4-50B Cables--1.8 m (6) 600 7.2 - 0.10 1.08 -
900 Hybrids, high band 600 4.0 0.35 0.17 1.13 35.0
900 Hybrid, low band 350 1.0 0.20 0.04 1.09 39.0
2-Way power divider 600 0.3 0.10 0.17 1.80 16.2
8-Way power dividers 600 4.0 0.70 0.38 1 50 17.1
6-Way power divider 350 6.1 1.10 0196 1.50 15.0
27
.dt. - - " " - ' ' -..
FREDERICK FINE
SUMMARY OF ANTENNA ARRAY PERFORMANCE
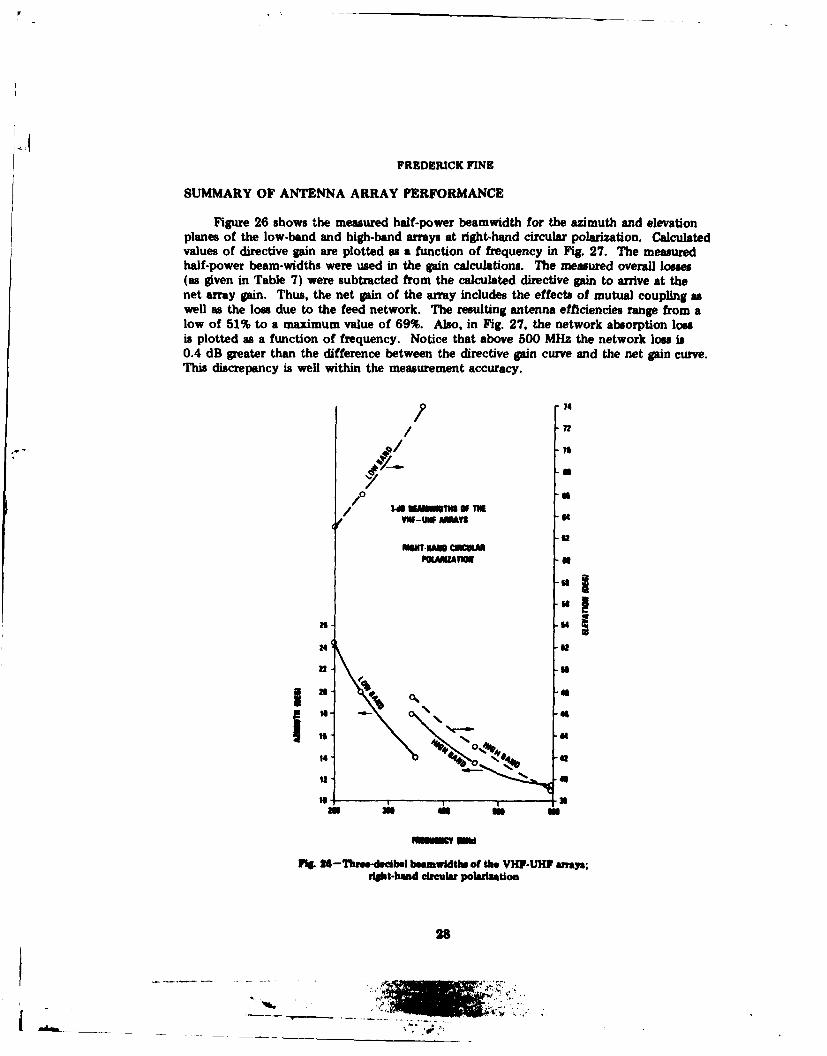
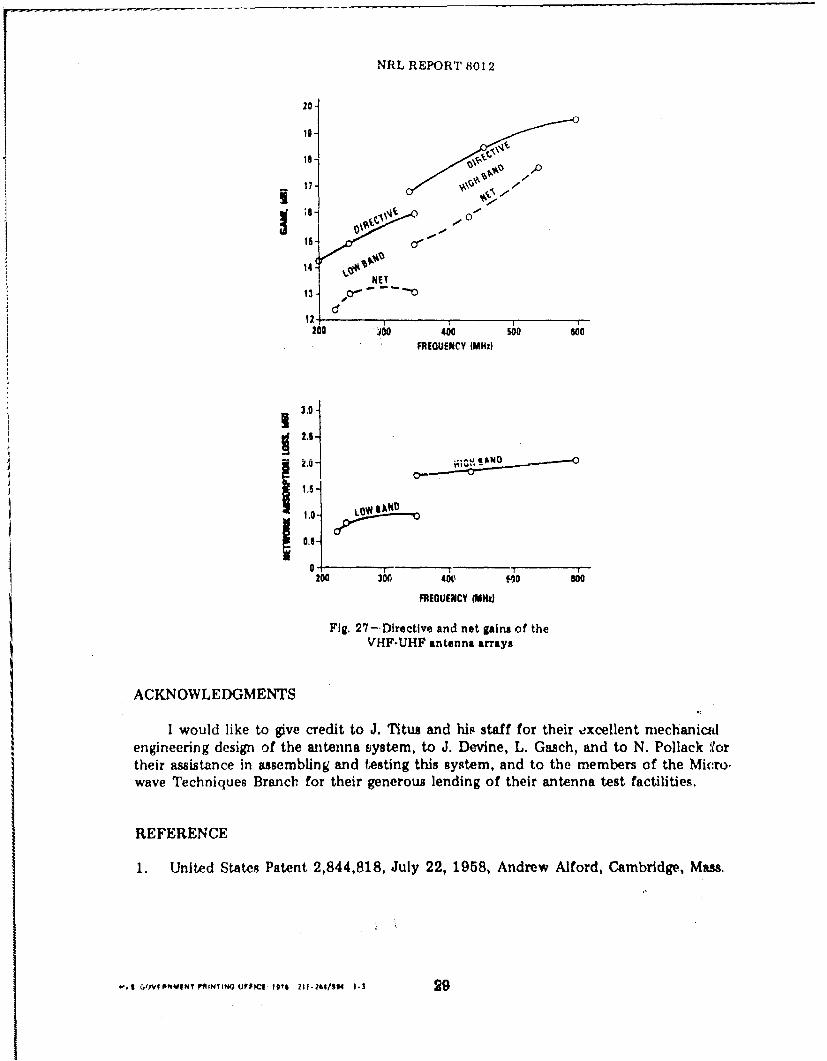
Figure 26 shows the measured half-power beamwidth for the azimuth and elevationplanes of the low-band and high-band arrays at right-hand circular polarization. Calculatedvalues of directive gain are plotted as a function of frequency in Fig. 27. The measuredhalf-power beam-widths were used in the gain calculations. The measured overall loese(as given in Table 7) were subtracted from the calculated directive gain to arrive at thenet array gain. Thus, the net pin of the array includes the effects of mutual coupling aswell as the loss due to the feed network. The resulting antenna efficiencies range from alow of 51% to a maximum value of 69%. Also, in Fig. 27, the network absorption lossis plotted as a function of frequency. Notice that above 500 MHz the network loss is0.4 dB greater than the difference between the directive pin curve and the net gain curve.This discrepancy is well within the measurement accuracy.
14
/ 72
U
/o/0 348 NEWISTNS OF IN/ ,s-uumO~s UFm
POIMAAI
I
254
2452
Is--
I S -4
. . 4
14"
URNM NOW
it. M--Trob-dadbl boamwIdthw of tbe VHF-UHF arays;dlot-hand circular polarization
28
_ _. . . .. . . ... .
NRL REPORT 8012
200
1
vvoo
NEI
124
I
200 J0 400 10 00FREQUENCY (MHz)
200 30A 400~ o BooFREQUENCY (MHI
Fig. 27-.Directive and net gains of theVHF-UHF antenna arays
ACKNOWLEDGMENTS
I would like to give credit to J. Titus and his staff for their excellent mechanicalengineering design of the antenna Fjystem, to J. Devine, L. Gasch, and to N. Pollack I'ortheir assistance in assembling and testing this system, and to the members of the Micro-wave Techniques Branch for their generous lending of their antenna test factilities.
REFERENCE
1. United States Patent 2,844,818, July 22, 1958, Andrew Alford, Cambridge, Mass,
-, GOfV I PlIV INT " 104y I" FFIC .16 2&4/Sm 1.3 29