Viability Analysis of Smallholder Cotton Production under Contract Farming in Zimbabwe By: Kingstone Mujeyi Invited paper presented at the 4 th International Conference of the African Association of Agricultural Economists, September 22-25, 2013, Hammamet, Tunisia Copyright 2013 by [authors]. All rights reserved. Readers may make verbatim copies of this document for non-commercial purposes by any means, provided that this copyright notice appears on all such copies.
Transcript
Viability Analysis of Smallholder Cotton Production under
Contract Farming in Zimbabwe
By:
Kingstone Mujeyi
Invited paper presented at the 4th International Conference of the African Association of Agricultural Economists, September 22-25, 2013, Hammamet, Tunisia Copyright 2013 by [authors]. All rights reserved. Readers may make verbatim copies of this document for non-commercial purposes by any means, provided that this copyright
notice appears on all such copies.
Viability Analysis of Smallholder Cotton Production under Contract Farming in Zimbabwe
1 Kingstone Mujeyi is a DPhil candidate in the Department of Agricultural Economics and Extension, Faculty of Agriculture, University of Zimbabwe. He is currently working as a Research Fellow at the Centre for Applied Social Sciences, University of Zimbabwe
Table of Contents Abstract .................................................................................................................................................... i
Zimbabwe has had a wide range of experience with different types of marketing systems, ranging from state-controlled to free market systems. Like many developing countries, Zimbabwe followed the development process regarding agricultural commodity marketing systems, starting with state control and then moving to a free market system from the 1930s to late 1990s (Muir-Leresche and Muchopa, 2006). State interventions during the 1990s were to regulate and facilitate the development of markets as well as protect against unfair commodity pricing systems. The implementation of the land and agrarian reforms beginning 2000 ushered back state control and interventions in the marketing of agricultural commodities. However, adoption of the multiple currency system in 2009 brought about far reaching deregulations across the marketing systems of the entire economy. Notwithstanding that, the Government of Zimbabwe (GoZ) reinstituted the Agricultural Marketing Authority (AMA)1 to regulate the marketing of agricultural commodities within the free market economy. The AMA was reintroduced, partly, as a direct response to squabbles that characterise the marketing season of seed cotton every year.
Although Zimbabwe’s cotton industry plays a critical role in the economy, its production is threatened by consistently low productivity levels, high production costs and producer price negotiation impasses every season. Government policy attempting to hedge farmers against depressed producer prices has been met with scepticism from cotton merchants who have resisted calls for improved prices. During the 2011/12 seed cotton marketing season, Government announced a producer price above the international prices so as to cushion the farmers from losses. The ginners have, however, turned a deaf ear to this announcement and have continued purchasing seed cotton at below equilibrium prices. The standoff between government and farmers on one side and ginners on the other threatens to adversely affect farm production, and therefore the survival and growth of the cotton industry in future seasons. Against this background, this paper attempts to provide an exposition of the viable pricing options that could be used to inform industry players in light of considered policy positions. An inquiry into the pricing mechanisms can assist stakeholders, particularly farmers, in modelling production and marketing decisions.
Background Cotton is a strategic crop for poverty alleviation and is of major significance to food security of smallholder farmers in marginal areas due to its contribution to their incomes and employment. The crop is a major source of livelihood for over 1,000,000 people, including
1 The Agricultural Marketing Authority is a statutory body established in terms of an Act of Parliament (CAP 18:24) of 2004, with a broad mandate to regulate the participation in production, buying and processing of agricultural products in Zimbabwe. It is a parastatal operating under the Ministry of Agriculture, Mechanization and Irrigation Development (MAMID).
1
farmers, farm workers and their families and secondary industrial workers. It is the second largest agricultural foreign currency earner after tobacco, contributing about 19 percent of agricultural export earnings. It is a major source of raw materials for the oil expressing industry with over half of the cooking oil made in Zimbabwe coming from cotton seed (AMA, 2011). The entire (100%) requirements of the domestic spinning and weaving industry, in terms of lint, are met through local production. Local ginners are mandated to destine 30 percent of their total lint output to domestic spinners and weavers before considering the export market. The challenge has recently been with the domestic spinning and weaving industry, which has failed to increase capacity utilization to absorb the 30 percent quota supplied by the ginners.
Unlike other agricultural commodities, cotton was least affected by the negative ramifications of the fast track land reform programme (FTLRP) owing to its predominant production by communal smallholder farmers. Smallholder farming of cotton has been sustained by contract production schemes driven by the private sector, a situation that has boosted external inputs provision and usage. Over the years, the problem of side-marketing, where contracted growers renege on contractual obligations and sell the contracted crop to a non-contracting buyer has however posed a big threat to the growth of the industry. In August 2009, the Government of Zimbabwe introduced new legislation that to curb side-marketing - The Agricultural Marketing Authority (Seed Cotton and Seed Cotton Products) Regulations Statutory Instrument 142. This piece of legislation sought to ensure long term viability of the cotton industry though regulating the entire cotton value chain from production to marketing. The Statutory instrument has since been amended through an amendment (Statutory Instrument 63 of 2011) to make the regulations more effective in addressing side marketing.
The whole idea of operationalizing common inputs distribution points is to make both the farmers and the ginners benefit in the end by avoiding multiple contracting and to ensure timely provision of inputs. The common funding arrangement will also guarantee transparency since inputs support by each contractor to contracted farmers is verifiable and is being carried out at the same time. Contractors will therefore only be allowed to purchase seed cotton from their own contracted farmers at designated common buying points. The monitoring modalities of the scheme will include the AMA inspectors, Cotton Marketing Technical Committee (CMTC) members as well as the CGA Local Area Committees who will ensure that fair trade practices are observed. Any contractor operating in violation of the Regulations will be penalised or have his/her buying licence withdrawn, depending on the gravity of the offense. The overall goals of the common input fund are to increase crop size and quality through provision of adequate inputs to farmers; to boost investor (contractor) confidence through ensuring fair business practices and to restore sound industrial standards in handling cotton.
The regulations provide for the establishment of a committee, Cotton Marketing Technical Committee (CMTC), under the AMA, to spearhead and oversee the implementation of the
2
regulatory framework. According to AMA (2011), the Committee has been instrumental in ensuring structured marketing and fair pricing of cotton during the 2010/11farming season. The new regulations have however been criticised by the cotton farmers for being too restrictive since they remove options for the farmers to sell to a buyer of choice who may offer a better seed cotton producer price. They provide for the establishment of centralized common inputs distribution points (CIDPs) and common buying points (CBPs) within the cotton growing areas under the direct supervision of the CGA local area committees (LACs).
Despite being hailed as a success story of private sector participation in smallholder agriculture in Zimbabwe, cotton contract production and marketing arrangements have had a fair share of challenges, and such challenges have been typified by seasonal recurrence of side marketing and price negotiation impasses. Standoffs are characterised by contract buyers arguing for lower prices on one hand, while farmers lobby for higher prices on the other. Prices offered by contractors are considered unviable by farmers, prompting government interventions to appease recurrent pricing malaises. Accusations and counter-accusations between producers of the commodity (predominantly smallholder farmers) and contractors have led to a ‘cold war’ in the cotton industry. Farmers continue accusing contractors of having formed a cartel through their association, the Cotton Ginners Association (CGA) with the purpose of colluding to offer oppressively low producer prices for seed cotton, whilst charging exorbitant prices for their contracted inputs. On the other hand, the ginners blame the farmers for failure to increase productivity and production as well as exhibiting loan repayment evasion tendencies through side-marketing. Cotton yields are not improving despite the investments by the contractors, whom now feel they are promoting farmer inefficiencies. The intervention of the State in the affairs of the cotton industry, commonly characterized by price setting above the equilibrium price, though seen as a welcome move by the farmers who now use it as a threat and trump card in price negotiations, is seen by the ginners as tantamount to market distortion and threat to viability and sustainability of the industry.
The farmers held on to their cotton in anticipation of better rewards, which was in vain as the ginners continued purchasing cotton between US30c and US40c per kilogram. Whilst farmers were holding onto their crop, the quality of the cotton continued declining, whilst in some cases the cotton stored in houses reportedly caught fire. De facto, the farmers had to sell their crop to ginners at the low prices despite the government maintaining the pronounced prices.
Historical Developments in the Cotton Industry While cotton production in Zimbabwe can be traced back to the pre-colonial era, commercial cotton production began in 1923 following close to two decades of research trials by the settler regime using seeds from North Africa, United States of America and Latin America (Poulton and Hanyani-Mlambo, 2007). A Cotton Research Centre was established in 1925 and early research (up to 1950) focused on effective pest control methods and a breakthrough
3
in chemical control of pests was achieved in the 1950s paving way for rapid expansion of production in the 1960s (Mariga, 1994). First cotton ginneries were constructed in 1943 while spinning mills were set up in 1981 (Poulton and Hanyani-Mlambo, 2007). By 1958, the responsibility of cotton marketing was given to the Cotton Marketing Board (CMB), a parastatal that operated as a monopoly. Another parastatal, the Agricultural Marketing Authority (AMA) was set up in 1967 to coordinate functions of the CMB and other agricultural parastatals. Beginning 1976, the AMA started announcing minimum guaranteed seed cotton producer prices prior to planting. The state played an active role in ensuring that cotton production remained profitable for the predominantly white large scale commercial farmers. As such, attractive cotton producer prices remained a feature of the industry until the late 1980s when a requirement to provide subsidized lint to the domestic textile industry became increasingly burdensome to the CMB (Ibid).
Following the attainment of independence in 1980, the broad thrust of Government agricultural policy was to extend support services (research, extension, credit and marketing) from the LSCF sector to the previously marginalised smallholder sector of indigenous farmers residing in communal and small scale commercial farming areas. This policy thrust witnessed an expansion in the number and network of CMB depots in communal areas from five in 1980 to sixteen by 1985 (Poulton and Hanyani-Mlambo, 2009). Coupled with attractive pricing policy in the early 1980s and the fact that the Agricultural Finance Cooperation (AFC) was still actively lending to progressive farmers in the communal areas, the policy gave rise to the smallholder agricultural revolution of the 1980s. Financial services support (credit provision) through the AFC collapsed around the end of the decade from independence owing to massive defaulting (bad debts). Nevertheless, the CMB remained a generally effective and well-run state enterprise throughout the 1980s and even managed to provide alternative financing mechanisms to the smallholder farmers beginning in 1992 (Ibid). However, the directive by the GoZ for the CMB to first meet domestic lint requirements of the local spinning industry at subsidised prices (below export parity) gradually drove down the seed cotton producer price between 1985 and 1990. As a result, a significant number of LSC farmers opted out of cotton production causing the commercial production of seed cotton that had peaked to around 200,000 metric tonnes in the 1987/88 season to fall to around one third of this level by the early 1990s (Ibid).
By contrast, smallholder farmers who had fewer options to shift to alternative high value enterprises that were available to the LSC producers continued to increase their production of cotton to the extent that by the end of the 1980s, over 50 percent of national cotton production was accounted for by the smallholders. It is interesting to note that after attainment of the 1987/88 season’s level of commercial cotton production, it took the country more than a decade for the commercial production to surpass this peak.
Prior to the ESAP, the GoZ controlled cotton marketing through the CMB which established the producer price of seed cotton on the basis that the local textile industry (then dominated by David Whitehead and Cone Textiles) had their requirements met at predetermined prices
4
which were below the export parity price (Muir-Leresche and Muchopa, 2006). This pricing policy, according to Mahofa (2008), was very regressive and negatively affected growth by allocating resources away from cotton production.
The CMB was granted formal managerial autonomy in 1991 while its statutory monopoly in purchasing, ginning and exporting cotton was finally ended in 1994 (Muir-Leresche and Muchopa, 2006). A government owned Cotton Company of Zimbabwe (COTTCO) was launched in 1994 to replace the CMB and was finally privatised in 1997. The opening up of the cotton industry to competition during the ESAP era witnessed the entry of new competitors into the cotton market with Cargill, a United States based multinational company coming into the fray in the 1995/6 season. When Cargill entered the market, it introduced the cash payment system under the slogan “Donje kuCargill, mari kuvanhu” (Cotton to Cargill, money to the people). This was welcomed by the cotton farmers as it ensured immediate access to cash unlike the CMB system which made farmers to wait up to four weeks for cash after delivering their seed cotton.
Increased competition from Cargill forced Cottco to shift towards the cash payment system and entry into the market by more competitors owing to the liberalisation of the economic reforms led them to supplying inputs credit tied to seed cotton sales. While the producer price of seed cotton used to be 58 percent of the international price prior to the deregulation, the liberalisation of cotton marketing led to the ratio of domestic to international prices to rise to 79 percent between 1994 and 1997 (Rukuni et al, 2006). Following the reforms in the cotton sector, new private merchants and ginners emerged and seed cotton production by smallholders increased giving rice to new dynamism to the rural sector (World Bank, 2000).
Contract Farming Contract Farming (CF), which is defined as a system for the production and supply of land based and allied produce by farmers/primary producers under advance contracts, has the essence of such arrangements being a commitment to provide an agricultural commodity of a type, at a specified time, price, and in specified quantity to a known buyer (Singh, 2010). In fact, CF can be described as a halfway house between independent farm production and corporate farming. Due to the efficiency (co-ordination and quality control in a vertical system) and equity (smallholder inclusion) benefits of this hybrid system, it has been promoted aggressively in the developing world by various agencies. It basically involves four things - pre-agreed price, quality, quantity or acreage (minimum/maximum) and time (Singh, 2002). In the small producer contexts, CF is recommended as the only way to make small scale farming competitive as the services provided by contracting agencies cannot be provided effectively by any other agencies (Eaton and Shepherd, 2001). Contract faming also lowers transaction costs for the farmers as many of the transactions are internalized by the contracting agency/firm (IFPRI, 2005).
5
The contracts could be of three types; (i) procurement contracts under which only produce sale and purchase conditions are specified; (ii) resource provision contracts wherein some of the inputs are supplied by the contracting firm and the produce is bought at pre-agreed prices; and (iii) total contracts under which the contracting firm supplies and manages all the inputs on the farm and the farmer becomes just a supplier of land and labour. Whereas the first type is generally referred to as marketing contracts, the other two are types of production contracts (Singh, 2010). The relevance and importance of each type varies from product to product and over time and these types are not mutually exclusive. But, there is a systematic link between product and factor markets under the contract arrangement as contracts require definite quality of produce and, therefore, specific inputs. Also, different types of production contracts allocate production and market risks between the producer and the processor in different ways.
Contract Farming in Zimbabwe Of the many types of market linkage approaches, contract farming has been recognised by Zimbabwean and African leaders as a system that has the potential to increase productivity and reduce rural poverty (SNV, 2009). Contract farming can potentially provide farmers with many benefits that extend far beyond the provision of markets including access to input loans and credit, provision of extension and technical advice, appropriate technology and management systems. These benefits are particularly relevant for Zimbabwe’s smallholder farmers who, until recently, were experiencing unprecedented economic hardship due to economic decline and hyperinflation. Agricultural inputs continue to be of limited availability on the open market and there is a diminished capacity of public sector agencies to support smallholder farmers.
Many of the companies started engaging farmers in contract farming during or after the early 1990’s. Prior to this, the marketing of many agricultural products was regulated by the State through a number of statutory Marketing Boards. In 1992 the Zimbabwe government embarked on the World Bank’s recommended Economic Structural Adjustment Programme (ESAP) which encouraged the deregulation of agricultural marketing. This period saw the commencement of liberalisation programmes for the main agricultural products including cotton, grains, coffee, dairy products, beef and pork which increased opportunities for companies to become involved in contract farming (Ibid).
ZIMCOOD (2010) noted that the cotton industry in Zimbabwe is characterised by unjust national, regional and international trade practices which are skewed in favour of big companies and cotton merchants. According to ZIMCODD, the negotiation process in cotton marketing at the domestic level takes place between two extremely unequal partners. On the international arena, Western countries subsidize their farmers; a situation that distorts cotton lint prices resulting, in most cases, in the plummeting of seed cotton producer prices in developing countries like Zimbabwe. The bargaining power of the smallholder cotton producers is undermined by various factors, chief among them being lack of capital, absence
6
of organised (or collective) actions, and little or lack of market intelligence on pricing, contracts, alternative markets, etc. The smallholder farmers also claim that national farmer representative bodies like Zimbabwe Farmers’ Union (ZFU) have failed to actively represent them. Meanwhile cotton companies are better organised and overbearing when it comes to influencing policy. Thus, the cotton companies have a monopoly over the distribution of inputs, grading and pricing of seed cotton, and coercing smallholder farmers into contract farming arrangements. ZIMCODD (2010) alleges that the unjust state of play and uneven playing field has threatened the livelihoods of smallholder farmers.
Methodology This study relies on secondary data for much of the analyses made in this paper. It is basically a desk study which makes better use of literature around the subject to support certain arguments. Empirical data has been collected from various secondary sources including institutional databanks, organizational progress reports and informal interviews and discussions with players in the cotton industry. Verifications have been made with various sources to ensure reliability of the data used.
PRODUCTION AND MARKETING OF THE CROP
Cotton Production in Zimbabwe Zimbabwe’s cotton is mainly produced by over 200,000 smallholder families predominantly in communal areas who account for 98 percent of national annual seed cotton output. The best conditions for growing cotton are found in the semi-arid regions of the country (Agro-ecological Regions III to V). These are areas in regions where such conventional crops like maize do not perform well thereby forcing the farmers to rely on cotton production for income. Thus, cotton production accounts for more than 75 percent of household incomes in these areas (AMA, 2011). The Government of Zimbabwe’s policy of encouraging private sector involvement in agricultural financing has resulted in almost 99 percent of the cotton crop being produced under contract farming (Ibid). The number of contractors increased from 2 (Cottco and Cargill) in 1996 to 142 during the 2011/12 season. Table 1 below shows registered contractors, cotton growing areas where they contracted and the number of farmers contracted during the 2011/12 season. The table shows that a total of 280,665 farmers were contracted to grow 575,454 hectares of cotton representing 33.6 percent and 40.7 percent increases in the number of contracted farmers and cropped area from last season (2010/11) figures of 210,153 farmers and 408,878 hectares respectively. These figures provided by cotton merchants differ from official figures due to multiple contracting and “double dipping” by some farmers.
2 Cottco, Cargill, Olam, Romsdal, Alliance, Sino Zimbabwe, Grafax, Parrogate, Cottzim, Insing, Fahad, Southern Cotton, Jinmac and Viridis
7
Table 1: Cotton Contractors, Contracted Farmers and Growing Areas (2012) Company Name Growing Areas No. of Contracted
The cotton marketing regulations (SI 142 of 2009 and SI 63 of 2011) administered under the Agricultural Marketing Authority Act (AMA Act 18:24) require that cotton companies provide certain minimum input requirements to farmers for production and delivery of a certain minimum quantity of seed cotton output. The provision of inputs is done through centralized Common Inputs Distribution Points (CIDPs) within the growing areas where all companies operating within the area provide inputs from, under the direct supervision of the Cotton Ginners Association (CGA). The cotton farmers accuse the
8
merchants/contractors/ginners of distributing inadequate input packages and supplying the inputs late into the season, resulting in them attaining lower than anticipated yields.
Apart from side-marketing, as discussed, cotton contract farming has experienced systemic problems such asprovision of incomplete input packages by contractors, low seed cotton yields per hectare and reneging on contractual obligations by both parties. Civil society organisations allege that the contractual arrangements in cotton farming are akin to an engagement of unequal partners with farmers playing a junior partner role.
Inputs Distribution During the 2010/2011 season, seed cotton inputs were collectively warehoused and distributed to growers through 47 common warehouses throughout the cotton growing areas, under the supervision of the CGA. The common inputs facility guarantees transparency, reduce incidences of multiple contracting by farmers, and ensures coordinated and timely provision of adequate inputs by contractors in an orderly manner. Minimum input packages for the different categories of farmers agreed between the merchants and farmers’ representatives are given in Table 2 below. The cotton farmers are categorised into four classes namely A, B+, B and C classes in accordance with the vetting done by the cotton merchants, farmers’ representatives and extension officers from the Department of Agricultural Technical and Extension Services (AGRITEX).
Table 2: Minimum Input Packages for the 2011/12 season
CLASS OF FARMER A B plus B C Input Quantity Quantity Quantity Quantity Seed (15kg) 1 1 1 1 Fertilisers (50 kg) Compound L 3 2 2 1 Ammonium Nitrate 2 2 1 1 Chemicals Conventional Carbaryl (I kg) Min-Max 1-2 1-2 1-2 1-2 Aphicides Acetamark (50 g) 2 2 2 2 Pyrethroids Karate / Fenkill ( ltr) 1.5 1.5 1.5 1.5 Acaricides Tetradiphon/Mitac (1 ltr) 0.5 0.5 0.5 0.5 Yield (kg/ha) 1,500 1,400 1,000 700 Source: CGA
9
A total of 8,189 tonnes of cotton planting seed was distributed by contractors. Table 3 below gives details of quantities of all inputs distributed by the contractors during the 2011/12 season.
Table 3: Inputs Distributed by Contractors during 2010/2011 Season Input Category Input Name Quantity
Seed Cotton planting seed 8,189 tonnes
Basal Fertilizers Compound L 8,701 tonnes
K Fertilizer 539 tonnes
Organic Fertilizer 319 tonnes
Top Dressing Fertilizers Ammonium Nitrate 10,355 tonnes
Chemicals: Conventional Carbaryl 273,619 kg
Aphicides Acertamark 17,834 kg
Carbosulfan 66,829 litres
Pyrethroids Karate/Fernkill 242,194 litres
Acaricides
Tetradiphon/Mitac 714 litres
Source: CGA
Area Planted The total area put under seed cotton production increased during the 2011/12 season by 14 percent to 432,901 hectares from 379,689 hectares in 2010/11 after it had rose by almost 20 percent from 315,000 hectares planted during the previous season (2009/10) as shown in Table 4 below. The increase can be attributed to the firming of the international cotton lint prices, which at one point peaked to US254 cents per pound during the 2011 marketing season.
Table 4: Zimbabwe Seed Cotton Production Statistics (2000 – 2012) Production Season
In terms of share of area contracted the cotton merchants during the 2010/11 season, Cottco was the biggest contractor, with 34% followed by Cargill with 15%, then Sino with 11%, while Parrogate had the least contracted hectarage, accounting for only 1 percent as shown in Figure 1.
Figure 1: Market Share of Area Contracted By Contractor, 2010/2011 Season
Source: AMA (2011)
Cotton Output Trends Seed cotton production during the 2011/2012 season increased by 37 percent to 342,813mt from the 2010/11 season’s 249,904mt. Before this, it had decreased by 7 percent from 270,000mt realized in the previous (2009/2010) season. This was however, 20 percent higher than the 207,000mt realized during the 2008/2009 season. Since 1980, the highest production level was attained in 2000 when 353,000 tonnes were produced and the lowest of 76,232 tonnes in 1992 when a severe drought that affected production of all the major crops was experienced. Figure 2 below gives trends in production and planted area since 2000.
11
Figure 2: Cotton Production Trend (2000 - 2012)
Source: Author
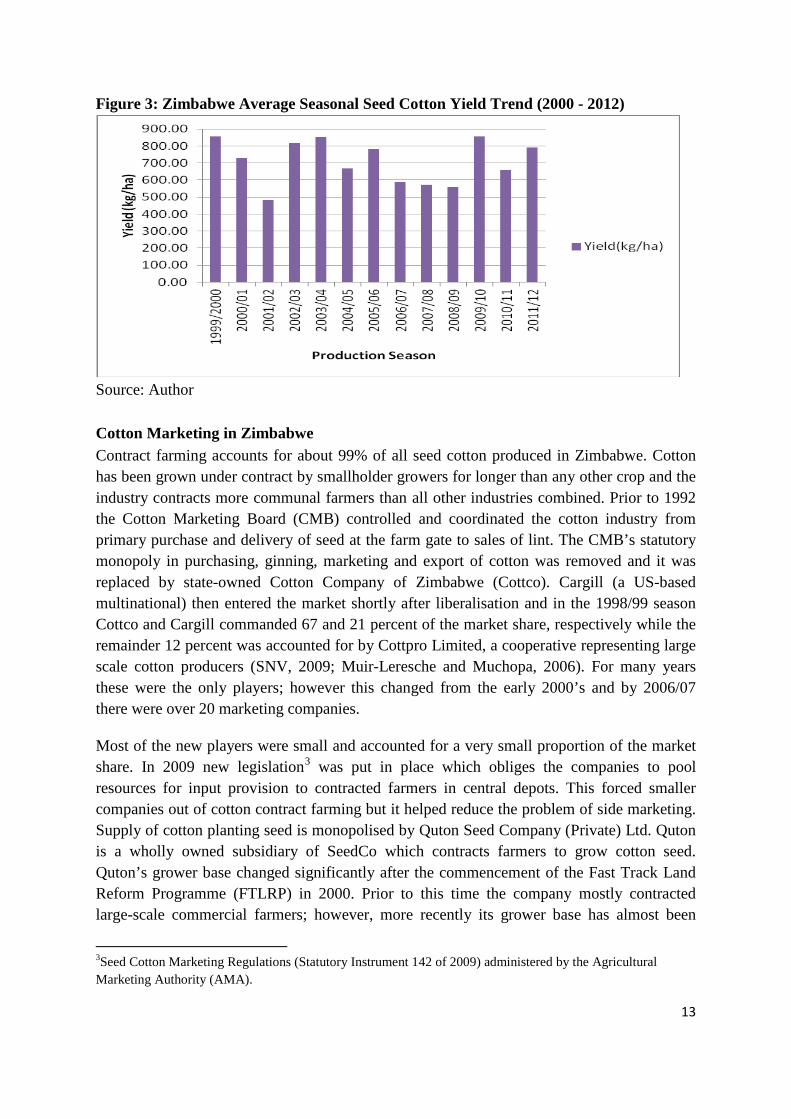
Despite the 14 percent and 20 percent increases in area planted to seed cotton, the total crop production figures have not responded proportionately owing to yield variability, as a result of fluctuations in the rainfall pattern. Average yields in 2010/2011 season, decreased by 23 percent to 658kg/ha from 857kg/ha realized in the previous season but it rebounded 20 percent to 792kg/ha during the 2011/12 season. A trend analysis of the production pattern reveals that cotton production is generally increasing even though the rate of increase has not been substantially high. The increase in output is entirely attributable to the increase in area planted as opposed to increase in productivity, since yield levels have actually been declining over the years as can be seen in Figure 3 below.
The general trend for average seed cotton yield has however been declining since 1990. Over the years, yield levels were affected negatively by lack of effective pest control methods, decrease in cotton extension services, recurring droughts, lack of access to credit and lack of regulatory enforcement mechanism which was a disincentive to increased investment in the sector (AMA, 2011).
Cotton Marketing in Zimbabwe Contract farming accounts for about 99% of all seed cotton produced in Zimbabwe. Cotton has been grown under contract by smallholder growers for longer than any other crop and the industry contracts more communal farmers than all other industries combined. Prior to 1992 the Cotton Marketing Board (CMB) controlled and coordinated the cotton industry from primary purchase and delivery of seed at the farm gate to sales of lint. The CMB’s statutory monopoly in purchasing, ginning, marketing and export of cotton was removed and it was replaced by state-owned Cotton Company of Zimbabwe (Cottco). Cargill (a US-based multinational) then entered the market shortly after liberalisation and in the 1998/99 season Cottco and Cargill commanded 67 and 21 percent of the market share, respectively while the remainder 12 percent was accounted for by Cottpro Limited, a cooperative representing large scale cotton producers (SNV, 2009; Muir-Leresche and Muchopa, 2006). For many years these were the only players; however this changed from the early 2000’s and by 2006/07 there were over 20 marketing companies.
Most of the new players were small and accounted for a very small proportion of the market share. In 2009 new legislation3 was put in place which obliges the companies to pool resources for input provision to contracted farmers in central depots. This forced smaller companies out of cotton contract farming but it helped reduce the problem of side marketing. Supply of cotton planting seed is monopolised by Quton Seed Company (Private) Ltd. Quton is a wholly owned subsidiary of SeedCo which contracts farmers to grow cotton seed. Quton’s grower base changed significantly after the commencement of the Fast Track Land Reform Programme (FTLRP) in 2000. Prior to this time the company mostly contracted large-scale commercial farmers; however, more recently its grower base has almost been
3Seed Cotton Marketing Regulations (Statutory Instrument 142 of 2009) administered by the Agricultural Marketing Authority (AMA).
13
entirely comprised of smallholder farmers. During the 2010/11 agricultural season, 13 cotton merchants or contractors registered with AMA and conducted contract farming.
Pricing of Seed Cotton Under the contract marketing system, at the beginning of each marketing season, stakeholders in the cotton industry comprising mainly the CGA and farmers representatives hold consultative meetings to negotiate the producer price of seed cotton. The negotiations entail analyses of farmers’ and ginners’ cost of production and prevailing world market price of cotton lint as published on the 4Cotlook A Index. The initial agreement in April 2011 was as follows:
• 85c/kg for grade D,
• 89c/kg for grade C,
• 96c/kg for grade B, and
• 105c/kg for grade A.
The specific conditions agreed to by ginners and farmers were as follows:
a) Farmers shall be represented at each grading point by qualified persons familiar with seed cotton grading.
b) Ginners or merchants shall pay grade differentials prices by the 30th of September 2011.
c) There shall be appeal forms to be completed by farmers who feel aggrieved by their grading results.
d) Performance related bonus shall be paid by the 30th of November 2011. e) Both parties shall monitor the average Cotlook A Index on a monthly basis from
July 2011 to 30 November 2011. f) Ginners shall declare to Cotton Marketing Technical Committee (CMTC)
quantities and prices of their monthly exported lint.
4 Cotlook "A" Index-is a proxy for the world price of cotton. It is calculated by taking the average of the
cheapest five quotations. Cotlook Indices are calculated from the prices at which cotton is offered to the final
consumers i.e. mills. The Index is intended to be representative of the level of prices offered on the international
raw cotton market and is based on Cost and Freight (CFR) Far East quotes. Quotes prior to August 2002 were
based on CIF N. Europe values.. The terms quoted are Cost and Freight, Letter of Credit at sight, including one
percent agent's commission and notional profit. Cotlook Indices are acknowledged by the trading fraternity,
governments and international organizations such as UNCTAD and International Cotton Advisory Council
(ICAC) as accurate measures of the fluctuations of international raw cotton values.
14
However after a sharp surge in cotton lint prices to record levels on the world market during the beginning of the year, domestic prices started falling by end of April 2011. Following series of negotiations between the buyers and the farmers’ representatives, the seed cotton minimum producer prices were further revised twice during the marketing season as a result of the continued decline in the Cotlook A Index as given in Table 5 below.
(USc/kg) Grade A 105 96 55 85 Grade B 96 86 50 77 Grade C 89 80 45 71 Grade D 85 75 40 66 Source: AMA (2011) and Author’s calculations
The review was necessitated by the continued decline in international cotton lint prices as quoted by the Cotlook A Index from 237c/Pound at the end of March 2011 to 114c/ Pound as at the 3rd of August 2011. A pricing formula was then devised through the negotiations to depict the producer price when the international market price changes. The formula was such that when the international (Cotlook A index) price was USc150/lb, the producer price of seed cotton paid to the farmer would be USc79/kg and when it falls to USc50/lb, then the price paid to farmers would be USc34/kg. The figures outlined in this paragraph represent simultaneous equations. A back of the envelope calculation of the “pricing formula” gives the mathematical expression:
Y=11.5+0.45X.
Where
Y= domestic price and
X= international price.
Table 6 below is a presentation of the price formulation matrix.
Viability Analysis of the Cotton Marketing System In analysing the cotton marketing system under contract production and marketing, it is imperative to look at the whole picture starting with production. It is critical to take into consideration all the costs that the farmer encounters during production, assigning cost values to all activities and items that are often overlooked in budgeting processes including the use of family labour. In smallholder farming systems, use of family labour in executing on-farm activities is usually considered ‘free of charge’ and does not get incorporated into enterprise budgets. However, for the purposes of this study, all labour (family or hired) will be cost at the prevailing market values.
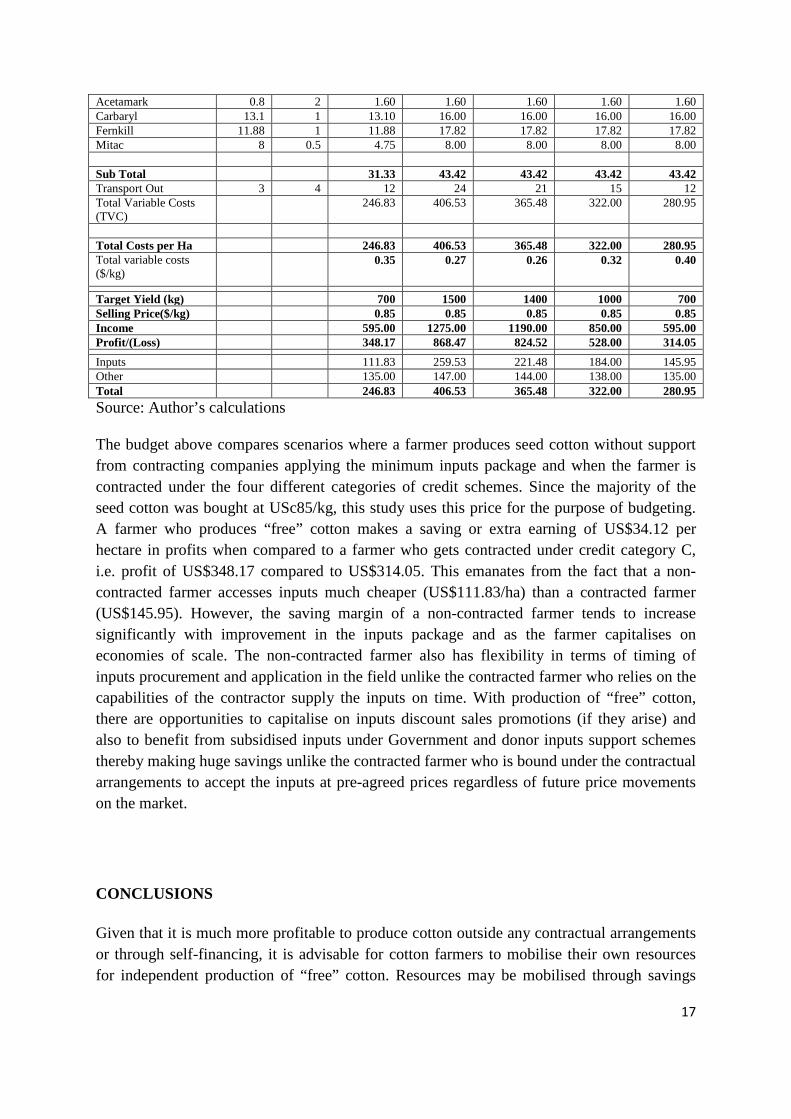
Table 7: Cotton Enterprise Budget Based on Farmers’ Cost of Production Self-
The budget above compares scenarios where a farmer produces seed cotton without support from contracting companies applying the minimum inputs package and when the farmer is contracted under the four different categories of credit schemes. Since the majority of the seed cotton was bought at USc85/kg, this study uses this price for the purpose of budgeting. A farmer who produces “free” cotton makes a saving or extra earning of US$34.12 per hectare in profits when compared to a farmer who gets contracted under credit category C, i.e. profit of US$348.17 compared to US$314.05. This emanates from the fact that a non-contracted farmer accesses inputs much cheaper (US$111.83/ha) than a contracted farmer (US$145.95). However, the saving margin of a non-contracted farmer tends to increase significantly with improvement in the inputs package and as the farmer capitalises on economies of scale. The non-contracted farmer also has flexibility in terms of timing of inputs procurement and application in the field unlike the contracted farmer who relies on the capabilities of the contractor supply the inputs on time. With production of “free” cotton, there are opportunities to capitalise on inputs discount sales promotions (if they arise) and also to benefit from subsidised inputs under Government and donor inputs support schemes thereby making huge savings unlike the contracted farmer who is bound under the contractual arrangements to accept the inputs at pre-agreed prices regardless of future price movements on the market.
CONCLUSIONS
Given that it is much more profitable to produce cotton outside any contractual arrangements or through self-financing, it is advisable for cotton farmers to mobilise their own resources for independent production of “free” cotton. Resources may be mobilised through savings
17
from crop sales or other sources for purchase of inputs during the off-peak period when input prices will be reasonably lower. Contract farming should be considered as a spring board towards self-sustenance, when a farmer will be able to make independent decisions. However, were resource constraints are the order of the day, farmers should consider contract farming as a panacea to their agricultural financing problems. Conditions under which contract farming arrangements should be entered into should ensure that the contract is clear so that each party clearly understands its obligations. Since farming requires good planning, inputs need to be availed on time by the contractors to the farmers. There is great need, therefore, for the farmers to be trained in the contract farming process to understand its importance, manage productivity, avoid side-marketing and use inputs properly. As such, contractors, on the other hand, must be passionate players who take cognisance in the fact that their long-term requirements must sustain satisfy the needs of the farmers and therefore must guarantee a win-win situation. Stakeholders in the cotton industry must always have a platform to continuously engage in dialogue meant to discuss and resolve issues pertaining to the industry. This platform is crucial in ensuring that pre-planting and pre-delivery producer prices are always worked out and set for concerned stakeholders to make informed choices and decisions. A legal framework that governs engagement of parties in contract farming is missing. It is important for such a framework to be put in place and for smallholder farmers, who the majority players, to be consulted in the drafting of this framework. The obtaining situation that supply of cotton planting seed is still monopolized and centralized with Quton in Harare should be ended to enable the farmers to access the planting seed at competitive prices throughout the country. This will provide the farmers with an option to get out of the contract farming trap and be able to produce “free” cotton.
Generally, there is need for fair and competitive seed cotton producer prices to be paid to the smallholder farmers to avoid collapse of the cotton industry which is the only major source of livelihoods for these farmers, majority of whom are in the semi-arid regions. In the short to medium term, the GoZ must put in place a producer price subsidy to cushion the farmers from the effects of international price fluctuations. In the long term, the GoZ should make concerted efforts to resuscitate the local textile industry and protect them from unfair competition posed by dumping of cheap finished textile products and second hand clothing which have, lately, seen the flourishing of second hand clothing boutiques across the country. Under the auspices of the Indigenization and Economic Empowerment Programme, there is need to empower the small scale cotton producers with micro-ginning equipment and skills to operate the same for value addition of the seed cotton they produce. This move will ensure that the farmers realise higher returns through gaining control over higher valued cotton lint and at the same time retaining ownership of valuable by-products like ginned seed. Ownership of the ginned seed will provide the farmers with an option to further value add by processing the seed into cooking oil and cotton seed cake for livestock feeds.
18
REFERENCES
Agricultural Marketing Authority (cited as AMA, 2011). 2011 End of Year Cotton Report. AMA Publications, Harare.
IFPRI (2005): High Value Agriculture and Vertical Co-ordination in India –Will the Smallholders Participate? A draft research report, IFPRI, Washington D.C.
Mahofa G. (2008)&Economic Analysis of Factors Affecting Cotton Production in Zimbabwe. Working Paper prepared for the CMAAE Thesis Dissemination Workshop. Harare
Masters, W. A. and Winter-Nelson A. (1995). “Measuring the Comparative Advantage of Agricultural Activities: Domestic Resource Costs and the Social Cost-Benefit Ratio.”Amerccan Journal of Agricultural Economics, Vol. 77:243-50.
Mohanty S, Fang S and Chaudhary J. (3010).Assessing the Competitiveness of Indian Cotton Production: A Policy Analysis Matrix Approach. Department of Agricultural and Applied Economics.
Muir Leresche (2006). Agriculture in Zimbabwe. In Rukuni M, Tawonezvi P, Eicher C, with Munyuki-Hungwe M and Matondi P (2006).Zimbabwe’s Agricultural Revolution Revisited. University of Zimbabwe Publications.
Muir-Leresche K. and Muchopa C. (2006).Agricultural Marketing. In Rukuni M, Tawonezvi P, Eicher C, with Munyuki-Hungwe M and Matondi P (2006).Zimbabwe’s Agricultural Revolution Revisited. University of Zimbabwe Publications.
Poulton C. and Hanyani-Mlambo B. (2009).The Cotton Sector of Zimbabwe. Africa Region Working Paper Series No. 122.February, 2009
Rukuni M, Tawonezvi P, Eicher C, with Munyuki-Hungwe M and Matondi P (2006). Zimbabwe’s Agricultural Revolution Revisited. University of Zimbabwe Publications.
Sing S (2010).Understanding Practice of Contract Farming in India: A Small Producer Perspective. Centre for Management in Agriculture (CMA), Indian Institute of Management (IIM), Ahmedabad -380 015. Gujarat, INDIA
Singh, S (2002): “Contracting Out Solutions: Political Economy of Contract Farming in the Indian Punjab”, World Development, 30(9), 1621-1638.
SNV (2009). Inventory of Smallholder Contract Farming Practices in Zimbabwe. Support Capacity for Enhanced Market Access and Knowledge Management (SCAPEMA). Netherlands Development Organisation, Harare.
World Bank (2000).Cotton Policy Brief. Washington DC, 2000
Zimbabwe Coalition on Debt and Development (cited as ZIMCODD, 2010). Community Voices on Small-scale Cotton Farming in Zimbabwe.ZIMCODD and SAPSN. Harare.