VIBRATION INVESTIGATION OF PASSENGER CAR REAR SUSPENSION SYSTEM UNDER VARIOUS ROAD CONDITION AND DRIVING MANEUVER MOHD FARID BIN ZAINUDIN Report submitted in fulfilment of the requirements for the award of the degree of Bachelor of Mechanical Engineering with Automotive Engineering Faculty of Mechanical Engineering UNIVERSITI MALAYSIA PAHANG DECEMBER 2010
Transcript
VIBRATION INVESTIGATION OF PASSENGER CAR REAR SUSPENSION
SYSTEM UNDER VARIOUS ROAD CONDITION AND DRIVING MANEUVER
MOHD FARID BIN ZAINUDIN
Report submitted in fulfilment of the requirements
for the award of the degree of
Bachelor of Mechanical Engineering with Automotive Engineering
Faculty of Mechanical Engineering
UNIVERSITI MALAYSIA PAHANG
DECEMBER 2010
ii
SUPERVISOR’S DECLARATION
We hereby declare that we have checked this project and in our opinion, this project is
adequate in terms of scope and quality for the award of the degree of Bachelor of
Mechanical Engineering with Automotive Engineering.
Signature
Name of Supervisor: PROF. DR. HJ. ROSLI BIN ABU BAKAR
Position: DEAN OF FACULTY OF MECHANICAL
ENGINEERING
Date: 06 DECEMBER 2010
Signature
Name of Co-supervisor: MR. GAN LEONG MING
Position: LECTURER OF FACULTY OF MECHANICAL
ENGINEERING
Date: 06 DECEMBER 2010
.
.
iii
STUDENT’S DECLARATION
I hereby declare that the work in this project is my own except for quotations and
summaries which have been duly acknowledged. The project has not been accepted for
any degree and is not concurrently submitted for award of other degree.
Signature
Name: MOHD FARID BIN ZAINUDIN
ID Number: MH 07050
Date: 06 DECEMBER 2010
v
ACKNOWLEDGEMENTS
I would like to express my sincere gratitude to my supervisor Professor Dr. Hj.
Rosli bin Abu Bakar for his germinal ideas, invaluable guidance, continuous
encouragement and constant support in making this research possible. He has always
impressed me with his outstanding professional conduct, his strong conviction for
science, and his belief that a Degree program is only a start of a life-long learning
experience. I am truly grateful for his progressive vision about my training in science,
his tolerance of my mistakes, and his commitment to my future career. I also would like
to express very special thanks to my co-supervisor Mr. Gan Leong Ming for his
suggestions and co-operation throughout the study. I also sincerely thanks for the time
spent proofreading and correcting my many mistakes.
My sincere thanks go to all my groupmates and members of the staff of the
Mechanical Engineering Department, UMP, who helped me in many ways and made
my stay at UMP pleasant and unforgettable. Many special thanks go to member UMP
test car group for their excellent co-operation, inspirations and supports during this
study.
I acknowledge my sincere indebtedness and gratitude to my parents for their
love, dream and sacrifice throughout my life. I cannot find the appropriate words that
could properly describe my appreciation for their devotion, support and faith in my
ability to attain my goals. Special thanks should be given to my committee members. I
would like to acknowledge their comments and suggestions, which was crucial for the
successful completion of this study.
vi
ABSTRACT
Suspension system plays an important role in the performance of a vehicle, especially
vehicle handling and ride comfort. The objective of this project is to analyze the results
in vibration of passenger car rear suspension system under various road conditions and
driving maneuver. Experimental analysis was performed on the passenger car rear
suspension system. The data collected by DEWESoft software was analyzed by using
time domain analysis. In time domain analysis, the acceleration response of rear
unsprung mass and suspension travel were determined by using post-processing method
in Flexpro software. The maximum root mean square (r.m.s) acceleration of the
unsprung mass was determined by using statistical analysis. In frequency domain
analysis, the data was analyzed by using Fourier Spectral Analysis. The peak value of
r.m.s amplitude of the unsprung mass acceleration was determined by using statistical
analysis. The results were then evaluated by comparing them with different vehicle
speed, road conditions and driving maneuver. From the results, it shows that the r.m.s
acceleration of rear unsprung mass is increase as the vehicle speed increase, due to the
excitation from the engine speed. The highest vehicle speed also produced response
peaks at frequency range of 50 – 100 Hz and 200 – 250 Hz. The results also indicate
that the bump road surface gives higher excitation to rear unsprung mass based on r.m.s
acceleration value. Unpaved road surfaces give higher response peak in frequency range
of 50 – 100 Hz. Next, the results obtained shows that constant speed at constant radius
cornering maneuver gives higher r.m.s acceleration value and higher response peak to
rear unsprung mass.
vii
ABSTRAK
Sistem suspensi memainkan peranan penting dalam prestasi sesebuah kenderaan,
terutamanya pengendalian kenderaan dan keselesaan. Objektif projek ini adalah untuk
menganalisis hasil dalam getaran pada sistem suspensi belakang kereta dalam pelbagai
keadaan jalan dan cara pemanduan. Analisis eksperimen telah dilakukan pada sistem
suspensi belakang kereta. Data yang dikumpul oleh perisian DEWESoft dianalisis
dengan menggunakan analisis domain masa. Dalam analisis domain masa, respon
pecutan pada jisim sistem suspensi belakang dan pergerakan pegas pada sistem suspensi
belakang ditentukan dengan menggunakan kaedah pemprosesan pasca di dalam perisian
Flexpro. Nilai maksima punca kuasa dua pecutan pada jisim sistem suspensi belakang
ditentukan dengan menggunakan analisis statistik. Dalam analisis frekuensi domain,
seterusnya data dianalisis dengan menggunakan analisis Spektral Fourier. Nilai puncak
amplitud punca kuasa dua pecutan jisim sistem suspensi belakang kereta ditentukan
dengan menggunakan analisis statistik. Hasil analisis kemudian dinilai dengan
membandingkan kesemuanya dengan kelajuan kenderaan yang berbeza, keadaan jalan
dan cara pemanduan. Daripada hasil analisis, ia menunjukkan bahawa punca kuasa dua
pecutan pada jisim sistem suspensi belakang bertambah sebagaimana halaju kenderaan
bertambah, disebabkan oleh rangsangan daripada kelajuan enjin. Halaju kenderaan yang
tertinggi juga menghasilkan puncak respon pada frekuensi di antara 50 – 100 Hz dan
200 – 250 Hz. Hasil itu juga menunjukkan yang jalan yang berbonggol memberikan
rangsangan yang tinggi kepada jisim belakang sistem suspensi belakang berdasarkan
nilai punca kuasa dua pecutan. Jalan yang tidak berturap memberikan puncak respon
yang tertinggi dalam frekuensi 50 – 100 Hz. Seterusnya, hasil analisis yang diperoleh
menunjukkan bahawa halaju yang malar pada cara pemanduan di bulatan memberikan
nilai punca kuasa dua pecutan yang tinggi dan puncak respon yang tinggi kepada jisim
belakang sistem suspensi.
viii
TABLE OF CONTENTS
Page
SUPERVISOR’S DECLARATION ii
STUDENT’S DECLARATION iii
ACKNOWLEDGEMENTS v
ABSTRACT vi
ABSTRAK vii
TABLE OF CONTENTS viii
LIST OF TABLES xi
LIST OF FIGURES xii
LIST OF SYMBOLS xiv
LIST OF ABBREVIATIONS xv
CHAPTER 1 INTRODUCTION
1.1 Project Background 1
1.2 Problem Statement 2
1.3 Project Objectives 3
1.4 Project Scopes 3
1.5 Hypothesis 3
1.6 Project Flowchart 4
CHAPTER 2 LITERATURE REVIEW
2.1 Background Theories 5
2.1.1 Vehicle Axis System 5
2.1.2 Terminologies 6
2.1.3 Role of Vehicle Suspension 6
2.2 Ride Quality 7
2.2.1 Ride Comfort Assessment 8
2.3 Suspension System Model 14
2.3.1 Quarter Car Model 14
ix
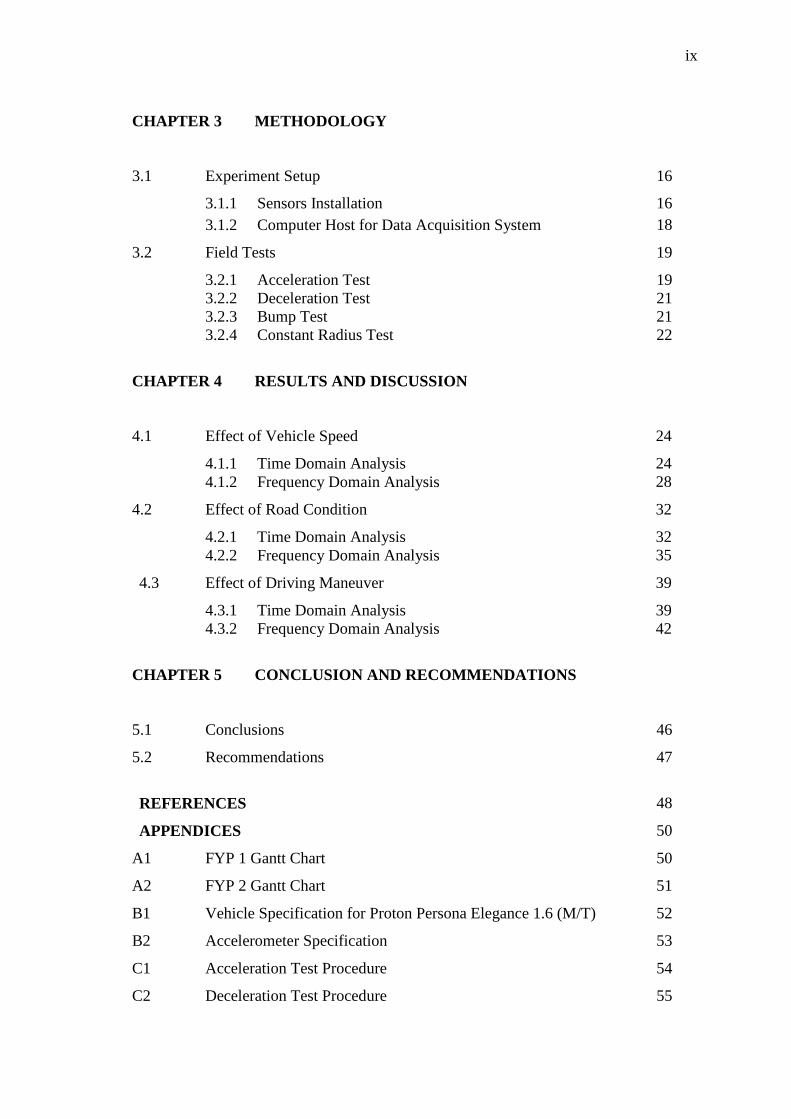
CHAPTER 3 METHODOLOGY
3.1 Experiment Setup 16
3.1.1 Sensors Installation 16
3.1.2 Computer Host for Data Acquisition System 18
3.2 Field Tests 19
3.2.1 Acceleration Test 19
3.2.2 Deceleration Test 21
3.2.3 Bump Test 21
3.2.4 Constant Radius Test 22
CHAPTER 4 RESULTS AND DISCUSSION
4.1 Effect of Vehicle Speed 24
4.1.1 Time Domain Analysis 24
4.1.2 Frequency Domain Analysis 28
4.2 Effect of Road Condition 32
4.2.1 Time Domain Analysis 32
4.2.2 Frequency Domain Analysis 35
4.3 Effect of Driving Maneuver 39
4.3.1 Time Domain Analysis 39
4.3.2 Frequency Domain Analysis 42
CHAPTER 5 CONCLUSION AND RECOMMENDATIONS
5.1 Conclusions 46
5.2 Recommendations 47
REFERENCES 48
APPENDICES 50
A1 FYP 1 Gantt Chart 50
A2 FYP 2 Gantt Chart 51
B1 Vehicle Specification for Proton Persona Elegance 1.6 (M/T) 52
B2 Accelerometer Specification 53
C1 Acceleration Test Procedure 54
C2 Deceleration Test Procedure 55
x
C3 Pitch Mode Bump Test Procedure 56
C4 Constant Radius Test Procedure 57
xi
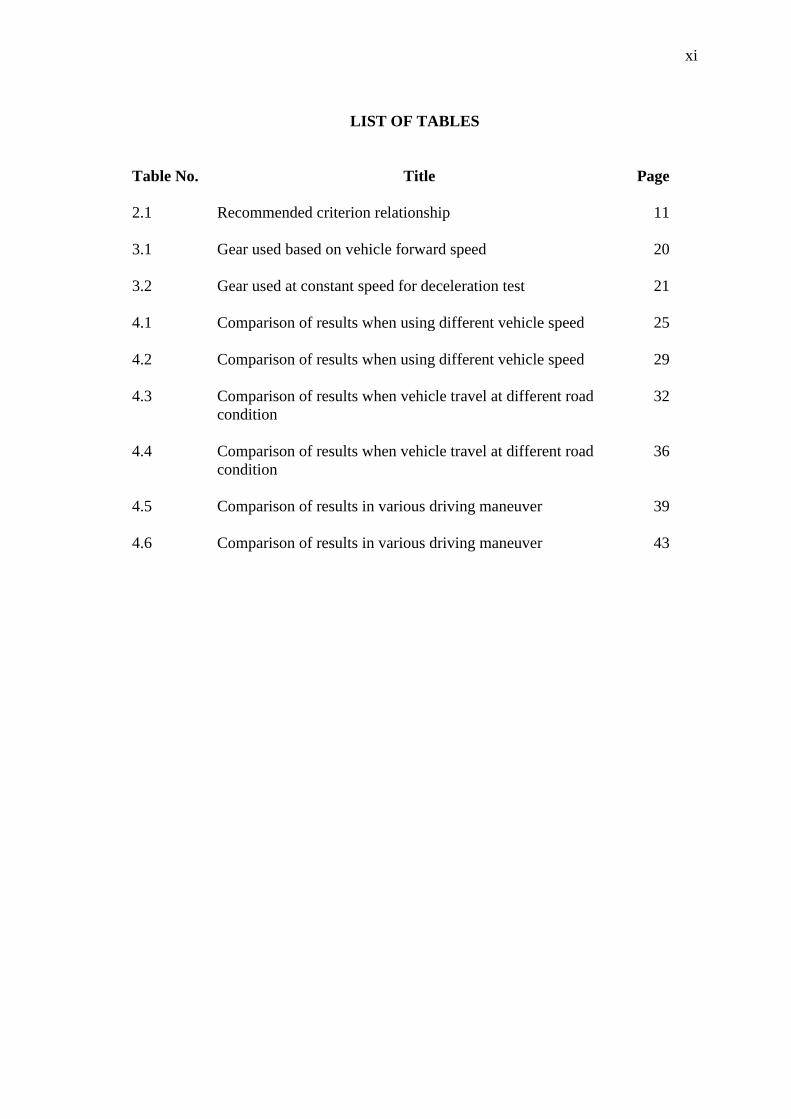
LIST OF TABLES
Table No. Title Page
2.1 Recommended criterion relationship 11
3.1 Gear used based on vehicle forward speed 20
3.2 Gear used at constant speed for deceleration test 21
4.1 Comparison of results when using different vehicle speed 25
4.2 Comparison of results when using different vehicle speed 29
4.3 Comparison of results when vehicle travel at different road
condition
32
4.4 Comparison of results when vehicle travel at different road
condition
36
4.5 Comparison of results in various driving maneuver 39
4.6 Comparison of results in various driving maneuver 43
xii
LIST OF FIGURES
Figure No. Title Page
2.1 SAE vehicle axis system 5
2.2 The ride dynamic system 8
2.3 Human tolerance limits for vertical vibration 9
2.4 Subjective response of the human body to vibration mode 10
2.5 Human reaction to vertical vibration 11
2.6 Quarter car model with two degree of freedom 14
2.7 Two degree of freedom half vehicle model 15
3.1 UMP Test vehicle 16
3.2 Accelerometer installation on rear suspension 17
3.3 Displacement transducer installation 18
3.4 DEWESoft display screen 19
3.5 Paved road selected for acceleration test 20
3.6 Unpaved road selected for acceleration test 20
3.7 A layout of braking point during deceleration test 21
3.8 A layout of two bumps during bump test 22
3.9 A picture of the bump 22
3.10 Roundabout for constant radius test 23
4.1 Graph of rear left unsprung mass acceleration vs. time based
on different vehicle speed
26
4.2 Graph of rear right unsprung mass acceleration vs. time based
on different vehicle speed
27
4.3 Graph of suspension travel vs. time based on different vehicle
speed
28
xiii
4.4 Graph of rear left unsprung mass acceleration vs. frequency
based on different vehicle speed
30
4.5 Graph of rear right unsprung mass acceleration vs. frequency
based on different vehicle speed
31
4.6 Graph of rear left unsprung mass acceleration vs. frequency
based on different road condition
33
4.7 Graph of rear right unsprung mass acceleration vs. frequency
based on different road condition
34
4.8 Graph of suspension travel vs. time for (a) Paved road surface
based on different road condition
35
4.9 Graph of rear left unsprung mass acceleration vs. frequency
based on different road condition
37
4.10 Graph of rear right unsprung mass acceleration vs. frequency
based on different road condition
38
4.11 Graph of rear left unsprung mass acceleration vs. time based
on different driving maneuver
40
4.12 Graph of rear right unsprung mass acceleration vs. time based
on different driving maneuver
41
4.13 Graph of suspension travel vs. time based on different driving
maneuver
42
4.14 Graph of rear left unsprung mass acceleration vs. frequency
based on different driving maneuver
44
4.15 Graph of rear right unsprung mass acceleration vs. frequency
based on different driving maneuver
45
xiv
LIST OF SYMBOLS
C Pitch moment of inertia
Cs Damping stiffness
Fv Sprung weight
g Acceleration of gravity
Ks Spring stiffness
Ms Sprung mass
Mu Unsprung mass
u Road profile input
x Unsprung mass displacement
X Longitudinal
y Sprung mass displacement
Y Lateral
yra Displacement of road profile at front tire’s vehicle
yrp Displacement of road profile at rear tire’s vehicle
Z Vertical
ZG Center of gravity displacement
Zra Front unsprung mass displacement
Zrp Rear unsprung mass displacement
Zsa Body pitch displacement
Zsp Sprung mass displacement
xv
LIST OF ABBREVIATIONS
2D Two dimensional
CAN Controller Area Network
DAS Data acquisition system
DADS Database Application Development System
DOF Degree of freedom
FFT Fast Fourier transform
GPS Global Positioning System
ISO International Organization of Standardization
M/T Manual transmission
RMS Root mean square
SAE Society of Automotive Engineers
CHAPTER 1
INTRODUCTION
1.1 PROJECT BACKGROUND
A driver judges his vehicle based on subjective aspects. Vehicle dynamic
characteristics including ride and handling have a major impact on this evaluation.
For this reason, vehicle manufacturers have grown investments in order to improve
this vehicle dynamic behavior (Persegium, 2003). The perceived comfort level and ride
stability of a vehicle are the two of the most important factors in a vehicle‟s subjective
evaluation. There are many aspects of a vehicle that influence these two properties,
most importantly the primary suspension components, which isolate the frame of the
vehicle from the axle and the wheel assemblies. In the design of conventional primary
suspension system there is a tradeoff between the two quantities of ride comfort and
vehicle stability. A suspension may be optimized for handling performance, or it
may be optimized to isolate the occupants from road disturbances, but it cannot excel
at both. In practice, the performance of conventional vehicle suspensions is a
compromise between ride and handling (Kazemi, 2000; Tener, 2004). If a suspension
is designed to optimize the handling and stability of the vehicle, the passenger often
perceives the ride to be rough and uncomfortable. On the other hand, if the suspension
is designed to optimize the comfort level, the vehicle will be comfortable, but may
not be too stable during maneuvers.
Focusing on the aspect of ride comfort, the quality referred to as "ride comfort"
is affected by a variety of factors, including high frequency vibrations, body
booming, body roll and pitch, as well as the vertical spring action normally
associated with a smooth ride. If the vehicle is noisy, if it rolls excessively in turns,
2
or lurches and pitches during acceleration and braking, or if the body produces a
booming resonance, the passengers will experience an “ uncomfortable ride”.
While there have been many studies performed on the more advanced
suspension systems, such as the active or semi active suspension, this study will
focus only on the passive suspension system. One of the reasons is that in this study,
the analysis performed is on an existing vehicle that uses a passive suspension system.
1.2 PROBLEM STATEMENT
Suspension system design is a challenging task for the automobile designers in
view of multiple control parameters, complex objectives and disturbances. The roles of
a suspension system are to support the vehicle weight, to isolate the vehicle body from
road disturbances, and to maintain the traction force between the tire and the road
surface. For vehicle suspension system design, it is always challenging to maintain
simultaneously a high standard of ride, handling, and body attitude control under all
driving conditions. Because of that, nowadays many types of suspension system has
been designed and developed for vehicles, in general known as passive suspension
system, semi active suspension system and active suspension system.
Each of the type of suspension has different advantages and disadvantages.
Passive vibration control involves an inherent compromise between low-frequency and
high-frequency vibration isolation. Passive suspension system consists of an energy
dissipating element, which is damper and an energy-storing element, which is spring.
Since these two elements cannot add energy to the system, this kind of suspension is
called passive.
Passive suspension systems are subject to various tradeoffs when they are
excited across a large frequency bandwidth. Compared with passive control, active and
semi active control can improve the performance over the wide range of frequencies.
The problems stem from the wide range of operating conditions created by varying road
conditions, vehicle speed and driving maneuver. Based on this kind of investigation, the
3
significant of the study is to address the characteristic and performance of the rear
suspension system in various road conditions and driving maneuver.
1.3 PROJECT OBJECTIVES
The main objectives of this project:
(i) To perform on-road testing using test car data acquisition system and data
collection for rear suspension system;
(ii) To analyze the results of vibration of passenger car rear suspension under
various road condition and driving maneuver.
1.4 PROJECT SCOPES
This project is focusing on vibration analysis of passenger car rear suspension
system under various road conditions and driving maneuver. This focus area is done
based on the following aspects:
(i) Literature review on passive suspension system.
(ii) Experimental preparation on test car.
(iii) Data Acquisition System setup for measurement process purpose.
(iv) On-road test drive for rear suspension data collection.
(v) Vibration analysis based on variations of vehicle speed, road condition
and driving maneuver.
(vi) Data and analysis on acceleration response and suspension displacement
of rear suspension system, and vehicle body acceleration response.
(vii) Final report preparation.
1.5 HYPOTHESIS
As the vehicle speed increase, the vibration of rear unsprung mass increase.
Unpaved road surfaces give high excitation to rear unsprung mass because of the
unevenness and roughness of the road surfaces.
4
1.6 PROJECT FLOWCHART
Yes
Yes
Start
Literature review
Sensors installation and
Data Acquisition System
setup
Preparing test
procedure
System
operation
On-road testing
Data collection
Perform analysis
Validation
Report preparation
End
No
No
5
CHAPTER 2
LITERATURE REVIEW
2.1 BACKGROUND THEORIES
2.1.1 Vehicle Axis System
The vehicle motions are defined with reference to a right-hand orthogonal
coordinate system which originates at the centre of gravity (CG) and travels with the
vehicle. By SAE convention, as shown in Figure 2.1, the coordinates are:
Figure 2.1: SAE vehicle axis system
Source: Gillespie (1992)
6
2.1.2 Terminologies
In this section, some terminologies related to the study will be listed out. The
terminologies were taken from Vehicle Dynamics Terminology, SAE J670e.
(i) Degree of Freedom – the sum total of all ways in which the masses of
the system can be independently displaced from their respective
equilibrium positions.
(ii) Sprung Weight – all the weight which is supported by the suspension,
including portions of the weight of the suspension.
(iii) Unsprung Weight – all weight which is not carried by the suspension
system, but is supported directly by the tire or wheel, and considered
to move with it.
(iv) Unsprung Mass – the equivalent masses which reproduce the inertia
forces produced by the motions of the corresponding unsprung parts.
(v) Ride – the low frequency (up to 5Hz) of the sprung mass as a rigid body.
(vi) Vertical (bounce) – the translational component of ride vibration of the
sprung mass in the direction of the vehicle z-axis.
(vii) Pitch – the angular component of the ride vibrations of the sprung
mass about the vehicle y-axis.
(viii) Roll – the angular component of the ride vibrations of the sprung mass
about the vehicle x-axis.
2.1.3 Role of Vehicle Suspension
From the understanding of ride quality aspects, one might hypothesize that
the goal should be to eliminate all vibrations in a vehicle. Even though this will
never be possible in a motor vehicle, it does give direction to development effort
(Gillespie, 1992). The principle requirements of a vehicle suspension are (Gillespie,
1992):
(i) To provide good ride and handling performance – this require the
suspension to have vertical compliance providing chassis isolation and
7
ensuring that the wheels follow the road profile with very little tire
load fluctuation.
(ii) To ensure that steering control is maintained during maneuvering –
this requires the wheels to be maintained in the proper positional
attitude with respect to the road surface.
(iii) To ensure that the vehicle responds favorably to control forces
produced by the tires as a result of longitudinal braking and
accelerating forces, lateral cornering forces and braking and
accelerating torques – this requires the suspension geometry to be
designed to resist squat, dive and roll of the vehicle body.
(iv) To provide isolation from high frequency vibration arising from tire
excitation – this requires appropriate isolation in the suspension joints
to prevent the transmission of „road noise‟ to the vehicle body.
Thus, the primary functions of a suspension system are to (Gillespie, 1992):
(i) Provide vertical compliance so the wheels can follow the uneven road,
isolating the chassis from roughness in the road.
(ii) Maintain the wheels in the proper steer and camber attitudes to the
road surface.
(iii) React to the control forces produced by the tires – longitudinal
(acceleration and braking) forces, lateral (cornering) forces, and
braking and driving torques.
(iv) Resist roll of the chassis.
(v) Keep the tires in contact with the road with minimal load vibrations.
2.2 RIDE QUALITY
The vibration environment is one of the important criteria by which people
judge the design and construction “quality” of the car. Being a judgment, it is
subjective by nature, from which arises one of the greatest difficulties in developing
objective engineering methods for dealing with ride as a performance mode of the
vehicle. In understanding of the ride behavior, the overall dynamic system can be
8
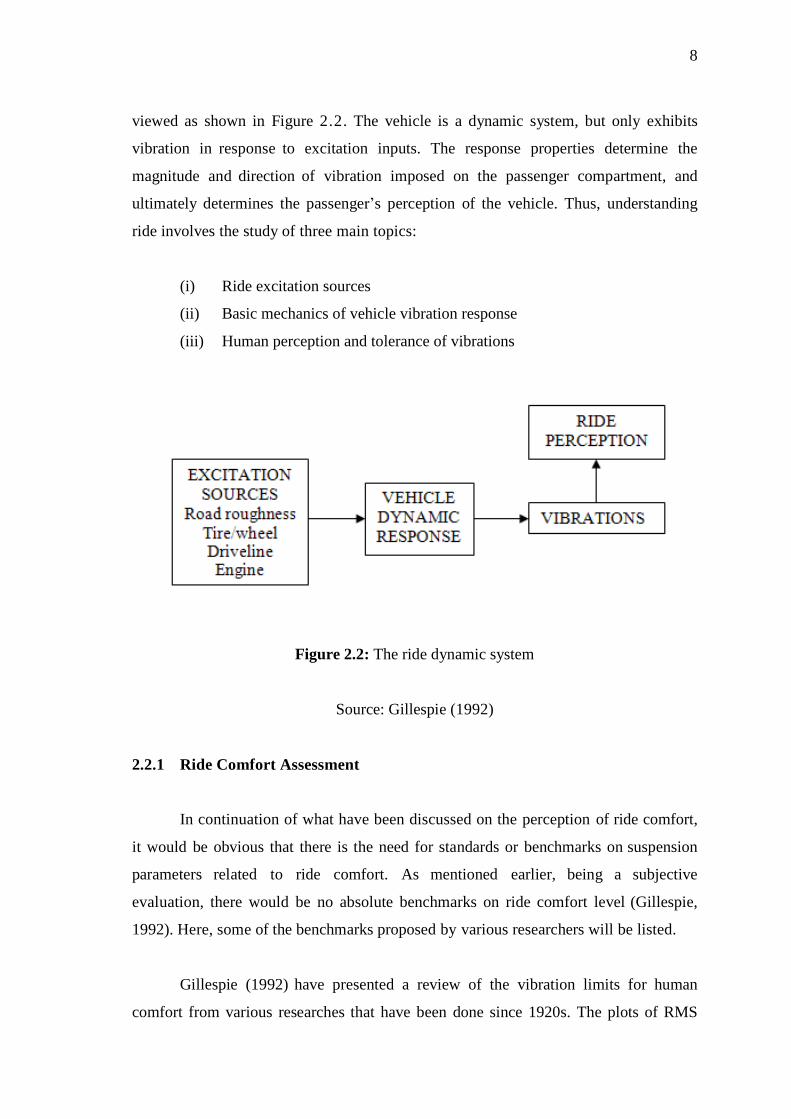
viewed as shown in Figure 2.2. The vehicle is a dynamic system, but only exhibits
vibration in response to excitation inputs. The response properties determine the
magnitude and direction of vibration imposed on the passenger compartment, and
ultimately determines the passenger‟s perception of the vehicle. Thus, understanding
ride involves the study of three main topics:
(i) Ride excitation sources
(ii) Basic mechanics of vehicle vibration response
(iii) Human perception and tolerance of vibrations
Figure 2.2: The ride dynamic system
Source: Gillespie (1992)
2.2.1 Ride Comfort Assessment
In continuation of what have been discussed on the perception of ride comfort,
it would be obvious that there is the need for standards or benchmarks on suspension
parameters related to ride comfort. As mentioned earlier, being a subjective
evaluation, there would be no absolute benchmarks on ride comfort level (Gillespie,
1992). Here, some of the benchmarks proposed by various researchers will be listed.
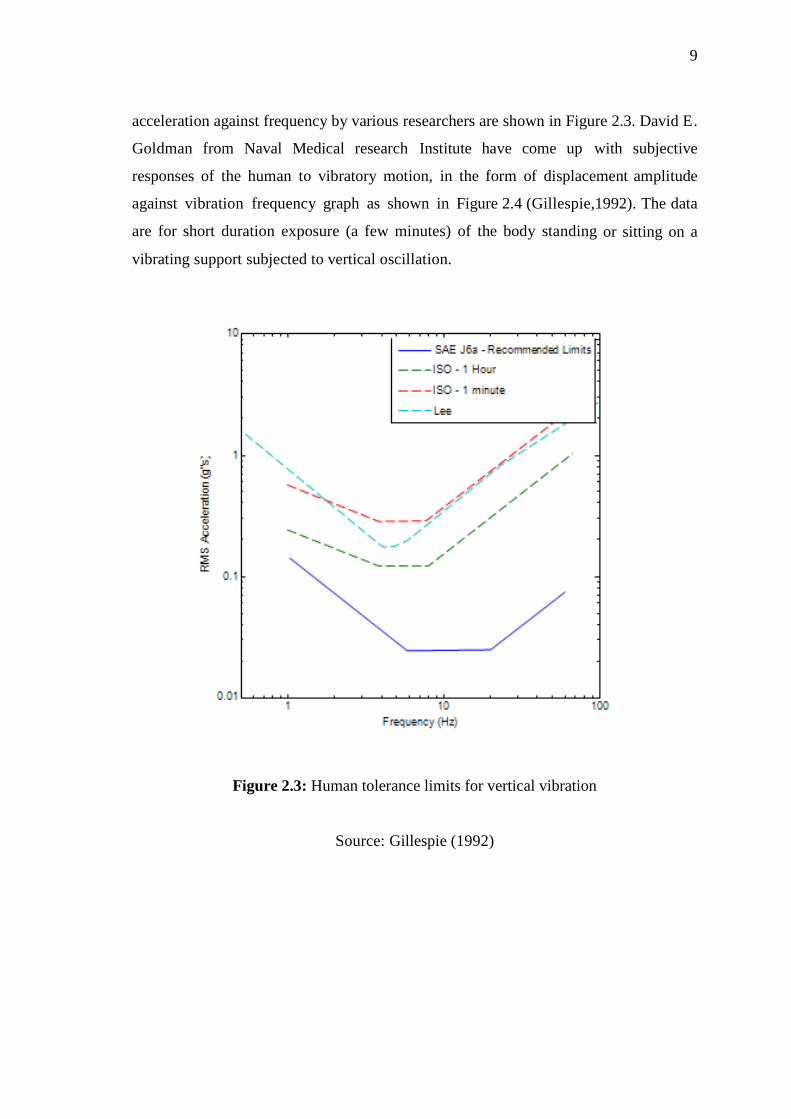
Gillespie (1992) have presented a review of the vibration limits for human
comfort from various researches that have been done since 1920s. The plots of RMS
9
acceleration against frequency by various researchers are shown in Figure 2.3. David E.
Goldman from Naval Medical research Institute have come up with subjective
responses of the human to vibratory motion, in the form of displacement amplitude
against vibration frequency graph as shown in Figure 2.4 (Gillespie,1992). The data
are for short duration exposure (a few minutes) of the body standing or sitting on a
vibrating support subjected to vertical oscillation.
Figure 2.3: Human tolerance limits for vertical vibration
Source: Gillespie (1992)
10
Figure 2.4: Subjective response of the human body to vibration mode
Source: Gillespie (1992)
R. N. Janeway from Janeway Engineering Co. has put forward a vertical
vibration limits for passenger comfort, shown in Figure 2.5 in the form of
displacement amplitude against vibration frequency graph (Gillespie, 1992). The three
broken lines define the sensation thresholds, either „strongly noticeable‟,
„uncomfortable‟, and „very uncomfortable‟. It was claimed that the recommended
limit, represented by the unbroken line in the graph, should be well within the comfort
range even for the most sensitive person. The recommended criterion consists of three
simple relationships, each covering a portion of the frequency range, as shown in Table