Vibration Sensing with Plastic Optical Fibres Hrishikesh Iyer 150260023 Ruchira Nandeshwar 174070018 Mekhala Paranjpe 160260008 I. I NTRODUCTION M ACHINE maintenance can be broadly categorised into two types - Reactive and Preventive maintenance(1). While the former indicates that action is only taken when the parts in question malfunction or experience damage, the latter is where periodic restoration is done. Each method has its own advantages - while the first helps in cutting costs at least during the lifetime of the machine, the second can help increase its lifetime itself. This is where vibration sensing and condition based monitoring can play a vital role in bringing the best of both worlds to the table. Condition based monitoring involves the continuous monitoring of various machine health parameters like vibration, temperature, sound etc. And under the vibration pattern of the machine surface is known to provide the earliest signs of incipient faults.(2) In our project, we have developed a non-contact vibration sensor with the help of low-cost plastic optical fibres and off-the-shelf components. Its non-contact feature allows us to potentially bypass mounting constraints and perturbations to the machines vibrations due to the sensor itself. This report outlines the working of the sensor, its experimental setup and our results. II. SETUP AND WORKING PRINCIPLE The setup consists of an LED whose light is incident directly upon the surface of a vibrating membrane. The reflected light is captured by a plastic optic fibre and is processed by a photodiode receiver circuit. Our choice of components are explained Section III. Theoretical Analysis The discussion in this section follows the work done in (3). The ratio of the power received at the photodiode circuit to the ratio of the power transmitted by the circuit containing the LED depends on several factors, including the plastic optic fibres used and more importantly, the distance of the vibrating membrane from a fixed position. The variation of this power as a function of distance of the membrane from the POF (d) is given in Figure 1 If d is small, the power can be approximated as a linear function of the distance: P r (d) P t ≈ R 0 + R 1 (d - d 0 ) where d 0 is mean value of d. Rewriting d as d = d 0 + s(t): P r (d) P t = R 0 + R 1 s(t) Figure 1. Power Ratio v/s Distance from the surface and hence the received signal v R (t) is v R (t)= Av L (t)(R 0 + R 1 s(t)) Where A incorporates factors like amplifier gain, POF atten- uation, membrane reflectivity etc. and v L is the LED drive voltage. On choosing the driving signal of the LED as a combination of DC and an AC sinusoid, that is v L = V 0 + V 1 sin(ω LED t) (1) and s(t) to be purely sinusoidal such that s(t)= A v sin(ω mem t) v R (t) can be written as v R (t)= AV 0 R 0 + AV 0 A v sin(ω mem t)+ AR 0 V 1 sin(ω LED t) +(A/2)R 1 A v V 1 cos((ω LED - ω mem )t) +(A/2)R 1 A v V 1 cos((ω LED + ω mem )t) (2) which corresponds to five peaks at ω = 0,ω mem ,ω LED ,ω LED - ω mem and ω LED + ω mem The peaks of interest are at ω LED - ω mem and ω LED + ω mem because they are proportional to the vibration amplitude. III. EXPERIMENTAL ASSEMBLY The block diagram of the whole test setup is shown below. We used a reflecting membrane vibrating at a monotone frequency to characterise the sensor. The membrane i.e alu- minium foil was wrapped around a speaker which played a monotone sound.
Transcript
Vibration Sensing with Plastic Optical FibresHrishikesh Iyer
150260023Ruchira Nandeshwar
174070018Mekhala Paranjpe
160260008
I. INTRODUCTION
MACHINE maintenance can be broadly categorised intotwo types - Reactive and Preventive maintenance(1).
While the former indicates that action is only taken whenthe parts in question malfunction or experience damage, thelatter is where periodic restoration is done. Each method hasits own advantages - while the first helps in cutting costs atleast during the lifetime of the machine, the second can helpincrease its lifetime itself. This is where vibration sensing andcondition based monitoring can play a vital role in bringing thebest of both worlds to the table. Condition based monitoringinvolves the continuous monitoring of various machine healthparameters like vibration, temperature, sound etc. And underthe vibration pattern of the machine surface is known toprovide the earliest signs of incipient faults.(2)
In our project, we have developed a non-contact vibrationsensor with the help of low-cost plastic optical fibres andoff-the-shelf components. Its non-contact feature allows us topotentially bypass mounting constraints and perturbations tothe machines vibrations due to the sensor itself. This reportoutlines the working of the sensor, its experimental setup andour results.
II. SETUP AND WORKING PRINCIPLE
The setup consists of an LED whose light is incident directlyupon the surface of a vibrating membrane. The reflected lightis captured by a plastic optic fibre and is processed by aphotodiode receiver circuit.
Our choice of components are explained Section III.Theoretical Analysis The discussion in this section followsthe work done in (3).
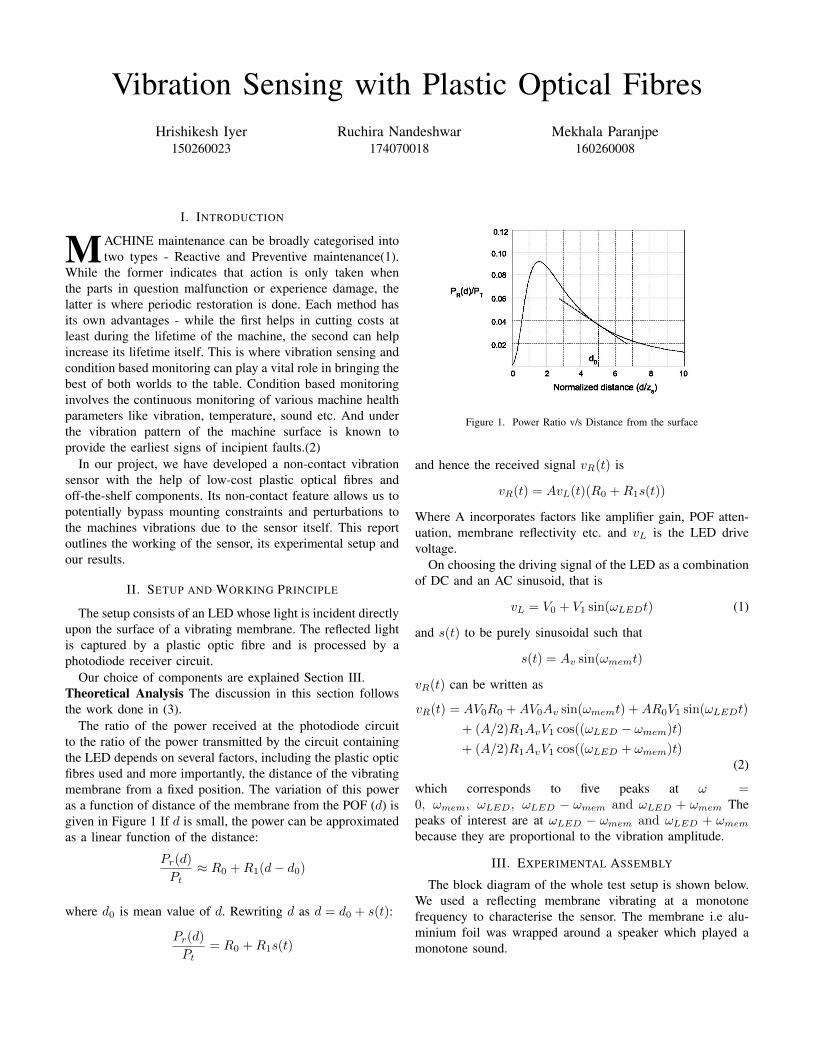
The ratio of the power received at the photodiode circuitto the ratio of the power transmitted by the circuit containingthe LED depends on several factors, including the plastic opticfibres used and more importantly, the distance of the vibratingmembrane from a fixed position. The variation of this poweras a function of distance of the membrane from the POF (d) isgiven in Figure 1 If d is small, the power can be approximatedas a linear function of the distance:
Pr(d)
Pt≈ R0 +R1(d− d0)
where d0 is mean value of d. Rewriting d as d = d0 + s(t):
Pr(d)
Pt= R0 +R1s(t)
Figure 1. Power Ratio v/s Distance from the surface
and hence the received signal vR(t) is
vR(t) = AvL(t)(R0 +R1s(t))
Where A incorporates factors like amplifier gain, POF atten-uation, membrane reflectivity etc. and vL is the LED drivevoltage.
On choosing the driving signal of the LED as a combinationof DC and an AC sinusoid, that is
vL = V0 + V1 sin(ωLEDt) (1)
and s(t) to be purely sinusoidal such that
s(t) = Av sin(ωmemt)
vR(t) can be written as
vR(t) = AV0R0 +AV0Av sin(ωmemt) +AR0V1 sin(ωLEDt)
+ (A/2)R1AvV1 cos((ωLED − ωmem)t)
+ (A/2)R1AvV1 cos((ωLED + ωmem)t)(2)
which corresponds to five peaks at ω =0, ωmem, ωLED, ωLED − ωmem and ωLED + ωmem Thepeaks of interest are at ωLED − ωmem and ωLED + ωmem
because they are proportional to the vibration amplitude.
III. EXPERIMENTAL ASSEMBLY
The block diagram of the whole test setup is shown below.We used a reflecting membrane vibrating at a monotonefrequency to characterise the sensor. The membrane i.e alu-minium foil was wrapped around a speaker which played amonotone sound.
Figure 2. Experimental Assembly
Figure 3. Picture of the LED, POF and Speaker setup
A. Transmitter
As shown in the Figure 3, the transmitter side has a superbright red led (3W) fixed on a table. This LED light is reflectedby the vibrating aluminium foil. This speaker was kept on adifferent table than the transmitter and receiver.The followingmeasures were taken to minimise vibration coupling betweenthe two tables:
• The diaphragm of the speaker was placed orthogonalto floor (which is the medium that couples vibrationsbetween the tables)
• The table for the LED/POF enclosure was very big incomparison to the enclosure ensuring very tiny amplitudeof oscillation locally around the enclosure.
The LED was modulated by a function generator (as perEquation 1 and the bluetooth speaker was driven using amobile tone generator app. These vibrations were sensed byPOF in terms of the light reflected by the foil. The super brightLED was modulated at ( frequency).
B. Receiver
The light reflected back from the vibrating foil is sensedby a Plastic Optical Fibre (POF) which is attached near theSuper Bright LED. Plastic optical fibers were chosen overconventional glass optical fibres because of their low cost,ease of coupling because of their large numerical apertureand flexibility (allows them to be inherently shock/vibrationproof)(3). Continuing with the setup, on the other end ofthe POF, there is a photodiode (SFH203) which converts thissensed light into current. With the help of a transimpedanceamplifier the current is amplified and converted to voltage.This converted voltage is sampled by an NI 6008 DAQ andprocessed in LabVIEW.
Figure 4. Photodiode receiver and Transimpedance Amplifier
Figure 5. LabVIEW program to compute the FFT of an incoming signal
The LED was chosen to be red because the POF hasbeen optimised for minimum attenuation at red and eventhe photodiode has acceptable sensitivity at the 650nm redwavelength.
IV. SIGNAL PROCESSING
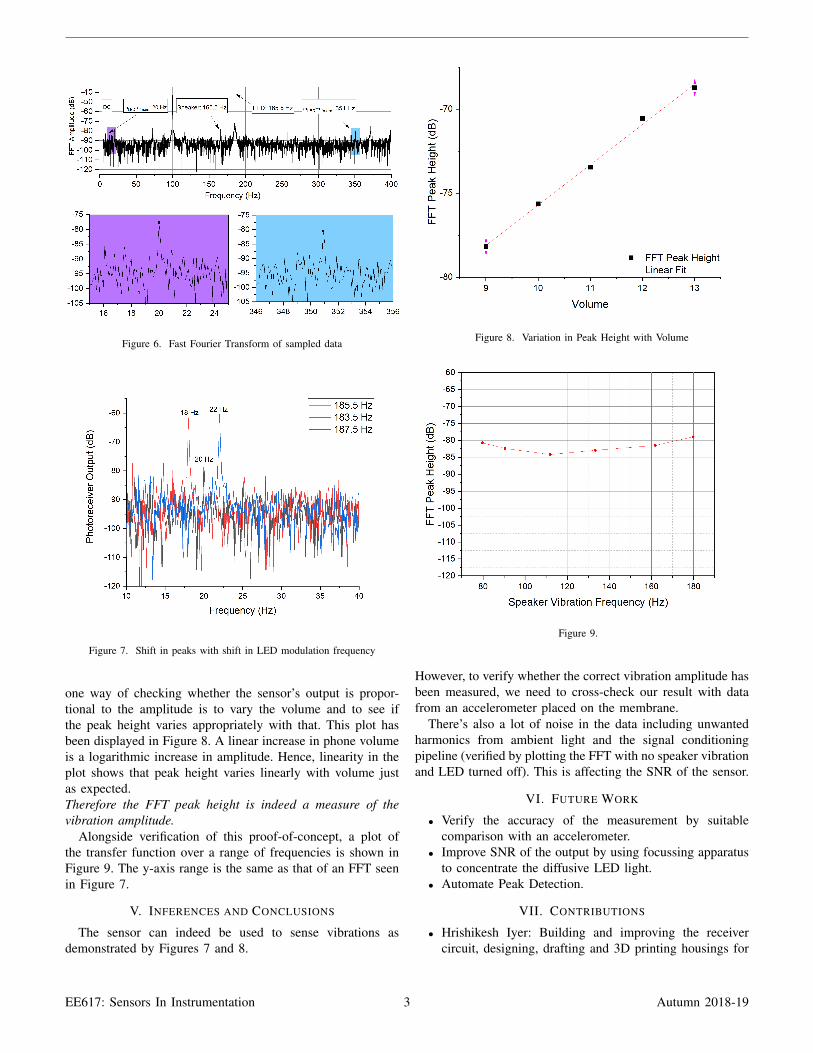
A LabVIEW program (Refer: Figure 5) has been written toinitialise the DAQ board and to process the data collected byit. The output of the program is the FFT of the input data afteraveraging over 20 sets of 10 secs of data. One such FFT hasbeen shown in Figure 6.
In totality, five peaks are expected as discussed in SectionII. These peaks have been shown in the Figure 6.
We want to make sure that these peaks that we are observingactually correspond to the vibration of the membrane. To dothat, a consistency check was performed on the ωLED−ωmem
peak. With the speaker frequency fixed, the LED modulationfrequency was changed by ±2 Hz. Corresponding to thischange we expect the peak in the FFT to shift by ±2 Hz aswell. This has accordingly been observed as shown in Figure7.
While there are indeed 5 peaks as expected, we want tobe able to reliably extract the amplitude of vibration as well.Given that we can’t measure the exact physical amplitude ofvibration without attaching something like an accelerometer,
EE617: Sensors In Instrumentation 2 Autumn 2018-19
Figure 6. Fast Fourier Transform of sampled data
Figure 7. Shift in peaks with shift in LED modulation frequency
one way of checking whether the sensor’s output is propor-tional to the amplitude is to vary the volume and to see ifthe peak height varies appropriately with that. This plot hasbeen displayed in Figure 8. A linear increase in phone volumeis a logarithmic increase in amplitude. Hence, linearity in theplot shows that peak height varies linearly with volume justas expected.Therefore the FFT peak height is indeed a measure of thevibration amplitude.
Alongside verification of this proof-of-concept, a plot ofthe transfer function over a range of frequencies is shown inFigure 9. The y-axis range is the same as that of an FFT seenin Figure 7.
V. INFERENCES AND CONCLUSIONS
The sensor can indeed be used to sense vibrations asdemonstrated by Figures 7 and 8.
Figure 8. Variation in Peak Height with Volume
Figure 9.
However, to verify whether the correct vibration amplitude hasbeen measured, we need to cross-check our result with datafrom an accelerometer placed on the membrane.
There’s also a lot of noise in the data including unwantedharmonics from ambient light and the signal conditioningpipeline (verified by plotting the FFT with no speaker vibrationand LED turned off). This is affecting the SNR of the sensor.
VI. FUTURE WORK
• Verify the accuracy of the measurement by suitablecomparison with an accelerometer.
• Improve SNR of the output by using focussing apparatusto concentrate the diffusive LED light.
• Automate Peak Detection.
VII. CONTRIBUTIONS
• Hrishikesh Iyer: Building and improving the receivercircuit, designing, drafting and 3D printing housings for
EE617: Sensors In Instrumentation 3 Autumn 2018-19
various components (not used finally), loudspeaker circuitto drive a wired speaker (not used finally), experimentalassembly setup, LabVIEW pipeline and data acquisition,testing and characterisation, presentation, report.
• Ruchira Nandeshwar: Building and testing the receivercircuit, design of POF housing (not used finally), buildinga laser modulation circuit (not used finally), experimentalassembly setup, presentation report.
• Mekhala Paranjpe: Building the receiver circuit, designof POF housing (not used finally), loudspeaker circuit todrive a wired speaker (not used finally), plotting of FFTof a timeseries (not used finally), presentation, report.
REFERENCES
[1] B. A. Ellis and A. Byron, “Condition based maintenance,”The Jethro Project, vol. 10, pp. 1–5, 2008.
[2] R. B. Randall, “Vibration-based condition monitoring:Industrial, aerospace and automotive applications,” 2011.
[3] A. Buffa, G. Perrone, and A. Vallan, “A plastic opticalfiber sensor for vibration measurements,” in 2008 IEEE In-strumentation and Measurement Technology Conference,May 2008, pp. 1387–1391.
EE617: Sensors In Instrumentation 4 Autumn 2018-19