URS VIBRATION TESTING OF AN EPOXY-REPAIRED REINFORCED CONCRETE TEST STRUCTURE G. Norman Owen Ike O. Egbuonye Onder Kustu Roger E. Scholl prepared for the National Science Foundation Under Agreement CEE-7812714 and for the United States Department of Energy Under Contract DE-AC08-81NV10145 prepared by URS/John A Blume &Associates, Engineers 130 Jessie Street (at New Montgomery) San Francisco, California 94105 Any opinions, findings, conclusions or recommendations expressed in this publication are those of the author(s) and do not necessarily reflect the views of the National Science Foundation.
Transcript
URS
VIBRATION TESTING OF AN EPOXY-REPAIREDREINFORCED CONCRETE TEST STRUCTURE
G. Norman OwenIke O. EgbuonyeOnder KustuRoger E. Scholl
prepared for
the National Science FoundationUnder Agreement CEE-7812714and for the United States Department of EnergyUnder Contract DE-AC08-81NV10145
prepared by
URS/John A Blume &Associates, Engineers130 Jessie Street (at New Montgomery)San Francisco, California 94105
Any opinions, findings, conclusionsor recommendations expressed in thispublication are those of the author(s)and do not necessarily reflect the viewsof the National Science Foundation.
50272 '101REPORT DOCUMENTATION II. "E~RT NO.
PAGE I NSFjCEE-83210c. Title .nd Subtitle
Vibration Testing of An Epoxy-Repaired ReinforcedConcrete Test Structure
Results are presented of a study of a full-scale, four-story reinforced concretestructure that was damaged by forced vibration and repaired by the epoxy-injectionmethod. The structure was retested with low-amplitude vibrations, followed by forcedvibrations. The damage to the epoxy-repaired structure was similar to that sustainedby the original structure but the damage was less severe and the cracking was morewidely distributed.~ Findings reveal that, for low-amplitude motions, the epoxyrepaired structure was slightly less stiff than the original undamaged structure. Asthe amplitude of the structure's response increased, the difference between theepoxy-repaired structure and the original structure decreased. At large deflectionsassociated with severe damage, the epoxy-repaired structure was stiffer than theoriginal structure.
Pretest Condition of the Structure •••••Nondestruct ive Tests •••••••.•••••••••••••••••••Vibration Generator--Structure Interaction TestsDestruct i ve Test •.•.••..•.•••••.•.••..•••••..•••Postdestructive TestsData Collection and Storage
............
22
222324242929
ANALYSIS OF RESPONSE DATA
.........................UsingUsing
3232333440
RAP ProgramMeans
theOther
Data DigitizationData Sampl ing for AnalysisResponse Data AnalysisResponse Data Analysis
4.
RESULTS AND DISCUSSION OF DATA ANALYSIS5.Observed Damage .•••••••Structura1 Damping ••••••Mode ShapesModal PeriodsStiffness Degradation VersusBase Shear ••....•.•....Spectral Velocity
Drift
41
41465358626570
........................................the
the
6. MATHEMATICAL MODELING
Mathematical Models forComparison of Models andTheoretical Capacities
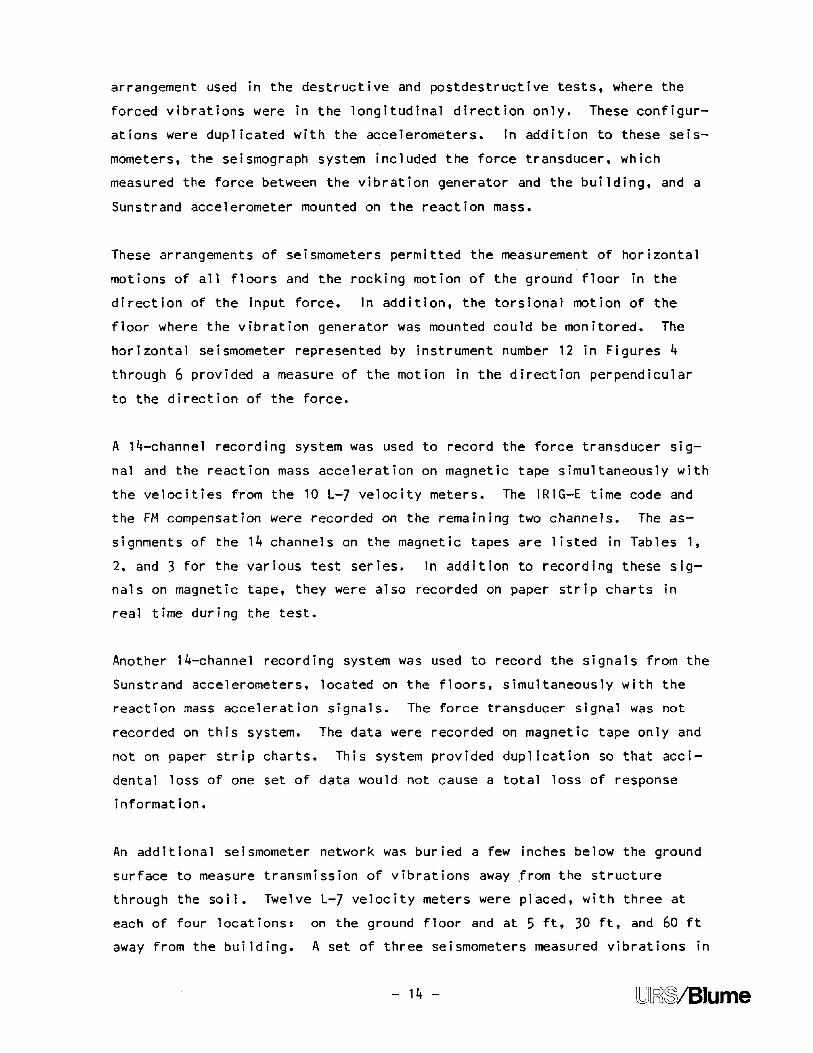
Recording Channels for Nondestructive Tests in theTransverse Direction ••.• ••••• •••••. ••••• •••••••••.•••••• •••••• ••• 15
2 Recording Channels for Nondestructive Tests in theLongitudinal Directional ••.••••••••••••••••••••••••••••••••••••.• 16
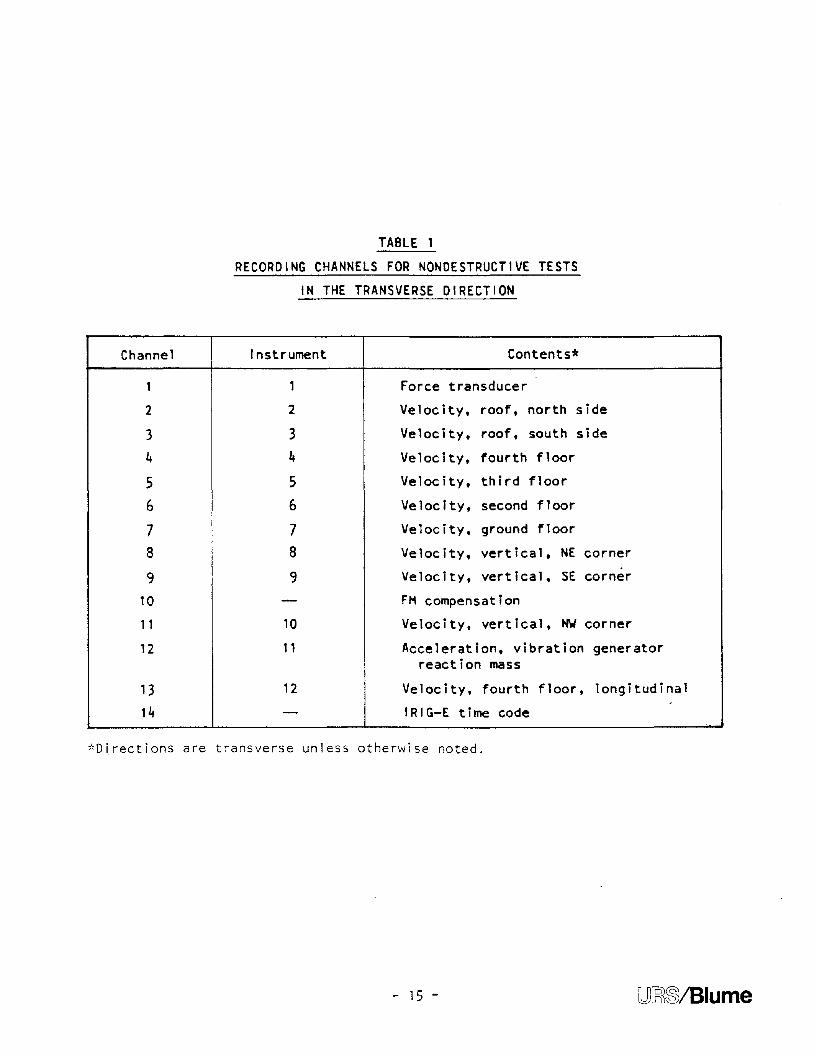
3 Recording Channels for Destructive and PostdestructiveTests ••..••••••••••••••••••••••••••••••••.••••••.••••••••••.••••• 17
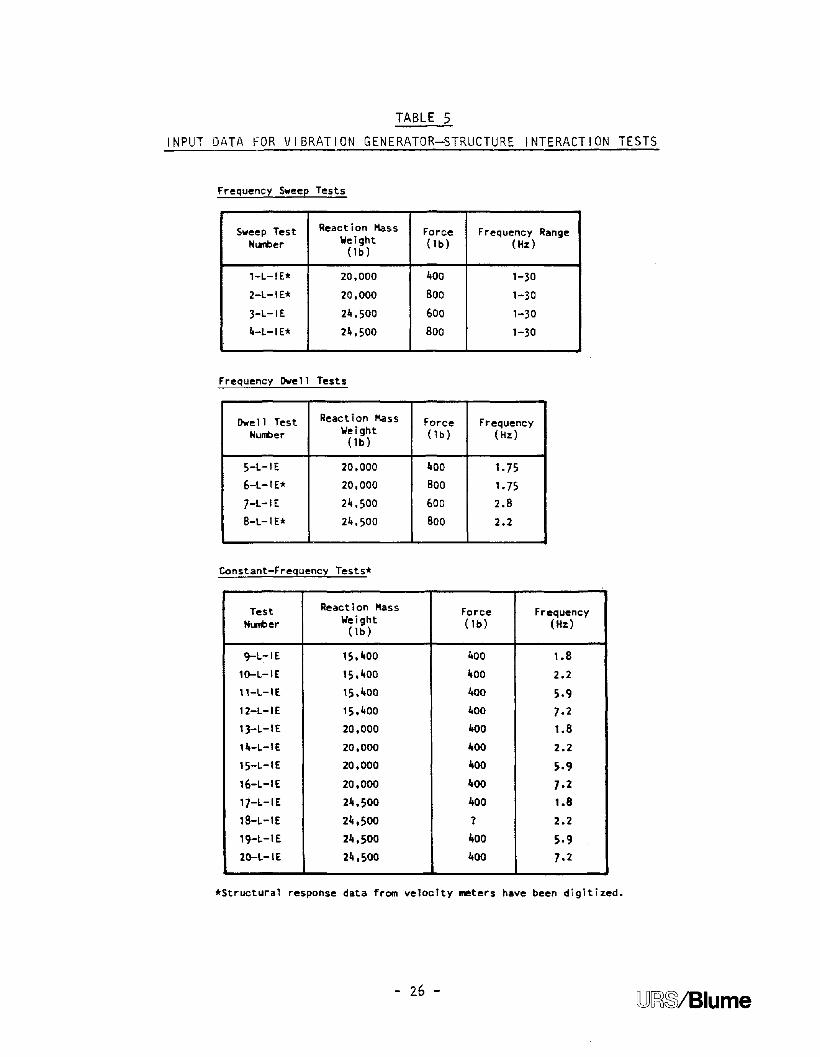
4 Input Data for Nondestructive Tests ••••••.•••••••••••••••••••.••• 255 Input Data for Vibration Generator--Structure
Interact ion Tests •.•••••••••••••••••••••.••••.••••••••••••••••••. 26
6 I nput Data for the Destruct i ve Test ••••••••••••••••••.••••••••••• 28
7 Input Data for the Postdestructive Test •••••••••••••••••••••••••• 30
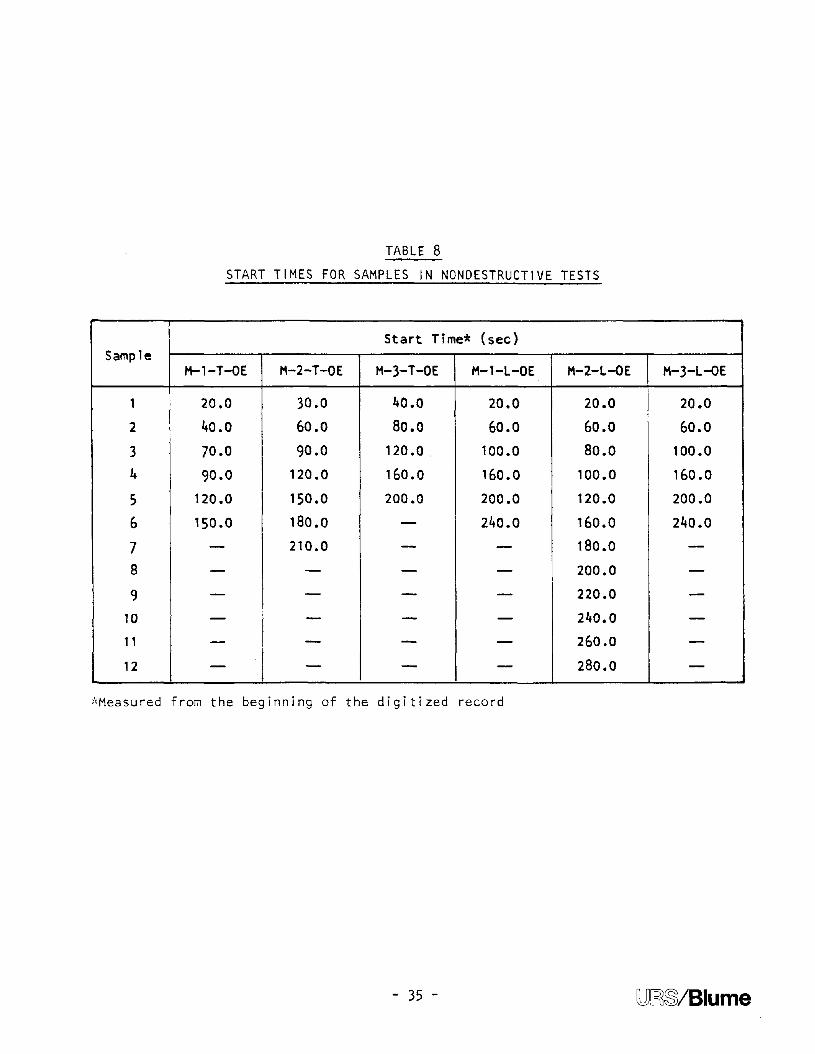
8 Start Times for Samples in Nondestructive Tests.................. 35
9 Start Times for Samples in Destructive andPostdestruct i ve Tests 36
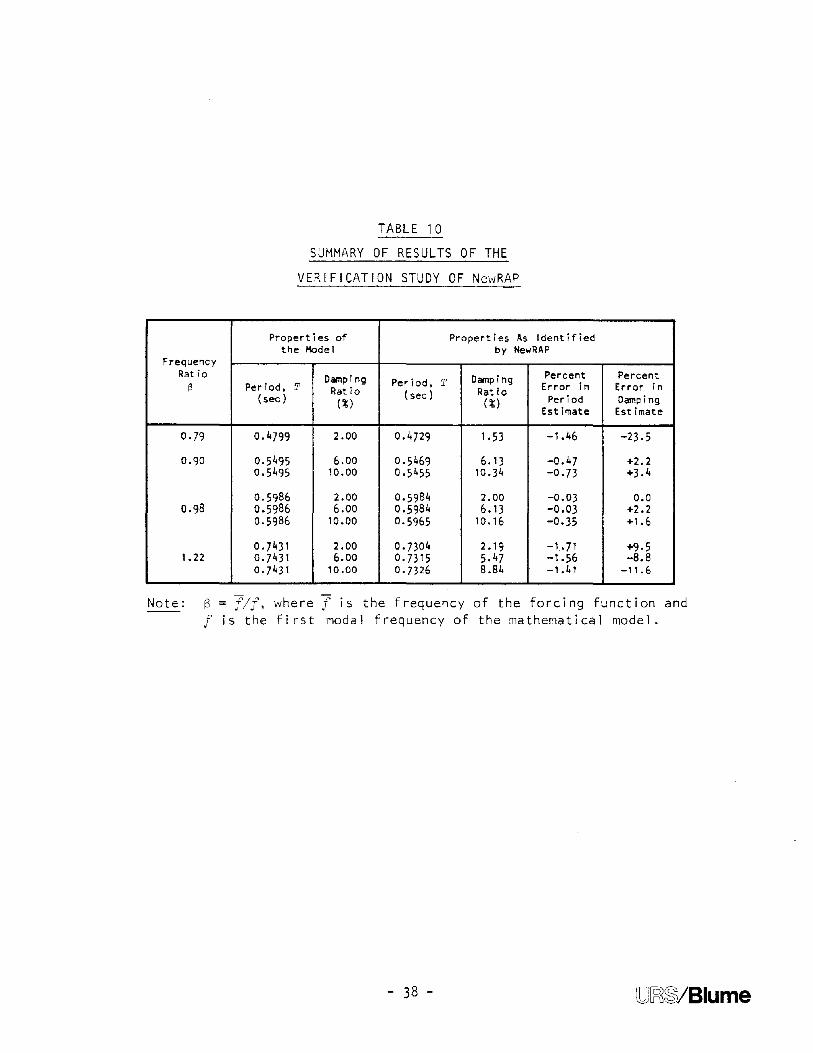
10 Summary of Results of the Verification Study of NewRAP ••••••••••• 38
11 Fundamental Periods and Relative Stiffnesses ofMathematical Models ••••••.•••• , .••.• I_I •••• •••• ••• ••••• ••••• •••••• 79
'2 Beam Moment Capac i ties •••••••.••••••••••••••••••••••••••••••••••• 81
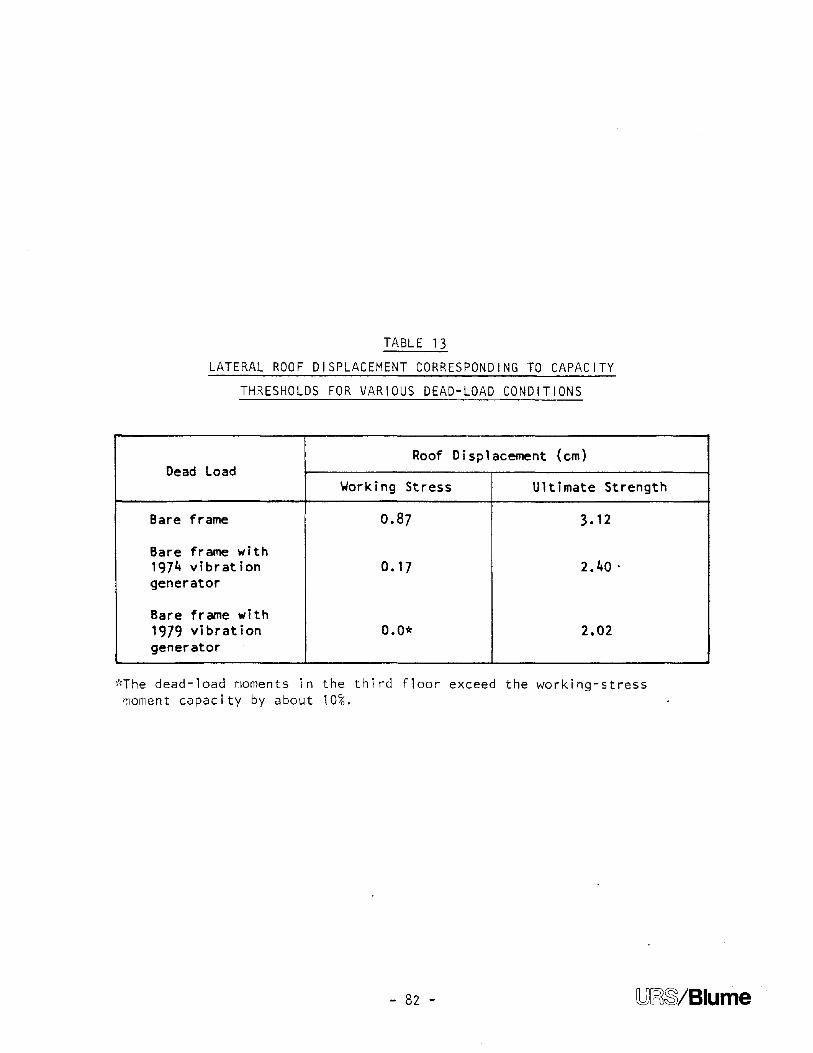
13 Lateral Roof Displacement Corresponding to CapacityThresholds for Various Dead-Load Conditions •••••••••••••••••••••• 82
FIGURES
Vibration Generator on the Third Floor of the TestStructure .•.•.•...••.•.••.•...•.•..••.••••.....•.•••..•.•.•.•••••
2
3
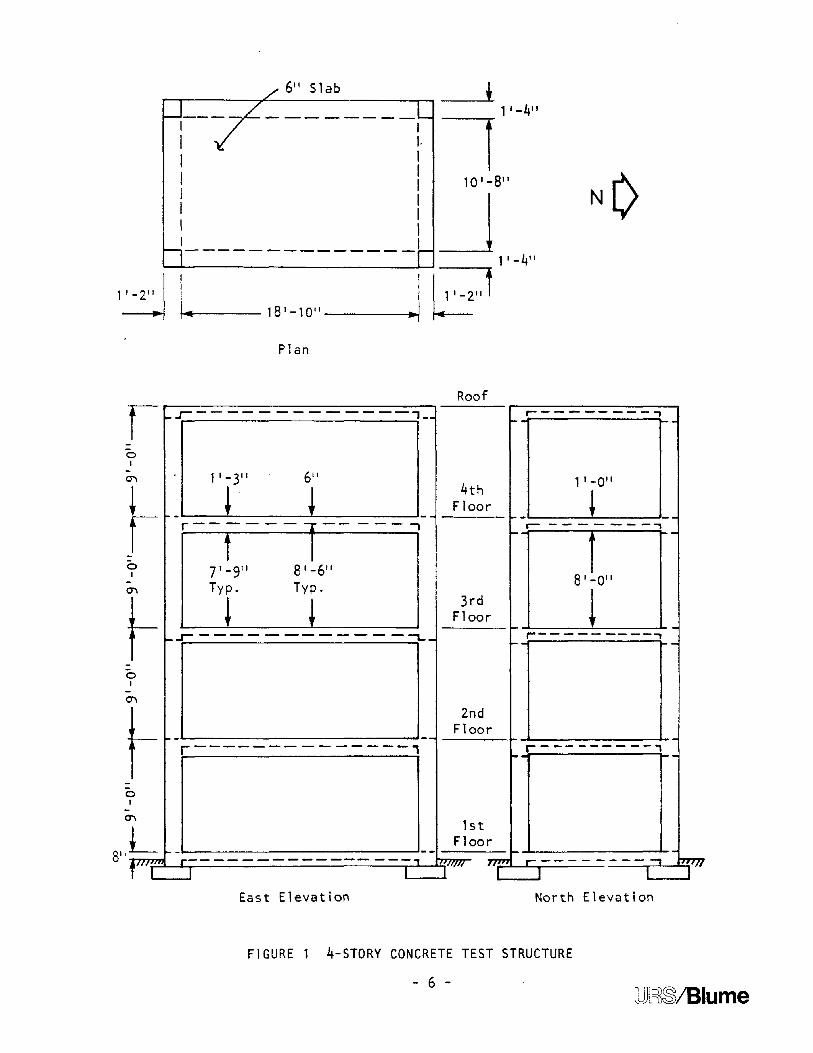
4-Story Concrete Test Structure
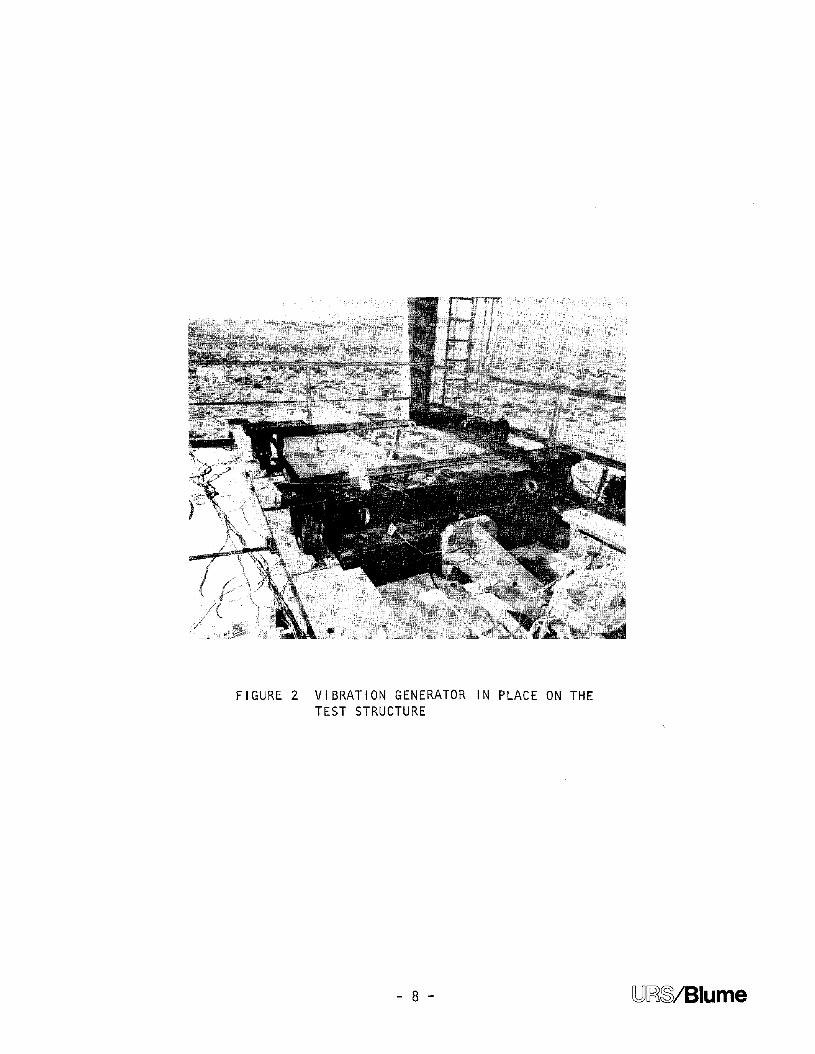
Vibration Generator in Place on the Test Structure ...............6
8
94
5
6
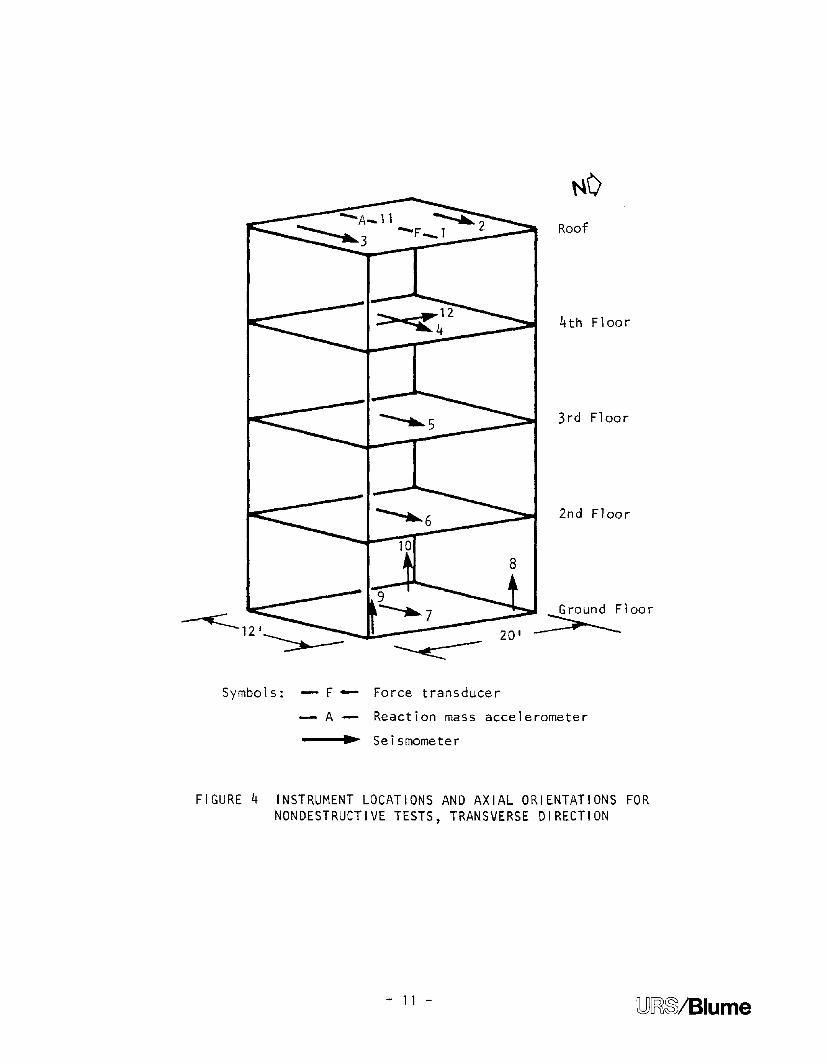
Instrument Locations and Axial Orientations forNondestructive Tests, Transverse Direction •••••••••••••.•••••••••
Instrument Locations and Axial Orientations forNondestructive Tests, Longitudinal Direction •••••••••••••••..••••
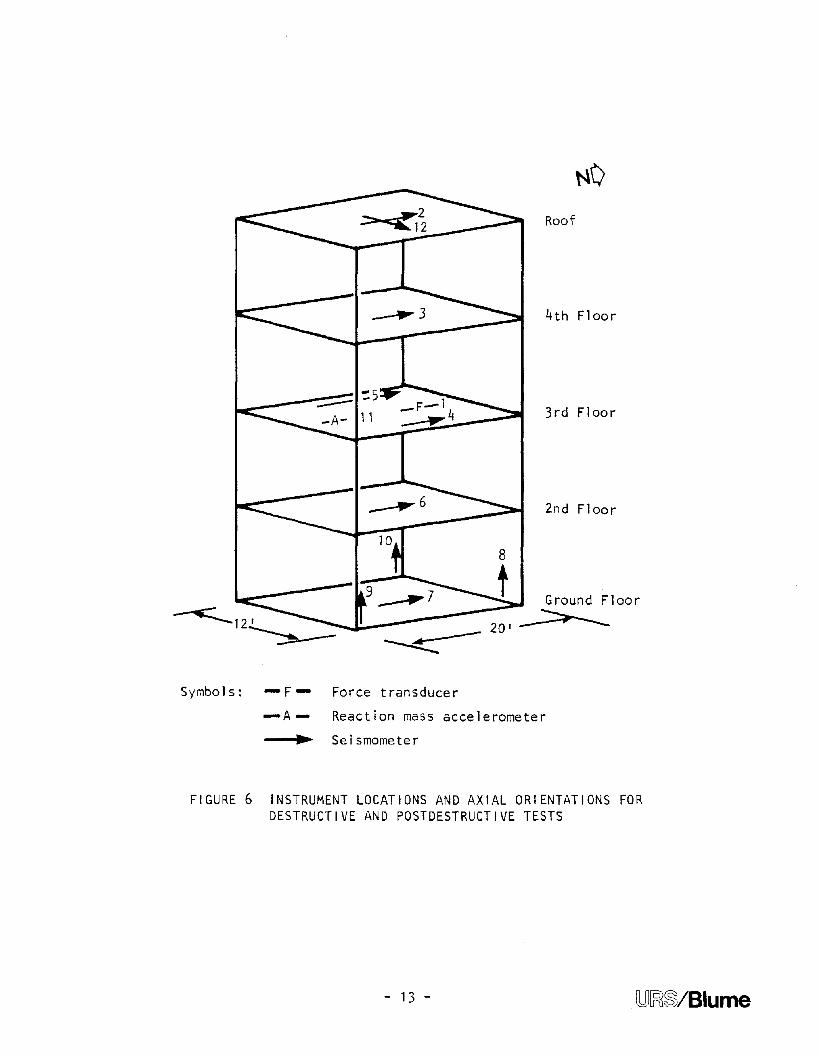
Instrument Locations and Axial Orientations forDestruct i ve and Postdestruct i ve Tests ••••••••••••••••••••••••••••
11
12
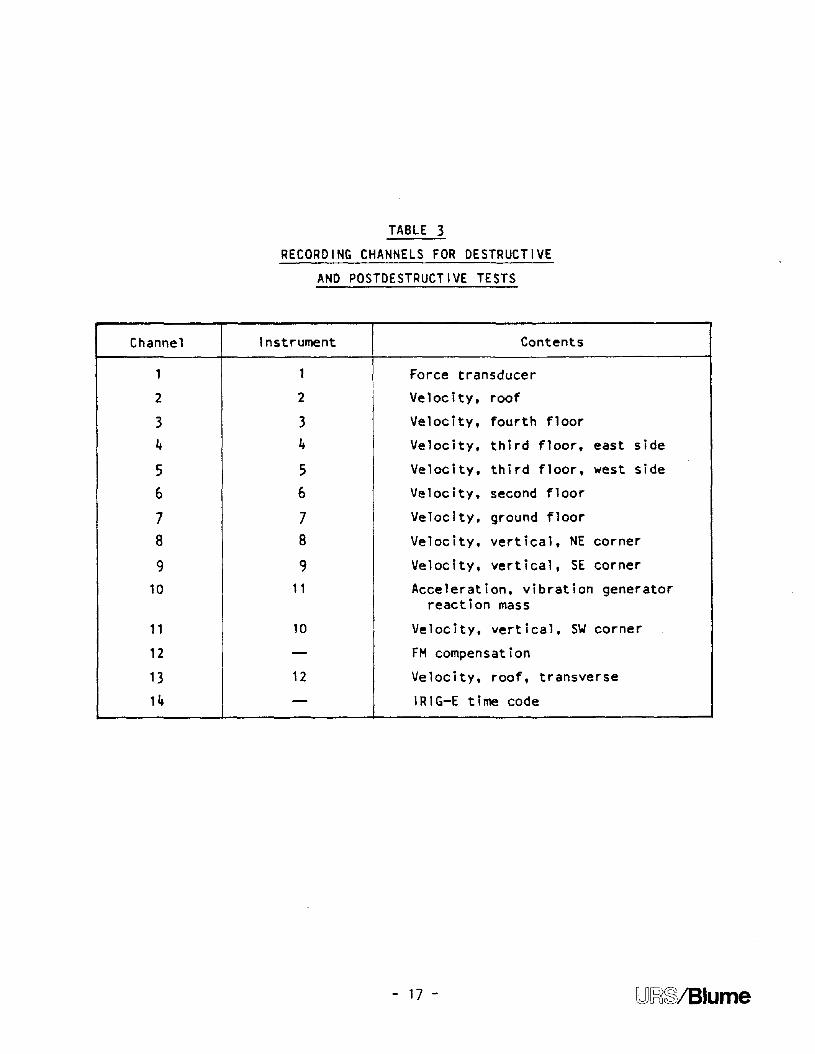
137 Ground Surface Instrumentation for Nondestructive Tests,
Transverse Direction •••••••••••••••••••• •••••••• ••• •••• •••••••••• 19
- iii [LjJ~~/Blume
CONTENTS (Continued)
8 Ground Surface Instrumentation for All Tests in theLongitudinal Direction ••••••••••••••••••.•••••••••••••••••••••• 20
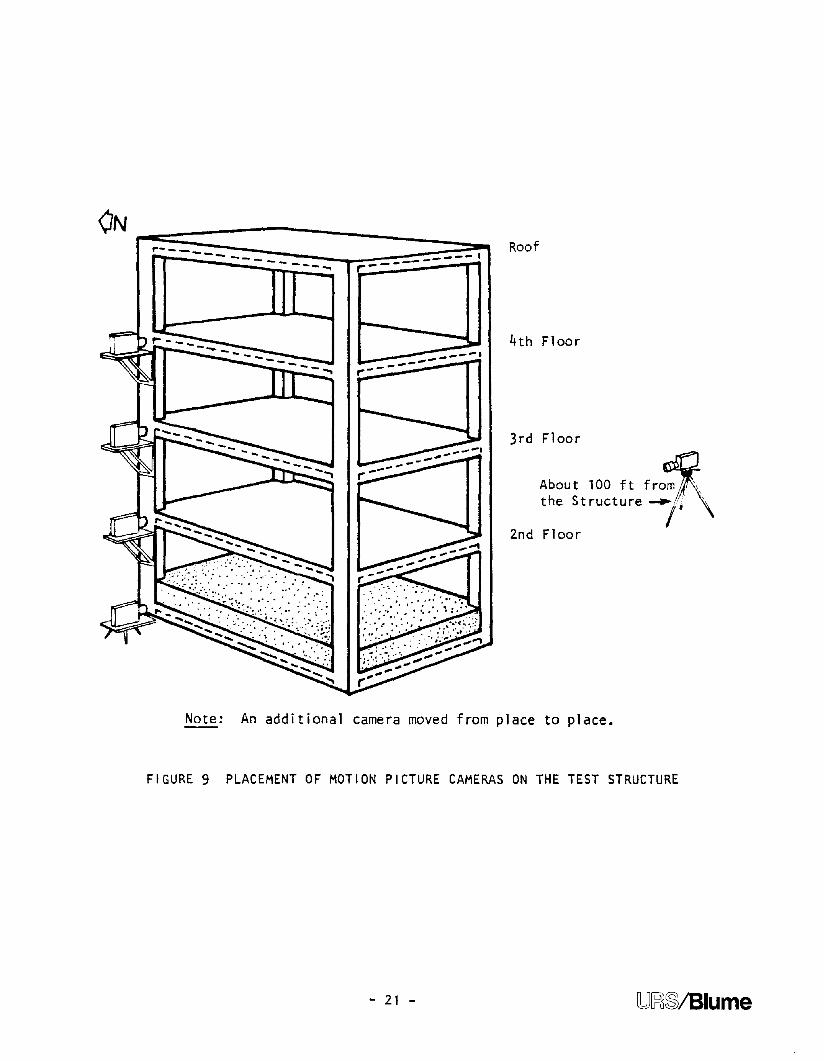
9 Placement of Motion Picture Cameras on the Test Structure ...... 21
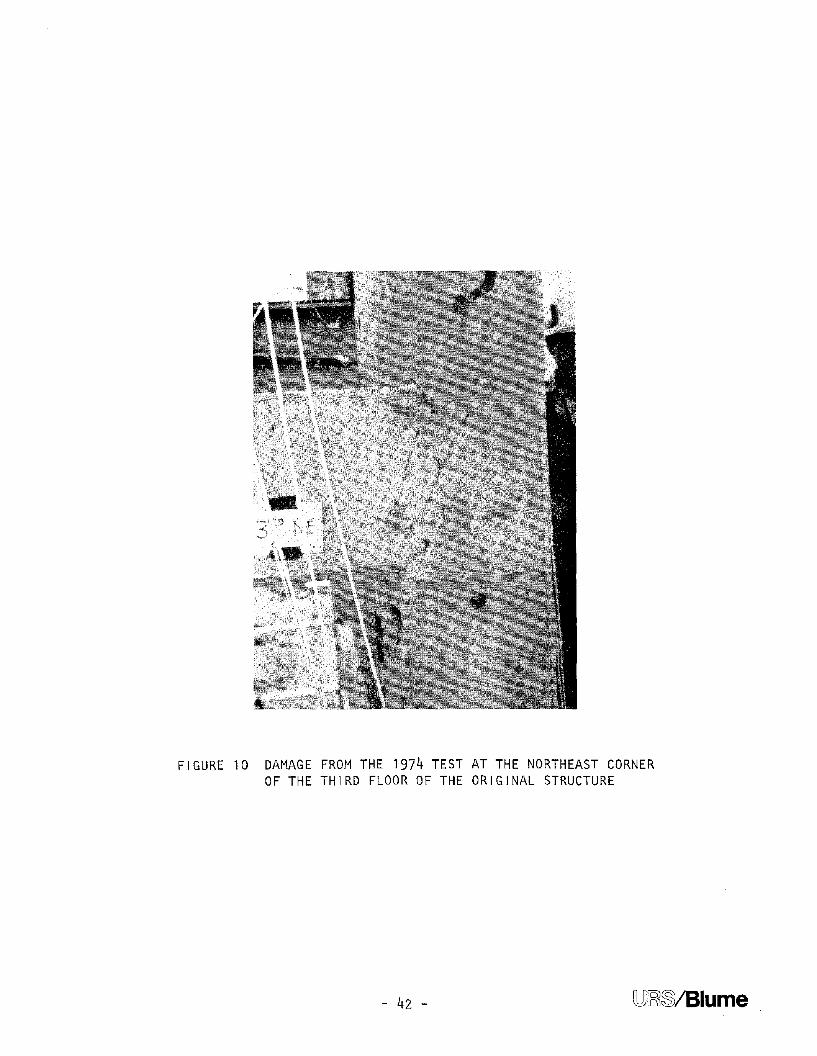
10 Damage from the 1974 Test at the Northeast Corner of theThird Floor of the Original Structure •••••••••••••••••••••••••• 42
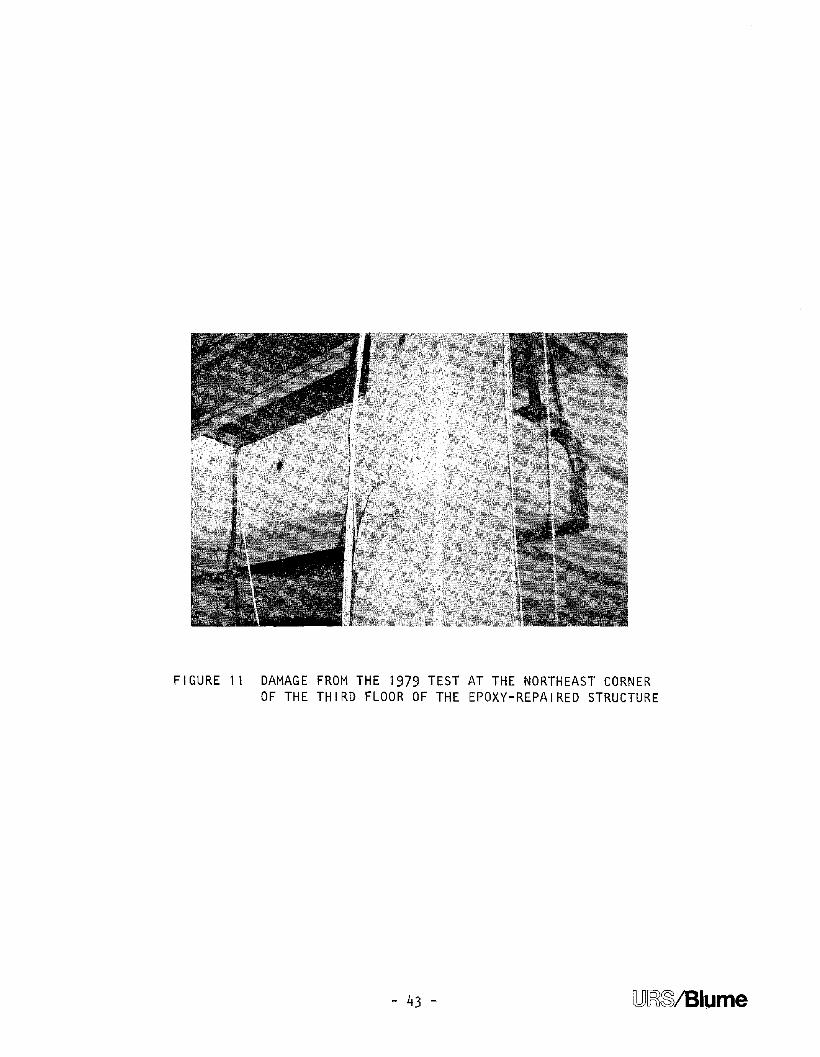
11 Damage from the 1979 Test at the Northeast Corner of theThird Floor of the Epoxy-Repaired Structure •••••••••••••••••••• 43
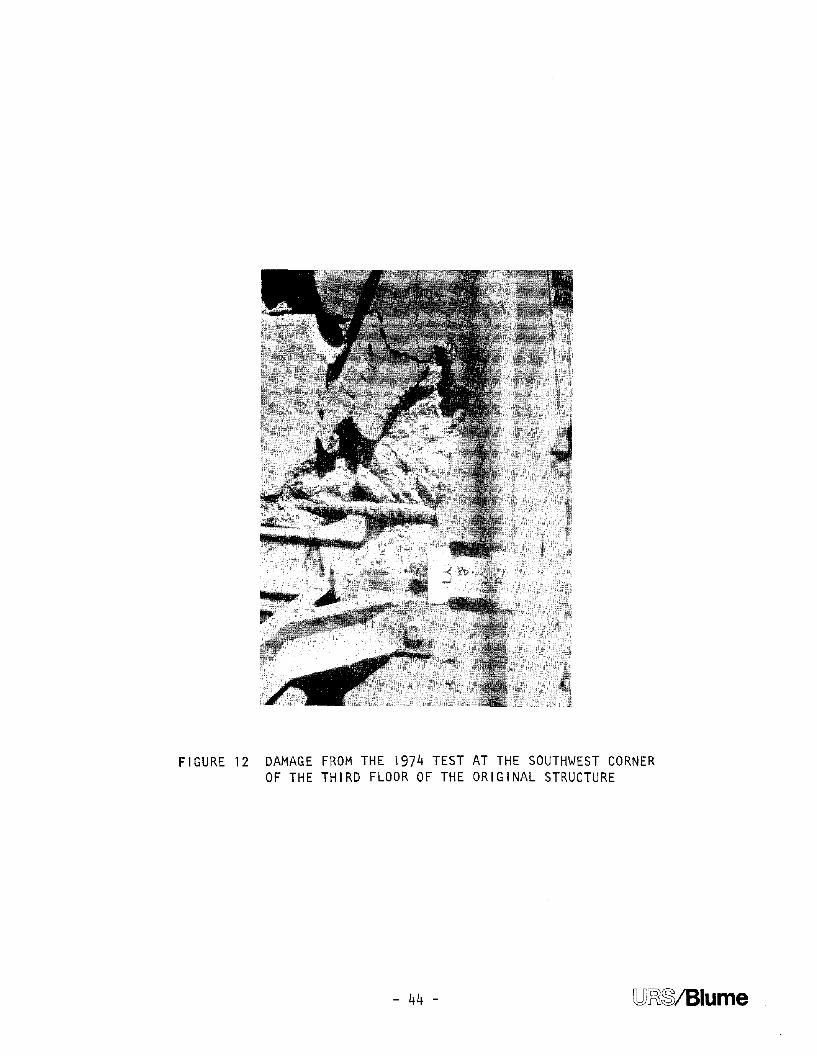
12 Damage from the 1974 Test at the Southwest Corner of theThird Floor of the Original Structure •••••••••••••••••••••••••• 44
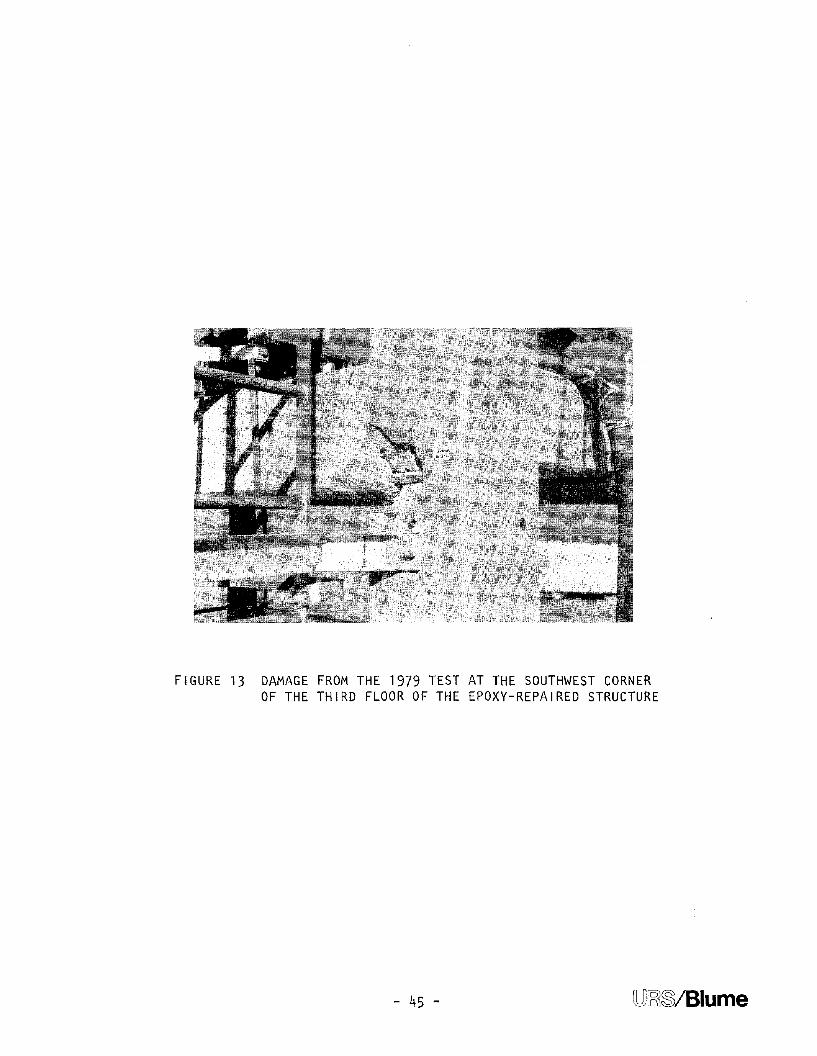
13 Damage from the 1979 Test at the Southwest Corner of theThird Floor of the Epoxy-Repaired Structure •••••••••••••••••••• 45
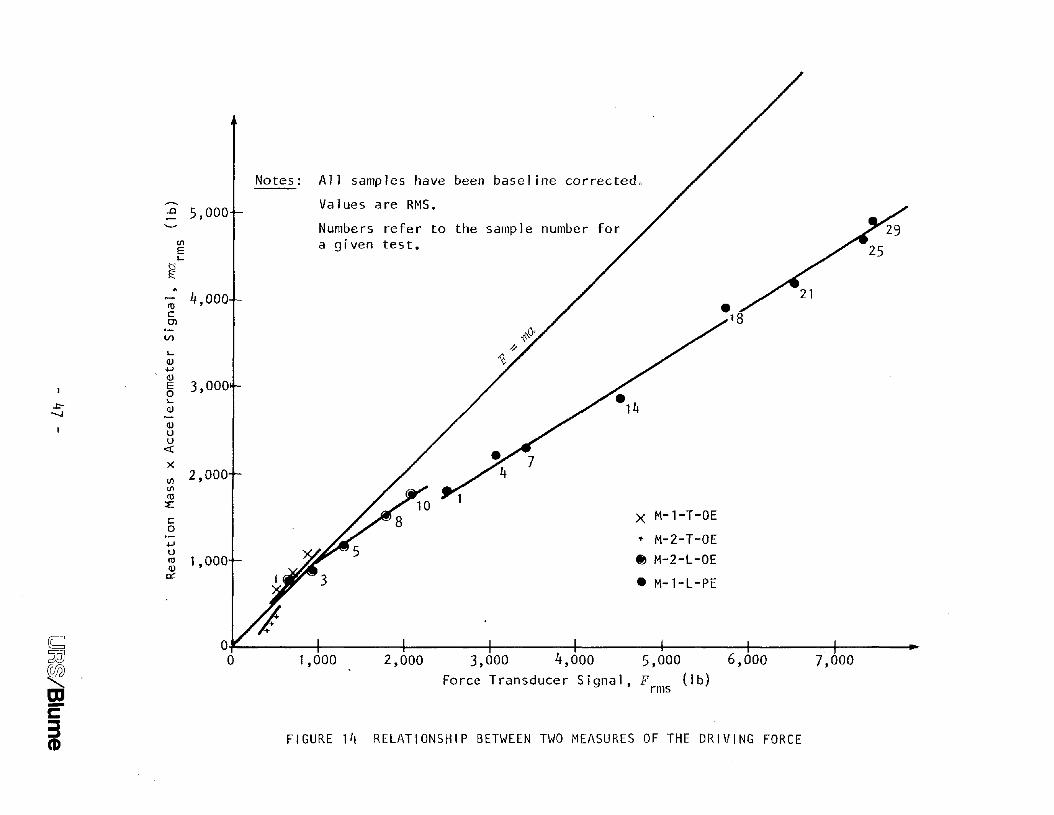
14 Relationship Between Two Measures of the Driving Force ••••••••• 47
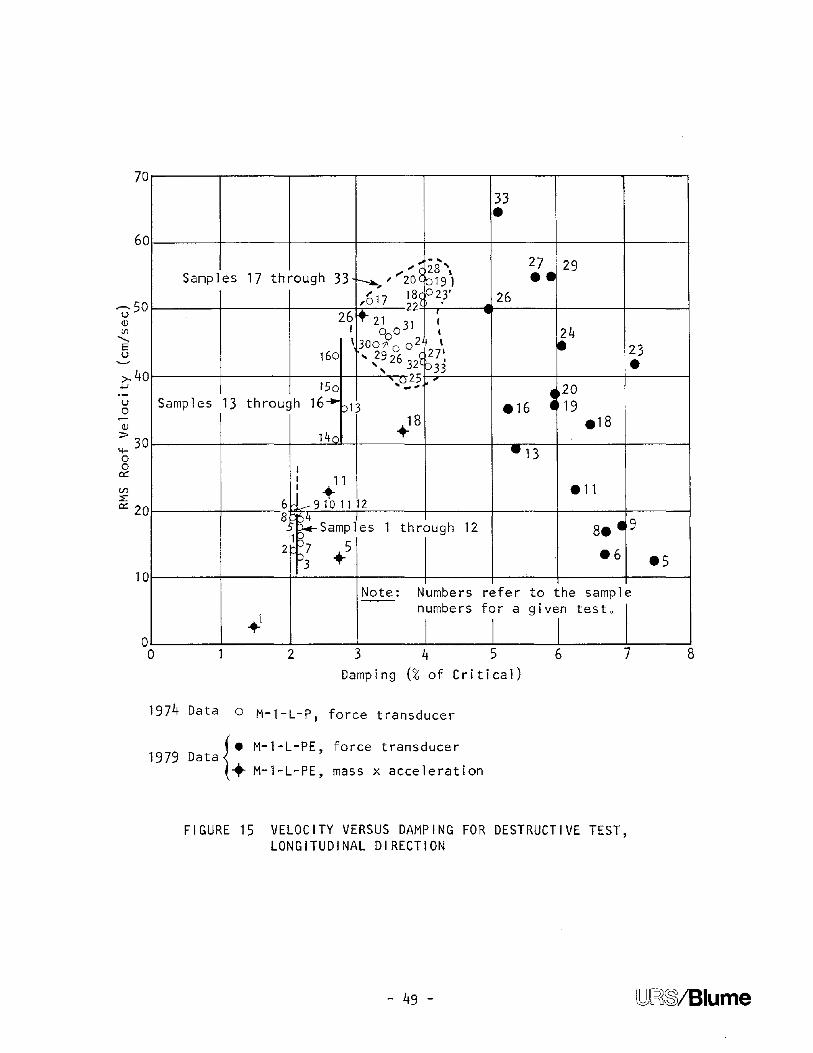
15 Velocity Versus Damping for Destructive Test,Longitudinal Direction •••••••••••••••••••••••••••••••••••••.••• 49
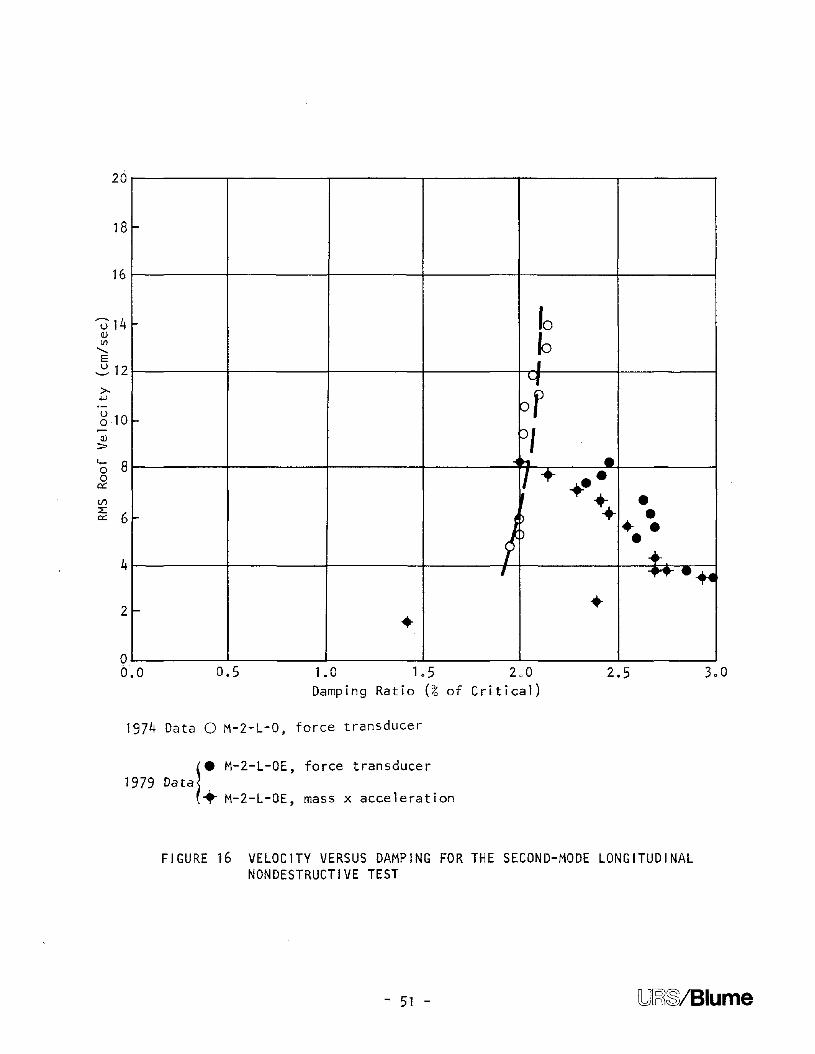
16 Velocity Versus Damping for the Second-Mode longitudinalNondestructive Test .••••••••.•••••••••••••••.•.•••••••••••••••• 51
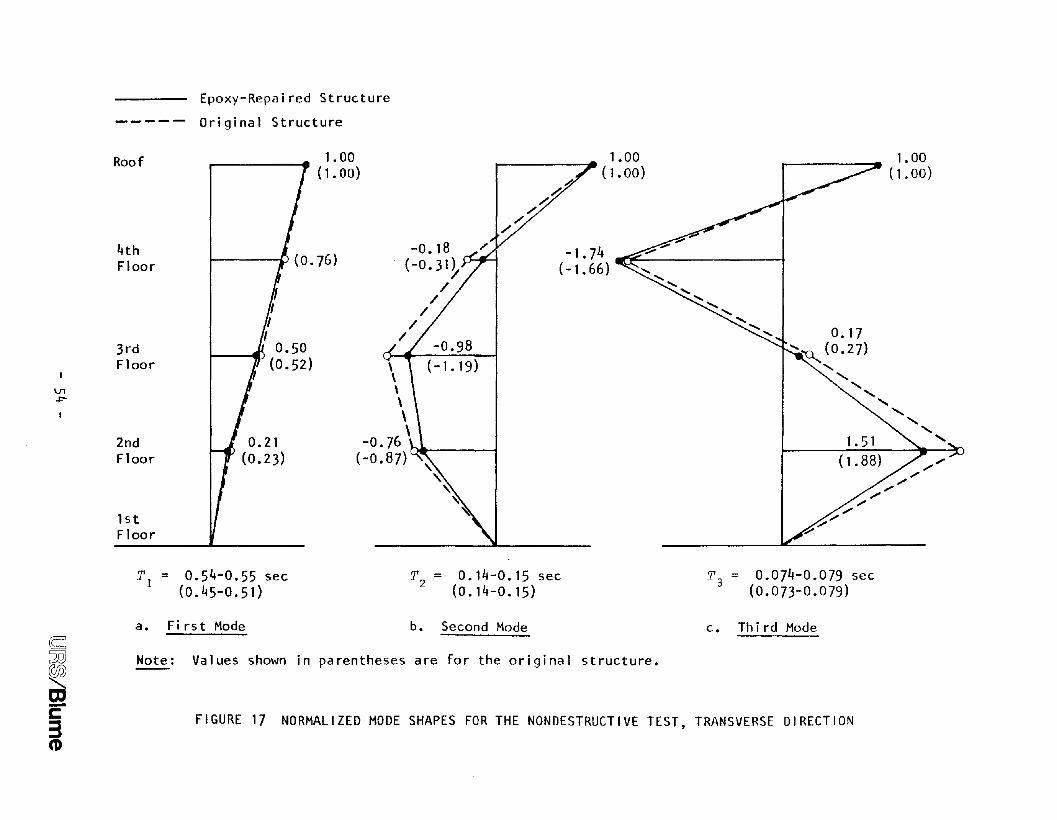
17 Normalized Mode Shapes for the Nondestructive Test,Transverse Direction ••..••••.•.••.•..•.•.•••••••..•••••••••••.• 54
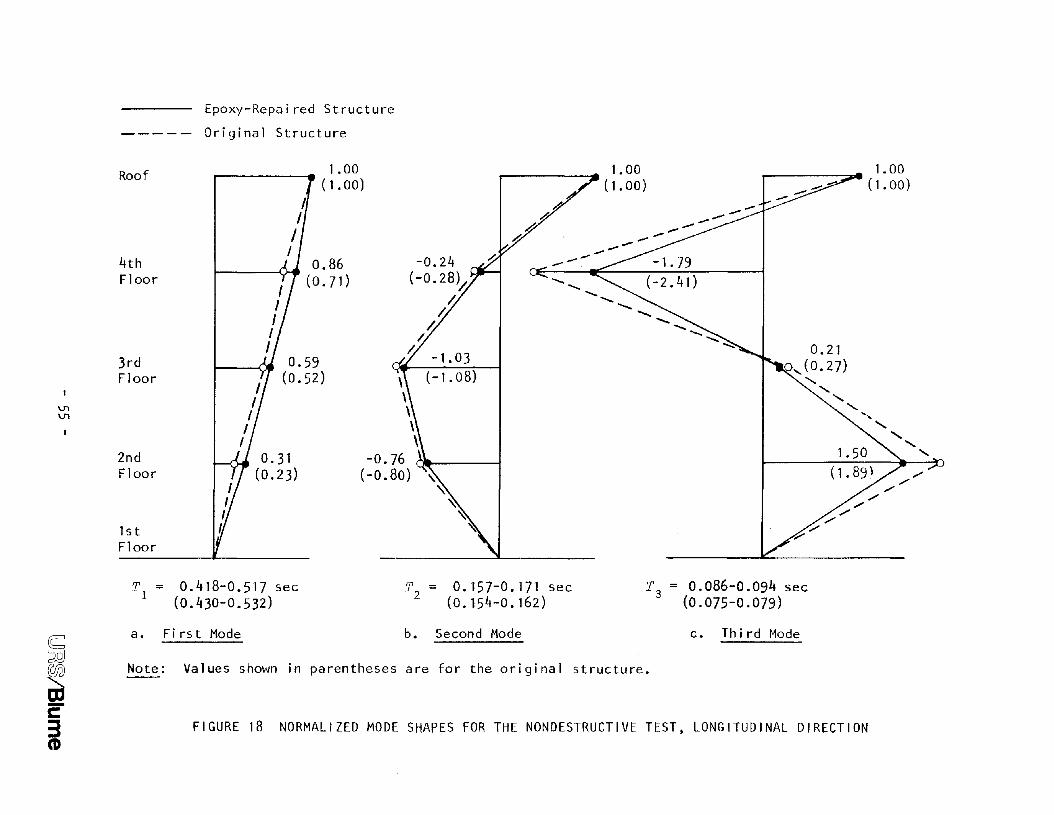
18 Normalized Mode Shapes for the Nondestructive Test,Longitudinal Direction .•........ ...• 55
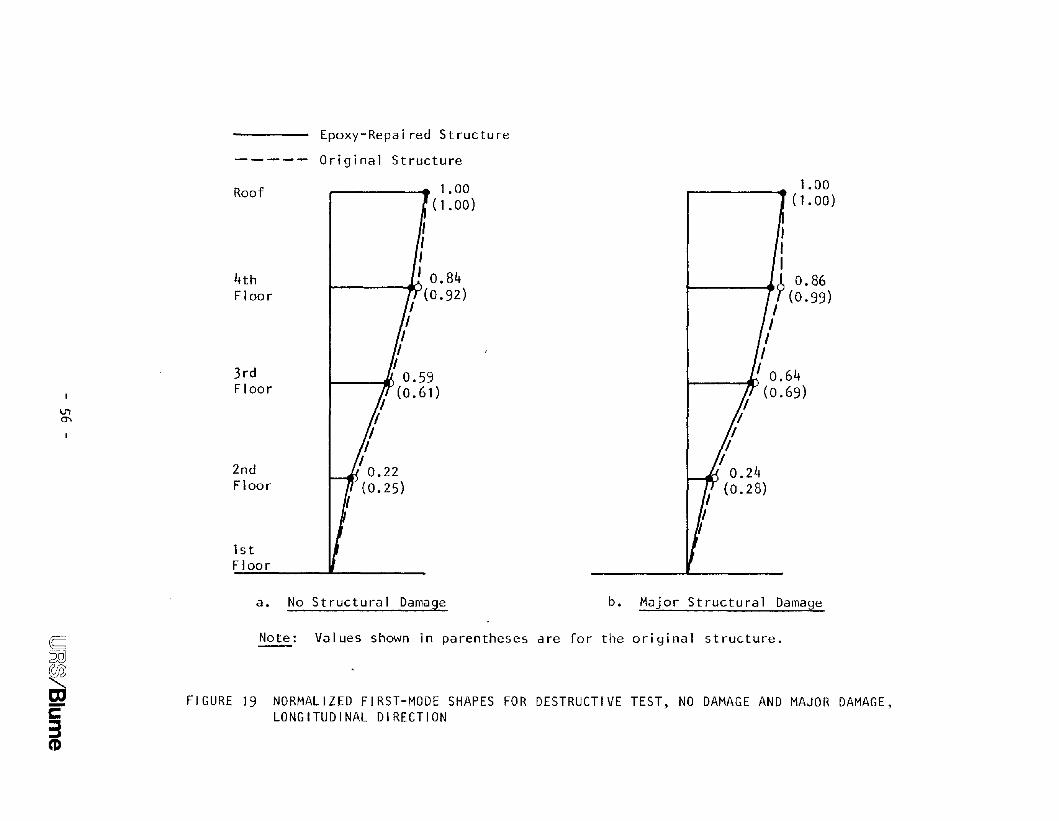
19 Normalized First-Mode Shapes for the Destructive Test,No Damage and Major Damage ••••••••••••••••••••••••••••••••••••• 56
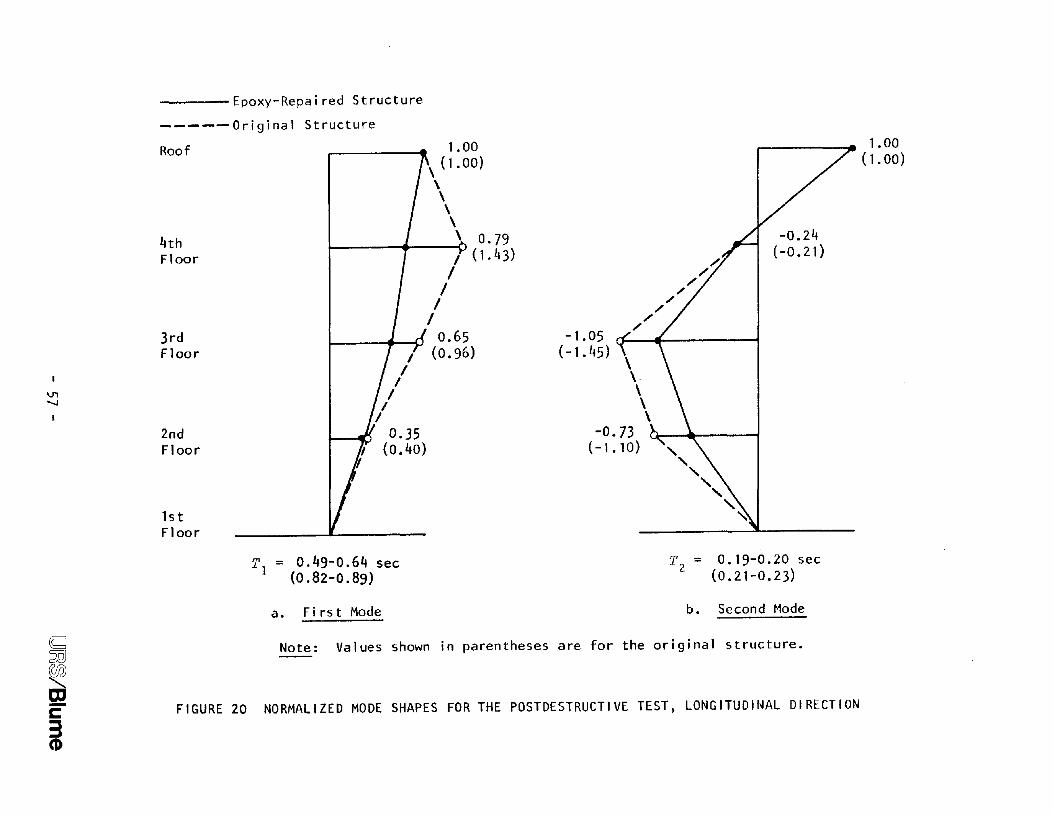
20 Normalized Mode Shapes for the Postdestructive Test,longitudinal Direction ••••••••••••••••••.•••••••••••••••••••••• 57
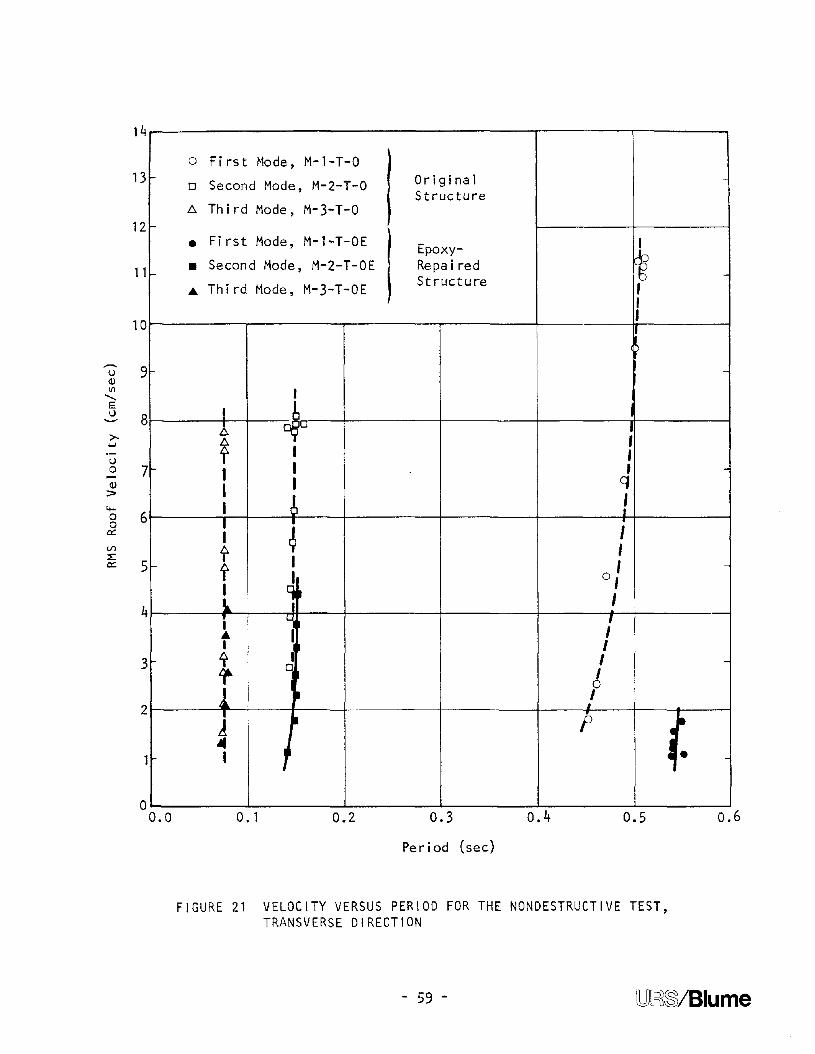
21 Velocity Versus Period for the Nondestructive Test,Transverse Direction ••••••••.•••••..•••••••.•.••••••••••••••.•• 59
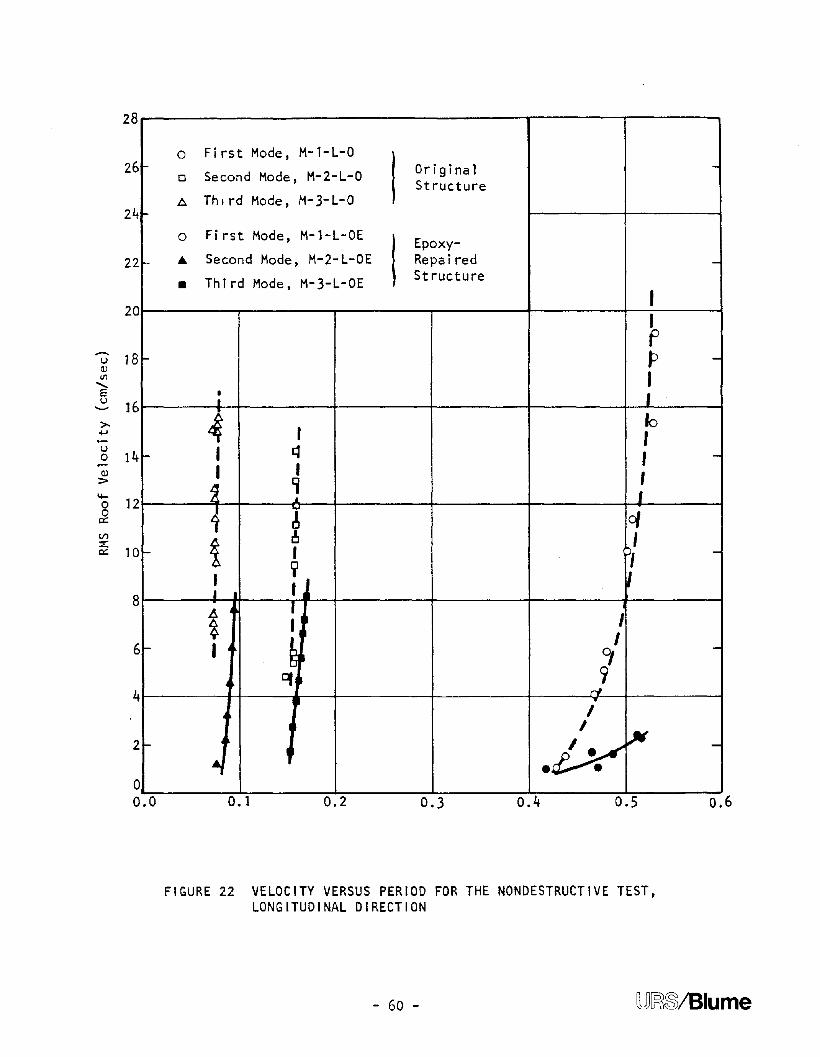
22 Velocity Versus Period for the Nondestructive Test,Longitudinal Direction ••••••••••••••••••••••••••••••••••••••••• 60
23 Velocity Versus Period for the Destructive Test,longitudinal Direction ••••••••••••••••••••••••••••••••••••••••• 61
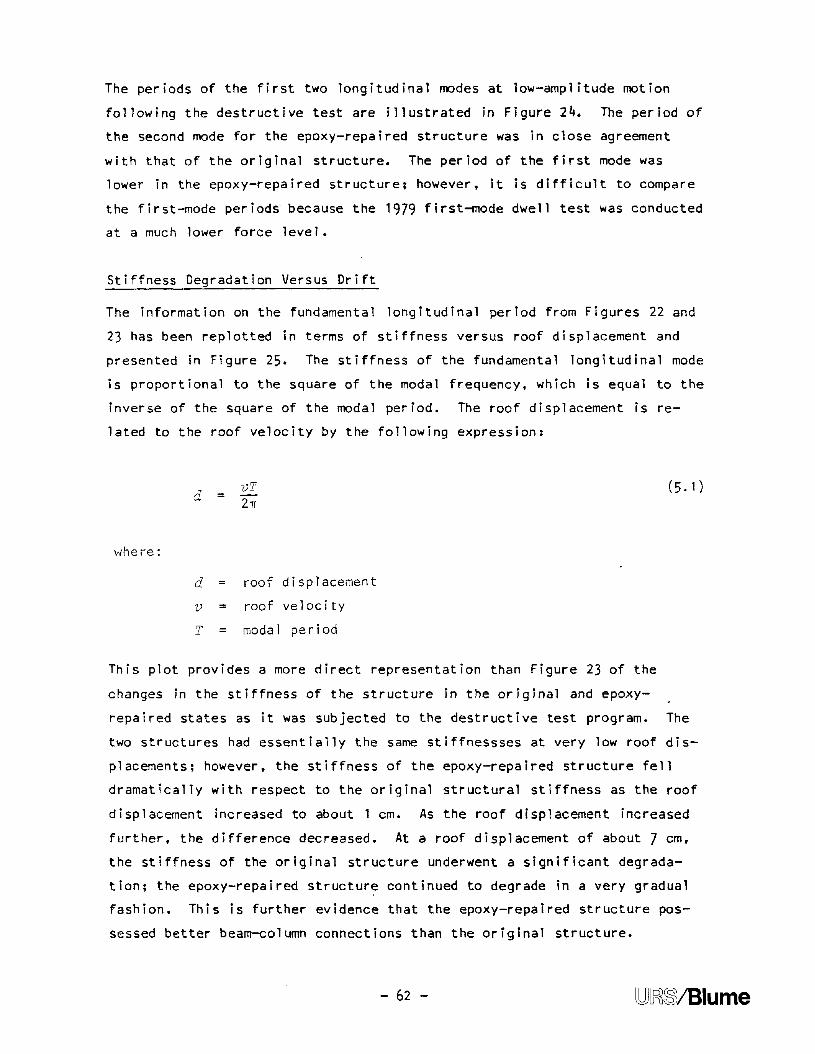
24 Velocity Versus Period for the Postdestructive Test,Longitudinal Direction •••••••••.•••.••••••••••••••••••••••••••• 63
25 Stiffness Versus Roof Displacement for the Nondestructiveand Destructive Tests of the Original and Epoxy-RepairedStructures. Ftrst Mode •••.••••••...•••.•••••.•.•••••••••.•••••• 64
26 Stiffness Versus Maximum Interstory Drift for the DestructiveTests of the Original and Epoxy-Repaired Structures.First Mode ••••• ••••••••••••••••.• •••••••••••••••••••••••••••••• 66
- iv - DJJ~~lBlume
CONTENTS (Continued)
27 Base Shear Versus Roof Displacement for the DestructiveTests of the Original and Epoxy-Repaired Structures •••••••••••• 68
28 Equivalent Spectral Velocities of Selected Samples fromthe 1979 Destructive Dwell Test •••••••••••••••••••••••••••••••• 71
29 Mode Shapes and Periods Developed Using the SAP IVProgram, Moments of Inertia Based on Gross Area •••••••••••••••• 73
30 Mode Shapes and Periods Developed Using the SAP IVProgram, with Moments of Inertia Based on GrossArea and a Portion of the Floor Slab Includedin the Beams ••••••••••••••••••••••••••••••••••••••••••••••••••• 75
31 Mode Shapes and Periods Developed Using the SAP IVProgram, Moments of Inertia Based on Section 10.10.1of the ACI 318-77 Commentary................................... 76
32 Mode Shapes and Periods Developed Using the TABS 80Program, with Rigid Links Reduced by 25% of theMember Depths •••••••••••••••••••••••••••••••••••••••••••••••••• 78
- v -[u)~~/Blume
ACKNOWLEDGMENTS
The authors appreciate the financial support provided by the National
Science Foundation for the vibration testing of an epoxy-repaired rein
forced concrete test structure.
The Nevada Operations Office of the U.S. Department of Energy provided ,the
test structure and the seismograph system, as well as overall administra
tive support for the project. It also provided the funding for the orig
inal destructive testing of the structure. The authors are particularly
grateful for this continued interest and support from the Department of
Energy.
Sandia National Laboratories provided the vibration generator and the tech
nical support for the operation of the generator. ReynoldS Electrical &
Engineering Company, Inc., provided field support during the tests, and Pan
American World Airways, DNA Photo Project, provided the photographic cover
age.
The authors appreciate the assistance of the following individuals who pro
vided support during the test operations, served as technical consultants,
and/or reviewed this report: John A. Blume, John P. Banister, B. R.
Bradley, D. M. Ellett, Kenneth K. Honda, Richard O. Navarro, Roger E. Skjei,
and David O. Smallwood.
- vi -
ABSTRACT
A full-scale, 4-story reinforced concrete structure, deliberately damaged
by forced vibration in 1974, was repaired by the epoxy-injection method and
retested in 1979 using the same reciprocating-mass vibration generator.
The program consisted of a series of tests, beginning with low-amplitude
vibrations, followed by forced vibrations, increased into the range of in
elastic response of the structure. The test program was similar to the
1974 testing of the original, undamaged structure. Structural damage from
the first destructive test was extensive, consisting of x-cracking and
spa11ing at the beam-column connections. The 1979 damage to the epoxy
repaired structure was similar to that sustained by the original structure
in 1974, but the cracking was more widely distributed, and, in general,
damage was less severe following the 1979 test.
The results of this study show that, for low-amplitude motions, the epoxy
repaired structure was sl ight1y less stiff than the original undamaged
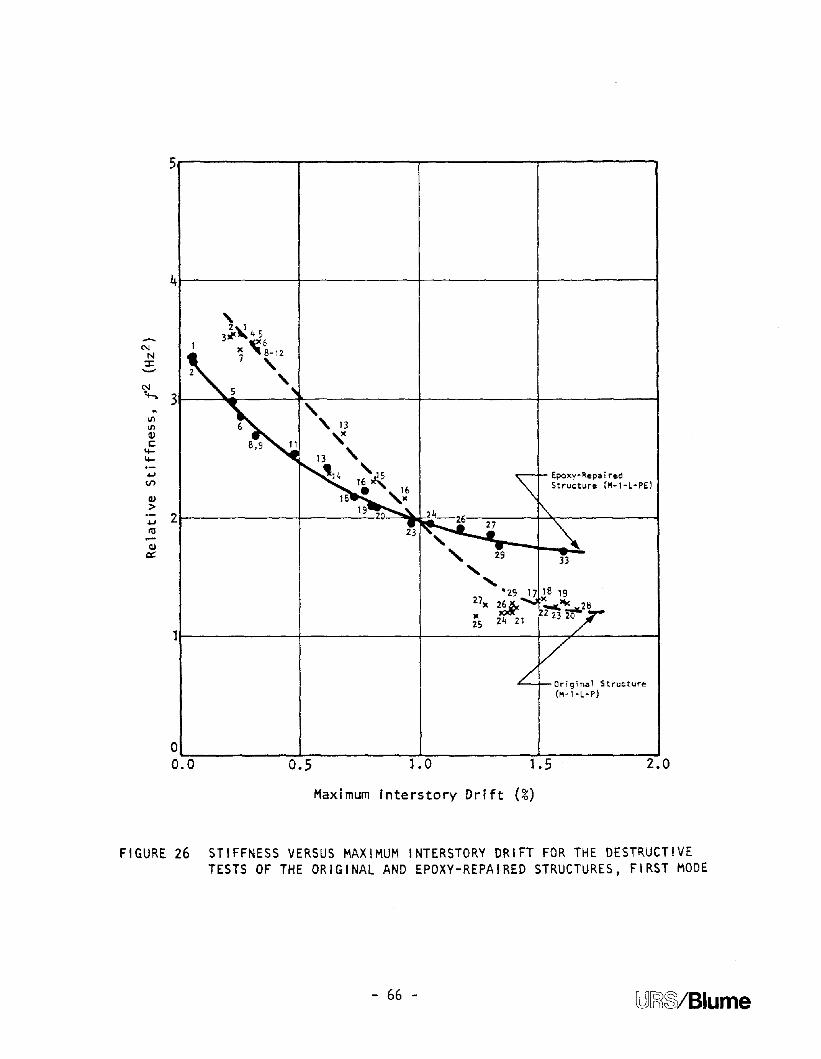
structure. However, a plot of the destructive-test data shows that, as the
amp1 itude of the structure's response increased, the difference in stiff
ness between the epoxy-repaired structure and the original structure
decreased. At large deflections associated with severe damage, the epoxy
repaired structure was actually stiffer than the original structure. The
cracking at beam-column connections appeared to be much less severe in the
1979 test than in the 1974 test.
The behavior of the test structure, in both its original and epoxy-repaired
states, was compared with that of theoretical models. The stiffness of
models using moments of inertia for cracked sections, as recommended in the
ACI 318-77 Commentary, are representative of the stiffness of the test
structure as it begins to yield and to sustain visible damage.
- vi i - [lJ]~~/Blume
1. INTRODUCTION
The philosophy of seismic design of buildings is that they should be engi
neered to resist major destructive earthquakes without collapse. although
structural and nonstructural components in the buildings may sustain dam
age. While catastrophic collapses are theoretically avoided. structural
damage is not. Following a major earthquake. each damaged building must be
surveyed to determine whether it can be economically repaired and restored
to service. One method commonly used to repair reinforced concrete struc
tures is the injection of a high-strength epoxy compound into the cracked
concrete. filling the voids and rebonding the fractured members.
Epoxy-injection techniques were used extensively to repair cracking of
highway bridges. buildings. and other reinforced concrete structures dam
aged in a number of recent earthquakes. for example. the 1964 Alaska. 1969
Santa Rosa. and 1971 San Fernando earthquakes. However. until now there
have been no destructive field vibration tests of repaired buildings to
determine their ability to sustain future earthquake excitations.
Laboratory cyclic tests 1 ,2 conducted at the University of Calif~rnia.
Berkeley (UCB), have shown that the epoxy-injection technique is quite ef
fective in restoring the original strength and energy-absorption character
istics of structural components. such as rectangular reinforced concrete
beams and columns. However. these subassembly tests have revealed that the
technique is only partially successful in recovering original stiffness.
In a paper reviewing cyclic loading tests of epoxy-repaired subassembties
at UCB and other laboratories, Popov and Berter03 concluded that a repaired
structure may be 2 to 2.5 times more flexible than the original, undamaged
structure. They noted that forced-vibration field tests of a structure in
both its original and repaired states would be very valuable in relating
the results of cyclic tests of subassemblies to the behavior of actual
structures.
Shaking-table tests have been conducted at UCB on two reinforced concrete
frame models in both their original and epoxy-repaired states.4 ,5 The
models were seven-tenths scale and represented 2-story structures. These
- 1 - [lJJ~~/Blume
tests provided results similar to the cyclic subassembly tests by indicat
ing the effectiveness of the epoxy-injection technique in recovering the
strength and energy-absorption properties of the original structures but
showing that it was not capable of recovering all of the stiffness lost
because of damage.
One of the 4-story reinforced concrete structures at the Nevada Test Site
(NTS) offered the ideal opportunity for further dynamic testing of a full
scale structure because it had been repaired by the epoxy-injection method.
4-Story Reinforced Concrete Test Structures
In 1965. two identical 4-story reinforced concrete structures were designed
and constructed at the NTS specifically for field investigations associated
with a structural response program conducted by URS/John A. Blume & Associ
ates, Engineers (URS/Blume), for the U.S. Atomic Energy Commission (now the
U.S. Department of Energy). These test structures are 12 ft by 20 ft. cen
terline to centerline. in plan with 9-ft story heights. Each structure
consists of four reinforced concrete floor slabs with perimeter beams sup
ported by four corner columns.
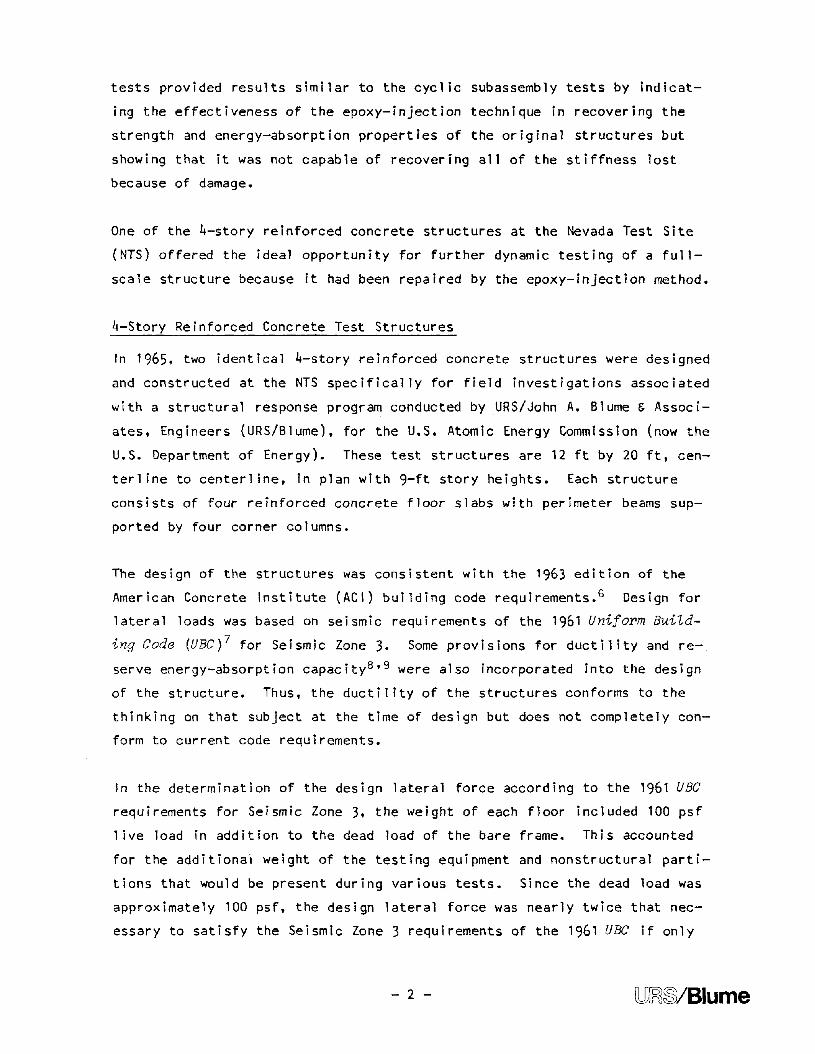
The design of the structures was consistent with the 1963 edition of the
American Concrete Institute (ACI) building code requirements. 6 Design for
lateral loads was based on seismic requirements of the 1961 Uniform BuiLd
ing Code (UBC)7 for Seismic Zone 3. Some provisions for ductility and re
serve energy-absorption capaci ty8.9 were also incorporated into the design
of the structure. Thus. the ductility of the structures conforms to the
thinking on that subject at the time of design but does not completely con
form to current code requirements.
In the determination of the design lateral force according to the 1961 UBC
requirements for Seismic Zone 3. the weight of each floor included 100 psf
1ive load in addition to the dead load of the bare frame. This accounted
for the additional weight of the testing equipment and nonstructural parti
tions that would be present during various tests. Since the dead load was
approximately 100 psf, the design lateral force was nearly twice that nec
essary to satisfy the Seismic Zone 3 requirements of the 1961 UBC if only
- 2 - [!j)~~lBlume
the bare frame was considered. However. the design lateral force is ap
proximately equal to the force needed to satisfy the Seismic Zone 4 re
quirements of the 1982 UBC,lO considering only the bare frame.
History of the Testing Program
Between 1966 and 1973. the two structures were subjected to ground motions
caused by more than 50 underground nuclear explosions and to numerous non
destructive vibration tests. in which the vibrations were created by pull
release, vibration generator. and human-induced methods. In order to study
the effects of nonstructural partitions on structural response. various
types of partitions were added to the structures for some of these tests.
The vibrations created by these tests (with the possible exception of one)
were all of relatively low amplitude; the structural frames were thus not
damaged, although, in some instances. partitions showed minor damage. It
is possible that ground motions produced by one particular underground nu
clear explosion may have caused yielding of some of the reinforcing steel.
Results of these tests and associated analyses are described in several
reports ll - 14 and technical papers. 1S • 16
In 1974. one of the structures was deliberately forced into the range of
inelastic response by means of a reciprocating-mass vibration generator.
The principal purposes of this testing were to compare theoretical non
linear response predictions with actual recorded response and to determine
the character of the onset of structural damage for reinforced concrete
structures. Structural damage was extensive. consisting of x-cracking and
spalling at beam-column connections. The type and extent of the damage
were similar to what might be expected from a major earthquake. Results
from the 1974 testing program were published in report form in 197617 and
were presented at the Sixth World Conference on Earthquake Engineering18
and the 1976 ACt International Conference on Concrete Structures. 19
In June 1975. the damaged structure was repaired by the epoxy-injection
technique. The repair work. which used a patented repair process,20 rep
resented typical postearthquake repairs. The repaired structure provided
an excellent opportunity to determine the effectiveness of epoxy-injection
techniques in recovering the original physical properties of structures.
- 3 - QJJ~@/Blume
Since testing of an epoxy-repaired structure would be beneficial to the
earthquake engineering community, the National Science Foundation (NSF)
funded the testing and analysis reported here. Retesting took place in
September 1979. This report describes the retest procedures and the re
sults of the analysis and compares the results with those of previous
tests.
Funding for this project was provided by the NSF under Agreement CEE
7812714. DOE's Nevada Operations Office (DOE-NV) provided the repaired
structure, strong-motion instrumentation, and administrative support.
- 4 - [LJJ~~/Blume
2. DESCRIPTION OF ESSENTIAL EQUIPMENT
The Test Structure
The reinforced concrete test structure is 12 ft by 20 ft, centerline to
centerline, in plan with four 9-ft stories (see Figure 1). The floors are
supported by four rectangular corner columns, 16 in. by 14 in. The floor
slabs are 6 in. thick and are reinforced for two-way action. Spandrel
beams around the perimeter of each floor slab are 16 in. by 15 in. in the
20-ft direction and 14 in. by 12 in. in the 12-ft direction. Details of
the placement of reinforcing steel are provided in another URS/Blume re
port .11
Tests of concrete cylinders indicated 28-day compressive strengths ranging
from 4,000 to 5,000 psi .11 Tests of reinforcing steel coupons showed yield
strengths between 45,000 and 55,000 psi and ultimate strengths at approxi
mately 90,000 psi .11 For the purposes of analysis in this study, concrete
compressive strength is taken to be 4,500 psi, and yielding of the rein
forcing steel is taken to be 50,000 psi.
Prior to the 1974 tests, a 3-ft-thick concrete pad was poured onto the
existing ground floor slab to prevent overturning during the destructive
test. This pad was in place for the 1979 tests as well. A 2-in. gap be
tween the concrete pad and the columns prevented contact between the pad
and the columns during the testing.
The test structure was deliberately damaged by forced vibrations in the
1974 test program. A year later, the structure was repaired by injection
of a high-strength epoxy compound into all significant cracks. A sealer
was first used to cover each crack, leaving gaps at selected locations to
serve as injection and relief ports. When the sealer had set, the epoxy
compound was injected into the cracks at the injection ports until it was
expressed at the rel ief ports. The sealer was sanded off after the epoxy
*Structural response data from velocity meters have been digitized.
- 26 -[UJ[Ri~/Blume
the termination of the destructive test, the structure had suffered exten
sive damage; however, the damage was not as extensive as that caused by the
1974 test.
The procedures used in the destructive test of the epoxy-repaired structure
differed in two aspects from those used in the 1974 test of the original
structure. First, the reaction mass included the two additional masses;
therefore, the reaction mass weighed 24,500 1b and not 15,400 1b as in
1974. This increase in the weight increased the gravity load forces in the
third floor and in the columns below the third floor. This had the effect
of decreasing the bending moment capacity of the third-floor beams and in
creasing the stiffness of the columns below the third floor. Other effects
of the increased reaction mass are unknown.
The second difference in testing procedures was that the test was manually
controlled. During the 1974 destructive test, the automatic controlling
system was unable to maintain the driving frequency at the resonant fre
quency of the structure. As the force level was increased, the properties
of the structure would change, characterized in particular by a lengthening
of the fundamental period. The automatic controls would attempt to track
the changing period by maintaining the phase angle between the floor accel
eration and the force transducer signals at 90°. However, the controls
were unable to track this change properly, and the response would drop to
low-amplitude motion. This phenomenon was attributed to the double-value
characteristics of the frequency response curves for a nonlinear structure
at driving frequencies adjacent to the resonant frequency of the struc
ture. 17 To prevent this situation in the 1979 destructive test, it was
decided to maintain the phase angle at 120°, slightly above resonant condi
tions. The vibrator force was manually increased in increments, and the
frequency was manually adjusted as needed to maintain the phase angle at
120° •
The destructive test was preceded by a sweep test to confirm the resonant
frequency and to check the equipment. The tests in Test Series PE are
identified in Table 6.
- 27 - [ljJ[R1@/Blume
TABLE 6
INPUT DATA FOR THE DESTRUCTIVE TEST
Nondestructive Frequency Sweep Test
Sweep Test Constant Force FrequencyNumber ( 1b) (Hz)
1-L-PE 1,000 1-30
Destructive Frequency Dwell Test
Dwell Test Force FrequencyNumber ( 1b) (Hz)
M-1-L-PE 500-6,000 Varied
Note: Structural response data from velocity meters havebeen digitized.
- 28 - [ljJ~~/Blume
Postdestructive Tests
The primary objective of the postdestructive tests was to observe the be
havior of the damaged structure at values of motion amplitudes corre
sponding to the original elastic range. The procedures followed were
similar to those used in the nondestructive tests, except that the vibra
tion generator was located on the third floor instead of on the roof and
oriented only in the longitudinal direction. This test series consisted of
a single frequency sweep test, to survey modal frequencies, followed by
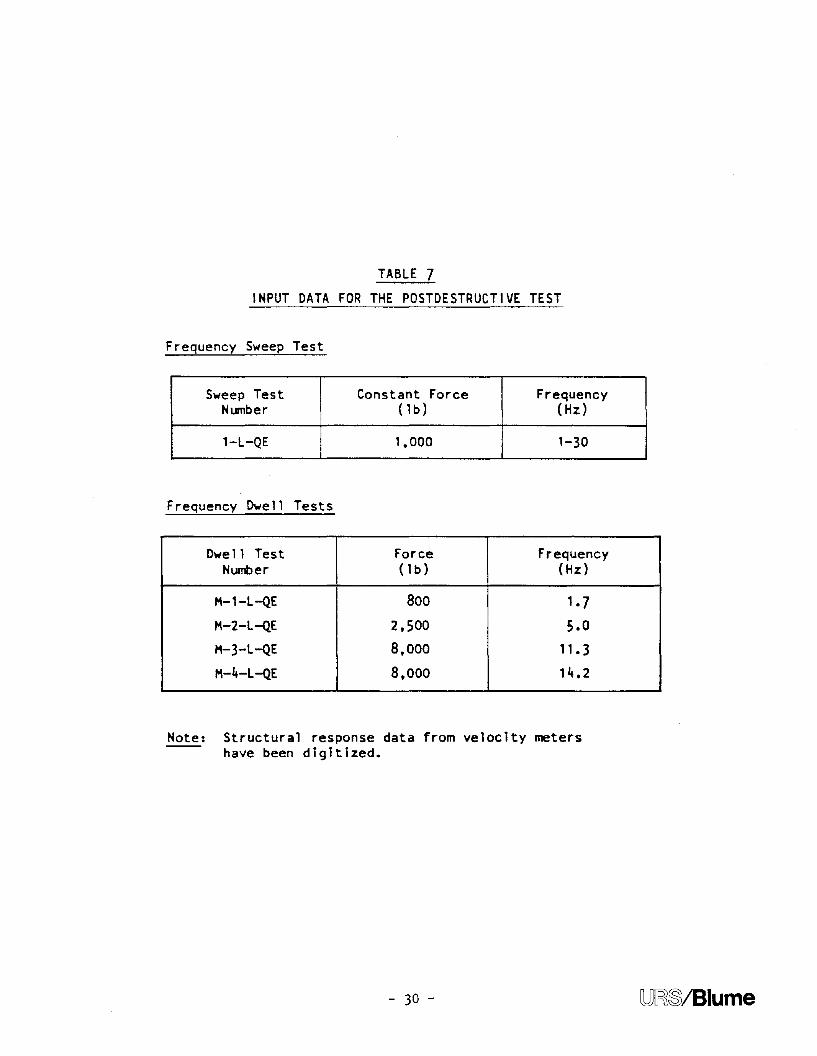
modal dwell tests. The various postdestructive tests are identified in
Table 7.
Data Collection and Storage
The motions of the structure were measured by L-7 velocity meters and Sun
strand accelerometers, as described in the section on instrumentation.
Signals were recorded on magnetic tape in analog form by three separate
recording systems. One system recorded the signals from the 10 L-7
velocity meters located on the structure simultaneously with the signals
from the force transducer and reaction mass accelerometer. The signals
from the 10 accelerometers were recorded simultaneously with the reaction
mass accelerometer signal by another recording system. A third system
recorded the signal from the 12 L-7 velocity meters in the ground surface
instrumentation array.
These three separate tape recordings were made for each test with the ex
ception of the destructive test. Just prior to the start of destructive
testing, a temporary power cutoff caused the accelerometer recorder to shut
off. When the power was restored, the recorder did not automatically turn
on, and the accelerometer data for the destructive test were not recorded
on magnetic tape. However, the data from the other two networks were re
corded for the destructive test.
Fo11owinq the tests, the magnetic tapes were transferred to the Las Vegas
office of URS!Blume for permanent storage. Duplicate tapes were made and
sent to Sandia offices at Mercury, Nevada, for digitization.
- 29 -lL!J[Ri~/Blume
TABLE 7
INPUT DATA FOR THE POSTDESTRUCTIVE TEST
Frequency Sweep Test
Sweep Test Constant Force FrequencyNumber ( 1b) (Hz)
1-L-QE 1,000 1-30
Frequency Dwell Tests
Dwell Test Force FrequencyNumber ( 1b) (Hz)
H-1-L-QE 800 1.7
H-2-L-QE 2,500 5.0
H-3-L-QE 8,000 11.3
H-4-l-QE 8,000 14.2
Note: Structural response data from velocity metershave been digitized.
- 30 - [U)[Ri~/Blume
The motion pictures and still photographs, which were recorded by Pan
American World Airways, DNA Photo Project (Pan Am), were transferred to the
Pan Am offices at Mercury, Nevada, for development and storage. Prints
were sent to the San Francisco office of URS/Blume for evaluation.
- 31 - [)J)[Ri§/Blume
4. ANALYSIS OF RESPONSE DATA
Data Digitization
A significant amount of data were collected in this testing program. It
was not practical to digitize all recorded data; therefore, only specific
tests were selected for digitization. All frequency dwell tests and some
of the frequency sweep tests were selected. The vibration generator-
structure interaction tests were also digitized, although there were no
plans to analyze these test data in this study. The tests that were digi
tized are indicated in Tables 4 through 7.
The structural responses were measured by both velocity meters and accel
erometers in all tests except the destructive test. As discussed earlier,
a malfunction of the accelerometer recording system prior to the destruc
tive test resulted in the loss of the accelerometer data in that test. In
order to use structural response data from the same origin for all tests,
it was decided to digitize only the response data measured by the L-7
velocity meters.
Before digitizing test data, the original magnetic tapes were played back
and the signals recorded on paper strip charts. The quality of the data
was then evaluated by visually inspecting the paper strip charts. During
this process, it was discovered that the ground motion data measured by
the array of 12 L-7 velocity meters on the ground floor and at various dis
tances from the structure -- were recorded intermittently and contained
data dropouts. Therefore, the ground motion data were not digitized.
Digitization start and end times were selected for each test, and digiti
zation requests were transmitted to the Sandia offices at Mercury, Nevada,
along with duplicates of the original magnetic tapes. Sandia digitized the
data at 200 samples/sec and transmitted the resulting tapes of digitized
data to URS/Blume's offices in San Francisco. URS/Blume inspected these
raw digitized data and created a final set of magnetic tapes containing the
calibrated data in digitized form.
- 32 -[lD~~/Blume
A small number of the digitized data were unusable because of difficulties
during field testing and recording.
• The force transducer signal in dwell test M-l-LOE was distorted by clipping and unwanted spikes.A review of the paper playback records from theoriginal tape showed that the distortion occurredat the time of the field recording. This signalcould not be restored through filtering procedures and had to be discarded.
• The signals from the fourth-mode dwell tests inTest Series OE indicated unstable test conditions. The instabil ities were characterized bylarge changes in the structural motions with little or no change in the level of the input force.A closer inspection of the waveforms gave theimpression that the structure was being excitedin two different modes. Since the roof was verynear to a node of the fourth mode, one might expect difficulties in exciting the fourth modewith the vibration generator located on the roof.Thus, the data from dwell tests M-4-T-QE and M-4L-OE were not suitable for analysis.
Some data, but an almost insignificant number, were corrupted during the
process of creating the digitized tapes. The signals for the second-floor
velocity on the digitized tapes for dwell tests M-l-T-OE, M-2-T-OE, M-3-T
03, and M-2-L-QE were found to be incorrect in comparison with the original
tapes. The digitized signals did not match the analog signals in either
amplitude or waveform. This suggested that the error was not simply an
incorrect value for the calibration factor or superimposed noise. This
error could have originated in the process of either duplicating or digi
tizing the tapes. It was not important to determine the source of the
error or to correct it because the second-floor velocities were only essen
tial in the determination of mode shapes. Approximate values for second
floor velocity for use in determining mode shapes for these five tests were
obtained from the paper playback records.
Data Sampling for Analysis
Short segments of the time histories in each dwell test were selected for
the purpose of analyzing the digitized data. Samples were selected by in
specting the paper playback records and establishing sample start times
- 33 -[UJ[p6~/Blume
where the signals had already been fairly stable for about 1 sec and re
mained stable for about 10 sec more. Samples were numbered sequentially in
each test. Start times for samples in the nondestructive tests are shown
in Table 8. and sample start times for the destructive test and postde
structive tests are shown in Table 9.
The programs used in data analysis required that the number of data points
in a sample be 2 to some integral power. In addition. sample lengths
needed to be at least 5 sec in order to include several cycles of motion.
Therefore. signal samples consisted of 1.024 digitized data points. thus
providing sample lengths of 5.115 sec.
Response Data Analysis Using the RAP Program
The computer program RAP was used to analyze the 1974 response data to pro
vide structural response characteristics. i.e •• mode shapes. modal frequen
cies. and modal damping ratios.1 7 For consistency in comparing results
from the 1974 tests of the original structure with the results from the
1979 tests of the epoxy-repaired structure. it was decided to conduct the
current analysis using RAP.
RAP is based on a curve-fitting method in the time domain and was origi
nally developed by Ragget. 13 The program can be used to obtain the linear
dynamic response characteristics for a particular mode from an input-output
pair of time histories. A modal response is first isolated and separated
from the total response by a filtering scheme. This assumes that the dy
namic behavior of the structure can be well approximated by the summation
of a number of responses of a viscously damped, linear, single-degree-of
freedom oscillator. The response of a theoretical sing1e-degree-of-freedom
oscillator is generated and fitted in a least-squares sense to the isolated
modal response. The viscous damping ratio and the natural frequency of the
best-fit oscillator are assumed to represent the response characteristics
of the isolated mode. A mode shape can be obtained by using the root-mean
square (RMS) amplitudes of the best-fit responses at the various floor
FIGURE 26 STIFFNESS VERSUS MAXIMUM INTERSTORY DRIFT FOR THE DESTRUCTIVETESTS OF THE ORIGINAL AND EPOXY-REPAIRED STRUCTURES, FIRST MODE
- 66 - ~[p6~/Blume
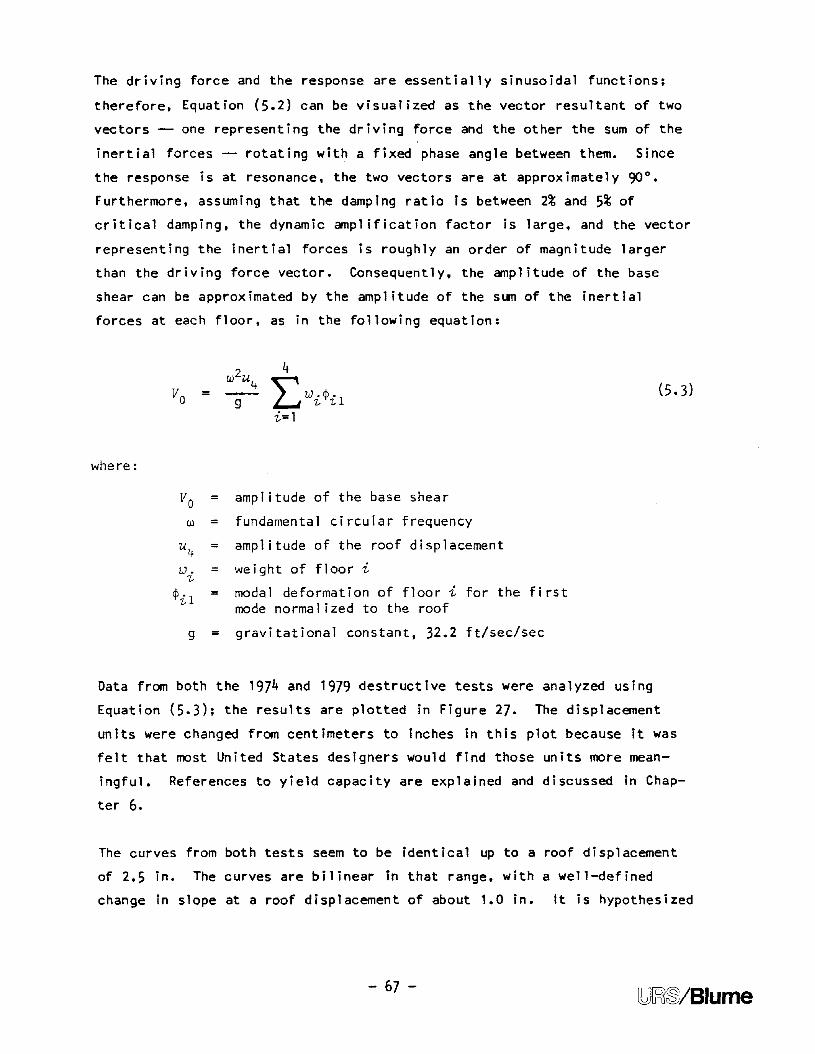
The driving force and the response are essentially sinusoidal functions;
therefore, Equation (5.2) can be visualized as the vector resultant of two
vectors -- one representing the driving force and the other the sum of the
inertial forces rotating with a fixed phase angle between them. Since
the response is at resonance, the two vectors are at approximately 90°.Furthermore, assuming that the damping ratio is between 2% and 5% of
critical damping, the dynamic amplification factor is large, and the vector
representing the inertial forces is roughly an order of magnitude larger
than the driving force vector. Consequently, the amplitude of the base
shear can be approximated by the amplitude of the sum of the inertial
forces at each floor, as in the following equation:
=g
where:
w
g
=
=
=
==
=
amplitude of the base shear
fundamental circular frequency
amplitude of the roof displacement
weight of floor i
modal deformation of floor i for the firstmode normalized to the roof
gravitational constant, 32.2 ft/sec/sec
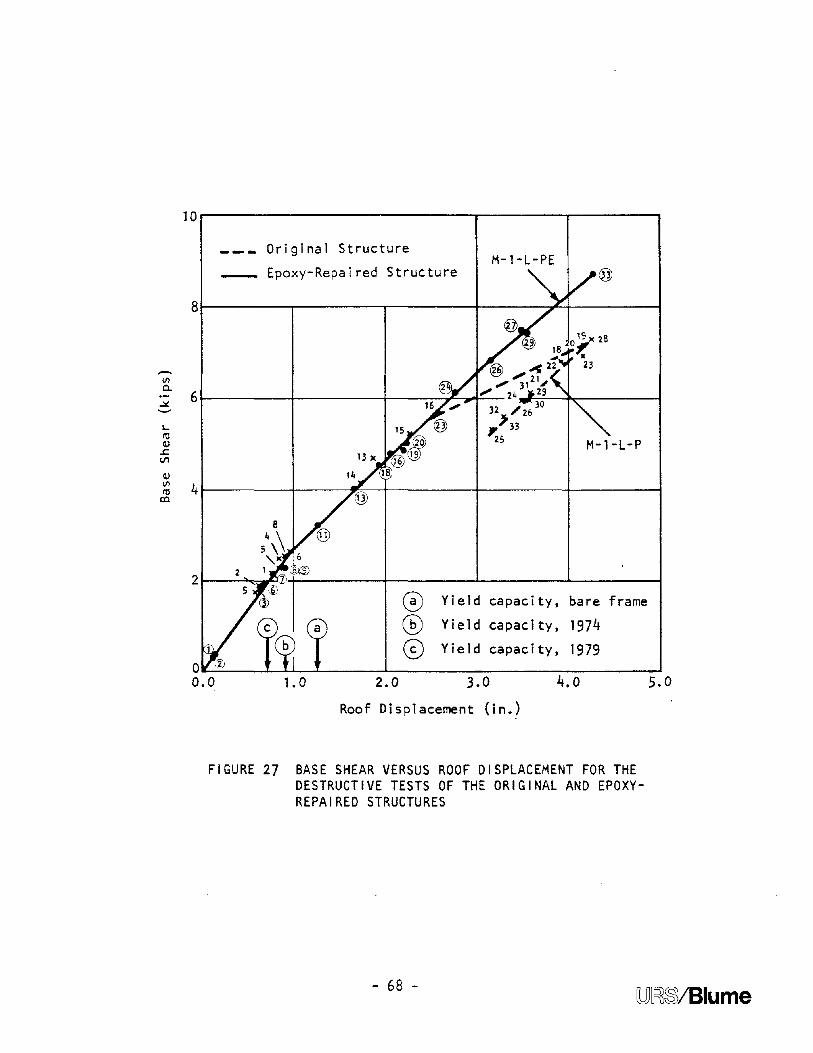
Data from both the 1974 and 1979 destructive tests were analyzed using
Equation (5.3); the results are plotted in Figure 27. The displacement
units were changed from centimeters to inches in this plot because it was
felt that most United States designers would find those units more mean
ingful. References to yield capacity are explained and discussed in Chap
ter 6.
The curves from both tests seem to be identical up to a roof displacement
of 2.5 in. The curves are bilinear in that range, with a well-defined
change in slope at a roof displacement of about 1.0 in. It is hypothesized
- 67 -[LJJ~~/Blume
10r-----------------.-------.------,
5.04.0
M-1-L-PE
2.0 3.0
Roof Displacement (in.)
1.0
Original Structure
Epoxy-Repaired Structure
22
0 Yield capacity, bare frame
® Yield capacity, 1974
0 Yield capacity, 1979
81------.,..-------.-----t----T--+------1
-tilc..~
6-1-reQ)~
V'l
Q)til 4re
co
FIGURE 27 BASE SHEAR VERSUS ROOF DISPLACEMENT FOR THEDESTRUCTIVE TESTS OF THE ORIGINAL AND EPOXYREPAIRED STRUCTURES
- 68 -[u)~~/Blume
that this point may represent the transition from uncracked to cracked sec
tion properties. This hypothesis was tested against published data on
damage to beam-column connections.
Kustu et al. 25 have statistically analyzed the results of laboratory tests
on reinforced concrete specimens to determine mean values and standard
deviations for joint rotations corresponding to cracking and yielding in
beams and columns. They also developed a simple procedure for relating the
joint rotations to the interstory drifts. Using their relationship to
calculate joint rotations and comparing those rotations with their statis
tical data, it was calculated that there was a 75% probability of beam
cracking corresponding to a roof displacement of 1.0 in. and only a 10%
probability of column cracking. The beam rotation corresponding to a roof
displacement of 1.0 in. was 40% of the standard deviation above the mean
value for beam cracking. Thus, there is a very good statistical basis for
identifying the break point in the plot of the base shear as corresponding
to the inception of beam cracking in the structure.
A second break in the curve for the base shear in the original structure
occurs at about 2.5 in. of roof displacement. Using the relationship and
data from Kustu et al., there was a 57% probability of beam yielding cor
responding to this point but only a 0.1% probability of column yielding.
The beam rotation was less than 2% of the standard deviation above the mean
value for beam yielding. Thus, this is a reasonably good statistical basis
for identifying the second break point in the base shear curve for the
original structure as the inception of beam yielding.
There is no obvious second break point in the base shear curve for the
epoxy-repaired structure that might identify yielding in the beams. There
does appear to be a slight change in slope at around 3.0 in. of roof dis
placement, but the curve above that point was based on only a few data
points.
- 69 - [lJJ[R1~/Blume
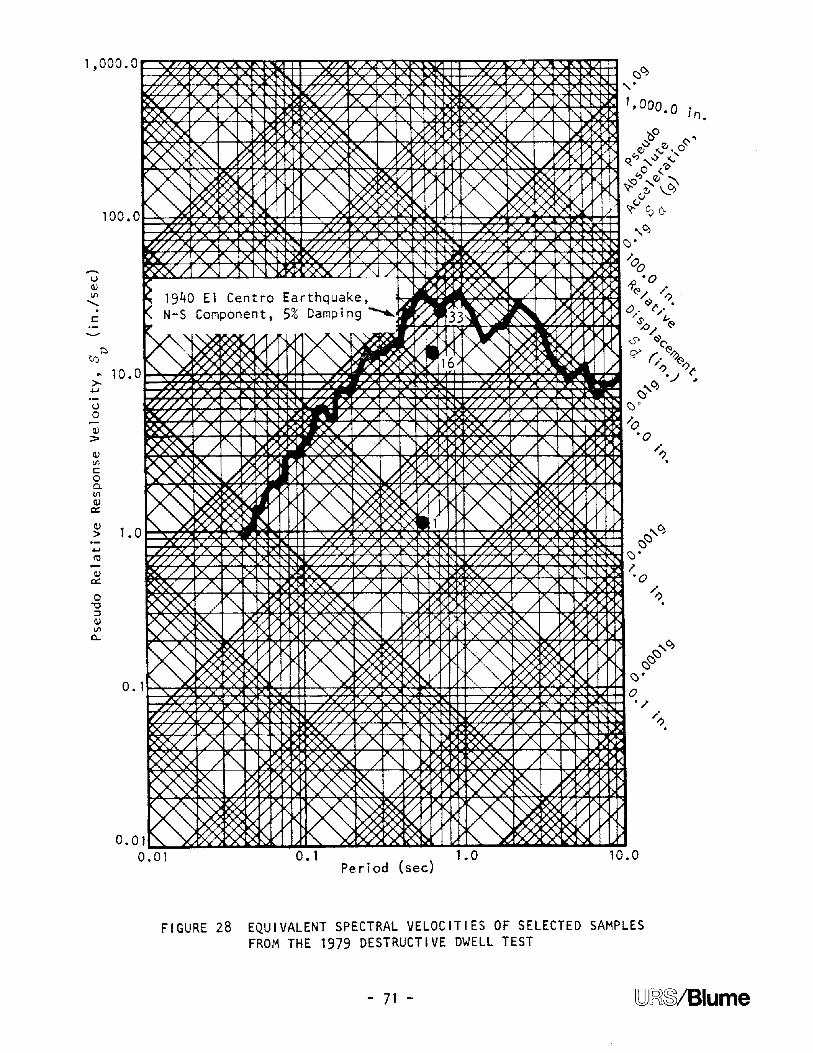
Spectral Velocity
The intensity of the motions experienced by the 4-story test structure
during the 1979 destructive test can be approximately compared with earth
quake excitations by means of spectral response velocities. The displace
ment response of a multistory building for a given earthquake rtsponse
spectrum can be determined by using the following equation:26
where:
d ..'L-J max
d ..'L-J max
y.J
tP ..'L-J
S .vJ
w.J
=
=
=
=
=
y ·tP··S .J 'L-J vJ
w.J
maximum displacement of story i in mode J
modal participation factor for mode j
modal deformation of story i in mode jrelative to the top-story deformation
spectral response velocity at the periodof mode j
circular natural frequency of mode j
(5.4)
Since the maximum velocity of story i in mode j, v.. ,is equal to'L-J max
wJ.d. . ,Equation (5.4) can be reversed to calculate the spectral velocity1;J max
from known floor velocity. Using the amplitude of the roof velocity re-
corded at Samples 1, 16, and 33 during the destructive test, and assuming
that the entire motion was in the first mode, the values for the equivalent
spectral velocity are 1.1 in./sec, 15.2 in./sec, and 27.7 in./sec, respec
tively. In Figure 28, these values are compared with the 5%-damped re
sponse spectrum for the north-south component of the 1940 E1 Centro
earthquake.
- 70 -[lJJ~~/Blume
.......u(l)tJ1
"-.c
....ro(l)
c::
o'"0::J(l)tJ1a..
O. 1Period (sec)
1.0 10.0
FIGURE 28 EQUIVALENT SPECTRAL VELOCITIES OF SELECTED SAMPLESFROM THE 1979 DESTRUCTIVE DWELL TEST
- 71 - [LJJ[R1~/Blume
6. MATHEMATICAL MODELING
Building codes are not specific about stiffness assumptions to be used in
modeling the behavior of reinforced concrete structures under lateral
forces. This issue was aptly discussed by Freeman et al •• 27 who applied
various assumptions to mathematical models for several different structures,
including the original 4-story test structure. and compared the calculated
stiffnesses of the models with measured stiffnesses of the building.
In this study, additional models of the test structure were developed and
compared with the results of the 1974 and 1979 tests. The primary objective
was to determine the suitability of several likely models in representing
the actual stiffness of the test structure. No attempt was made to deter
mine the suitability of the model ing assumptions in predicting forces in
ternal to the structure.
Mathematical Models for the Test Structure
Four mathematical models were developed to represent the dynamic properties
of the test structure in the longitudinal direction. The models differed
in member moments of inertia and joint rigidity; however, other aspects of
the models were the same. The bases of the columns were fixed against ro
tation, and frame geometry was determined by centerl ine-to-centerline di
mensions of the beams and columns. Linear elastic behavior was assumed.
although it is well known that concrete behaves in a nonlinear fashion. the
modulus of elasticity decreasing with increasing strain. The modulus of
elasticity was taken to be 3,800,000 psi, which was based on a compressive
strength of 4,500 psi.
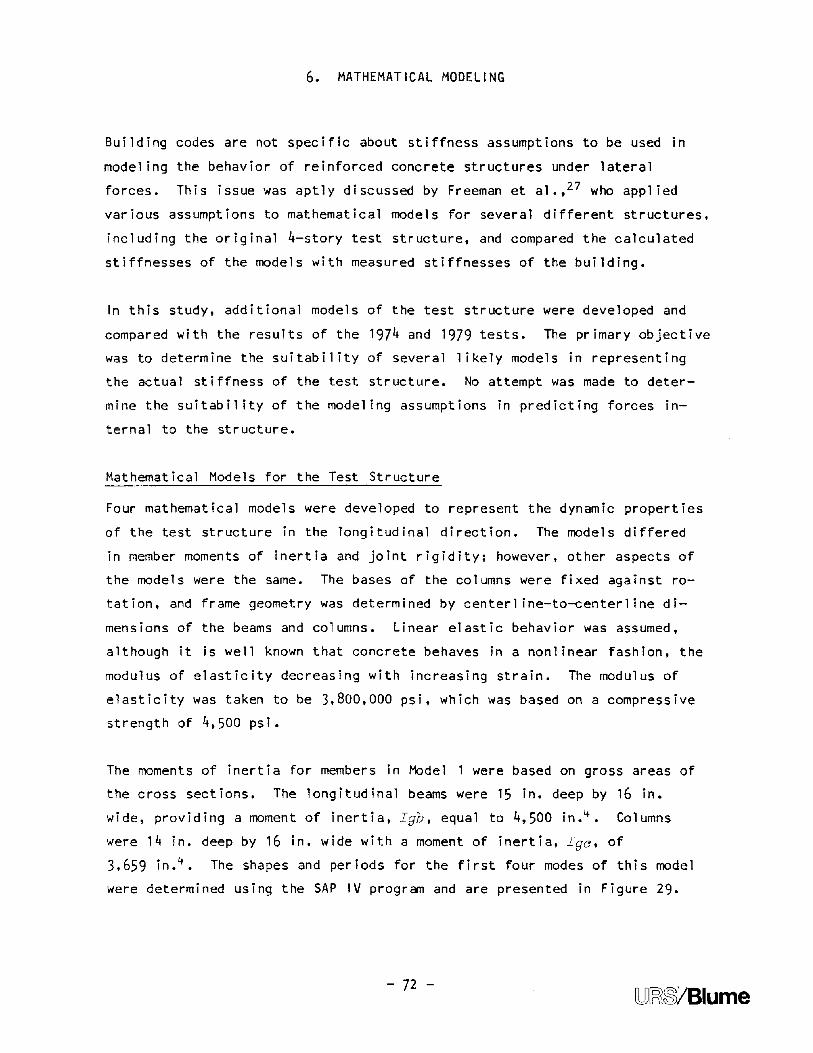
The moments of inertia for members in Model 1 were based on gross areas of
the cross sections. The longitudinal beams were 15 in. deep by 16 in.
wide, providing a moment of inertia, Igb, equal to 4.500 in. 4 • Columns
were 14 in. deep by 16 in. wide with a moment of inertia, Igc. of
3,659 in. 4 • The shapes and periods for the first four modes of this model
were determined using the SAP IV program and are presented in Figure 29.
- 72 -[LJJ[R1~lBlume
-0.615" I-0.738 ~ I
, .1.000
1stFloor . , . .
Tl = 0.443 sec T 2 = O. 137 sec T3 = 0.0712 sec T4 = 0.0498 sec
a. First Mode b. Second Mode c. Thi rd Mode d. Fourth Mode
Roof
3rdFloor
2ndFloor
4thFloor
--..JVJ
62]J
~E"3(I)
FIGURE 29 MODE SHAPES AND PERIODS DEVELOPED USING THE SAP IV PROGRAM,MOMENTS OF INERTIA BASED ON GROSS AREA
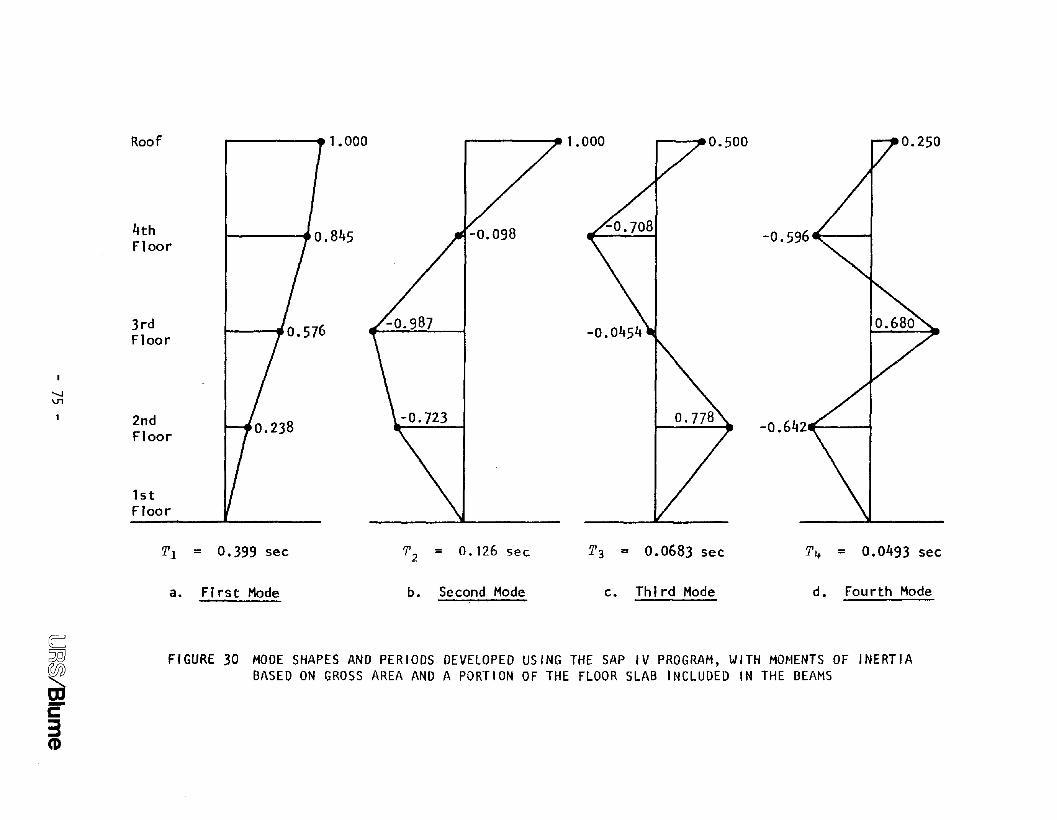
In Model 2, portions of the floor slabs were included in the calculations
for beam moments of inertia, according to the provisions of Section 8.10.3
of the ACI 318-77 Code. 6 It should be noted that these guidelines were
really intended for gravity load calculations and are not necessarily
applicable to lateral force calculations. The beam moments of inertia in
this model were 6,480 in. 4, or 1.44Igb• Column moments of inertia remained
the same as in Model 1. Mode shapes and periods were determined using the
SAP IV program and are presented in Figure 30.
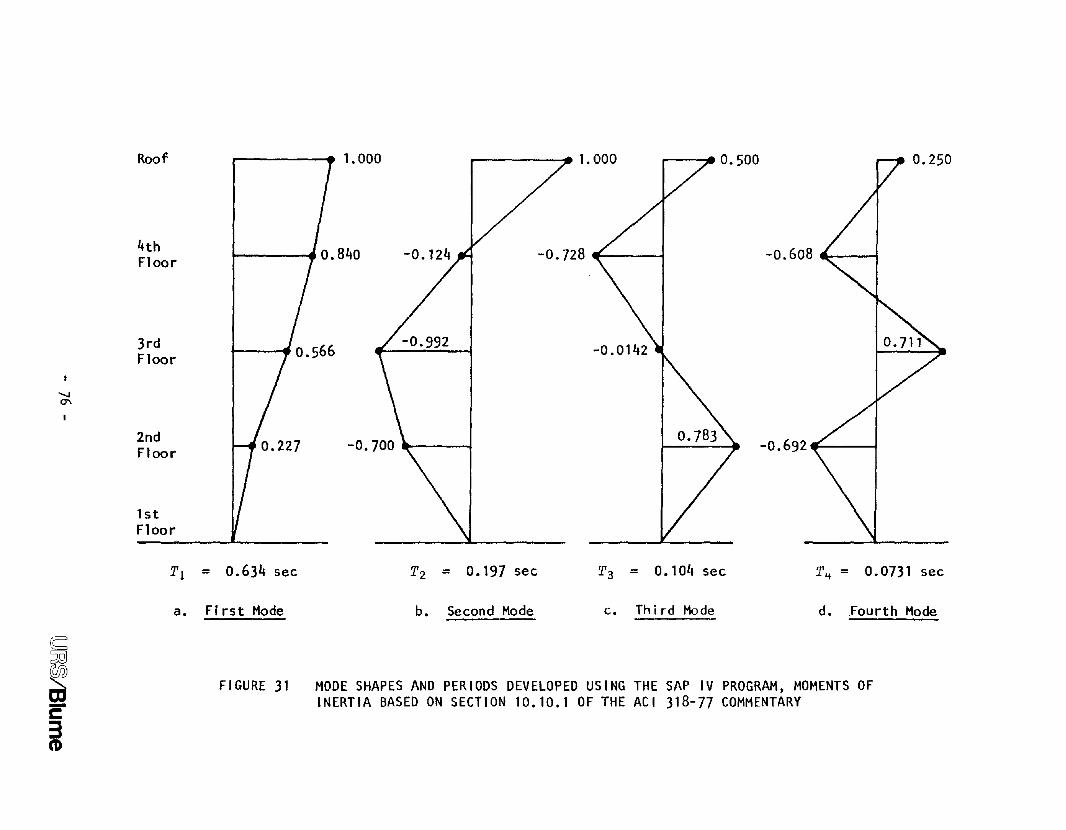
Model 3 uses guidelines provided in the ACI 318-77 Commentary 28 regarding
the stiffness of frames that are free to sway. Section 10.10.1 of the com
mentary suggests that beam moments of inertia be computed as one-half the
value based on gross area and that column moments of inertia be computed
from the following expression:
I = ( _1_.2=-p_t_E
_s )I 0.2 + Eg c
where:
I = moment of inertia to be used in analysis
I = moment of inertia based on gross area of sec-gtion
Pt = rat io of total longitudinal reinforcement togross area of section
Es = modulus of elasticity of reinforcement
Ec = modulus of elasticity of concrete
(6.1)
The columns in all stories were reinforced with six No.9 bars. The moduli
of elasticity were 29,000,000 psi for steel and 3,800,000 psi for concrete.
Using Equation (6.1), the column moments of inertia were 0.45Igc' The re
sults of the SAP IV analysis of Model 3 are presented in Figure 31.
The lengths of the members in all three of these models were based on
centerline-to-centerline dimensions; thus, the effects of joint size and
rigidity on the stiffness of the models were ignored. The TAB-S 80
program29 accounts for joint rigidity by replacing a portion of each end of
the members with a rigid link. The length of a rigid link at the end of a
- 74 -lUJ~~/Blume
.......V1
Roof
4thFloor
3rdFloor
2ndFloor
1stFloor
i e1.000
I '0.845 -0.596-= I
-0.642. I
Tl = 0.399 sec
a. FI rst Mode
T 2 = 0.126 sec
b. Second Mode
T3 = 0.0683 sec
c. ThIrd Mode
T4 = 0.0493 sec
d. Fourth Mode
bd:QJ
~E"3(1)
FIGURE 30 MODE SHAPES AND PERIODS DEVELOPED USING THE SAP IV PROGRAM, WITH MOMENTS OF INERTIABASED ON GROSS AREA AND A PORTION OF THE FLOOR SLAB INCLUDED IN THE BEAMS