165
2 2

UNIVERSITÀ DEGLI STUDI DI TRENTO
Facoltà di Scienze Matematiche Fisiche e Naturali
Dottorato di Ricerca in Fisica
XXIV Ciclo
Vibrational dynamics in strong glasses:
the cases of densified v-SiO2 and v-SiSe2
Marco Zanatta
Tutore:
Prof. Aldo Fontana
2011


The whole universe is in a glass of wine.
R.P. Feynman


Contents
Introduction v
1 The glassy state 1
1.1 Supercooled liquids and the glass transition . . . . . . . . . . . 2
1.2 Dynamics as Tg is approached: strong and fragile glassformers . 5
1.3 Glass structure . . . . . . . . . . . . . . . . . . . . . . . . . . . 6
1.3.1 Order within disorder . . . . . . . . . . . . . . . . . . . . 7
1.4 Characterizing amorphous structure . . . . . . . . . . . . . . . . 8
1.5 Glass dynamics . . . . . . . . . . . . . . . . . . . . . . . . . . . 11
1.6 Vibrations in solids . . . . . . . . . . . . . . . . . . . . . . . . . 11
1.6.1 Vibrations in crystals . . . . . . . . . . . . . . . . . . . . 12
1.6.2 Vibrations in glasses . . . . . . . . . . . . . . . . . . . . 13
1.7 The vibrational density of states . . . . . . . . . . . . . . . . . . 15
1.7.1 The low frequency limit: the Debye model . . . . . . . . 16
1.7.2 The excess of vibrational states and the boson peak . . . 19
1.7.3 Theoretical model for the boson peak . . . . . . . . . . . 19
2 Experimental probes: X-ray and neutrons 25
2.1 Inelastic X-ray scattering . . . . . . . . . . . . . . . . . . . . . . 26
2.1.1 X-ray inelastic scattering cross section . . . . . . . . . . 27
2.2 Inelastic neutron scattering . . . . . . . . . . . . . . . . . . . . 30
i

CONTENTS
2.2.1 Neutron inelastic scattering cross section . . . . . . . . . 31
2.2.2 Scattering from nuclei undergoing harmonic vibrations . 35
2.3 The dynamic structure factor . . . . . . . . . . . . . . . . . . . 37
3 Boson peak and elastic medium in permanently densied v-
SiO2 41
3.1 Sample preparation . . . . . . . . . . . . . . . . . . . . . . . . . 43
3.2 The vibrational density of states . . . . . . . . . . . . . . . . . . 47
3.3 The boson peak shape: the squeezing procedure . . . . . . . . . 48
3.4 Elastic medium characterization in the GHz frequency range . . 53
3.4.1 Brillouin light scattering experiments . . . . . . . . . . . 53
3.5 Inelastic X-ray scattering experiments . . . . . . . . . . . . . . . 55
3.5.1 The X-ray spectrometer ID28 . . . . . . . . . . . . . . . 55
3.5.2 Experimental setup . . . . . . . . . . . . . . . . . . . . . 57
3.5.3 IXS data analysis . . . . . . . . . . . . . . . . . . . . . . 59
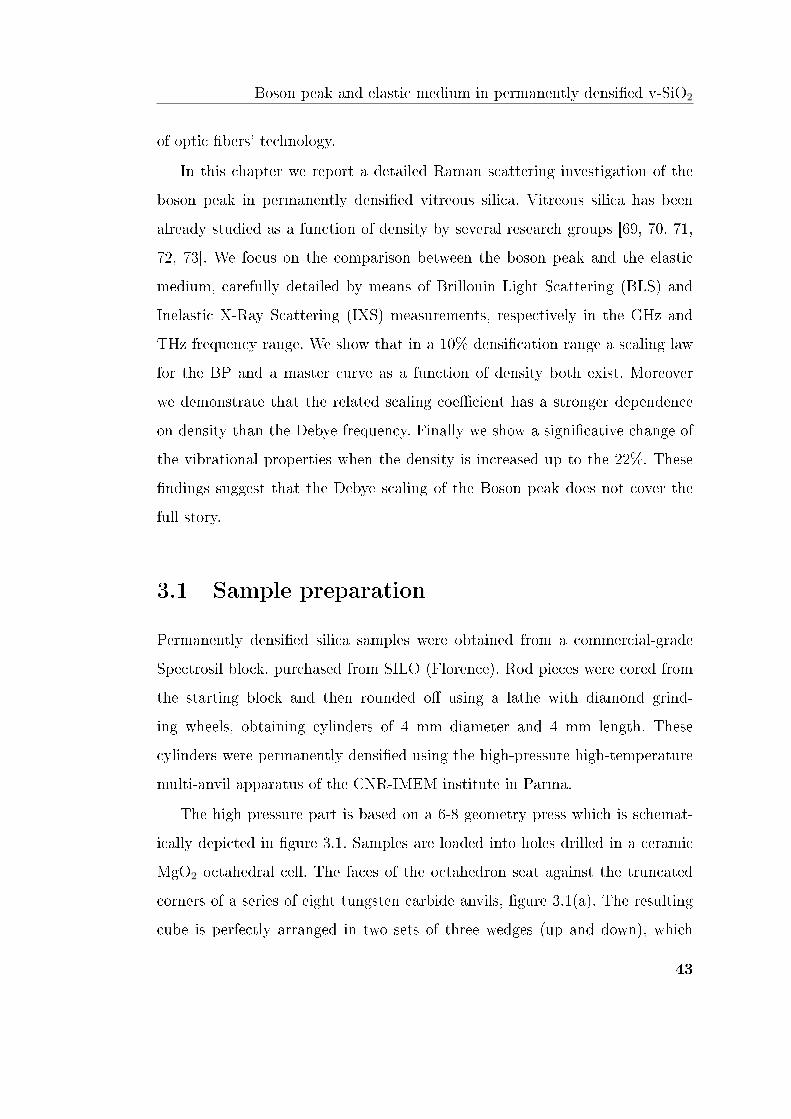
3.6 The end of the story - The breakdown of the Debye scaling . . . 61
4 Medium range order and voids in permanently densied vitre-
ous silica 65
4.1 Positrons and positronium . . . . . . . . . . . . . . . . . . . . . 66
4.2 Positrons in solids . . . . . . . . . . . . . . . . . . . . . . . . . . 68
4.3 Positron Annihilation Lifetime Spectroscopy . . . . . . . . . . . 71
4.3.1 The positron source NEPOMUC . . . . . . . . . . . . . 72
4.3.2 The positron lifetime spectrometer PLEPS . . . . . . . . 73
4.3.3 Experimental setup . . . . . . . . . . . . . . . . . . . . . 74
4.4 Positron Lifetime Spectra . . . . . . . . . . . . . . . . . . . . . 74
4.5 The Tao-Eldrup model . . . . . . . . . . . . . . . . . . . . . . . 80
4.6 Medium range order in permanently densied v-SiO2 . . . . . . 83
4.7 The voids size and the FSDP . . . . . . . . . . . . . . . . . . . 83
ii

CONTENTS
4.8 Density evolution of structural and dynamical quantity . . . . . 87
5 Elastic continuum and microscopic dynamics in glasses 91
5.1 Inelastic X-ray scattering experiments . . . . . . . . . . . . . . . 92
5.1.1 IXS spectra: polycrystal versus glass . . . . . . . . . . . 94
5.2 The determination of Qc . . . . . . . . . . . . . . . . . . . . . . 97
6 A glass exhibiting a crystal-like behavior: the case of SiSe2 101
6.1 Sample preparation: vitreous SixSe1−x . . . . . . . . . . . . . . . 103
6.2 Characterization of the v-SiSe2 . . . . . . . . . . . . . . . . . . 104
6.3 Neutron scattering measurements . . . . . . . . . . . . . . . . . 107
6.3.1 BRISP . . . . . . . . . . . . . . . . . . . . . . . . . . . . 108
6.3.2 TOFTOF . . . . . . . . . . . . . . . . . . . . . . . . . . 110
6.3.3 IN3 . . . . . . . . . . . . . . . . . . . . . . . . . . . . . . 112
6.4 Neutron data analysis . . . . . . . . . . . . . . . . . . . . . . . 113
6.5 Experimental results . . . . . . . . . . . . . . . . . . . . . . . . 115
6.6 Nature of the modes in vitreous SiSe2 . . . . . . . . . . . . . . . 121
6.7 Transverse branches and the boson peak . . . . . . . . . . . . . 129
6.7.1 The Raman light-vibration coupling function . . . . . . . 131
7 Conclusions 133
Bibliography 137
iii
CONTENTS
iv

Introduction
Cumque compleveris legere librum istum,
ligabis ad eum lapidem
et proicies illum in medium Euphraten.
Liber Ieremiae, 51:61
Glasses are the most ancient materials created by Mankind. During the cen-
turies the properties of glasses have been exploited for technological application,
from the optical lens to the optic bers up to the new generation of solid state
memories by also including pharmaceutical and biological application. How-
ever, despite this widespread technological interest, the fundamental properties
of glasses still have an enigmatic nature.
In this work we will face the problem of the vibrational properties of glasses
focusing on the origin and nature of the boson peak (BP). This feature is an
universal characteristic of glasses and a ngerprint of the presence of disorder.
The boson peak appears in the vibrational density of states as an excess of
modes over the Debye prediction. There are two main open questions about the
boson peak: the rst is the nature of the mode forming the peak; the second
concerns the microscopic mechanisms originating this low frequency piling up.
Two samples have been chosen for this study. The rst is permanently densi-
ed vitreous SiO2. Permanent densication has been exploited to tune the glassy
properties focusing on their evolution. Permanently densied vitreous silica has
v

been investigated by means of Raman and Brillouin light scattering as well as
and inelastic X-ray scattering. On the other hand, the evolution of the structure
has been monitored by looking to the diraction pattern and by directly mea-
suring the microscopic arrangement trough positron annihilation spectroscopy.
The second sample is a silicon-selenium glass whose low sound velocity allows
a detailed study of its dynamics by means of neutron inelastic scattering.
The rst two chapters present a brief overview of the glassy state, reviewing
its dynamical and structural properties and a basic outline of inelastic X-ray
and neutron scattering theory. The third chapter is devoted to the study of the
evolution of the boson peak in vitreous silica as a function of density, showing
that its evolution cannot be explained only by means of the elastic medium
transformation. The analysis on this sample is completed in the fourth chapter
where positron lifetime spectroscopy data are presented and we detail a micro-
scopic view of its structural evolution. In the fth chapter a comparison between
SiO− polycrystal and glass at the same density is presented. This strongly sug-
gests an acoustic origin for the BP modes, highlighting the equivalence between
boson peak in glasses and rst Van Hove singularity in crystals. Finally, in the
last chapter, we report on the neutron scattering study on the silicon-selenium
glass SiSe2. This system exhibits a crystal-like dynamics with evidence of the
presence of two transverse acoustic excitations.
vi
Introduction
Acknowledgments
A. Fontana, S. Caponi, E. Moser, L. Orsingher, and F. Rossi
Dipartimento di Fisica, Università di Trento, CNR-IPCF UOS Roma, CNR-IOM Perugia
R.S. Brusa and S. Mariazzi
Dipartimento di Fisica, Università di Trento, CNISM and INFN
G. Baldi
Dipartimento di Fisica, Università di Parma and CNR-IMEM
C. Petrillo, and F. Sacchetti
Dipartimento di Fisica, Università di Perugia and CNR-IOM
G. Ruocco
Dipartimento di Fisica, Università di Roma "Sapienza"
C. Crupi, G. Carini, G. D'Angelo, and G. Tripodo
Dipartimento di Fisica, Università di Messina and CNR-IPCF Messina
C. Masciovecchio
ELETTRA, Trieste
M. Krisch, E. Borissenko, G. Monaco, B. Ruta, and R. Verbeni
European Synchrotron Radiation Facility, Grenoble
A. De Francesco, A. Laloni
Institut Laue Langevin and CNR-IOM, Grenoble
C. Hugenschmidt,G.G. Simeoni, and T. Unruh
Forschungs-Neutronenquelle Heinz Maier-Leibnitz (FRM II), Technische Universität
München, München
W. Egger and L. Ravelli
Institut für Angewandte Physik und Messtechnik, Universität der Bundeswehr, München
E. Gilioli and C. Corradi
CNR-IMEM Parma and Trento
C. Armellini
Fondazione Bruno Kessler, Trento
R. Dal Maschio
Dipartimento di Ingegneria dei Materiali, Università di Trento
vii
viii

Chapter 1
The glassy state
The deepest and most interesting unsolved problem in solid state theory
is probably the theory of the nature of glass and the glass transition.
Whether it will help make better glass is questionable.
P.W. Anderson
The glassy state represents an intermediate state between liquids and crys-
tals. Its structure is characteristic of the instantaneous structure of a liquid,
isotropic and lacking of long range order. However, atoms are constrained to
vibrate around their disordered equilibrium position, so that their dynamics is
characteristic of a solid.
The glassy state is accessed by both Nature and Mankind through many
routes [1, 2]. The most common and conventional process is the steady cooling
of a liquid. The glass is obtained when the cooling liquid passes through the
glass transition, which is actually a temperature region over which the system
falls out of equilibrium, becoming a solid without crystallization, hence a glass.
1

1.1 Supercooled liquids and the glass transition
1.1 Supercooled liquids and the glass transition
By cooling down a liquid below its melting point two phenomena may occur. The
rst process is the crystallization, which takes place at the melting temperature
Tm. The crystal is formed through a process of nucleation and growth, where
atoms or molecules rearrange to form a long range periodic structure [3]. The
occurrence of this solid phase can be checked by looking at the temperature
dependence of extensive thermodynamic variables such as volume and entropy.
Figure 1.1 schematically shows the volume during cooling. In this plot, the
crystallization process is represented as an abrupt drop of the volume occurring
at Tm, which marks a rst order phase transition.
Figure 1.1: Schematic illustration of the change in volume with decreasing tempera-
ture in the case of crystallization and vitrication. The liquid-crystal transition tem-
perature Tm is marked by an abrupt contraction of the volume. Conversely, in the
glass formation process, V (T ) bends to a smaller slope. The region where the slope
change takes place indicates the glass transition temperature Tg.
However, if the cooling rate is fast enough, the crystallization can be avoided
and the liquid can be supercooled below Tm. By lowering the temperature,
2

The glassy state
the shear viscosity increases of many orders of magnitude, from a typical high
temperature liquid value of about 10−4 poise to about 1013. This increase is
shown for many liquids in gure 1.2. The Maxweel relation η = G∞τ , establishes
a relation between the macroscopic viscosity and the microscopic relaxation
time through G∞, the innite frequency shear modulus. Since G∞ is almost
constant, this means that the relaxation time is increasing. The supercooled
liquid equilibrates through atomic and molecular rearrangements; when τ is
increased they became slower and slower until the supercooled liquid is unable
to equilibrate on the experimental timescale. The system falls out of equilibrium
and the glass transition takes place.
Figure 1.2: Variations of the viscosity η with temperature, plotted in Arrhenius form.
The black dashed line represents η = 1013 poise, conventional viscosity for a solid.
Data are from ref. [1].
The structure of the system is frozen in the laboratory timescale and, ex-
cept for thermal vibrations, all atomic motions cease. The glass transition is
represented in gure 1.1 as a continuous break in slope of V (T ). The slope is
the thermal expansion coecient α: at the glass transition it changes from a
liquid-like value to a crystal-like one.
3

1.1 Supercooled liquids and the glass transition
The glass transition temperature Tg lyes at about 2/3Tm [4] and can be
dened in many dierent ways, e.g. as the temperature at which τ ∼ 103 s
[5, 3] or η ∼ 1013 poise [6, 1, 2]. In fact the glass transition takes place over a
temperature region called transformation range. Moreover the glass transition
temperature depends on the thermal history and on the cooling rate. The slower
the cooling rate is and the lower the glass transition temperature is; examples
of this glass transition cooling rate dependence are Tg1 and Tg2 in gure 1.1.
Typically, the dependence of Tg upon cooling rate is relatively weak; an order of
magnitude change in cooling rate may change Tg by only 3-5 K. Notwithstanding
its dependence on cooling rate, Tg is an important material property.
The behavior shown by V (T ) is common to other extensive thermodynamic
observables, like entropy and enthalpy. It suggests that the glass transition can
be interpreted as a second order phase transition in the Ehrenfest sense [7], with
continuity of volume and entropy but discontinuous changes of their derivatives.
However the transition is continuous and cooling-rate dependent, so it cannot
be a genuine phase transition. In fact, the glass transition is a kinetic process
which depends upon the crossing of an experimental time scale and the time
scales for molecular rearrangements [8].
In crystals the motion of the particles consists of vibrations around their
ordered equilibrium position. The system is conned to one absolute minimum
in the phase space. The same description seems to apply to a glass. Atoms
vibrate around their disordered equilibrium position and the system is conned
to a local energy minimum in the phase space. In both crystals and glasses
ergodicity is broken but in glasses this is a dynamical phenomenon only due
to the experimental time scale [3]. A glass can be considered as a liquid which
behaves like a solid, since it continuously approaches the liquid state. As a
consequence, the glass properties are time-dependent. This process is called
aging when it is unwanted and annealing when it is used to remove stresses and
4

The glassy state
control the properties of the material [7].
1.2 Dynamics as Tg is approached: strong and
fragile glassformers
By dening the glass transition temperature as the temperature at which η =
1013 poise, data in gure 1.2 can be reported in the so called Angell plot, gure
1.3 [1, 2]. This Arrhenius representation of the viscosity as a function of a
scaled temperature Tg/T highlights two dierent behaviors. As a matter of fact
a rst class of glassformers displays an Arrhenius behavior, i.e. a straight line in
gure 1.3. Conversely, a second class is characterized by a a quite pronounced
curvature at around Tg/T ' 0.7.
In order to classify dierent glassformers according their viscosity T -behavior
we introduce the so-called fragility parameter, dened as [1]
m = limT→Tg
d log η
dTg/T. (1.1)
Low m glassformers present the Arrhenius behavior, and are called strong. On
the other hand, fragile glassformers show high values of m, which means non-
Arrhenius behavior.
The terminology strong and fragile is not related to the mechanical proper-
ties of the glass; this terms have been chosen to describe the sensitivity to the
liquid structure to a change in temperature [1]. Moreover the fragility parameter
m can be related to the microscopic interactions driving the dynamics of the
system [9]. Strong liquids are characterized by covalent directional bonds and
they typically form three dimensional network structures. Prototype of this class
of materials is SiO2, m = 28 [10]. On the other hand, fragile liquids typically
consist of molecules interacting through non-directional, non-covalent bonding.
The canonical fragile glassformer is the o-terphenyl OTP, m = 81 [10].
5

1.3 Glass structure
Figure 1.3: Tg scaled Arrhenius plots of the viscosity data showing the strong/fragile
pattern of the liquid behavior. Adapted from ref. [1].
1.3 Glass structure
The determination of the atomic arrangement in space represents a key pre-
requisite for any subsequent study devoted to understand any physical and
chemical properties. A striking example are proteins, where their functionalities
are closely related to structural properties.
In crystals the determination of the structure is simplied by the periodicity.
The whole lattice can be considered as a periodic repetition of a fundamental
building block, the unit cell, which is often formed by only few atoms.
In glasses the situation is completely dierent. At the glass transition, ex-
cept for vibrations, atoms are frozen in their instantaneous positions. The glassy
structure is thus the supercooled liquid frozen structure, which is topological
6

The glassy state
Figure 1.4: Bi-dimensional sketch of the structure of both crystalline α-quartz (a)
and vitreous (b) SiO2. Red dots are oxygen atoms while black dots refer to silicon
ones, [11].
disordered, i.e. lacking of any long range periodicity. However, the glassy struc-
ture, even if disordered is far from being stochastic. As a matter of fact, also
amorphous materials show a certain degree of order at some lengthscales. An
example is SiO2 as reported in gure 1.4. Both α-quartz (a) and vitreous sil-
ica (b) show the same coordination polyhedra, but in the glassy case they are
arranged in an aperiodic fashion. The strength and the extension of the or-
der in disordered materials are related to the dierent interactions, e.g. ionic
and metallic glasses are more subject to a chemical and topological constrained
random packing.
1.3.1 Order within disorder
To characterize the order in glassy structures it is useful to address to three
dierent length scales [12]:
• short range order (SRO) in the range 2-5 Å;
• medium range order (MRO) in the range 5-20 Å;
• long range structures (LRS) for length scales > 20 Å.
7

1.4 Characterizing amorphous structure
Short range order involves one atom and its nearest neighbors. In the case
of covalent materials, where direct bondings are dominant, SRO can be charac-
terized in terms of well-dened coordination polyhedra. The SRO is often very
similar to the local ordering in crystals: the number of nearest neighbors, the
bond distances, and the bond angles are rather well dened.
MRO is pragmatically dened as the next highest level of structural organi-
zation beyond SRO. It arises from orientational correlation beyond the nearest
neighbor distances. On a length scale just beyond SRO, 5-10 Å, larger struc-
tural units can be formed aggregating basic polyhedra connected together to
form regular rings or clusters. In a larger length scale, between 10 and 20 Å, a
further level of MRO can be associated with the connection between these struc-
tural units. This order is related to a local dimensionality of covalently bounded
amorphous network. Considering a local dimensionality which arises from the
structural connection, d = 3 corresponds to structural isotropy; lower local di-
mensionalities correspond to layer-like structures (d = 2), chain-like structures
(d = 1) or isolated clusters, whose dimensionality is 0. Rened structural anal-
ysis have recently pointed out on the existence in some network glasses of an
extended range of order [13, 14]. The lengthscale of this chemical order is about
40 Å.
To complete this overview of the order in amorphous materials we consider
the macroscopic length scale. By denition, no long range periodic structures
are present: the LRS is therefore characterized by inhomogeneity and phase
separation.
1.4 Characterizing amorphous structure
The structure of a glass can be studied by means of several techniques. Nutron
or X-ray diraction provides valuable information on the short range order as
8

The glassy state
well as on the medium range. The sought quantity in a diraction experiment
in glass or liquids is the static structure factor, namely:
S (Q) = 1 + 4πρ
∫ ∞0
drr2sin qr
qr[g (r)− 1] , (1.2)
i.e. the Fourier transform of the pair distribution function g (r). This quantity
conveys the probability of nding a particle at a distance r from a certain tagged
particle and it is dened as:
g (r) =1
N
1
4πr2ρ
⟨N∑i
N∑i 6=j
δ (r − rij)
⟩, (1.3)
whereN is the total number of particles, ρ is the density and rij = ‖ri − rj‖. The
analysis of the pair distribution function provides information on the short range
order. For small r the radial distribution function is zero since the electron shells
of two atoms cannot overlap strongly. On the other hand, nearest neighbors
are expected at a certain distance rmin, producing a peak in g (r). Due to the
disorder atoms are not exactly at a distance r, hence the peak width will be
nite. Further coordination shells can be distinguished depending on the system,
but ultimately g (r →∞)→ 1.
A typical diraction pattern for a glass is reported in gure 1.5(a) in the
case of v-GeO2. Figure 1.5(b) shows the diraction spectrum of the liquid v-
GeO2. The two spectra look very similar: liquids and glasses retain almost the
same structural properties [3]: from this point of view the glass transition is
completely unexciting (at least using two points correlation functions [16]).
The rst peak in the static structure factor is called rst sharp diraction
peak (FSDP) and it is considered as the ngerprint of the presence of medium
range order. As a matter of fact, even if every diraction pattern has a rst
peak, this feature is rather peculiar [12, 17]. Firstly it is considerable narrower
than the other peaks and it displays a dierent behavior as a function of both
temperature and pressure [18]. There is, in general, no apparent dierence in the
9

1.4 Characterizing amorphous structure
Figure 1.5: Static structure factor of glassy (a) and liquid (b) GeO2 measured by
means of neutron diraction respectively at T = 350 K and T = 1400 K. The pattern
of the glass is from [15], the liquid one is unpublished.
radial distribution function (RDF) obtained by Fourier transformation of the
scattering data whether or not the FSDP is included in the Fourier transform,
indicating that the peak results from rather subtle medium-range correlations
which are not easily discernible in the g (r) [12]. Many models have been pro-
posed to explain this feature from the existence of crystallites [19], of cages
[17, 20], and voids-clusters chemical ordering [21, 18].
Other techniques to characterize the structure of disordered systems are the
Extended X-ray Absorption Fine Structure (EXAFS), which provides informa-
tion on the environment of a specic atom, and the Nuclear Magnetic Resonance
(NMR), which is also element selective and studies the correlations between an
element and its neighbors. Also Raman scattering can give insights on the struc-
ture of the materials trough the identication of the vibrational bands. More-
over, in this work we will use the Positron Annihilation Lifetime Spectroscopy
(PALS) as a probe for the medium range order, studying the interstitial voids
in the material through the annihilation of the positronium.
10

The glassy state
1.5 Glass dynamics
Atoms in solids execute small oscillations around their equilibrium positions
at every temperature, both at the absolute zero, as a result of zero-point mo-
tion, and at nite temperatures, as a result of thermal uctuations. Below the
glass transition temperature, i.e. in the arrested phase, the glass dynamics is
restricted to these microscopic vibrations which are responsible for the sound
propagation and the heat transfer and other thermodynamic quantities in solids.
1.6 Vibrations in solids
The theory of the dynamical properties of a solid can be treated by recurring
to two approximations. The rst is the adiabatic approximation which allows
to separate the electronic dynamics from the corresponding nuclear one. The
second is the so-called harmonic approximation which is based on the hypothesis
of small nuclear oscillations around the equilibrium positions [22].
The vibrational dynamics of a system of N atoms in positions r is usually
described in adiabatic approximation by an Hamiltonian of the form:
H =1
2
∑αi
mir2αi + V (r1, . . . , rN) , (1.4)
where α indicates a Cartesian coordinate, mi is the mass of the ith-atom, and
V (r1, . . . , rN) is the N -body potential which describes interactions of all atoms
in the solid. The atomic motions is a small displacement u about an equilibrium
position r0, hence ri = r0i + ui. The use of the harmonic approximation can
simplify the problem. As a matter of fact V can be expanded in series of u's
until the rst non-vanishing term, which is the quadratic ones. Therefore we
11

1.6 Vibrations in solids
can write the equations of motion of the system:
miuαi = −∑βj
∂2V
∂uαi∂uβj
∣∣∣∣0
uβj
= −∑βj
Φβjαiuβj. (1.5)
Considering a solution of eq. 1.5 which is periodic in time [23], i.e. uαi (t) =
mieαiexp (iωt), where eαi are time independent; eq. 1.5 may be written as:
ω2eαi =∑βj
Dβjαieβj. (1.6)
The problem is thus reduced to an eigenvalue problems for the 3N ×3N matrix
D, whose elements are:
Dβjαi =
Φβjαi√
mimj
; (1.7)
D is called dynamical matrix and it has 3N real eigenvalues ω2k and ek are the
3N -dimensional 3N eigenvectors.
1.6.1 Vibrations in crystals
In the case of a perfect crystal the situation is simplied using the lattice peri-
odicity. The Bloch theorem allows to restrict the problem to a single unit cell of
r atoms. Moreover the vibrational eigenvectors in a crystal will be plane waves,
labeled by well-dened wave vectors q lying in the rst Brillouin zone.
In a quantum mechanical description, the 3N decoupled collective vibrations
of a crystal can be described in terms of bosonic quasi particles called phonons.
For each allowed q there are 3r real eigenvalues denoted as ω2k (q); the fre-
quencies ωkq are either real for the stability of the lattice. These 3r functions
for each q. can be regarded as branches of a multivalued functions: the relation
ω = ωk (q) is called dispersion relation. In general there are three branches for
which ωk (q) goes to zero which are called acoustic branches. The vibrations of
12

The glassy state
the atoms are in phase. There are one acoustic mode with longitudinal polariza-
tion and two with transverse one. Moreover, if r > 1, there are further 3 (r − 1)
optic branches. These branches tend to a nite value as q approaches zero; if
q = 0 the basis atoms vibrate against each other.
It is worth to note that a theory of the atomic vibrations in harmonic ap-
proximation does not allow to predict the damping of the vibrational excitations
which is due to higher order eects.
1.6.2 Vibrations in glasses
The simple approach outlined in the previous section cannot be extended to
glasses where the periodicity is lost. As a matter of fact the reciprocal lattice
cannot be dened and q is no longer a good quantum number. The eigenvectors
of the dynamical matrix are no longer plane waves; nally, the concept of phonon
loses its original meaning.
A wide variety of models have been proposed to describe the eects of the
disorder in glasses. It has also been claimed that vibrational excitations with
dierent nature can coexist in amorphous materials: propagating, localized and
diusive ones.
Figure 1.6: Schematic representation of the dispersion curve ω (q) of an acoustic
branch in a glass, [24].
The common experience shows that in the macroscopic limit, sound propa-
13

1.6 Vibrations in solids
gate also in a glasses as in corresponding crystals. In fact, averaging on a large
scale, the details of the microscopic arrangement become essentially irrelevant.
At low frequencies, hence in the long wavelenght limit, a glass appears as
an elastic continuum medium and the disorder does not aect the vibrational
dynamics. As q approaches to zero, the vibrational excitations have the charac-
teristic of linearly propagating acoustic waves, with speeds of sound vL and vT
(the two transverse branch are degenerate because of the isotropy).
Increasing the frequency the lack of periodicity does not allow a plane waves
description. However, acoustic phonon-like excitations can be detected up to a
wavelenght comparable with the interparticle separation [25]. On decreasing fur-
ther the wavelenght the atomic motions lose their propagating character giving
rise to a more complex pattern of vibrations.
It has to be underlined that glassy modes in general are more damped than
crystalline ones. Phonon damping arises from terms beyond the second order in
the series expansion of V [26, 27]. The anharmonicity is in fact responsible for
a direct interaction of sound waves with other thermal vibrations causing the
damping through several mechanisms [28]. Moreover, also the disorder causes a
phonon nite lifetime, since a plane wave cannot be an eigenstate of a system
with a non periodic structure [29].
Figure 1.6 schematically shows the dispersion relation for an acoustic branch
in glasses. Increasing the q value the excitation wavelength became shorter and
the local structure is more and more relevant. The well-dened sound waves
transform into a complex pattern of atomic motions that mirrors the structural
disorder. Moreover, although the Brillouin zone is not rigorously dened, the
dispersion relation shows a structure which can be related with the peaks of
the static structure factor S (Q) which are acting as smeared reciprocal lattice
vectors.
14

The glassy state
1.7 The vibrational density of states
To describe the vibrational properties in crystals as well as in disordered systems
we can use the vibrational density of states (VDOS), which is dened as:
g (ω) =∑k
δ (ω − ωk) , (1.8)
where g (ω) dω is the number of states lying between ω and ω + dω.
Figure 1.7: Phonon dispersion relation (a) and phonon density of states VDOS (b)
of diamond. Solid curves show the calculated dispersions. Experimentally, dispersion
relations over the Brillouin zone have been obtained by measurements such as neutron
scattering, electron energy-loss spectroscopy, and x-ray scattering techniques. Data are
from ref. [30].
For crystals the sum over k is over all branches and covers the rst Brillouin
zone. Figure 1.7 shows the relation between the dispersion relation and the
DOS of a crystal. The peaks present in the DOS of a crystal are associated with
the Van Hove singularities, the region where the dispersion curve is at with
∂ω/∂q = 0.
In glasses, the index k in eq. 1.8 is only a label for the vibrational eigenstates.
Moreover, the typical sharpness of the crystalline DOS disappears; Van Hove
15
1.7 The vibrational density of states
singularities are smeared out as a consequence of the nite width of the energy
distribution of vibrational excitation about a given q value.
The vibrational density of states represents the natural link between a mi-
croscopic description of a solids and its macroscopic properties. As a matter of
fact, knowing the g (ω) we can derive thermodynamic properties such as the
heat capacity C and the thermal conductivity κ [31].
1.7.1 The low frequency limit: the Debye model
In 1912 P. Debye proposed a quantum mechanical model to describe the low
temperature specic heat of solids. In the low temperature limit thermally ex-
cited modes have an energy comparable with typical acoustic excitations and
a wavelength greater than the interparticles distance. The solid can thus be
treated as an elastic continuum in which acoustic waves can propagate. The
vibrational excitations of the solid are described by the three acoustic branches
with the same linear dispersion relation ω = vDq. The Debye velocity vD is
obtained averaging the longitudinal and transverse sound velocity, respectively
vL and vT (in an isotropic medium the transverse branches are degenerate). The
Debye velocity is dened as:
3
v3D=
(1
v3L+
2
v3T
). (1.9)
The total number of vibrational modes in the Debye model is 3N , with N
the number of atoms in the system. This constrain on the VDOS denes a
limiting frequency ωD which represents the highest frequency for the acoustic
waves. The VDOS predicted by the model has the following form:
g (ω) =3
ω3D
ω2. (1.10)
The Debye frequency ωD is dened as
ω3D = 6π2ρNv
3D, (1.11)
16

The glassy state
where ρN is the number density. Similarly to ωD it can be dened a Debye
wavevector qD = (2πρN)1/3 which is maximum allowed wavevector for the acous-
tic modes and it corresponds to the typical inverse inter-particle distance of the
system.
The description of the vibrational density of states allows a correct evaluation
of the low temperature specic heat [32]:
cv =12π4
5NKB
(T
ΘD
)3
, (1.12)
where ΘD = ~ωD/KB, and KB the Boltzmann constant.
As already remarked, the Debye model holds rigorously for insulating crys-
talline material. However, since the local atomic arrangement is not considered,
crystals and glasses can be both described within the same approximation. This
would mean that if the temperature is lower than ΘD, the temperature needed
to excite all the acoustic modes, the thermodynamic properties are essentially
the same. Unfortunately this is not the case [33].
Figure 1.8(a) shows that the specic heat cv measured in both crystalline
(α-quartz) and glassy SiO2 [33]. The two systems display a markedly dierent
behavior in the low temperature range. In particular the heat capacity of vit-
reous silica decreases much more slowly with temperature. Crystalline quartz
data follows the Debye ∼ T 3 behavior, eq. 1.12 whereas the specic heat of the
glass deviates from the predictions and can be described adding a linear term,
hence
cv ∼ aT + bT 3. (1.13)
Below 1 K the specic heat is essentially linear in temperature, indicating
a more or less constant density of states in addition to the Debye one. These
behavior is described by the two level system model (TLS). This model assumes
the existence of local structural instabilities of the glass, capable of tunneling
17

1.7 The vibrational density of states
Figure 1.8: (a) measured specic heat for vitreous silica v-SiO2 (red circles) and α-
quartz (blue open squares); (b) specic heat divided to T 3 as for crystals (blue line)
and glass (red line); dashed lines are the Debye model predictions. Data are from ref.
[33].
18

The glassy state
among dierent congurations of the system. The anomalous behavior below 1
K is due to the elastic wave scattering by TLS.
Figure 1.8(b) shows cv/T 3. The glass heat capacity exceeds the crystalline
one, showing a bump at about ∼ 10 K. This bump reects the presence of an
excess of modes in the vibrational density of states. It is worth to note that
even crystals shows a bump in cv/T 3 but it is usually related to the transverse
acoustic vibrational excitations near the boundary of the rst Brillouin zone.
1.7.2 The excess of vibrational states and the boson peak
The vibrational density of states g (ω) is directly accessible by means of Raman
scattering, inelastic neutron scattering (INS), inelastic X-ray scattering (IXS),
and nuclear inelastic scattering (NIS). Figure 1.9 show the VDOS measured
in vitreous silica by means of inelastic neutron scattering [34]. Comparing the
experimental data (red bullets) to the Debye prediction (dashed line), an excess
of low energy modes is visible. This excess becomes more evident when we
consider the reduced density of states g (ω) /ω2, reported in g. 1.9. In this
plot, the Debye VDOS, which is proportional to ω2, is a constant. On the other
hand the glass shows a broad peak which is named boson peak (BP).
The boson peak is an universal behavior of glasses and supercooled liquid
and it is responsible for the low temperature anomalies in the thermodynamic
properties. Furthermore its importance goes beyond the physics of glasses. As a
matter of fact the boson peak is a common feature of broad class of substances
characterized by disorder, e.g. polymers, colloids and biologic material [35, 36].
1.7.3 Theoretical model for the boson peak
Despite of a large theoretical, computational and experimental eorts the ex-
planation of the BP is still an open and debated topic. The main problems can
19

1.7 The vibrational density of states
Figure 1.9: Vibrational density of states (a) and reduced vibrational density of states
(b) measured in vitreous silica v-SiO2 by means of neutron inelastic scattering [34].
The dashed line is the Debye level.
be summarized in two questions:
• What is the nature of the vibrational modes in the boson peak region?
• What is the origin of the low frequency pilling up of the modes?
In the following we present a brief review of the approaches used to explain
the BP. It is worth noting that even starting from dierent and often incompati-
ble assumptions, these model prodictions are qualitatively similar. It is therefore
dicult to setup experiments able to discriminate between dierent model.
Dynamical disorder A rst class of models that describes the boson peak is
based on the presence of dynamical disorder in the glass.
In the model proposed by Taraskin and co-worker atoms occupy crystalline
sites and the system is described as formed by coupled harmonic oscillators inter-
acting through random independent elastic force constants Kij whose strength
uctuates according a probability distribution P (Kij) [37]. On increasing the
width of the distribution P (Kij), the system becomes unstable, thus with neg-
ative force constants Kij , and this instability gives rise to the well know excess
of modes in the vibrational density of state. Wider is the distribution, stronger
20

The glassy state
the BP will be. In this approach the excess in the reduced VDOS is associated
with the lowest van Hove singularity in the spectrum of the reference crystalline
system, although the disorder causes its broadening and a downwards shift in
energy. The vibrational modes originating the lowest van Hove singularity in
the crystal are also those responsible for the boson-peak in the corresponding
glass. In general, they seem to be related to transverse branches. A more recent
model proposed by Schirmacher and co-workers [38, 39, 40] is based on a macro-
scopic tensorial elastic and lattice-independent approach. The model assump-
tion is that the disorder leads to microscopic random spatial uctuations of the
transverse elastic constant (shear modulus) whose variance is proportional to a
disordered parameter γ. The DOS excess arises from a band of disorder induced
irregular vibrational states, the onset of which approaches lower frequencies as
the disorder is increased. The model predicts also a strict correlation between
the excess in the vibrational density of states and the sound damping of the
acoustic waves present in the corresponding energy range.
Euclidean Random Matrix Euclidean Random Matrix models should not
be included in the HRM class, even if they are developed in the harmonic
approximation. As a matter of fact the model deals directly with a topological
disordered solid. The Euclidean random matrix provides a theoretical framework
to treat the problem of the topological disorder, where the interactions cannot
be split in an ordered part plus a disorder dependent contribution [41]. This
model supports the idea that the boson peak marks the transition between
acoustic like excitations and a disorder dominated regime for the vibrational
spectrum.
Soft Potential Model The Soft Potential Model (SPM) assumes the exis-
tence of additional quasi-local vibrations (QLV) that interact with the sound
21

1.7 The vibrational density of states
waves, giving rise to the boson peak [42, 43, 44]. This model can be considered
as an extension at higher temperature of the two level system model (TLS),
describing the thermal anomalies of glasses below 1 K.
QLV are additional non acoustic modes characterized by a large vibrational
amplitude of some group of atoms. The physical origin of these modes can be
traced to local irregularities of the amorphous structure, or to low-lying optical
modes in parental crystals. The disorder destroys the long range coherence of
these optical modes so they are indistinguishable from quasi-local modes. The
vibrational density of states of QLV's cannot be arbitrary, depending only on
the particulars of the glass. QLV's can be described as low frequency harmonic
oscillators which weakly couple to the sound waves of the elastic continuum
medium. This coupling leads to a dipole-dipole interaction between dierent
harmonic oscillators. The interaction between harmonic oscillators give rise to
a g (ω) which is a universal function at low frequency [44]. This universality
derives from the vibrational instability of the spectrum due to the interacting
harmonic oscillators. For ωc < ωD, anharmonicity stabilizes the system in a new
minimum thus it reconstructs the VDOS in a new spectrum. As a nal result
g (ω) /ω2 shows a maximum without a peak in the density of states.
In the SPM, the boson peak energy depends on the interaction strength
among the dierent HO's. The stronger the interaction, the higher is the energy
of the boson peak maximum. The weak coupling between QLV's and acoustic
modes and the continuum medium avoids any inuence of the localized modes
on the acoustic properties of the system. In this way the model is able to explain
both boson peak and acoustic features. Moreover, a recent work pointed out a
direct link between boson peak and two-level systems: the raising of a peak in
the reduced vibrational density of states seems to inevitably lead to the creation
of two-level systems and vice versa [43]
22

The glassy state
Inhomogeneous cohesion Another approach consists on ascribing the BP
to the inhomogeneous cohesion of glasses at the nanometric scale [45].
In this case the system is assumed to consist of an aggregate of "regions"
with dierent elastic constants. The material is characterized by more cohesive
domains separated by softer interdomain zones on the nanometric spatial range.
The boson peak arises from vibrational modes spatially localized in such regions.
In particular, the excess of modes in the VDOS is viewed as the signature of the
hybridization of acoustic modes with localized ones, inherent to the elastic het-
erogeneities. The heterogeneous elastic response at the nano-scale can possibly
be related to the existence of dynamical heterogeneities observed in supercooled
liquids above the glass [16]. Cohesion heterogeneities in glasses would originate
from the mobility heterogeneities in the supercooled state conserved during the
glass transition. Spatially correlated dynamics of the molecules in the melt is
somehow "frozen in" at the glass transition, and leads to the creation of softer
and harder zones in the glassy phase. Conversely the existence of elastic inho-
mogeneities in the mesoscopic spatial range does not imply automatically the
existence of visible static density inhomogeneities. As a matter of fact, elasticity
uctuation can correspond to a negligible density uctuation [45].
Spatially correlated modes The boson peak has been suggested to reect a
crossover from long wavelength vibrations propagating in the continuous media
to localized vibrations on a characteristic length scale of R ∼ 10 Å. This length
has been interpreted as the correlation length for the disordered structure of
the system [46, 47]. The energy of the peak result to be inversely proportional
to the size of these spatial correlated regions, ωBP ∼ 1/R. This correlation
length R has been connected to the medium range order extension as obtained
considering the width or the position of the rst sharp diraction peak of the
glass [46].
23

1.7 The vibrational density of states
24

Chapter 2
Experimental probes: X-ray and
neutrons
Experiments must be reproducible.
They should all fail in the same way.
Finagle's third law
The study of the dynamics of a solid can be approached by perturbing the
equilibrium of the system by an external force and recording its reaction, i.e. the
relaxation to the equilibrium state. Paying attention that the perturbation does
not alter too much the properties of the system it is possible to get information
of the forces acting in the system.
The reliability of an experimental technique which follows this procedure is
based on the theorem of the linear response which states the equivalence between
the response of the system in regime of small perturbation (linear response) and
the spontaneous uctuations in absence of perturbation [48].
The atomic dynamics can be investigated by means of inelastic scattering
techniques. In an inelastic scattering experiment the measured signal is de-
termined by the double dierential scattering cross section. This conveys the
25

2.1 Inelastic X-ray scattering
fraction of the incident probe with energy Ei and wavevector ki which is scat-
tered into an element of solid angle dΩ, in direction given by kf , with an energy
between Ef and Ef + dEf . The cross section has the dimensions of an area and
it is denoted by
d2σ
dΩdEf(2.1)
Within the linear response theory the cross section can be written quite
generally as the product of three terms which describe:
1. the intensity of the probe-sample coupling (independent from the energy
of the incident particle);
2. the phase-space volumes of the incident and scattered particles;
3. the space and time Fourier transform of the correlation function of the
observable in the system which couples to the probe.
The last term contains the information related to the elementary excitations
characteristic of the system.
In this chapter we will briey outline the basic theory of both inelastic
X-ray scattering (IXS) [49, 50, 51, 52] and inelastic neutron scattering (INS)
[48, 24, 53, 54]. Moreover we will derive an expression for the main quantity
involved in this study, namely the static structure factor [51].
2.1 Inelastic X-ray scattering
Inelastic X-ray scattering is a relatively new inelastic technique. As a matter of
fact the main limitation to the development of this technique was extremely high
energy resolution. Photons with a wavelength of λ = 0.1 nm have an energy of
about 12 keV. Therefore, the study of phonon excitations in condensed matter
26

Experimental probes: X-ray and neutrons
is necessary a resolution better than ∆E/E ∼ 10−7. However, once overcome
these technical diculties, IXS provides a powerful investigation tool.
In a typical inelastic X-ray scattering experiment the incident photon with
energy Ei, wavevector ki and a polarization εi is scattered by the sample and
collected at an angle ϑ within a solid angle dΩ. The scattered photon energy,
wavevector and polarization are Ef , kf , and εf .
The energy and momentum conservation impose that:
~ω = Ef − Ei; Q = kf − ki; (2.2)
The relation between momentum and energy in the case of photons is given by
E = c~k, where c is the speed of light. We can write:
Q2 = k2i + k2f − kikf cosϑ/2
= k2i
[1 +
(1− E
Ei
)2
− 2
(1− E
Ei
)cosϑ
]. (2.3)
Considering that the exchanged energy associated to phonon-like excitations
is ∼meV, always smaller than the energy of the incident photons ∼KeV, 2.3
becomes:
Q = 2ki sinϑ/2, (2.4)
i.e. the ratio between the exchanged momentum and the incident photon mo-
mentum is completely determined by the scattering angle ϑ.
2.1.1 X-ray inelastic scattering cross section
In the weak relativistic limit the Hamiltonian describing the electron-photon
interaction consists of four terms. If we neglect resonance phenomena close to X-
ray absorption thresholds, the much weaker magnetic couplings, and the direct
photon-nucleus coupling the Hamiltonian reduces to the Thomson interaction
27

2.1 Inelastic X-ray scattering
term, i.e.
Hint =1
2r0∑j
A2 (ri, t) , (2.5)
where r0 = e2/mec2 is the classical electron radius, e and me the charge and the
rest mass of the electron; A (ri, t) is the electromagnetic eld vector potential
in the ri, coordinate of the ith electron. The sum extends over all the electrons
in the system.
In a scattering process, where a photon of energy Ei, wavevector ki, and
polarization εi, is scattered into a nal state of energy Ef , wavevector kf , and
polarization εf , and the electron system goes from the initial state |I〉 to the
nal state |F 〉. The double dierential cross section can be written as
d2σ
dΩdEf=dPi→fdt
1
jρs (E) , (2.6)
where ρs (E) is the density of states of scattering angle, j the incident current
density and dPi→f/dt is the probability rate per sample and probe unit that
a probe particle makes the transition from the initial to the nal state [55].
The transition of the incident particle between i and f involves many possible
elementary excitations in the sample. Indicating dPi,|I〉→f,|F 〉/dt the scattering
probability involving the transition in the sample, the total probability can be
expressed as a sum over the initial and nal states. The transition probability
can be calculated from the perturbation theory using the Fermi's golden rule.
Assuming that the initial and nal photon states are plane waves, one gets:
d2σ
dΩdEf= r20
kfki
(εf · εi)2∑I,F
PI
∣∣∣∣∣〈F |∑i
eiQ·ri |I〉
∣∣∣∣∣2
δ (~ω − Ef + Ei) , (2.7)
where PI is the statistical weight, i.e. the equilibrium population of the initial
states.
The double dierential cross section in eq. 2.7 contains the correlation func-
tion of the electron density. The correlation function of the atomic density
28

Experimental probes: X-ray and neutrons
can by obtained assuming that the adiabatic approximation holds. The adi-
abatic approximation allows the separation of the system quantum state |S〉
into the product of a nuclear part |Sn〉 and an electronic part, |Se〉, which de-
pends only parametrically by the coordinates of the nuclei. We can thus write
|S〉 = |Sn〉 |Se〉. This approximation is particularly good for exchanged energies
that are small with respect to the excitations energies of electrons in bound
core states. In metals, this approximation, one neglects the portion of the total
electron density in proximity of the Fermi level. Moreover we consider only the
case in which the electronic part of the total wave function is not changed by
the scattering process. The dierences between the initial state and the nal
state are only due to excitations associated with atomic density uctuations.
Equation 2.7 can be rewritten as:
d2σ
dΩdEf= r20
kfki
(εf · εi)2∑In,Fn
PIn
∣∣∣∣∣〈Fn|∑i
fi (Q) eiQ·ri |In〉
∣∣∣∣∣2
δ (~ω − Ef + Ei) ,
(2.8)
where fk (Q) is atomic form factor of the ith atom with position vector Ri. The
states |In〉 and |Fn〉 are the initial and nal nuclear state. Assuming that all the
scattering units are equal, eq. 2.8 becomes:
d2σ
dΩdEf= r20
kfki
(εf · εi)2 |f (Q)|2 S (Q, ω) , (2.9)
where (dσ/dΩ)T = r20
(kfki
)(εf · εi)2 is the Thomson scattering cross section and
S (Q,ω) is the dynamic structure factor, i.e.
S (Q, ω) =1
2π~N
∫ +∞
∞dteiωt
⟨∑ij
eiQ·ri(t)e−iQ·rj(0)
⟩(2.10)
where 〈. . .〉 is the thermal average.
In the limit Q→ 0 the form factor f (Q) is equal to the number of electrons
in the scattering atom. Increasing Q, f (Q) decreases almost exponentially. The
29

2.2 Inelastic neutron scattering
decay constant is determined by the size of the radial distribution of the electrons
in the atomic shells of the considered atom.
The double dierential cross-section of equation 2.9 is valid for a system
composed of a single atomic species. This derivation can be generalized to molec-
ular or crystalline systems by substituting the atomic form factor with either
the molecular form factor or the elementary cell form factor. If the system is
multi-component and disordered, the factorization is not straightforward and
it is possible only assuming some distribution among the dierent atoms. In
the limit case of a completely random distribution, an incoherent contribution
appears in the X-ray scattering cross-section [50].
2.2 Inelastic neutron scattering
Neutrons are subnuclear massive particles with zero electrical charge. Neutrons
interact with matter mainly via nuclear interaction and they are a perfect probe
to investigate the matter. In fact, the energy of neutrons with wavelengths of
the order of inter-particle distances is about 100 meV, and therefore comparable
to the energy of collective excitations.
We consider the scattering of unpolarized neutrons. The energy and momen-
tum conservation impose that:
~ω = Ei − Ef ; Q = kf − ki; (2.11)
For neutrons, i.e. massive particles, the relation between momentum and
energy is given by E = ~k2i /2mn, where mn is the neutron mass. This leads:
Q2 = k2i + k2f − kikf cosϑ/2
= k2i
[1 +
(1− E
Ei
)− 2 cosϑ
√1− E
Ei
](2.12)
Equation 2.12 imposes limitations to the region of the (Q,E) plane which can
be explored in a neutron inelastic scattering experiment. The kinematic region
30

Experimental probes: X-ray and neutrons
accessible to INS is reported in gure 2.1. Neutron scattering experiments have
to face these limitations. As a matter of fact, in the case of acoustic excitation
propagating with the dispersion relation E = vs~Q, the neutron technique can
be applied only if vn > vs where vn is the incident neutron velocity.
Figure 2.1: Kinematic region accessible to INS.
2.2.1 Neutron inelastic scattering cross section
The double dierential cross-section can be determined in the framework of the
rst order perturbation theory on the basis of the Fermi golden rule [48]. The
initial state of the system composed by the incident neutron and the target is,
|I〉 = |ki, λ〉 ≡ |ki〉 |λ〉. The state of the neutron is a plane wave labeled with ki,
whereas the system is labeled with λ. The states |λ〉 form a complete set with
the closure relation∑
λ |λ〉 〈λ| = 1.
The double dierential cross section can be written as
d2σ
dΩdEf=kfki
∑λ,λ′
Pλ
∣∣∣〈kfλf | V |kiλi〉∣∣∣2 δ (~ω − Eλ + Eλ′), (2.13)
31

2.2 Inelastic neutron scattering
where V is the interaction potential that causes the transition and Eλ Eλ′ as-
sociated with the target initial and nal states respectively. Pλ represents the
probability of nding the system in the initial state I. The horizontal bar stands
for the any relevant averages over and above those included in the weights Pλ,
e.g. the distribution of isotopes, the nuclear spin orientation, or the precise
positions of the nuclei.
Neutrons interact with matter both via nuclear and magnetic interactions
but, for our purposes, we can neglect the magnetic term considering only the
interaction between neutrons and nuclei. Even if a complete theory for the
nucleon-nucleon interaction is still lacking we can write the interaction using
the so-called Fermi pseudo potential:
V (r) =2π~2
mn
bδ (r−R) (2.14)
where R is the position of the nucleus and b the scattering length of the atom. It
is worth to note that this expression is only a mathematical description ensuring
that using the Born approximation the scattering is isotropic and thus described
by the single parameter b. Indeed, perturbation theory is inapplicable to the
scattering of a neutron by a nucleus because, although the potential has a very
short range (∼ 10−15 m), it is very strong. The Fermi pseudo-potential does not
correspond to the actual nuclear potential, it is a formal artice dened to give,
in the Born approximation, what is correct for s-wave scattering.
Considering a system of atoms in the positions R with Ri the position of
the ith nucleus. The Fermi pseudo potential can be written as [48]:( mn
2π~2)V (r) =
∑i
Viδ (r−Ri) (2.15)
If we sobstitute 2.15 into 2.13, the double dierential cross section becomes:
d2σ
dΩdE=kfki
∑λ,λ′
Pλ
∣∣∣∣∣〈λ′|∑i
Vi (Q) e(iQ·Ri) |λ〉
∣∣∣∣∣2
δ (~ω + Eλ − Eλ′). (2.16)
32

Experimental probes: X-ray and neutrons
where
Vi (Q) =
∫dr exp (iQ · r) V (r) , (2.17)
so that
〈kf | V |ki〉 =∑i
Vi (Q) exp (iQ · r) . (2.18)
Writing the δ-function in its integral form and using the Heisenberg operator
property, O (t) = eitH/~Oe−itH/~, equation 2.16 can be written as:
d2σ
dΩdEf=
kfki
1
2π~
∫ ∞−∞
dte−iωt
×∑i,j
⟨e(−iQ·Ri)V ∗i (Q) Vj (Q, t) e(−iQ·Rj(t))
⟩. (2.19)
Where the sux ∗ indicates the complex conjugate and the angular brackets
〈. . .〉 the thermal average of the enclosed quantity. R (0) ≡ R If the average
denoted by the horizontal bar is independent on the thermal average, eq. 2.19
can be written as
d2σ
dΩdEf=kfki
1
2π~
∫ ∞∞
dte−itω∑i,j
V ∗j (Q) Vi (Q)⟨e(−iQ·Ri)e(−iQ·Rj(t))
⟩. (2.20)
For a monoatomic target sample
V ∗j (Q) Vi (Q) = b∗i bj =∣∣b∣∣2 + δij
[|b|2 −
∣∣b∣∣2] . (2.21)
The average of the scattering length bi over all isotopes and spin is called co-
herent scattering length; conversely the mean square deviation of bi from its
average value is known as the incoherent scattering length, thus:
∣∣b∣∣2 = b2coh = σcoh4π
; |b|2 −∣∣b∣∣2 = b2inc = σinc
4π. (2.22)
Therefore, it is possible to separate the coherent and the incoherent contribution
33

2.2 Inelastic neutron scattering
to the scattering cross section being:
∑i,j
V ∗j (Q) Vi (Q)⟨e(−iQ·Ri)e(−iQ·Rj(t))
⟩=
∑i,j
b∗i bj
⟨e(−iQ·Ri)e
(−iQ· ˆRj(t)
)⟩=
∑i,j
σcoh4π
⟨e(−iQ·Ri)e(−iQ·Rj(t))
⟩+
∑i
σinc4π
⟨e(−iQ·Ri)e(−iQ·Rj(t))
⟩(2.23)
In this way the double dierential cross section of eq. 2.20 becomes
d2σ
dΩdEf=
kfki
σcoh4π
S (Q, ω) +σinc4π
Si (Q, ω). (2.24)
The functions S (Q,ω) and Ss (Q,ω) are the so called dynamic structure factor,
and dynamic self structure factor dened as
S (Q, ω) =1
2π~N
∫ ∞∞
dte−itω∑i,j
⟨e(−iQ·Ri)e(−iQ·Rj(t))
⟩;
(2.25)
Ss (Q, ω) =1
2π~N
∫ ∞∞
dte−itω∑i
⟨e(−iQ·Ri)e(−iQ·Rj(t))
⟩. (2.26)
In the case of coherent nuclear scattering, the interaction potential couples the
neutron to the density of the target system. The coherent scattering cross section
gives information on the collective motions of the atoms thus on the wavevec-
tors and frequency of the vibrational modes, and allows to map the dispersion
relation in the (Q, ω) space. On the other hand the incoherent gives informa-
tion on the single particle dynamics trough the dynamic structure factor self.
It is worth to note that in the limit of large Q which corresponds to short
wavelenghts, coherent processes are minimal so that S (Q, ω) = Ss (Q, ω).
34

Experimental probes: X-ray and neutrons
2.2.2 Scattering from nuclei undergoing harmonic vibra-
tions
Let us assume time dependent positions of the N atoms of the system. The time
dependent atomic position of the ith atom Ri is the sum of equilibrium position
r0i and displacement ui (t),
Ri (t) = r0i + ui (t) . (2.27)
Sobstuting 2.27 in 2.20 we obtain:
d2σ
dΩdEf=
kfki
1
2π~
∫ ∞∞
dte−itω∑i,j
b∗i bj
⟨e(−iQ·Ri)e(−iQ·Rj(t))
⟩=
kfki
1
2π~∑i,j
b∗i bje−iQ·(r0i−r0j)
∫ ∞∞
dte−itω⟨e(−iQ·ui)e(iQ·uj(t))
⟩(2.28)
In the harmonic approximation, using the Bloch identity for the argument of
the integral, we can shift the average to the exponent:
〈exp (−iQ ·Ri) exp (iQ ·Rj (t))〉 = e−Wie−Wje〈(Q·ui)(Q·uj(t))〉
= e−2W e〈(Q·ui)(Q·uj(t))〉 (2.29)
The exponent Wi is called Debye-Waller factor. It is equal to 12
⟨(Q · ui)2
⟩pro-
vided that the atomic displacements follow a Gaussian distribution. In a cubic
symmetry the average is 16Q2 〈u〉2 and this result is a fair approximation also for
isotropic systems. The mean square displacement can be used as an indicator
of the non harmonic behavior of the material or of the existence of relaxational
phenomena, e.g. [15]. Moreover is directly connected with the density of states
g (ω), ⟨u2⟩
=~
2m
∫ ∞∞
g (ω)
ω[2n (ω, T ) + 1] dω (2.30)
where m is the molecular mass and n (ω, T ) the Bose factor.
35

2.2 Inelastic neutron scattering
We can separate the coherent and the incoherent contribution to the dier-
ential neutron scattering cross section:(d2σ
dΩdEf
)coh
=kfki
1
2π~e−2W
σcoh4π
∑ij
e−iQ·(r0i−r0j)
∫ ∞∞
dte−iωte〈Q·uiQ·uj(t)〉;
(2.31)
(d2σ
dΩdEf
)inc
=kfki
1
2π~e−2W
σinc4π
∑i
∫ ∞∞
dte−iωte〈Q·uiQ·ui(t)〉.
(2.32)
If we expand the exponential of eq. 2.29:
e〈(Q·ui)(Q·uj(t))〉 = e〈UV 〉 = 1 + 〈UV 〉+2〈UV 〉2 + . . . . (2.33)
The rst term in eq. 2.33 corresponds to the elastic scattering and the second
one to one-phonon scattering events. Further terms correspond to multiphonon
eects and can be considered as a small correction.
The coherent one phonon cross section for a Bravais lattice reads:(d2σ
dΩdEf
)1p
coh
=σcoh4π
kfki
(2π)2
2mv0
∑G
e−2WQ∑i,q
|Q · ej (q)|2
ωj (q)
× [nj (q) δ (ω + ωj (q)) δ (Q+ q−G)
+ nj (q+ 1) δ (ω − ωj (q)) δ (Q− q−G)] . (2.34)
The cross section 2.34 is the sum of two terms. The rst, which contains the ex-
pression δ (ω + ωj (q)) δ (Q+ q−G), represents a scattering process in which
one phonon is annihilated. On the other hand, the second term, containing
δ (ω − ωj (q)) δ (Q− q−G), represents a process in which one phonon is cre-
ated. The two δ-functions imply that the scattering obeys to the conditions:
~ω = Ef − Ei; G = Q+ q; (2.35)
36

Experimental probes: X-ray and neutrons
with q lying in the First Brillouin Zone and G a vector of the reciprocal lattice.
These conservation conditions imply that the coherent scattering yields infor-
mation on the wave-vector and the frequency of the vibrational normal modes,
permitting to map the dispersion relations in the (Q, E) space.
On the other hand, the incoherent scattering cross section directly measures
the vibrational density of states g (ω). In fact, the one-phonon incoherent cross
section reads:(d2σ
dΩdEf
)1p
inc
=σinc4π
kfki
N
mQ2e−2WQ g (ω)
ω[n (ω) + 1] . (2.36)
Equation 2.36 means that it is possible to obtain information on the VDOS of a
system by measurin the incoherent contribution to the scattering cross section.
2.3 The dynamic structure factor
In this section we will derive an expression for the dynamic structure factor in
disorder systems [56, 57, 51].
Let us start from some basic denition. The microscopic number density
ρn (r, t) of a system of N point particles is dened as
ρn (r, t) =∑i
δr− ri (t). (2.37)
Its mean value is the mean number density ρN = N/V where V is the volume
occupied by the system. The relevant quantity is the density uctuation,
δρn (r, t) = ρn (r, t)− ρn, (2.38)
i.e. the dierence between the number density and its mean value. The space
Fourier transform of the density reads:
ρn (Q, t) =∑i
eiQ·ri(t), (2.39)
37

2.3 The dynamic structure factor
The time correlation function associated with the dynamics of density uctua-
tion is called intermediate scattering function and it is dened as:
F (Q, t) =1
N〈δρ∗n (Q, 0) δρn (Q, t)〉 , (2.40)
and its time Fourier transform is the dynamic structure factor S (Q, ω)
S (Q, ω) =1
2π
∫ ∞−∞
eiωtF (Q, t) . (2.41)
The value of the intermediate scattering function at t = 0 equals the integral
over the frequency of S (Q,ω) that is the static structure factor S (Q) which is
discussed in section 1.4. It is often convenient to dene a normalized correlation
function as
φ (Q, ω) =F (Q, t)
S (Q), (2.42)
which is called relaxation function.
The coecients of the Taylor expansion in time of φ (Q, t) are called the
normalized frequency moments ω2n0 (q):
ω2n0 (q) = (−1)n
d2nφ (q, t)
dt2n
∣∣∣∣t=0
=
∫ ∞infty
dωω2nS (Q, ω) (2.43)
In the classical limit all odd moments are zero because the dynamic structure
factor is symmetrical in frequency. The other moments dene a set of sum rules
that constitute a group of constrains for a theory aiming to a correct description
of the dynamics.
In the framework of the generalized hydrodynamic theory the evolution of
F (Q, t) is given by the Langevin equation [5, 56, 51]
F (Q, t) + ω2F (Q, t) +
∫ t
0
m (Q, t− t′) F (Q, t′) dt′ = 0, (2.44)
where ω20 = KBTQ/mS (Q) and m (Q, t) is the memory function. By Fourier
transformation of eq. 2.44 we obtain
S (Q, t) =1
πS (Q)
ω20m′ (Q,ω)
[ω2 − ω20 + ωm′′ (Q,ω)]
2+ [ωm′ (Q,ω)]2
, (2.45)
38

Experimental probes: X-ray and neutrons
where m′ (Q,ω) and m′′ (Q,ω) are the real and imaginary parts of the time
Fourier transform of the memory function.
A rst guess for the memory function m (Q, t) is the so called Markov ap-
proximation,
m (Q, t) = Γ (Q) δ (t) . (2.46)
This leads to a damped harmonic oscillator (DHO) model for the dynamic
structure factor. When the ration Γ/ω0 is suciently small the DHO function
is characterized by two side peaks with FWHM ∼ Γ (Q)
The crude Markov approximation can be improved considering the relax-
ation processes in a glass. These can often be divided into two main classes,
associated to two dierent relaxation times. The structural relaxation processes
(α) are associated with a relaxation time τα that in a glass can be on the time
scale of centuries. This corresponds to the limit ωτα 1 which is certainly
reached. On the contrary microscopic processes with timescale τµ are faster.
Considering this two relaxation processes scenario the memory function can be
considered as the sum of two contributions: a constant and very fast decay. The
constant reects contribution of the frozen α relaxation. On the other hand the
contribution of these microscopic processes for τµ → 0 can be described by the
Markov approximation considering a δ-function. The memory function can be
thus written:
m (Q, t) = 2Γ (Q) δ (t) + ∆2α (Q) , (2.47)
where 2Γ (Q) and ∆2 (Q) which represent respectively the areas of the instan-
taneous process and the long time limit of m (Q, t). Equation 2.45 reduces to
S (Q,ω) = S (Q)
[fQδ (ω) + (1− fQ)
1
π
Ω2 (Q) Γ (Q)
(ω2 − Ω2 (Q))2 + ω2Γ2 (Q)
], (2.48)
where
Ω (Q) =√
∆2α (Q) + ω2
0; fQ = 1− ω20/Ω
2 (Q) . (2.49)
39

2.3 The dynamic structure factor
The spectral shape 2.48 can be considered as a reasonable approximation
for the dynamic structure factor of glasses well below the glass transition tem-
perature. In this approach the thermal uctuations have been neglected so that
we may speak of an harmonic glass approximation. The central line accounts
for a fraction fQ of the total intensity. The parameter fQ is the so called non
ergodicity factor. Moreover, equation 2.48 fullls the rst two sum rule:∫dωS (Q,ω) = S (Q) ; (2.50)
∫dωω2S (Q,ω) =
KBT
MQ2. (2.51)
Equation 2.48 is obtained in a classical approach. To account for the quantum
dynamic behavior of the real structure factor we have to correct the classical
S (Q,ω) writing:
Sq (Q,ω) =~ωKBT
[n (ω, T ) + 1]S (Q, t) , (2.52)
where n (ω, T ) is the Bose-Einstein factor.
Equation 2.52 fullls the detailed balance condition [48]:
Sq (Q,−ω) = exp
(~ωKBT
)Sq (Q,−ω) . (2.53)
40

Chapter 3
Boson peak and elastic medium in
permanently densied v-SiO2
It is well known that soluble models are not realistic
and realistic models are not soluble.
G. Parisi
In this chapter we present a study of the densication eects on the vibrational
density of states of the prototypical strong glass v-SiO2. In particular, we focus
our eorts on the investigation of the boson peak, i.e. the characteristic excess
of low energy modes above the Debye level, whose phenomenology has already
been introduced in section 1.7.2.
An eective approach in order to gather information on the origin of the
boson peak and on the nature of its modes, is the investigation of its evolution
as a function of thermodynamical parameters like temperature [58, 59, 60, 61]
and pressure [62, 36, 63]. In general, an increase of the system density gives rise
to a shift of the BP towards higher frequencies and at the same time to a simul-
taneous decrease of its intensity. This has been observed also in a permanently
densied glass [64, 65, 66] and during the chemical vitrication process of an
41

epoxy-amine mixture, where the system evolves with the reaction time [67].
All these studies have shown that the BP intensity variation is closely related
to its frequency shift. This nding is highlighted by the existence of a master
curve that has also been theoretically predicted [41]. When this master curve
holds [65, 68] the intensity variation is only apparent and it is due to the BP
shift, whose physical origin is still the open problem.
The need for a satisfactory explanation of the BP evolution encompassed in
an universal scaling law started with the investigation of its position. A rst
guess is obtained treating the system as an elastic medium which evolves as a
function of the external parameters and is characterized by the Debye frequency
ωD. Within this framework we disentangle the contribution of the excess, which
is assumed to be constant, and the elastic medium evolution, which causes the
boson peak evolution. This approach has been widely used providing conicting
results. As a matter of fact it works properly in sodium silicate glasses studied as
a function of both temperature and density [64, 59] and in the chemical vitriing
system DGEBA-DETA [67]. Conversely it does not work in vitreous silica as a
function of temperature [58, 60] and germania as a function of both temperature
[61] and density [65]. Also polymeric systems [62, 36] show a stronger than Debye
behavior.
The Debye scaling of the VDOS supports an acoustic origin of the BP; these
results point out the existence of further mechanisms [60, 61] claiming for new
experiments able to clarify this issue.
Vitreous silica v-SiO2 is the prototype of the strong covalent network form-
ing glasses [1, 2] and it is probably the most well studied glass in literature.
Obsidiana, a natural silica glass, is historically the rst glass used by Mankind
to produce sharp cutting tools. Moreover, according to Plinius legend, a silica
mixture was the rst glass quenched by phoenician sailors. The interest in this
material arises also from its technological applications, for instance in the eld
42
Boson peak and elastic medium in permanently densied v-SiO2
of optic bers' technology.
In this chapter we report a detailed Raman scattering investigation of the
boson peak in permanently densied vitreous silica. Vitreous silica has been
already studied as a function of density by several research groups [69, 70, 71,
72, 73]. We focus on the comparison between the boson peak and the elastic
medium, carefully detailed by means of Brillouin Light Scattering (BLS) and
Inelastic X-Ray Scattering (IXS) measurements, respectively in the GHz and
THz frequency range. We show that in a 10% densication range a scaling law
for the BP and a master curve as a function of density both exist. Moreover
we demonstrate that the related scaling coecient has a stronger dependence
on density than the Debye frequency. Finally we show a signicative change of
the vibrational properties when the density is increased up to the 22%. These
ndings suggest that the Debye scaling of the Boson peak does not cover the
full story.
3.1 Sample preparation
Permanently densied silica samples were obtained from a commercial-grade
Spectrosil block, purchased from SILO (Florence). Rod pieces were cored from
the starting block and then rounded o using a lathe with diamond grind-
ing wheels, obtaining cylinders of 4 mm diameter and 4 mm length. These
cylinders were permanently densied using the high-pressure high-temperature
multi-anvil apparatus of the CNR-IMEM institute in Parma.
The high pressure part is based on a 6-8 geometry press which is schemat-
ically depicted in gure 3.1. Samples are loaded into holes drilled in a ceramic
MgO2 octahedral cell. The faces of the octahedron seat against the truncated
corners of a series of eight tungsten carbide anvils, gure 3.1(a). The resulting
cube is perfectly arranged in two sets of three wedges (up and down), which
43

3.1 Sample preparation
Figure 3.1: Schematic representation of the multi anvil apparatus; (a) shows the
ceramic octahedron arranged inside the anvils; (b) and (c) depict the position of the
anvil cubic assembly inside the six wedges which are put inside the module (d). The
right picture shows the HP-HT apparatus at the CNR-IMEM institute in Parma. The
wedges as well as the multi anvil mudule showed in (d) are clearly visible on the shelf
in front of the press.
44

Boson peak and elastic medium in permanently densied v-SiO2
act upon the faces of the cubic assembly. This set-up is clearly visible in g-
ures 3.1(b) and (c). These two sets of wedges are placed between the upper
and the lower plates of a large press, gure 3.1(d). This set-up ensures that the
pressure linearly applied by the press can be eciently converted into an hy-
drostatic compression of the sample. The high temperatures are obtained using
an internal resistance furnace (graphite or LaCrO3).
To prevent any sample contamination, the cylindrical pieces were encapsu-
lated in a noble metal container, a Pt foil of 50 µm thickness. The so obtained
capsule was inserted in the octahedral cell and then in the multi-anvil appa-
ratus. The pressure was rstly increased to the desired value at the rate of 40
kPa/min. The capsule was then heated up to 773 K at the rate of 50 K/min
and kept at this temperature for 10 minutes. The sample was rapidly cooled
down to room temperature by switching o the heater. The pressure was nally
slowly released at 40 kPa/min. A Pt/Pt-Rh thermocouple in contact with the
capsule monitored the temperature during the process. Once the capsule had
been removed from the multi-anvil apparatus, the product was easily recovered.
Four samples were prepared applying a pressure of 2, 4, 6 and 8 GPa. The
combined use of high pressure and high temperature conditions ensured the
stability of the permanently densied glass after its removal from the multi-
anvil apparatus. The nal product is a single glass block, as shown in gure
3.2.
The densities ρ of the samples were measured by means of the Archimedes
method, using ethanol as immersion uid. Ethanol temperature was monitored
to account for its density T -dependence. The obtained density values are re-
ported in table 3.1 as well as the densication ratio with respect to the normal
silica. In the following we will refer to the samples using the densication pres-
sure; 0 GPa indicates the non-densied glass.
45

3.1 Sample preparation
Figure 3.2: permanently densied silica samples as obtained by means of the described
procedure. The dark coloration of the 6 and 8 GPa samples is due the creation of
color center as a consequence of the X-ray exposure during inelastic X-ray scattering
experiments.
Pressure Density Densication
(GPa) (g/cm3) (%)
0 2.198± 0.005 0
2 2.210± 0.005 0.6
4 2.255± 0.005 2.6
6 2.406± 0.005 9.5
8 2.67± 0.01 22
Table 3.1: Density and densication ratio for the permanently densied silica samples;
each sample is identied by the densication pressure.
46

Boson peak and elastic medium in permanently densied v-SiO2
3.2 The vibrational density of states
The vibrational density of states was measured by means of Raman scattering
experiments. In the case of rst-order Raman scattering on a disordered system,
the experimental intensity is proportional to the vibrational density of states
g (ω). In the case of a Stokes process the Raman intensity is given by [74, 75]
IExp(ω) = C(ω)g(ω)[n(ω) + 1]
ω, (3.1)
where C (ω) is the light to vibration coupling function and n(ω) is the Bose
factor. Removing in eq. 3.1 the trivial temperature dependence given by the
Bose factor and dividing by ω, we obtain the so called reduced Raman intensity
I(ω) =IExp
[n(ω) + 1]ω= C(ω)
g(ω)
ω2, (3.2)
which is directly proportional to the reduced VDOS trough the coupling func-
tion.
Room temperature Raman scattering experiments were performed using a
Jobin-Yvon U1000 double monochromator and, as incident light, the 514.5 nm
line of an argon ions laser. Measurements were performed both in vertical-
vertical (VV) and horizontal-vertical (HV) polarization congurations. Low res-
olution Raman spectra were collected in the −300 ÷ 1300 cm−1 range. These
spectra are in agreement with those already published [73, 77] and were used
to adequately estimate the background contribution. The BP region has been
detailed with short range - high resolution spectra. The resolution was xed
to about 2 cm−1. In order to compare spectra corresponding to dierent den-
sities they were normalized to the same total measured area calculated on the
extended range spectra.
Figure3.3 shows the low frequency part of the depolarized Raman spectra. As
the density is increased the boson peak evolution is characterized by two distinct
features: the peak shifts upwards and the intensity decreases. Increasing the
47

3.3 The boson peak shape: the squeezing procedure
Figure 3.3: reduced Raman spectra for the normal and densied samples as reported
in the legend; the continuous line represents the t using a log-normal function dened
as I(ω) ∝ 1ω exp− (ln(ω/ωBP ))
2
2σ2 , where σ is the BP variance [76].
density by the 22%, we observe a peak shift of about 100% with a corresponding
intensity drop of 50%. This is larger than that previously observed in sodium
silicates [64] and even in vitreous germania [65]. In order to accurately determine
ωBP , we tted the BP spectra using a log-normal function as indicated in gure
3.3 [76].
3.3 The boson peak shape: the squeezing proce-
dure
Now we focus on the intensity evolution of the boson peak. We limit our analy-
sis to normal silica 2, 4 and 6 GPa samples. To compare the shape of the peak
as a function of ρ, we will perform the so called squeezing procedure [58]. We
rstly consider the scaled frequency ν = ω/ωS, where ωs is a squeezing param-
48

Boson peak and elastic medium in permanently densied v-SiO2
eter. Therefore we perform the variable transformation g(ν)dν = g(ω)dω. The
squeezed reduced intensity I (ν) can be written as:
I(ν) = I(ω)× ω2s . (3.3)
To derive this relation we assume that the coupling function is linear in the
boson peak region. This assuption is supported by several works, e.g. refs. [78,
79, 80, 81].
Figure 3.4: Master curve obtained using eq. 3.3 as discussed in the text.
The so-squeezed spectra are shown in gure 3.4. It is worth to note that the
spectra rescale one on top of the other without any adjusting parameter. The
dierences visible in the low frequency tails can be ascribed to the presence of
the quasi elastic scattering (QES) [58, 61]. The so obtained master curve is also
expected by theoretical predictions [41].
The same result is reached if the scaling is performed directly on the re-
duced VDOS g(ω)/ω2, namely dividing the reduced Raman intensity I (ω) by
the coupling function C (ω). Assuming that the density dependence of C (ω) is
negligible, we can use that measured in normal silica reported in ref. [79]. This
49

3.3 The boson peak shape: the squeezing procedure
hypothesis is supported by the results obtained in densied v-GeO2, where, in a
similar densication range, it has been demonstrated that the coupling function
does not depend on the sample density [82], at least in the BP region. As a
matter of fact in the QES region the coupling function is almost constant and
its value is system dependent (in the present case ρ-dependent) [78, 58].
Applying the procedure described before, the reduced VDOS rescales as:
g(ν)/ν2 = [g(ω)/ω2]× ω3s . (3.4)
The result of this dierent procedure is reported in g 3.4. The reduced VDOS
in 3.4(a) successfully rescale on the master curve reported in 3.4(b). The dis-
crepancies visible in the low frequency tail are due to the coupling function.
Figure 3.5: (a) Reduced vibrational density of states obtained from Raman data
taking explicitly into account the coupling function reported in ref. [79]. (b) Master
curve of the Boson Peak for g(ω)/ω2
The existence of these master curves demonstrates that the BP intensity
variation can be accounted for using only a single parameter ωs. However the
meaning of this parameter has not already been set. Figure 3.6 shows a com-
parison between the boson peak positions obtained in the present work and the
positions determined by means of Inelastic neutron scattering by Inamura and
co-workers [72]. Each datasets is normalized to its normal silica value. Raman
50

Boson peak and elastic medium in permanently densied v-SiO2
(red dots) and neutron data (black squares) show the same trend, indicating
that the Raman coupling function does not induce strong modications in the
density behavior of ωBP . On the same plot we report the normalized values of
ωs obtained with both the procedures (magenta diamond and green circles). In
both cases we nd the same behavior for the scaling factor ωs. This gives a
strong evidence of the equivalence of the two squeezing methods. Moreover, the
two values of ωs, despite of being more scattered, show a comparable density
dependence as ωBP . We can therefore conclude that the BP evolution in these
sample is only due the peak shift. As a matter of fact the BP is better seen in
g (ω) /ω2: when the peak shifts upwards its intensities lowered by the division.
The small dierences between ωBP and ωs are presumably due to the fact that
it is always dicult to obtain an absolute Raman intensity.
Figure 3.6: Comparison between Raman (red dots) and neutron data (black squares)
from [72] and the squeezing frequency ωS obtained squeezing I (ω) and (magenta
diamond) and g (ω) /ω2 (green circles); the red line represents the tted density trend
of the neutron data. Each data set is normalized to its normal silica value.
The squeezing procedure cannot be successfully applied to the 8 GPa sample
51

3.3 The boson peak shape: the squeezing procedure
spectrum. As a matter of fact we do not nd a ωs which is able to scale both peak
position and intensity. Figure 3.7 shows two unsuccessful tentative scalings. In
g. 3.7(a) it is reported the squeezed reduced Raman intensity I (ν) obtained
using an ωS optimized for the intensity; conversely the squeezed reduced density
of states g (ν) /ν2 is reported in g. 3.7(b). In this case ωS is chosen as the peak
maximum. In both cases the correspondence is poor.
A similar unsuccessful squeezing has already been recognized in vitreous
germania, where the dierence is between the normal and the densied samples
[65]. A possible explanation is that in both cases a strong modication in the
packing of the local structure is induced by the densication [68] and it is
reected in the dynamical properties, directly in the VDOS or distorting the
coupling function [71]. However the epoxy-amine mixture DGEBA-DETA does
not show any similar behavior even if the chemical vitrication process strongly
modies the structure [67].
We can conclude that, at least in a 10% densication range, the BP peak
intensity change is only due to the peak shift. Following this observation, we
focus on the existence of a scaling law for the peak position.
Figure 3.7: (a) tentative squeezing of the 8GPa reduced Raman intensity using an ωS
optimized for the intensity; (b) tentative scaling of the 8GPa reduced VDOS g(ω2)/ω2
using as squeezing parameter the boson peak position.
52

Boson peak and elastic medium in permanently densied v-SiO2
3.4 Elastic medium characterization in the GHz
frequency range
The elastic medium can be represented by the Debye frequency ωD introduced
in 1.7.1 in the framework of the Debye theory. Equation 1.11 denes ωD as:
ω3DB = 6π2ρnv
3D, (3.5)
where ρn is the number density and vD the Debye velocity, namely:
3
v3D=
(1
v3L+
2
v3T
); (3.6)
vD depends on both the longitudinal and transverse sound velocities, vL and vT .
These quantities can be measured by means of Brillouin scattering experiments.
3.4.1 Brillouin light scattering experiments
Brillouin light scattering experiments were carried out using a laser with λ =
514.5 nm and a SOPRA double-pass monochromator as spectrometer. The 90
scattering geometry with no polarization analysis of the scattered light allowed
us to measure both the longitudinal and the transverse acoustic modes in the
same spectrum.
Figure 3.8(a) shows the evolution of the Brillouin longitudinal peak as a
function of density. It can be seen that the peak position shows a minimum about
4 GPa. BLS measurements as a function of pressure, show a similar behavior
between 2 and 3 GPa, roughly corresponding to our density region [83]. This
softening is known as silica elastic anomaly and it is generally ascribed to a
polyamorphic transition [84].
The Brillouin peak position is related to the sound velocity by the following
relation:
vi =ωiλ
4πnR sinϑ/2. (3.7)
53

3.4 Elastic medium characterization in the GHz frequency range
Figure 3.8: Left panel shows the longitudinal Brillouin peak evolution as a function of
the increasing density, the peak intensity is normalized to its maximum. In the right
panel it is reported the density evolution of the longitudinal and transverse sound
velocity (respectively with blue and red bullets).
54

Boson peak and elastic medium in permanently densied v-SiO2
The index i labels the branches of the sound velocity vi and the corresponding
Brillouin peaks centered at ωi; nR is the refractive index, λ is the laser wave-
length, and ϑs the scattering geometry The refractive index has been determined
in each sample by prism coupling techniques at the experimental wavelength.
Figure 3.8(b) displays the evolution of the sound velocity as a function of the
density. The elastic anomaly is visible both in the longitudinal and transverse
branch.
3.5 Inelastic X-ray scattering experiments
The presence of relaxations and anharmonicities can aect the sound velocity
measured in the GHz frequency region [59, 67]. The sound velocity becomes fre-
quency dependent and does no more correspond to the fully unrelaxed frequency
limit needed to characterize the elastic properties of the medium. In this case
we have to consider a sound velocity corresponding to higher frequency, namely
moving from the visible light to X-rays, from Brillouin light scattering to in-
elastic X-ray scattering (IXS).
3.5.1 The X-ray spectrometer ID28
IXS measurements were carried out at the beamline ID28 at the European
Synchrotron Radiation Facility in Grenoble.
The beamline lay-out is reported in [49] and it is based on the triple-axis
principle. The rst axis is composed of the high energy resolution monochroma-
tor xing the incident energy Ei. The second axis is the sample goniometer, and
it determinates the momentum transfer by selecting the scattering angle. Finally
the third axis is the crystal analyzer which selects the scattered energy Ef . Due
to the backscattering geometry the beamline is fairly long in order to acquire a
sucient beam oset between the incident photon beam from the X-ray source
55

3.5 Inelastic X-ray scattering experiments
and the focused very high-energy resolution beam at the sample position. The
source consists of three linear undulators of 32 mm magnetic period (U32), pro-
viding X-rays linearly polarized in the horizontal plane. Typically, emission from
the 3rd or 5th harmonic is utilized. This X-ray beam has an angular divergence
of approximately 40× 15 µrad (FWHM), a spectral bandwidth ∆E/E ∼ 10−2,
and an integrated power within this divergence of the order of 200 W. This
beam is rst pre-monchromated to ∆E/E ∼ 2× 10⁻⁴ using a silicon (111) dou-
ble crystal device kept in vacuum and at the cryogenic temperature of 110 K.
Moreover, the pre-monochromator coupled with a post-monochromator act to
reduce the heat load produced by the intense beam on the main monochromator.
This avoids any thermal broadening of the energy resolution function. The high
energy resolution backscattering monochromator consists of a at perfect sin-
gle crystal, operating at a Bragg angle of 89.98 and utilizing the silicon (nnn)
reection orders. High order Bragg reections and perfect crystals are required
in order to obtain the necessary energy resolution of ∆E/E ∼ 107 ÷ 108. The
reections are n = 7; 8; 9; 11; 12; 13. The Energy scans are performed by vary-
ing the temperature of the monochromator, controlled in the mK region, and
keeping the temperature of the analyzer xed. The highly monochromatic beam
impinges on a toroidal mirror, focusing at the sample position to a beam size of
250 (horizontal) × 150 (vertical) mm2 (FWHM). Once scattered by the sample,
the X-rays are energy-analyzed by the analyzers. Each analyzer is composed of
12000 undistorted perfect at crystals glued on a spherical surface. The ana-
lyzers operate in a Rowland circle geometry at the same reection order as the
main monochromator. The refocused, energy-analyzed X-rays are detected by a
Peltier cooled inclined silicon diode detector. There are in fact nine independent
analyzer systems with a xed angular oset between them, mounted on a 7 m
long arm that can rotate around a vertical axis through the scattering sample.
This rotation allows one to choose the scattering angle Q for the nine analyzers,
56

Boson peak and elastic medium in permanently densied v-SiO2
and therefore the corresponding exchanged momentum, Q = 2ki sinϑ/2. The
arm operates between 0 and 55.
3.5.2 Experimental setup
In the present experiment, in order to get the highest energy resolution, we
chose an incident beam with an energy of 23.724 keV and the silicon (12,12,12)
reection order for the main backscattering monochromator. The experimental
resolution has been determined by measuring the scattering from a disordered
sample (Plexiglass) at a temperature of ∼ 13 K and at a Q-transfer correspond-
ing to the rst maximum of its static structure factor (10 nm−1). In this way
the elastic contribution to the scattering is maximized. The overall energy reso-
lution of the spectrometer was ∼ 1.3 meV (FWHM), depending on the analyzer
crystal.
To increase the population of the acoustic excitation, and therefore the in-
elastic signal, measurement were performed at T = 573 K putting the sample
in an evacuated fournace.
Since we are interested in determine the longitudinal sound velocity in the
purely elastic limit we focused in low exchanged momentum range, collecting
spectra between 1.1 and 2.5 nm−1. Each spectrum was acquired in the−35÷+35
meV energy range; in the central part (−25 ÷ +25 meV) the energy step was
0.25 meV whereas the step was 0.5 meV in the tails. Moreover to improve the
statistical accuracy of the data we acquire at least four spectra for each Q,
averaging the results. The total integration time is about 24 hours for each
spectrum.
57

3.5 Inelastic X-ray scattering experiments
Figure 3.9: Representative IXS spectrum on the analyzed samples measured at T =
573 K at selected Q (black circles); left pannels refers to the 4 GPa sample whereas
the right ones to the 6 GPa sample. The measured instrumental resolution is also
reported (green line). The red line is the best t of the data and the blue line is the
inelastic contribution.
58

Boson peak and elastic medium in permanently densied v-SiO2
3.5.3 IXS data analysis
Figure 3.9 shows a selection of spectra collected at selected values of the ex-
changed momentum Q. Spectra were acquired on the 4 GPa sample, g. 3.9(a)
and (b), and on the 6 GPa sample, g. 3.9(c) and (d). Spectra are composed by
an elastic peak and two inelastic features corresponding to the Stokes and anti-
Stokes components of the Brillouin doublet and thus related to the acoustic-like
modes. Increasing Q, the doublet shifts toward higher energies and becomes
broader.
The measured intensity in IXS experiment can be written as the convolution
between the dynamic structure factor S (Q,ω) and the resolution function R (ω),
namely:
IIXS (Q,ω) = I0 (Q)R (ω)⊗
~ωKBT
[n (ω, T ) + 1]S (Q,ω)
+ bkg, (3.8)
n (~ω) is the Bose factor, the term [n (ω, T ) + 1] ~ω/KBT accounts for the quan-
tum nature of the interaction and fullls the detailed balance principle. The
baseline term is added in order to take into account the electronic background
of the detector and the environmental background. Moreover, the overall inten-
sity factor I0 (Q) is a normalization factor which is inuenced by the atomic
form factors, the eciency of the analyzers, and by all other angle-dependent
instrumental correction factors. In principle data can be reported in absolute
unit [85], but this is irrelevant in the present discussion.
The dynamic structure factor S (Q,ω) can be modeled as the sum of a delta
function to describe the elastic line and a damped harmonic oscillator (DHO)
for the inelastic component:
S (Q,ω) = Ael (Q) δω + A2 (Q)1
π
Ω (Q)2 Γ (Q)(ω2 − Ω (Q)2
)2+ ω2Γ (Q)2
. (3.9)
where Ael describes the intensity of the elastic component whereas A1, Ω, and Γ
refer to the inelastic propagating excitations and they respectively represent the
59

3.5 Inelastic X-ray scattering experiments
intensity, position and attenuation. Examples of this t procedure are reported
in gure 3.9. The best tting line shape obtained using eq. 3.8 is indicated with
a red line. The experimental resolution is depicted with a green line and the
DHO contribution corresponding to the inelastic features with a blue one.
Figure 3.10: Dispersion curve for 4 GPa sample (green up triangles) and for the 6
GPa one (blu down triangle). The dashed line is the extrapolation of the BLS sound
velocity.
The obtained dispersion curves of the two samples are displayed in g. 3.10.
The dashed lines are the extrapolation of the low frequency sound velocities
measured by BLS. IXS and BLS sound velocities are in good agreement, even if
the THz data are slightly lower than the GHz ones. This small dierence could
be ascribed to the presence of a softening of the modes in the low-Q region,
around the BP frequency, as it has been recently shown in other glassy systems
[86].
60

Boson peak and elastic medium in permanently densied v-SiO2
3.6 The end of the story - The breakdown of the
Debye scaling
The calculation of the Debye frequency ωD in the case of BLS data is a straight-
forward application of eq. 1.11. As a matter of fact vL and vT are both measured.
In the purely elastic limit we can measure only one mode, corresponding to
the longitudinal one. However the transverse sound velocity can be estimated
using the Cauchy-like relation connecting the high frequency limit of the lon-
gitudinal elastic modulus M ′ = ρv2L and the shear one G′ = ρv2T . The relation
reads:
M ′ = A+BG′. (3.10)
This has been recently found to hold for a great variety of systems at all fre-
quencies [87] with B ∼ 3 and A a system dependent constant. The bulk moduli
G′ and M ′ calculated using BLS sound velocity values are reported in gure
3.11(a). Data shows again a linear behavior with a slope B = 3.3 ± 0.7. This
conrms the applicability of the Cauchy relation and allows the determination
of the high frequency transverse sound velocity and then the appropriate De-
bye frequency. Figures 3.11(b) and (c) show the estimated transverse branches
(dashed lines).
In order to check whether the shift of the Boson Peak can be totally ascribed
to changes in the elastic constants, we can compare the dependence of ωBP and
ωD on the same plot, gure 3.12. Data are normalized to their normal density
value. As in g 3.6 we show the BP position obtained by both Raman and
neutron inelastic scattering [72] data. Blue and cyan diamonds represents the
elastic continuum, i.e. the Debye frequency ωD, obtained using respectively IXS
and BLS data. The two values agree very well. The density dependence of ωBP
and ωDB is roughly linear, though with slopes about one order of magnitude
61
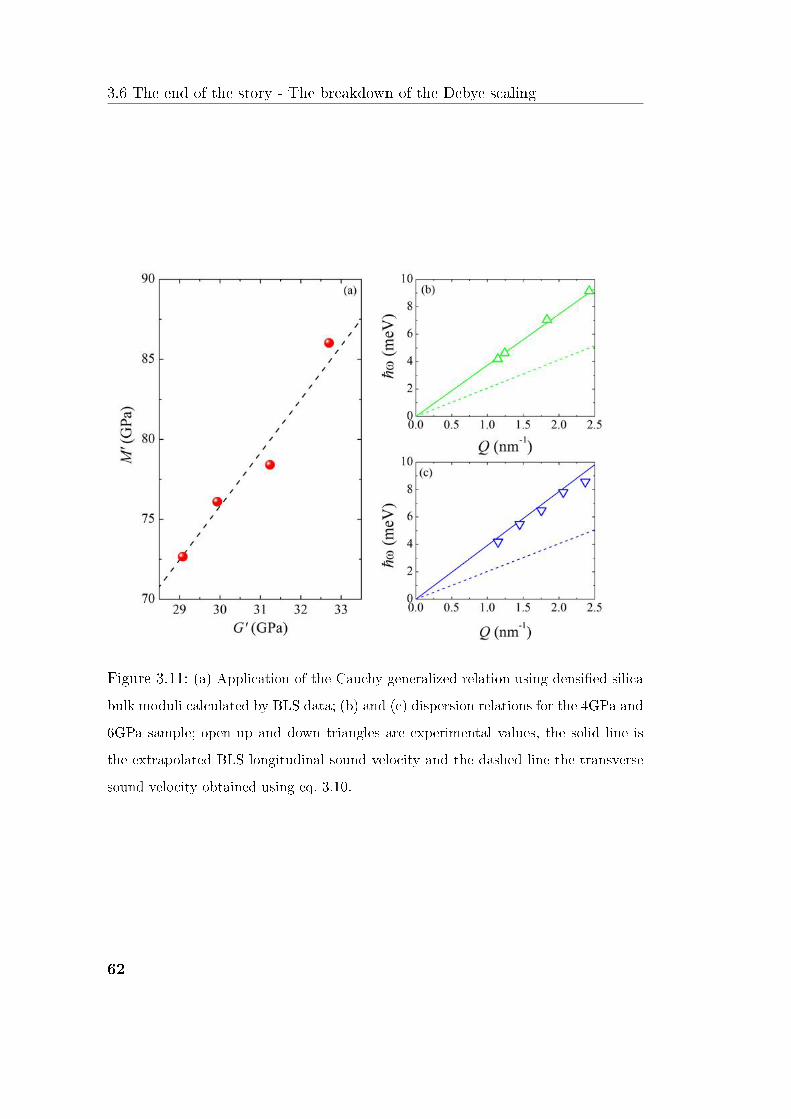
3.6 The end of the story - The breakdown of the Debye scaling
Figure 3.11: (a) Application of the Cauchy generalized relation using densied silica
bulk moduli calculated by BLS data; (b) and (c) dispersion relations for the 4GPa and
6GPa sample; open up and down triangles are experimental values, the solid line is
the extrapolated BLS longitudinal sound velocity and the dashed line the transverse
sound velocity obtained using eq. 3.10.
62
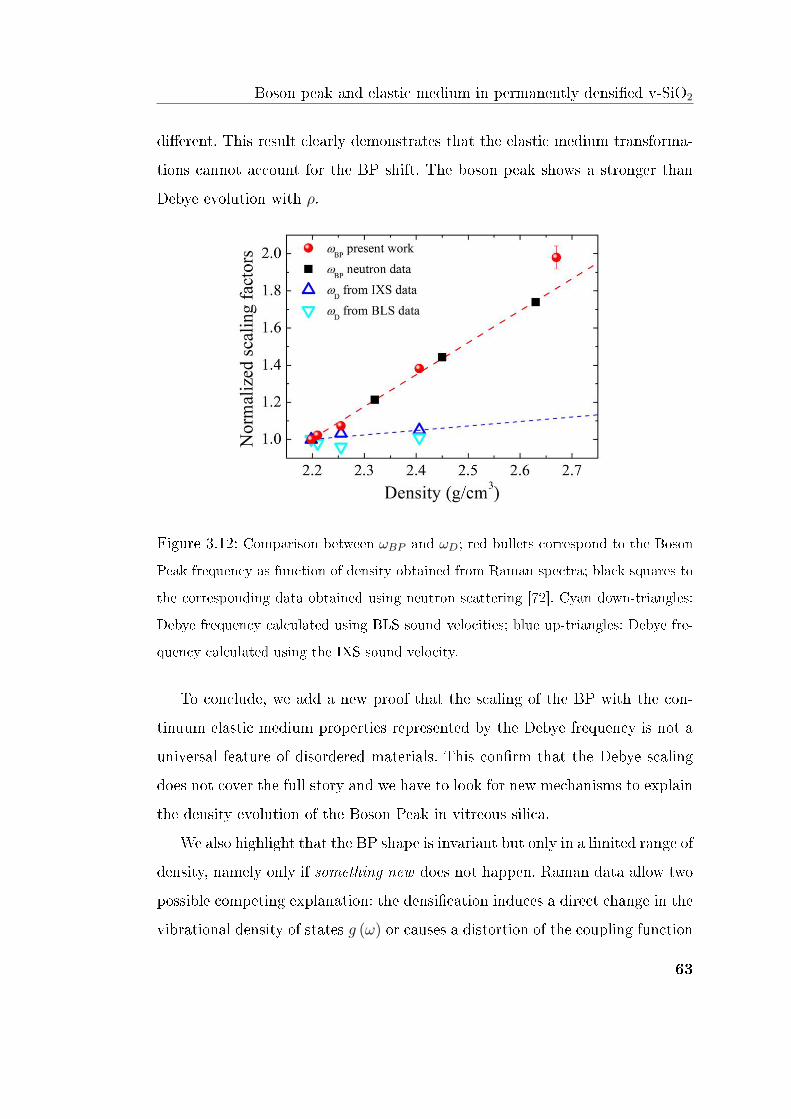
Boson peak and elastic medium in permanently densied v-SiO2
dierent. This result clearly demonstrates that the elastic medium transforma-
tions cannot account for the BP shift. The boson peak shows a stronger than
Debye evolution with ρ.
Figure 3.12: Comparison between ωBP and ωD; red bullets correspond to the Boson
Peak frequency as function of density obtained from Raman spectra; black squares to
the corresponding data obtained using neutron scattering [72]. Cyan down-triangles:
Debye frequency calculated using BLS sound velocities; blue up-triangles: Debye fre-
quency calculated using the IXS sound velocity.
To conclude, we add a new proof that the scaling of the BP with the con-
tinuum elastic medium properties represented by the Debye frequency is not a
universal feature of disordered materials. This conrm that the Debye scaling
does not cover the full story and we have to look for new mechanisms to explain
the density evolution of the Boson Peak in vitreous silica.
We also highlight that the BP shape is invariant but only in a limited range of
density, namely only if something new does not happen. Raman data allow two
possible competing explanation: the densication induces a direct change in the
vibrational density of states g (ω) or causes a distortion of the coupling function
63

3.6 The end of the story - The breakdown of the Debye scaling
which is no longer density independent. A denitive answer to this question can
rise only measuring the vibrational density of states. Suitable techniques are
inelastic neutron scattering o inelastic X-ray scattering.
64

Chapter 4
Medium range order and voids in
permanently densied vitreous
silica
Natura abhorret vacuum.
Plutarchus
In the previous chapter we have dealt with the problem of the densication
eects, considering them mainly from a dynamical point of view. Now we focus
on the structural transformation occurring in vitreous silica when the density
is increased.
Since the pioneering work of Zachariasen [11], the structure of vitreous SiO2
has been object of several experimental and simulative studies [17]. The short
range order is well characterized [12]. The structural building block is the well
dened Si(O1/2
)4tetrahedron [12, 17]. These tetrahedra link together to form a
tridimensional topological disordered network of corner sharing units. Dirac-
tion data show the presence of the so-called rst sharp diraction peak, which is
considered as the signature of the existence of an order beyond the short range,
65

4.1 Positrons and positronium
namely an order in the tetrahedra connections.
In this chapter we will characterize a prominent feature of the SiO2 network,
i.e. the presence of void space inside the tetrahedral arrangement. These cages
have been analyzed by means of the positron annihilation lifetime spectroscopy
(PALS). It allows an in-situ characterization of the defects implanting positrons
in matter and measuring the time elapsing between implantation and annihila-
tion [88, 89, 90, 91]. The PALS technique is a well established method for the
characterization of defects in technological materials but it represents a new
approach for directly accessing to structural information.
The so-obtained data will be discussed together with diraction data [72] to
account for the densication induced structure evolution in v-SiO2 [92]. Void
spaces will be analyzed also as a key feature of the medium range length-
scale, highlighting their contribution to the rst sharp diraction peak [93, 21,
18]. Moreover, we present a preliminary analysis of the relation between these
medium range features and the boson peak.
4.1 Positrons and positronium
The positron is the anti particle of the electron. Positrons (e+) and electrons
(e−) share the same physical properties except for the electric charge and the
magnetic moment, which are opposite. The main properties of positrons are
reported in table 4.1.
The existence of positrons was theoretically predicted by Dirac in 1928 as
the negative energy extension of his theory of electron energy levels. Few years
later, in 1932, Anderson, studying cosmic rays using a cloud chamber, identied
the trace of a positive charged electron. This particle was named positron and it
was the rst evidence of the existence of the antimatter.
In general, positrons annihilate with electrons, predominantely via 2γ-rays
66

Medium range order and voids in permanently densied vitreous silica
mass 510.998928(11) keV/c2
spin 1/2
electric charge +1.602176565(35)×10−19 C
magnetic moment +1.00115965218076(27)µB
lifetime >2× 10²¹ yrs
Table 4.1: Properties of the positrons; µB = e~/2me is the Bohr magneton and its
value is 9.27400915(23)× 10−24 J/T. Data are from ref. [94].
decay. However, in some circumstances a positron can bind with an electron,
forming an hydrogen-like atom, called positronium (Ps) [95]. Dierently from
hydrogen, positronium can be depicted as two equal mass particles orbitating
around a common center. The Ps energy levels can be calculated using the Bohr
formula
E0 =α2mc2
2n2, (4.1)
where α is the electromagnetic coupling constant and m = me/2 is the reduced
mass, with me the electron rest mass. The positronium ground state binding
energy is thus 6.8 meV, one half of the hydrogen one. The mean separation
between the two particles is given by the Bohr radius, namely
rPs =~c
α2mc2= 1.06Å, (4.2)
which is twice the Bohr radius in the hydrogen case.
The ground state of the positronium has two possible congurations:
• singlet 1S0 state, para-positronium (p-Ps), with total spin S = 0 and
ms = 0;
• triplet 3S0 state, ortho-positronium (o-Ps), with total spin S = 1 and
ms = 0,±1.
67

4.2 Positrons in solids
Since e+ and e− annihilate, positronium has a nite lifetime. In particular the
two states have dierent vacuum mean lifetimes and decay channels. The selec-
tion rule prescribed by the charge conjugation invariance for the Ps annihilation
is
(−1)l+s = (−1)n . (4.3)
The left side is the charge conjugation number for positronium with angular
momentum l and total spin s. The right side is the charge conjugation number
for n photons. Moreover, the conservation of energy and momentum forbids the
single photon 1γ annihilation process for free Ps. Therefore, p-Ps decay via even
(two) γ-rays, with a lifetime τp-Ps = 125 ps (in vacuum). The ortho Ps has a
longer life, τo-Ps = 142 ns, and it decays into odd (three) γ-rays. The relative
ammount of ortho and para-positronium is, in absence of external distrubances,
3:1.
4.2 Positrons in solids
In this section we will briey review the life of a positron implanted into a
material with an energy Ei ∼ keV. This life can be divided into three main
stages. The rst stage is the slowing down and the thermalization, the second
stage is the diusion and perhaps the trapping, whereas the latter is, obviously,
the annihilation [89, 88, 91, 90]. Focusing only on positron inside the material
we neglect surface eects and the reemission of positron or positronium from a
surface [89, 88].
After its introductions into the solid the energetic positron interacts with
the atoms of the medium loosing energy. The energy-loss channels are strictly
dependent on the nature of the material.
In metals, the primary channel is the ionization. Core electron excitation
68

Medium range order and voids in permanently densied vitreous silica
hands over to plasmons and nally to electron-hole pair formation. These pro-
cesses are very eective and they last until the energy falls below a few tenths
of eV, where phonons scattering dominates. Positrons reach the thermal equi-
librium in ∼ 1013 s.
In intrinsic semiconductors, similar energy-loss channels occur but they are
active only until the energy is greater than the band gap energy Eg. At this
point the thermalization slows down since single inelastic phonon scattering
events are inecient whereas multiple phonon scattering ones are very rare.
For insulator the situation is almost the same as for semiconductors, however
there is a further energy-loss channel to count. As a matter of fact positrons can
also continue to thermalize below the band gap energy forming positronium.
Forming Ps an e+-e− pair gains EPs = 6.8 eV. If the positron energy E is
contained in the region Eg − EPs < E < Eg, it is energetically possible to
excite an electron from the valence band. For energies below Eg − EPs the
ionization of an electron and the formation of positronium are not possible.
At the same time, if E > Eg, electron-hole pair formation is much more likely
than positronium formation. The energy region where Ps formation is the only
available energy loss mechanism is called the Ore gap. In metals and in semi-
conductors, positrons cannot form positronium because the high electron density
screens the Coulomb interaction between positrons and electrons. Moreover, Ps
can be formed via the so called spur mechanism. As a matter of fact, as positron
thermalizes it leaves a trail of ionized electrons, the spur. Once the positron is
thermalized it can form positronium binding with one e− in the terminal spur.
Between the time of thermalization (∼ 10−12 s) and the time of annihilation
(∼ 10−10 s), the positron exists in insulators in both free and bound states.
During this time, e+ and Ps have a thermal energy ∼ KBT and they diuse
through the material. Their deBroglie wavelength at room temperature is on
the order of 102 Å, greater than the typical interatomic distances. Where a
69

4.2 Positrons in solids
Figure 4.1: Schematic representation of the interaction between positrons and con-
densed matter.
percentage of free-volume exist at a size a few Ångstroms, both thermalized
positrons and Ps have sucient chance to sense the existence of such holes.
Positrons and positronium are energetically more stable in the voids than in
the bulk, where they sense the core strong repulsive potential between the ion
core and the positively charged positron or the highly polarizable Ps.
The nal fate of an implanted positron, free or bound, trapped or diusing,
is eventually to a approach an electron at a dangerously close distance and to
be annihilated [90].
The lifetime of the positronium conned in voids will depend on two factors:
the intrinsecal p-Ps or o-Ps lifetime, and the probability of a pick-o annihi-
lation. In principle the o-Ps life in vacuum (or in voids) is up to three order
of magnitude greater than the other e+ states in materials. In fact the o-Ps
trapped in voids explore the voids volume and annihilates with an electron of
the surrounding atoms clouds. This process is called pick-o annihilation and
its rate is proportional to the overlap between the e+ and e− wavefunctions,
70

Medium range order and voids in permanently densied vitreous silica
hence to the void volume.
The typical lifetimes of the positronic processes in solids are resumed in table
4.2.
e+ lifetime in vacuum ∼ 2× 10²² yrs
e+ scattering and diraction ∼ 10−15 s
e+ thermalization (to ∼ εF ) ∼ 10−13 s
e+ thermalization (to ∼ 32KBT ) ∼ 10−12 s
e+ trapping after thermalization ∼ 10−15 s
e+ lifetime freely diusive ∼ 1× 10⁻¹⁰ s
e+ lifetime void trapped ∼ 3× 10⁻¹⁰ s
p-Ps lifetime in vacuum ∼ 1.28× 10⁻¹⁰ s
o-Ps lifetime in vacuum ∼ 1.42× 10⁻⁷ s
o-Ps lifetime trapped in voids . 10−9 s
Table 4.2: Timescales characterizin the fate of an implanted positron [89].
4.3 Positron Annihilation Lifetime Spectroscopy
The study of the lifetime of o-Ps in solids can give insights on the nature of the
material, in particular on the presence of trapping defects such as pores and void
spaces. This is the main task of the Positron lifetime Annihilation Spectroscopy
(PALS). In a typical PALS experiment the relevant quantity is the elapsing time
from the implantation of the positron and its annihilation determined through
the detection of the annihilation γ-rays.
PALS measurements were performed at Pulsed Low Energy Positron System
(PLEPS) which is coupled to the positron surce NEPOMUC, NEutron-induced
POsitron source MUniCh. These instruments are located at the research reactor
Heinz Maier-Leibnitz FRMII of the Technische Universität München.
71
4.3 Positron Annihilation Lifetime Spectroscopy
4.3.1 The positron source NEPOMUC
The positron source NEPOMUC creates a positron beam exploiting the pair
production mechanism, i.e. the creation of a e+-e− pairs by materialization
of high energy gamma rays in the electric eld generated by the nuclei of a
converter materials. The energy threshold of this process is Eγ > 2mec2.
A cascade of high energy γ's is produced through a thermal neutron capture
process. The reactive material is cadmium which has an huge neutron absorption
cross section in the thermal region (σCdabs = 20600 barn) The capture reaction113Cd (n, γ)114Cd relases an energy of 9.05 MeV per neutron. On a average, for
each captured neutron 2.3 γ's are produced with 〈Eγ〉 = 1.5 MeV. Since the pair
production cross section is approximately proportional to Z2, materials with
high nuclear charge Z are preferable. The NEPOMUC converter is composed
by platinum (Z=78) foils which are also used to moderate the produced beam
[96].
The e+ source is mounted inside the reactor moderator tank, close to the
pile core. The Pt converter is surrounded by a cadmium cap which operates as
gamma rays source as well as shielding material. The thermal load is dissipated
into the reactor heavy water pool. Positrons are produced and moderated into
the Pt foils, then they are accelerated using high voltages. At 1 keV the source
yields 9 × 10⁸ positron per second collimated in a 7 mm (FWHM) beam in a
longitudinal magnetic guiding eld of 6 mT. To clean the beam, eliminating the
γ and fast neutrons background, the e+ are bended three times in the biological
shield.
The brightness of the positron source is improved by a positron remoderator
based on a tungsten single crystal in back-reection geometry. The energy of the
remoderated beam can be adjusted between 20 and 200 eV. The total eciency
of the setup is about 5%.
72

Medium range order and voids in permanently densied vitreous silica
4.3.2 The positron lifetime spectrometer PLEPS
The positron source NEPOMUC provides a continuous beam, but it is not suit-
able for positron annihilation lifetime (PAL) measurements. As a matter of fact
the measure of the lifetime needs a perfect knowledge of the implantation time
of every single positron, hence it is required a monochromatic beam with a pe-
riodic structure. To produce this structure there are two techniques: chopping
and bunching. In general, the chopper blanks out the beam, causing an intensity
loss. On the other hand, bunchers exploit electric eld to accelerate or deceler-
ate charged particles to obtain a time focus somewhere in the space, but loosing
the monochromaticy. However, the combined use of these techniques can com-
pensate these disadvantages [97]. PLEPS pulsing section is thus composed by a
prebuncher, a chopper, and a buncher. These devices operate at a frequency of
50 MHz to produce at a given point in time within the time window of 20 ns a
sharp pulse of 150 ps (FWHM), ensuring between two pulses a low background
noise at the sample location. In "PLEPS words" pulse means that one out of
100 pulses will contain at most one positron and only one out of 105 will contain
more than one e+. The other pulses are blanks. This allows to have only one
positron at the time in the sample [98].
The sharp pulse is thus accelerated to a desired implantation energy between
0.2 keV and 22 keV. Positrons impinge on the sample, undergoing to the pro-
cesses described in sec 4.2. After the annihilation, γ's are detected by a BeF2
scintillator coupled to a photomultiplier. A Wienn lter and a eld-free Fara-
day cage are used to remove scattered positrons which can introduce a spurious
background. The entire apparatus works in high-vacuum conditions.
73

4.4 Positron Lifetime Spectra
4.3.3 Experimental setup
PALS experiments were performed on all the permanently densied silica sam-
ples and in a normal silica one. Samples were glued to an ultra-pure golden foil.
This metallic substrate was chosen in order to provide a good lifetime-contrast
between sample and substrate annihilations.
PALS is an in-situ technique. As already discussed in sec. 4.2, positrons
implanted in the matter lose their energy until the thermalization is reached.
The implantation depth 〈z〉 is the depth at which positrons or positronium end
the slowing down and start their diusive motions. According to a Makhovian
implantation prole the implantation depth can be written as
〈z〉 [nm] =40
ρ [g/cm3]E1.6i [keV ] , (4.4)
where ρ is the density [89].
The PALS experiments were performed with two implantation energies, 16
and 18 keV. The implantation depths calculated for our samples using eq. 4.4
are reported in gure 4.2. It can be seen that 〈z〉 (Ei = 16 keV) ranges from 1.56
µm to 1.26 µm whereas 〈z〉 (Ei = 18 keV) goes from 1.86 µm to 1.52 µm. These
〈z〉 values ensure that we are probing the bulk properties of our samples.
4.4 Positron Lifetime Spectra
PALS experimental observable is the time between the implantation and the
annihilation. By accumulating typically several millions of annihilation events
one obtains an exponential decay spectrum.
Figure 4.3 shows the PALS spectra measured in the densied samples and
in normal silica using the two implantation energy. The typical PAL spectrum
is formed by a prompt peak due to fast events and a long tail related to long
living particles. Figure 4.3 shows that, increasing the density, the long time tail
74

Medium range order and voids in permanently densied vitreous silica
Figure 4.2: Implantation depths for the two selected energies, 16 keV (full orange
squares) and 18 keV (open orange squares).
of the spectrum decreases. Moreover, comparing spectra at the same density but
dierent energy i.e. at dierent depth, gure 4.4, they appear identical. This
indicates that the samples are microscopically homogeneous.
The measured PAL spectrum Z (t) can be viewed as the sum of N expo-
nential decay lifetime components convoluted with an instrumental resolution
function R (t) superimposed to a constant background bkg:
Z (t) = R (t)⊗N∑i
Iiτiexp (−t/τi) + bkg, (4.5)
where τi and Ii indicates the lifetime and the intensity associated to the state i.
The instrumental resolution R (t) is determined by measuring a PALS spec-
tra on a reference substance, in this case a p-type silicon carbide slab. This
shows a bulk lifetime τbulk = 345 ps and a surface lifetime τsurf = 145 ps. Using
eq. 4.5 and performing a reverse lifetime analysis the time resolution function
R (t) can be retrieved.
As already noted, spectra corresponding to dierent Ei are indistinguishable,
75

4.4 Positron Lifetime Spectra
Figure 4.3: Positron annhilation lifetime spectra measured in normal and densied
silica samples as reported in the legend. Spectra are obtained implanting positrons
with Ei = 16, (a), and Ei = 18 keV (b).
76

Medium range order and voids in permanently densied vitreous silica
Figure 4.4: Comparison between PALS spectra measured with dierent implantation
energies: Ei = 16 keV (full symbols) and Ei = 18 keV (open symbols); PAL spectra
are measured in the samples densied at 2 (a), 4 (b), 6 (c), and 8 GPa (d).
77

4.4 Positron Lifetime Spectra
see 4.4. In the quantitative analysis they were averaged and then analyzed using
the program POSITRONFIT [99] in order to determine the lifetime τi and the
intensity Ii of the N decaying components in eq. 4.5.
The decomposition of the 0, 2 and 4 GPa spectra shows the existence of
N = 3 components. On the other hand in the 8 GPa case in order to obtain a
good t it is necessary to consider a fourth lifetime τ4 which has a small but
non neglegible intensity I4. The 6 GPa sample is the intermediate case where we
can obtain a satisfactory decomposition either with three or four components
(reduced χ2 close to 1). As a matter of fact, the fourth component is very small
and the other lives are scarcely aected by its introduction. The so obtained
parameter τi and Ii are reported in gure 4.5.
The rst component is characterized by a τ1 ' 160 ps and I1 = 25%. This
fast decaying life is associated to the prompt p-Ps self-annihilation and/or free
e+ annihilation. Both the lifetime and the intensity, gure 4.5(a) and (b), are
almost constant increasing the density; an increase of I1 is visible only in the
most densied sample.
The second life is characterized by τ2 which increasing the density decreases
from ∼ 0.73 ns to ∼ 0.36 ns. The intensity I2 doubles. This lifetime is associated
with the annihilation of trapped positron with oxygen atoms around pores and
that do not form Ps [100].
The most interesting lifetime is τ3 which is associated with the pick-o an-
nihilation of o-Ps in voids. Increasing the density this lifetime is cut by half.
Moreover the intensity I3 decreases from the 55% to 13%. In the two most den-
sied sample (6 and 8 GPa) a further lifetime emerges. This fourth component
has a rather constant long life and a very low intensity I4 . 1%. This life is
limked to the annihilation of o-Ps and it could account for the existence of larger
voids or internal cracks originated by the densication process.
The overall picture that PALS data suggest is that in the available void
78

Medium range order and voids in permanently densied vitreous silica
Figure 4.5: PALS t parameter obtained using eq. 4.5.
79
4.5 The Tao-Eldrup model
volume is strongly reduce by the densication procedure. The annihilation time
of free e+ and p-Ps is basically unaected and eventually the probability of
these annihilation raises with density. On the other hand the lifetimes due to
trapped particles, τ2 and τ3 shows a drop indicating an increase of the pick-o
probability, hence a reduction of the available volume [101].
The densication process induces also a strong quenching of positronium
formation. As a matter of fact, the positron formation ratio in normal silica is
νPs '= 43I3 = 73% being the proportion between p-Ps and o-Ps 1 : 3 [100].
The intensity I3 drops from 55% to 13% (17% of positronium formation). This
reduction can be due to concomitant factors: compacting of the material with
reduction of free volumes available for Ps formation, enrichment of the free
volumes by displaced oxygen, and free electrons at dangling bonds. Conversely
the fraction I2 increases from 19% up to 45%. The strong increase of I2 is due
to the oxygen enrichment of the trapping sites and annihilation of positrons
at negative charged oxygen-related defects as evidenced by the decrease of the
lifetime τ2 of the trapped positrons [101].
To quantify this reduction in terms of a pore radius, it is necessary to intro-
duce a model for the pick-o annihilation of o-Ps [102].
4.5 The Tao-Eldrup model
In order to understand the experimental PALS data we need a model which
connect the o-Ps lifetime with the void size.
We consider the positronium atom as a single scalar particle with twice the
electron mass, trapped into an innite spherical potential well with radius R0.
The radial part of the Schrödinger equation for the center-of-mass motion
of Ps is written as [55]~2
2m
[d2
dr2− l (l + 1)
r2
]+ V (r)− En
ΨPs (r) = 0, (4.6)
80

Medium range order and voids in permanently densied vitreous silica
where
V (r) =
0 0 < r < R0
∞ elsewhere. (4.7)
The ground state wave function inside and outside the well is given by
ΨPs(r) =
12πR0
sin(πr/R0)r
0 < r < R0
0 elsewhere. (4.8)
The eigenvalues for Ps at the nth state are given by
En =n2~2π2
2mR20
. (4.9)
The calculation of the annihilation rate requires the electron density ρe.
Following the semiempirical approach after Tao [103] and Eldrup et al. [104],
we assume the existence of a homogeneous electron layer with a thickness ∆R =
R0 − R inside the well. The probability for Ps in the ground state inside the
electron layer is then given by
P = 4π
∫ ∞R
|Ψ (r)|2 r2dr = 1− R
R0
+1
2πsin
(2πR
R0
). (4.10)
Assuming the annihilation rate of o-Ps inside the electron layer is 2 ns,
which is the spin averaged annihilation rate of p-Ps and o-Ps, which is also very
close to the annihilation rate of Ps, the o-Ps annihilation rate as a function of
free-volume radius, R, is then given by
τpick−off = (2P )−1 =1
2
[1− R
R + ∆R+
1
2πsin
(2π
R
R + ∆R
)]−1. (4.11)
The empirical parameter ∆R represents the overlap between the Ps wave
function and those of the electrons in the layer. The parameter ∆R can be
determined by tting the observed τ3 in materials with well characterized small
pores [102]. The best-tted value of ∆R for all known data is found to be
1.68 Å [102, 105].
81

4.5 The Tao-Eldrup model
Figure 4.6: Pore radius as a function of the increasing density as obtained applying
the Tao-Eldrup model using the o-Ps lifetime as described in the text.
It is worth noting that the Tao-Eldrup model assumes that the Ps is in its
atomic ground state so it works only in small pores, R ≤ 2.5 nm [105].
The mean voids radius R is reported in gure 4.6 as a function of the sample
density. In the 6 GPa sample where the two decomposition described in 4.4
coexist, we consider an intensity weighted average of τ3.
Figure 4.6 shows that the voids radius shrinks by about the 100% when the
density is increased by about 22%. As a matter of facts the radius of the voids
in normal silica is about 2.5 Å and it drops to 1.3 Å in the 8 GPa densied
sample. The considered pore is the center of a 3D cage [17, 106]. The R values
presented in 4.6 are in agreement with a void spaces molecular dynamics (MD)
analysis in densied silica [107].
82

Medium range order and voids in permanently densied vitreous silica
4.6 Medium range order in permanently densi-
ed v-SiO2
At this point we can qualitatively discuss how the v-SiO2 structure is aected
by the densication procedure.
Diraction data by Inamura and co-workers [72] shows that, in similar den-
sication range, the SRO, i.e. the Si(O1/2
)4thetrahedral structure is scarcely
inuenced by the densication. On the other hand, the FSDP is strongly aected
by the density increase and it is shifted upwards by about 18%. The FSDP is
an universal feature of glasses and liquids and it is considered as a ngerprint of
the existence of the MRO. We can interpretate its density behavior as a proof
of a modication in the MRO domain.
On the other hand, present data suggest that the open network of normal
v-SiO2 is lled causing the dramatical drop of the voids size highlighted in gure
4.6.
A densication mechanism which account for these experimental observation
has been proposed by Sampath and co-workers for permanently densied v-
GeO2 [92]. In a simple 2D view normal silica is characterized by tetrahedra rings
[106]. The applied hydrostatic pressure induces a distorsion of the tethrahedra
packing. They will rearrange shrinking the volume of the inter tetrahedral rings
[106]. Increasing further the densication, coordination number modication will
appear, marking the transition from fourfold to sixfold coordinated structure
[73].
4.7 The voids size and the FSDP
As already pointed out in the previous chapter the presence of the FSDP is
thought as the ngerprint of the presence of MRO. It can be schematically
83

4.7 The voids size and the FSDP
and roughly seen as the signature of a quasi-periodic arrangement of period
R = 2π/Q1 which has a correlation length of L = 2π/∆Q1, where Q1 is the
peak position ad ∆Q1 the peak width.
Figure 4.7: Pore radius R and FSDP associated length R, both normalized to the
normal silica value. Black squares are neutron diraction data, from ref. [72] whereas
blue diamonds indicate the FSDP position as obtained by an S (Q,ω = 0) scan during
the IXS experiments.
Having two quantities which describes the medium range, a correlation at-
tempt sounds natural. A rst approach is to compare the voids radius R with
the lengthscaleR. At this stage we are interested only in comparing their trends,
so gure 4.7 reports the length R and the pore radius R normalized to their
normal silica value. Despite both follow a linear trend the slope is completely
dierent, R changes by about 18% whereas R by about 100%.
To improve our comprehension of the correlation between the FSDP and the
measured void we consider the void-cluster model rstly proposed by Blétry [93]
and subsequently utilized by Elliott [21, 18]. Within this framework the glass
network is approximated as a mixture of spherical atoms and holes, having about
84

Medium range order and voids in permanently densied vitreous silica
the same diameter and concentration. These spheres are arranged in a packing
which maximizes the local chemical short-range order of atom and voids. In
our case atoms are cation centered clusters, i.e. A(X1/2
)4tetrahedra. Atoms
are separated by the average distance d ≡ rA−A and they are surrounded by
spherical voids at an average distance D from the cations.
According to Blétry [93] such simplied system originates a peak in the
concentration - concentration partial structure factor Scc (Q) in the Bhatia-
Thornton formalism [108], and thus in the static structure factor. If atoms and
voids have the same dimension d = 3.08 Å [17], the FSDP position is given by:
Qmodel1 ' 3π
2d. (4.12)
Equations 4.12 can be generalized to the case of dierent atoms and holes
sizes. Considering δ = D/d = 1 + ε the FSDP becomes shifted to the value
Qmodel1 ' 3π
2d
(1− ε
2
)=
3π
2d
(3
2− D
2d
). (4.13)
The cation-void distance D of eq. 4.13 can be decomposed as
D = R + rSi, (4.14)
where R is the void radius and rSi = 0.4 Å is the silicon crystalline radius [109].
Figure 4.8 shows the comparison between the FSDP position measured by
neutron and X-ray and the calculated Qmodel1 by means of the model. It can be
seen that the proposed approach produce data which shows a qualitative agree-
ment, with a small overestimation by about 2%. To obtain a better agreement
we x rSi to obtain Qmodel1 (0 GPa) = Q1 (0 GPa). The red open circles are ob-
tained with rSi = 0.6 Å. This discrepance can be due to a screening eect of the
oxygen atoms, whose radius is greater then the silicon one, rO = 1.26 Å [109].
Recent X-ray and neutron diraction measurements in vitreous silica by
Mei and co-workers have pointed out that the Scc (Q) does not present any
85

4.7 The voids size and the FSDP
Figure 4.8: Comparison between the measured FSDP position Q1 and Qmodel1 calcu-
lated as described in the text using the ionic radius rSi (red bullets) and the optimized
value (red open circles). Black squares are neutron diraction data, from ref. [72]; blue
diamonds indicate the FSDP position as obtained by an S (Q,ω = 0) scan during the
IXS experiments.
86
Medium range order and voids in permanently densied vitreous silica
peak compatible with the FSDP, thus criticizing the Blétry-Elliott model [20].
Alternative models such as the approach proposed byWright [17] presents strong
analogies in the microscopical picture originating the rst sharp diraction peak.
As a matter of fact, Blétry's void centered atoms cluster is replaced by a periodic
repetition of void centered cages [92, 20]. In both cases we are considering a void
centered cluster of Si(O1/2
)4tetrahedra. This strong analogy and the good result
obtained using the Blétry approach could suggest that, even it is not rigorously
correct, the model is accounting for an underlying more general property.
4.8 Density evolution of structural and dynami-
cal quantity
In this section we will try to summarize the observation about the evolution of
structural and dynamical quantities as a function of the density in permanently
densied vitreous silica.
The rst results obtained in chapter 3 is that ωBP doubles its position when
the density is increased by the 22%. Conversely the Debye frequency ωD which
describes the elastic medium evolution shows a weaker density dependence.
In this chapter we have dealt with the structural evolution of the densied
material. The rst sharp diraction peak shows a variation of its position Q1 of
about ∼18% whereas the width is almost unchanged. In the common and quite
accepted view of the FSDP, this means that the MRO extent in the glass is
not substancialy modied whereas the densication acts on its periodicity. The
investigation of the dimension of the interstitial voids in vitreous silica shows
an abrupt shrinkage of the voids volume as a function of the density ρ. As a
matter of fact the voids radius is reduced by 50%. The inter tetrahedral voids are
one of the main features characterizing the medium range in glasses [106, 20].
87

4.8 Density evolution of structural and dynamical quantity
The use of a model based on the chemical ordering of thetrahedral clusters and
voids [93, 21, 18] allows to link the evolution of the void spaces with the FSDP
reproducing quantitatively both its position and evolution.
In gure 4.9 we report a comparison between the normalized BP position and
the FSDP position which shows a weaker trend. Conversely the inverse of the
void-silicon distance D shows a remarkable good agreement with the observed
boson peak position.
Figure 4.9: Density evolution of the BP and of the Q1 and 1/D; symbols are as in
the legend. Each dataset is normalized to its normal silica value.
A proposed model for the origin of the boson peak links its appearance to
the lowest energy van Hove singularity in the vibrational density of states g (ω)
[37, 69, 66]. Within this framework the boson peak is originated by transverse
acoustic modes which pill-up near the the border of the Brillouin zone [37, 69].
As a matter of fact, even if the absence of translational periodicity prevents
the construction of a reciprocal lattice, the peaks in the static structure factor
act as reciprocal vectors giving origin to a pseudo-periodic structure already
observed in many materials [110, 111]. The border of the rst pseudo Brillouin
88

Medium range order and voids in permanently densied vitreous silica
zone (p-BZ) is thus Q1/2.
Following this line of argument, the BP will mark the maximum of the
transverse acoustic branch. However the attening of the trasverse branch can
anticipate the appearance of this maximum at Q0. The attening of the trans-
verse branch has been observed by means of IXS [112, 113] and MD simula-
tions [70, 69]. We can thus dene an eective p-BZ border corresponding to the
maximum of the branch, i.e. the BP position [66, 61]. Assuming a sinusoidal
dispersion of the transverse branch up to the maximum, the position of the BP
reads
ωBP ∝π
2
vTQ0
. (4.15)
We assume that Q0 ∝ 1/D, where D is the void silicon distance detailed in eq.
4.14 with rSi = 0.6 Å. This result is reported in gure 4.10.
It is worth to note that the ωBP refers to g (ω) whereas ωBP is determined
as the maximum in g (ω) /ω2. Assuming a log-normal shape for the BP in the
reduced VDOS [76] we can transforme ωBP to ωBP as
ωBPe−2σ2
−→ ωBP , (4.16)
where σ is the variance of the log-normal.
Experimental tted values of σ (ρ) are very close, hence the transformation
in eq. 4.16 does not strongly perturb the trend.
The BP trends reported in gure 4.10 are in good agreement. To obtain data
on absolute units, it is needed a determination of the proportionality between
1/D and Q0. A possible way exploits the similarity between 8 GPa densied
glass and α-quartz polycrystal which will be presented in the chapter 5. In
any case, even if from a qualitative point of view, this nding suggests that
the evolution of the BP can be explained by considering the evolution of the
dispersion curve of the transverse acoustic branch. The BP is related to the
89

4.8 Density evolution of structural and dynamical quantity
Figure 4.10: Density evolution of the measured boson peak position with that calcu-
lated using eq. 4.15 and 4.16; symbols are as in the legend. Each dataset is normalized
to its normal silica value.
evolution of an eective Brillouin zone border as well as to the modications of
the elastic constants trough the sound velocity.
90

Chapter 5
Elastic continuum and microscopic
dynamics in glasses
Si l'ordre est le plaisir de la raison,
le désordre est le délice de l'imagination.
P. Claudel
In a recent paper by Chumakov and co-workers have shown the gradual
transformation with pressure of the boson peak of the sodium silicate glass
Na2FeSi3O0.85 in the transverse acoustic van Hove singularity of aegirine, i.e.
the corresponding crystal [66]. This nding is mainly obtained by means of
nuclear inelastic scattering (NIS) and ab-initio calculations. Glass and crystal
show an equal excess of states above the Debye level. This observation suggests
that the VDOS of a glass is similar to that of a crystal, consisting only of acoustic
modes without any additional modes. These acoustic modes are modied by the
disorder but their energy spectrum does not dier qualitatively from that of the
crystal (apart from an additional broadening). The boson peak originates from
the piling up of these acoustic states near the boundary of the pseudo-Brillouin
zone.
91

5.1 Inelastic X-ray scattering experiments
As a matter of fact, even if the reciprocal lattice cannot be rigorously dened,
the existence of a pseudo Brillouin zone (p-BZ) has been already observed in
glasses [110, 111]. In particular the peaks in the static structure factor act as ill
dened reciprocal vectors. The size of the rst p-BZ is thus Q1, the position of
the FSDP, being Q1/2 the position of its border. On the other hand, dynamical
data show that the transverse branch can reach its maximum before the p-BZ
border thus dening an eective zone border Q0 [66, 61].
Triggered by such considerations, we have carried out a direct investigation
of the modes in both polycrystalline α-quartz and in the permanently densied
glass with the corresponding density. This comparison is possible exploiting the
8 GPa permanently densied silica sample. NIS spectroscopy is a good tool to
determine the vibrational density of states g (ω), if a Mössbauer atom is present
[114]. On the other hand it does not allow the direct investigation of the modes
which are probed by IXS.
In this chapter we will show some preliminary results of this comparison
between the response of the glass and that of the polycrystal. The vibrational
dynamics is marked by a characteristic wavelength ξ, which separates the macro-
scopic elastic response from the microscopic dynamics, where polycrystalline
and glassy spectra are almost indistinguishable. At higher Q, where spectra are
proportional to g (ω) /ω2 the crystal spectrum shows a peak at 9 meV which is
very close to the boson peak of the glass.
5.1 Inelastic X-ray scattering experiments
Silicon dioxide SiO2 presents nineteen dierent crystalline phases; among these
α-quartz is the stable one at room temperature and pressure. The density of the
α-quartz is 2.65 g/cm3 which is really close to ρ8 = 2.67± 0.01 g/cm3 measured
for the 8 GPa sample, see table 3.1.
92

Elastic continuum and microscopic dynamics in glasses
Inelastic X-ray scattering experiments on both polycrystalline α-quartz and
8 GPa permanently densied glass were performed at the high resolution beam-
lines ID16 and ID28 at the European Synchrotron Radiation Facility (ESRF)
in Grenoble (France).
The layout of ID28 has been already presented in section 3.5.1. In general
ID16 is quite similar: actually ID28 is based on ID16 layout. The main dier-
ences are the absence of the post-monochromator, and the dimension of the
experimental hutch of the beamlines: ID16 analyzers arm is limited only to
0 ≤ ϑ ≤ 13 whereas ID28 arm can span between 0 and 50.
Figure 5.1: Polycrystalline sample in the mylar sample holder.
Measurements were performed using the (12 12 12) reection of the silicon
monochromator. This allows an experimental resolution of about ∆E ' 1.3 meV
(FWHM), which has been measured on a plexiglass slab. Low Q measurement
on the polycrystal were performed on ID16 whereas high Q measurements and
the whole investigation on the 8 GPa sample were carried out at ID28. Moreover
in order to compare the datasets acquired on dierent instruments, we measured
93

5.1 Inelastic X-ray scattering experiments
also a reference low Q polycrystal spectra at ID28.
The polycrystalline powder has been obtained by crushing a single crystal in
a mortar. The size of the so obtained grains is bigger than commercial powders,
thus preventing small angle scattering eects. The quartz powder was contained
in a mylar cylindrical tube (wall thickness ∼5 µm) and xed between two caps.
A lead strip above the sample position has been placed to ease the alignment
procedure. Figure 5.1 shows the mylar sample holder loaded with the sample.
Low Q measurements on the SiO2 glass have been performed at T = 573 K.
Conversely, the investigation on the polycrystal and the high Q measurements
on the glass have been carried out at room temperature.
5.1.1 IXS spectra: polycrystal versus glass
Low Q spectra obtained for the two samples are reported in gure 5.2 at almost
the same Q value. The polycrystal, g. 5.2(a), has been measured quite far from
a Bragg peaks. This results in a reduct elastic line. The inelastic features are
clearely visible. In the glass, g. 5.2 (b), the inelastic part of the spectra appears
masked by the more relevant elastic contribution.
Figure 5.3 shows the Q evolution of the inelastic part of the spectrum of both
glass and polycrystal. The inelastic part is calculated by subtracting the elastic
line as obtained by tting the spectrum with a δ function convoluted with the
experimental resolution (actually the model function includes also the inelastic
part as reported in eq. 5.1. In order to safely compare datasets coming from
dierent experiments and instruments, experimental data have been corrected
for the detectors eciency as well as for the measured transmission, and for the
Bose-Einstein population factor.
The Q evolution is reported in gure 5.3, from 1.3 nm−1, inset (a), up to 72
nm −1 inset (f).
In the low exchanged wavevector region, Q . 2 nm−1 the polycrystal spectra
94

Elastic continuum and microscopic dynamics in glasses
Figure 5.2: Comparison between IXS spectra of the polycrystalline α-quartz (a) and
the 8 GPa permanently densied silica sample (b). The Q values are reported in the
plot. Black circles are the experimental data, red line is the best t using the model
of eq. 5.1. The green line is the experimental resolution and the blue line the inelastic
component. The intensities are normalized to a 100 mA current in the storage ring
and are reported as counts per 60 s.
95

5.1 Inelastic X-ray scattering experiments
Figure 5.3: Comparison between IXS spectra of the polycrystalline α-quartz (blue
open circles) and of the 8 GPa permanently densied silica sample (black dots). The
Q values are reported in the insets. The red line results from a t of the polycrystal
data with one DHO (insets (a) and (b)) and with six lorentzian functions. The green
lines are the t with one DHO in the glass. The intensities are normalized to a 100
mA current in the storage ring and are reported as counts per 60 s.
96

Elastic continuum and microscopic dynamics in glasses
are broader than the glass ones. As a matter of fact, in the large wavelength limit
elastic waves in an isotropic solid have dened polarization, either longitudinal
or transverse. In this case the dynamic structure factor S (Q,ω) shows only one
peak which is associated with the longitudinal wave. Conversely, in crystals this
holds only along few symmetry directions. The dynamic structure factor of a
polycrystal can be approximated as the orientational average on the single crys-
tal one, so a small transverse (or quasi transverse) component is expected [115].
Actually, polycrystal spectra in gure 5.3 show a relevant transverse component
in the whole explored range. Figure 5.3(c) shows two transverse peaks.
In general, the glassy spectrum is smoother than the polycrystalline one. At
high Q the glass spectrum also shows a transverse excitation. Furthermore, in
this region optic excitations grow, being comparable to acoustic ones.
Increasing Q, polycrystal and glass spectra looks similar and above a certain
value almost identical. The last inset, 5.3(f) refers to Q = 72 nm−1 where
S (Q,ω) ∝ g (ω) /ω2 [115]. The polycrystal shows a peak which is very close to
the BP of the glass, even if the BP is broader.
It is worth to note that the precise nature of the glass vibrational modes
cannot be extracted from this comparison. Due to the orientational average, we
can only conclude that a glass mode at a given energy is a linear combination
only of a limited subset of all the crystal eigenstates, with unknown coecients.
5.2 The determination of Qc
In order to determine the wavevector which marks the transition between the
two regimes we have tted the spectra using a simple single excitation model
function, namely:
S (Q,ω) = Ael (Q) δ (ω) + Ainel (Q)1
π
Ω (Q)2 Γ (Q)(ω2 − Ω (Q)2
)2+ ω2Γ (Q)2
. (5.1)
97

5.2 The determination of Qc
where Ael describes the intensity of the elastic component whereas Ainel, Ω, and
Γ refer to the inelastic propagating excitations and they respectively represent
the intensity, position and attenuation. This analysis allows us to estimate the
FWHM Γ of the inelastic part of the spectra.
As usual, the experimental intensity can be written as:
I (Q, ~ω) = I0 (Q)R (~ω)⊗S (Q, ~ω)
~ωKBT
[n (~ω, T ) + 1]
+ bkg, (5.2)
n (~ω) is the Bose factor, the term [n (ω) + 1] ~ω/KBT account for the quantum
nature of the interaction and fulll the detailed balance principle. The baseline
term is added in order to take into account the electronic background of the de-
tector and the environmental background. Moreover, the overall intensity factor
I0 (Q) is a normalization factor which is inuenced by the atomic form factors,
the eciency of the analyzers, and by all other angle-dependent instrumental
correction factors. An example of the t obtained using this model is reported
in gure 5.2.
Neglecting a detailed description of the evolution of the spectral features,
the main point highlighted by g. 5.3 is that the two systems are very similar for
Q greater than Qc ∼ 2.5 nm−1. This value can be better dened by comparing
the Γ of the polycrystal and that of the glass, as reported in gure 5.4.
For Q > Qc ' 2 nm−1 both glass and polycrystal follow a ∼ Q2 law [25,
29, 86, 116]. For Q < Qc the broadening of the crystal spectrum has a linear Q
dependence, as expected in the case of a linear dispersion curve. On the other
hand the glass shows a lower Γ which follows a ∼ Q4, Rayleigh scattering law.
This Q4−Q2 regime has been already observed for normal silica [116, 117] and
more fragile system like glycerol [86]. This nding highlights a situation more
complex than the simple ∼ Q2 law observed in previous experiments [25, 29],
deserving further studies.
The value Qc ' 2 nm−1 can be associated to a length ξ = 2π/Qc ∼ 30 Å,
98

Elastic continuum and microscopic dynamics in glasses
Figure 5.4: Comparison between Γ of the polycrystalline α-quartz (blue open circles)
and 8 GPa permanently densied silica sample (black dots). The red lines highlight
the behavior Γ (Q) behavior marking the appearance of the crossover Qc.
about 20 interatomic distances which marks the crossover between the two
regimes. The static length ξ is in agreement with the size of the typical elastic
heterogeneities observed in MD simulations of silica [118, 119]. These numerical
works investigate the correlation length of large vortices related to the response
of transversal motions of particles when they respond to an external deforma-
tion. These non ane displacement marks the transition between a region where
the classical elastic theory holds to a region it is subject to strong limitations
[119]. Present data suggest that the origin of the departure from classical behav-
ior is related to the local anisotropy given by the ordered crystal like structure.
99

5.2 The determination of Qc
100

Chapter 6
A glass exhibiting a crystal-like
behavior: the case of SiSe2
Bene olet qui nihil olet.
Latin proverb
In the previous chapters we have already highlighted some of the most problem-
atic points concerning the vibrational properties of glasses. In this chapter we
will try to shed some new light on the nature of the high frequency collective
dynamics, investigating the silicon diselenide.
Silicon-selenium glasses are strong covalently bounded glasses belonging to
the chalcogenide family, which have a broad technological interest. Their semi-
conducting properties were revealed by Kolomiets [120] allowing a wide spec-
trum of technological applications, ranging from the optical bers to the new
phase-change memories (PRAM), which are expected to take over from the
actual ash memory technology [121].
Also from a scientic point of view, chalcogenide systems such as GeSe2 and
SiSe2 are of primary concern. As a matter of fact they are strong glasses exhibit-
ing structures based on both corner and edge sharing tetrahedra. Conversely,
101

the prototypical strong glasses v-SiO2 and v-GeO2 are characterized by a corner
sharing structure.
Vitreous GeSe2 has been recently investigated by Orsingher and co-workers
displaying the existence of a propagating mode and an optic-like excitation
located at about the BP energy [122]. In this chapter we focus on the less
studied vitreous SiSe2 which displays very interesting features.
Silicon-selenium glasses SixSe1−x can be prepared by melt quenching tech-
niques over a wide interval of composition, ranging from x = 0, i.e. the pure
selenium glass, to x = 0.5 [123]. The only note crystalline phase is the SiSe2
whose structure at ambient pressure contains only edge-shared Si(Se1/2
)4tetra-
hedra. This arrangement leads to a connected molecular network with macro-
scopic extension only in one dimension. These chains are held together by van
der Waals bonding at a distance of about 6-7 Å[124, 125] or via corner shear-
ing tetrahedra [126, 127]. This arrangement is also retained by the SiSe2 glass,
which is reported of a high degree of medium range order [127]. Moreover, BLS
measurements as a function of the composition show a minimum for x = 0.333
with a low sound velocity.
Inelastic neutron scattering measurements were performed at three instru-
ments: BRISP and IN3 at the High Flux Reactor of the Institue Laue-Langevin
in Grenoble; TOFTOF at the reactor Heinz Maier-Leibnitz FRMII in München.
The combined use of these three datasets, spanning dierent portions of the
(Q,E) plane, allows to produce a detailed picture of the vibrational dynamics
in the THz. The aim of this study is to investigate the character of the excita-
tions up to the rst pseudo Brillouin zone and beyond. The ultimate challenge is
to shed some new light on the low frequency mode (or modes) which originates
the boson peak.
102

A glass exhibiting a crystal-like behavior: the case of SiSe2
6.1 Sample preparation: vitreous SixSe1−x
The preparation and the handling of silicon-selenium glasses require great at-
tention to details and safety rules. As a matter of fact SiSe2 is quite reactive and
it hydrolyzes very quickly upon exposure to room environment. In air, it pro-
duces a very bad smell which warns that toxic selenium compounds are forming.
Moreover, conventional melting largely results in a crystallization of the sample.
For these region, following ref. [128], we used a non stoichiometric composition,
SixSe1−x with x = 0.365, implementing several tricks able to assure a successful
standard production procedure.
The glass was prepared starting from silicon powder (Aldrich, purity greater
than 99.999%, mesh-60) and selenium powder (Aldrich, purity greater than
99.995%, mesh-100).
To avoid air contamination the whole glass preparation procedure was car-
ried out in sealed quartz ampules. Each ampule was obtained starting from a
self-made quartz test-tube of 10 mm (external diameter) and about 20 cm long.
Each test-tube was rstly outgassed in vacuum using a welding torch and the
vacuum apparatus schematically depicted in gure 6.1.
Figure 6.1: Schematic representation of the vacuum apparatus used in the production
of the sample.
A small amount (5 g) of silicon and selenium powders, mixed in the selected
composition, was put in the test-tube. After the lling, the test-tube was con-
103

6.2 Characterization of the v-SiSe2
nected to the vacuum apparatus in gure 6.1, evacuated to a pressure of P = 100
mbar and then relled with argon. This washing procedure was repeated three
times. After that, the tube was lled with argon (P = 2 ÷ 4 mbar) and sealed
with the welding torch.
The powder was homogenized at 1100C in a furnace for at least 96 hours.
The ampules were heated in horizontal, carefully checking for an uniform dis-
tribution of the powder on the whole ampules length. Before the quenching the
temperature was lowered to 1000C for an hour. The ampules were quenched in
room temperature water, paying attention in keeping the horizontal position of
the tube.
A successful quenching produces an yellowish glass, gure 6.2(a). This colour
characterizes the composition range 0.333÷0.365 [123]. Sample were character-
ized by Raman scattering to verify the glassy nature, see section 6.2. However,
the dierences between the glass and the crystalline material can be appreciated
also by a visual inspection, as shown in gure 6.2(b) and (c).
This preparation protocol allows the preparation of about 60 g of glassy
sample.
In the following we will refer to the sample as SiSe2 using the appropriate
x-dependent data for every comparison.
6.2 Characterization of the v-SiSe2
Figure 6.3 shows a Raman spectrum of one of the SiSe2 samples produced as
described in section 6.1. Raman measurements were performed with the same
apparatus described in section 3.2, keeping the bulk sample inside its quartz
ampule. A zoom of the BP region is reported in the inset. The peak position
results ωRamanBP = 12.5± 0.2 cm−1.
The Raman scattering spectra has been compared to the crystalline one by
104

A glass exhibiting a crystal-like behavior: the case of SiSe2
Figure 6.2: (a) Quartz ampules containing glassy silicon diselenide. Visual inspection
of a glassy (b) and crystalline sample (c). This operation was performed inside a
glove-box.
105

6.2 Characterization of the v-SiSe2
Figure 6.3: Raman scattering spectra of v-SiSe2; the BP region is reported in the
inset. The arrow marks the ωRamanBP = 12.5± 0.5 cm−1. Spectra were measured in VV
polarization.
Tenhover and co-workers in refs. [124, 125]. Spectra are very similar and the
molecular modes are at about the same frequency. In particular the 216 cm−1
mode represents the symmetric vibration of the four outer chalcogens of the
bitetrahedral unit and it retains the same relative intensity in crystals as well
as in glasses. This is considered as an indication of the presence of medium
range order in the form of edge sharing chains [124, 125].
A complete structural analysis of the system SixSe1−x as a function of x has
been done by Johnson and co-workers [129]. Neutron diraction and EXAFS
data indicate a signicative chemical ordering in the glass supporting the idea of
the edge sharing chains. As a matter of fact when the concentration is increased,
the diraction pattern shows a pre-peak which evolves as a function of x and
a sharpening of the subsequent peak, see g. 6.4. In the following we will refer
to these peak as pre-peak Qpp for the rst peak and rst sharp diraction peak
Q1 for the second one. These names are after Johnson but are used only to
106
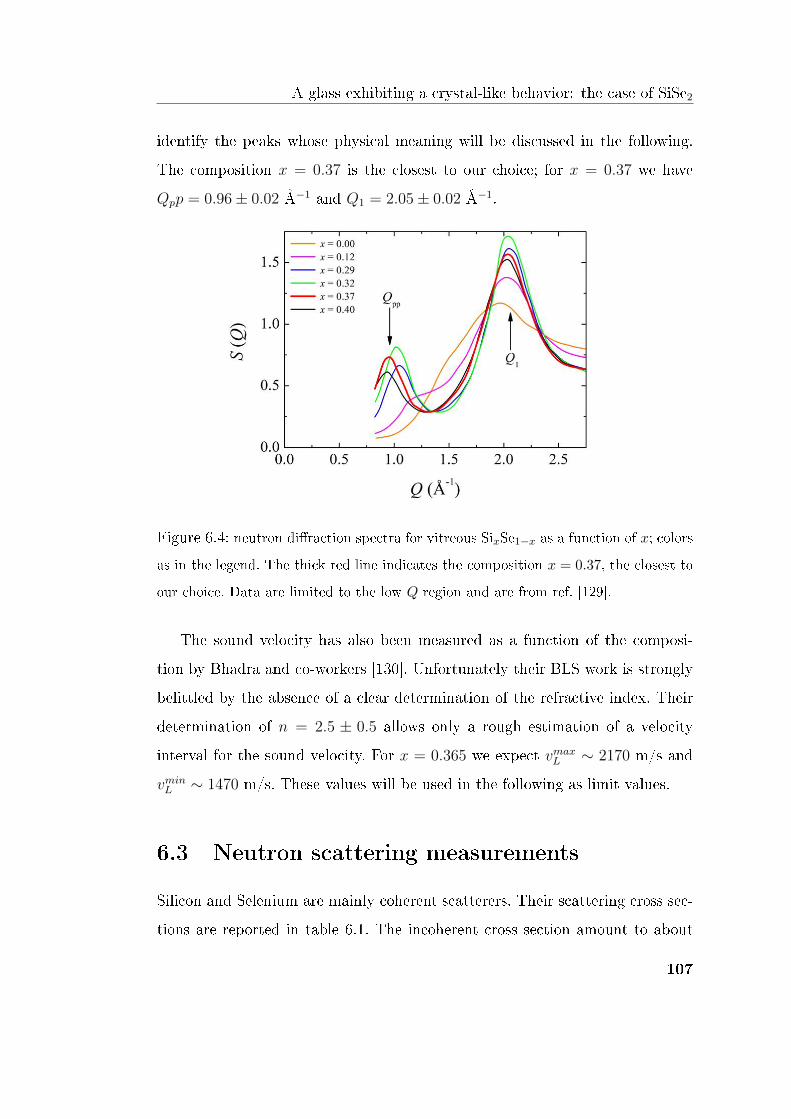
A glass exhibiting a crystal-like behavior: the case of SiSe2
identify the peaks whose physical meaning will be discussed in the following.
The composition x = 0.37 is the closest to our choice; for x = 0.37 we have
Qpp = 0.96± 0.02 Å−1 and Q1 = 2.05± 0.02 Å−1.
Figure 6.4: neutron diraction spectra for vitreous SixSe1−x as a function of x; colors
as in the legend. The thick red line indicates the composition x = 0.37, the closest to
our choice. Data are limited to the low Q region and are from ref. [129].
The sound velocity has also been measured as a function of the composi-
tion by Bhadra and co-workers [130]. Unfortunately their BLS work is strongly
belittled by the absence of a clear determination of the refractive index. Their
determination of n = 2.5 ± 0.5 allows only a rough estimation of a velocity
interval for the sound velocity. For x = 0.365 we expect vmaxL ∼ 2170 m/s and
vminL ∼ 1470 m/s. These values will be used in the following as limit values.
6.3 Neutron scattering measurements
Silicon and Selenium are mainly coherent scatterers. Their scattering cross sec-
tions are reported in table 6.1. The incoherent cross section amount to about
107

6.3 Neutron scattering measurements
∼ 0.2% (Si) and ∼ 4% (Se) of the total. Since our sample is a coherent scat-
terer, it allows the study of the collective mode safely neglecting the incoherent
contributions.
elements σcoh σinc σabs
(barns) (barns) (barns)
Si 2.1699(10) 0.004(8) 0.231(3)
Se 7.98(2) 0.32(6) 11.7(2)
Table 6.1: Neutron coherent scattering cross section σcoh, incoherent scattering cross
section σinc, and absorption cross section σabs for Si and Se [131].
Neutron scattering experiments were performed using specially designed vac-
uum tight cells. To load the cells, the bulk glass was crushed in a mortar to ob-
tain a ne powder. This operation was performed, both at ILL and FRMII, in
a argon lled glove box. The density of the powder was estimated by weighting
the sample and evaluating the lled volume inside the experimental cell. This
leads to ρp ∼ 2.2 g/cm3 about 2/3 of the bulk density ρb = 3.22 ± 0.05 g/cm3
[123].
In the following we report a brief description of the used instruments as well
as of the instrumental setups.
6.3.1 BRISP
BRISP (BRIllouin Spectrometer) is a time of ight (TOF) instrument, speci-
cally built to perform small-angle spectroscopy with thermal neutrons [132, 133].
BRISP is placed at the exit of the 35 inclined thermal beam tube IH3, in
the ILL reactor hall, and is located on a 4 m high seismic-proof steel platform.
Its design is based on a hybrid conguration, conjugating a focusing crystal
monochromator, to dene the energy of the incident neutrons and a rapidly
108

A glass exhibiting a crystal-like behavior: the case of SiSe2
rotating Fermi chopper, which enables a high-resolution TOF analysis of the
scattered neutrons. The instrument scheme is reported in ref. [132].
The desired wavelength is extracted from the in-pile white beam via Bragg
reection at a multi-crystal focusing monochromator. The beam is chopped into
broad neutron pulses by a rst chopper. This device, named backround chopper,
is designed to lower the incident beam background and, properly phased with
the Fermi chopper, it minimizes the high orders contamination of the beam. The
monochromatic neutron pulses are then collimated by an honeycomb converging
collimator. This collimator provides both high transmission and convergence
collimation in both the vertical and the horizontal scattering. However, if a
high neutron ux on the sample is needed, the honeycomb can be opened and
replaced with B4C diaphragms. The collimated beam passes through a rapidly
rotating Fermi chopper which provides the time reference for the TOF analysis.
The neutron pulses are scattered by the sample and nally collected by a large-
area two-dimensional detector. The detector is composed 3He tubes, which can
determine the position of the impinging neutrons within a precision of 1.3 cm
in the horizontal direction and 1.1 cm in the vertical one. The detector array is
mounted on a translation stage that allows variations of the sample-to detector
distance in a 1.5-6 m range, to adapt accessible angular range, angular resolution
and scattered intensity to the desired values The entire beam-line is set under
vacuum and carefully shielded in order to obtain a low background noise.
In the present experiment we used an incident wavelength of 1 Å (reection
(0 0 4) of the PG monochromator) setting the detector at a distance of 4 m. The
measurements were done at room temperature, keeping the sample under high
vacuum. To increase the incident ux the honeycomb collimator was opened us-
ing some B4C diaphragms to achieve a Q resolution better than ∆Q < 0.05 Å−1.
The energy resolution was measured on a vanadium slab, obtaining ∆E = 3.2
meV.
109

6.3 Neutron scattering measurements
Figure 6.5: Kinematical range of BRISP in the conguration described in the text.
The region lled with green slanted lines represents the experimental resolution. The
blue lines are the extrapolation of the BLS longitudinal maximum and minimum sound
velocities, [130].
The sample was loaded in a at aluminum tight cell with a sample pit of
50× 30× 10 mm3 and wall thickness of 0.9 mm. The vacuum tight was ensured
by a viton o-ring. A B4C mask was designed to screen the o-ring and thickest
part of the cell, thus selecting the scattering volume on the sample.
6.3.2 TOFTOF
TOFTOF is a direct geometry multi-chopper time-of-ight spectrometer, lo-
cated at the research neutron source Heinz Maier-Leibnitz FRMII in München
[134]. The instrument scheme is reported in ref. [134].
Neutrons, moderated by the cold source (D2 at 25 K), are guided through
an S-shaped curved neutron guide to the primary spectrometer. The guide also
acts as a velocity lter for the neutrons with a cutting edge of 1.38 Å. In the
primary spectrometer seven high speed neutron chopper discs are used to select
110

A glass exhibiting a crystal-like behavior: the case of SiSe2
short monochromatic neutron pulses from the continuous neutron beam. The
neutron pulses impinge on the sample and are scattered on the detectors which
are arranged tangentially to the intersection lines of the Debye-Scherrer cones
with the surface of a virtual sphere with a radius of 4m around the center of
the sample. The remote position of the spectrometer, in combination with the
S-shaped curved primary neutron guide, and an elaborate shielding concept
results in an excellent signal-to-background ratio.
The incident neutron wavelength can be selected from a broad continuous
neutron spectrum ranging from 1.4 to 12 Å. In the present experiment we chose
λ = 5 Å, obtained with a chopper frequency of 12000 rpm , leading to a gaussian
shaped resolution of ∆E ' 160 µeV (FWHM), measured on a vanadium rod at
T = 13 K.
The sample was loaded in a 50 mm high hollow cylinder container with
internal and external diameter of 18 mm ad 25 mm, respectively, and wall
thickness of 0.1 mm.
Figure 6.6: Kinematical range of TOFTOF in the conguration described in the text.
The region lled with green slanted lines represents the experimental resolution.
111

6.3 Neutron scattering measurements
6.3.3 IN3
IN3 is a classical three-axis spectrometer (TAS) located in the experimental
hall of the High-Flux Reactor of the Institut Laue-Langevin in Grenoble. The
schematic instrumental layout is reported in gure [133].
Figure 6.7: Schematic representation of the axes and angles involved in the triple axis
operations.
IN3 operates on a through-going thermal neutron guide. The name TAS
refers to the axes of the three components of the instrument: the monochroma-
tor, the sample and the analyzer, schematically reported in gure 6.7. IN3 is
equipped with a double-faced monochromator with PG(0 0 2) and Cu(1 1 1)
having variable curvature allows vertical focusing. The monochromator denes
the incident wavevector ki which can be varied by modifying the Bragg angle
ϑM . The IN3 analyzer is an horizontally focusing PG(0 0 4) and it receives the
112

A glass exhibiting a crystal-like behavior: the case of SiSe2
neutron scattered at ϑ. Those neutrons are reected at 2ϑA and those with a
particular wavevector kf are counted by the detector, which is an 3He tube.
The measurements were performed using the PG(0 0 2) monochromator,
performing constant Q scans with kf = 2.6625 Å−1. The scattered and the
analyzed beam was collimated using α2 = 60′ and α3 = 40′. In this experiment
was used the same sample and sample holder as for BRISP.
6.4 Neutron data analysis
In this section we will briey discuss the analysis of neutron inelastic scattering
data. Our target is the determination of the dynamic structure factor S (Q,E)
which is proportional to the double dierential cross section. We will focus on
the case of TOF instruments, adding some remarks for TAS data reduction.
Time of ight instruments record the number of scattered neutron as a func-
tion of the position (the scattering angle ϑ for TOFTOF; the pixel position (x, y)
for BRISP) and as a function of the time between the scattering event and the
detection. The rst step of the data analysis is the conversion of the data to
obtain the intensity I (Q,E). Moreover, to compare dierent datasets the in-
tensities are normalized to their monitor counts. The monitor is a low eciency
detector which is placed on the beam, in front of the sample. The normalization
to the monitor counts leads to data independent from the measuring time ∆t
and from the uctuation in time of the incident ux.
The measured scattered intensity of the sample inside the cell Iexps+c can be
written as:
Iexps+c = Is + Iss + Ics + Isc + Isc + Iscc + IBs+c; (6.1)
where Iss is the intensity due to multiple (double) scattering events involving
the sample, Isc and Ics are multiple (double) scattering events between cell and
113

6.4 Neutron data analysis
sample; Isc and Iscc are single and multiple scattering events involving the lled
cell, and IBs+c is the background intensity for the sample plus cell measurement.
To obtain the sought quantity, namely the single scattering sample intensity Is,
all these contributes have to be subtracted.
To account for all these factors, in addition to Iexps+c ancillary measurements
are needed. These generally are:
• Iexps , scattering from the empty cell;
• Iexpabs scattering from a full absorber (cadmium or B4C) having the same
dimensions of the sample plus container system;
• Iexpeb scattering from the environment obtained without any scatterer;
• Iexpv scattering from an elastic incoherent scatterer (Vanadium) to account
for instrumental eects and to determine the instrumental resolution.
In the present experiments, together with Iexps+c we have always performed
the measure of the empty cell and of the vanadium standard. In general, the
background aects all the measurements so it has to be subtracted from Iexps+c,
Iexpc , and Iexpv . The background measurement were carried out only at BRISP
and IN3 measuring Iabs on a B4C slab. Thanks to the shielding and its peculiar
design, IB (TOFTOF) can be safely neglected [134].
In order to properly subtract the contribution of the cell, we have to account
for the attenuating eects due to the sample. The proper transmission coecient
as well as the multiple scattering corrections can be calculated by performing
ad-hoc MonteCarlo simulations [135, 136].
The single scattering intensity Is is proportional to the sample double dier-
ential cross section but it depends also on the incident ux Φ0, on some detectors
parameter (∆Ω, ∆E and the eciency η) and on the number of scattering cen-
114

A glass exhibiting a crystal-like behavior: the case of SiSe2
ters N . Therefore Is reads
Is = Φ0∆E∆ΩNd2σ
dΩdE ′Ts (ϑ, ω) ; (6.2)
The scattering transmission Ts (Q,E), which accounts for the attenuation during
the scattering processes, can be computed via MC simulations [135, 136]. The
vanadium measure (once eciently corrected by the spurious eects) provides
a tool to normalize the data.
Finally, in the case of a coherent scatterer the dynamic structure factor
S (Q,E) can be written as:
d2σ
dΩdE ′=
kfki
[σcoh4π
S (Q,E) +σinc4π
Ss (Q,E)]
=kfki
[σcoh4π
S (Q,E)]
(6.3)
However, these quantities are convoluted with the instrumental resolution. The
instrumental resolution R (Q,E) is given by the vanadium spectrum.
In the case of TAS measurements, the scattered intensity is directly propor-
tional to the S (Q,E) and immediately accessible during the experiment without
the necessity of mapping between dierent spaces. The standard data analysis
for a TAS instrument is detailed in ref. [137]. The resolution function is described
in the quadri-dimensional reciprocal space [138]. The constant-amplitude con-
tours for the resolution function form a set of nested ellipsoids in (Q, E) space
and for a particular spectrometer conguration the details of these ellipsoids
depend only on the particular (Q0, E0) point. Therefore, the instrumental reso-
lution function has to be calculated using the know instrument parameters and
checked against the measured experimental one [138].
6.5 Experimental results
The use of three dierent instrument allows to cover broad region of the (Q,E)
plane with dierent resolutions. Where instruments overlap we can obtain com-
115

6.5 Experimental results
plementary information overcoming the limitations of the single data set. Table
6.2 shows the available Qs for each instrument and the overlap regions.
BRISP
(Å−1
)0.2 0.3 0.4 0.5 0.6 0.7 0.8 0.9 1.0 1.1 1.2 1.3 1.4 1.5
TOFTOF
(Å−1
)0.2 0.3 0.4 0.5 0.6 0.7 0.8 0.9 1.0 1.1 1.2 1.3 1.4 1.5
IN3
(Å−1
)0.2 0.3 0.4 0.5
Table 6.2: Q ranges spanned by the three instruments.
Figure 6.8 reports a selection of spectra obtained with the three instruments
at two dierent wave vectors; gure 6.9 shows a selection of spectra obtained in
the high Q region where only TOFTOF and BRISP are available.
The measured intensity can be written as
I (Q,ω) = I0 (Q)R (ω)⊗S (Q,ω)
~ωKBT
[n (ω, T ) + 1]
, (6.4)
where S (Q,ω) is the classic dynamical structure factor, multiplied for the~ωKBT
[n (ω, T ) + 1] in order to fulll the detailed balance condition, with n (ω, T )
the Bose-Einstein factor. R (ω) is the proper instrumental resolution. The pa-
rameter I0 (Q) is a scale parameter which depends on the instrument.
A rst guess for the model function S (Q,ω) could be the usual sum of a
delta function for the elastic component plus two inelastic components modeled
with two damped harmonic oscillators, namely
S (Q,ω) = Aelδ (ω)
+A1
π
Ω21 (Q) Γ1 (Q)
[ω2 − Ω21 (Q)]
2+ ω2Γ2
1 (Q)
+A2
π
Ω22 (Q) Γ2 (Q)
[ω2 − Ω22 (Q)]
2+ ω2Γ2
2 (Q). (6.5)
The subscripts 1 and 2 label the inelastic modes, respectively the highest energy
one and the lowest energy one. The model function eq. 6.5 comprises seven
116

A glass exhibiting a crystal-like behavior: the case of SiSe2
Figure 6.8: Inelastic neutron scattering spectra measured at two selected Q; Q =
0.3 Å−1, left panels ((a), (c), and (e)); Q = 0.5 Å−1, right panels ((b), (d), and (f));
(a) and (b) are measured on BRISP; (c) and (d) on IN3; (e) and (f) on TOFTOF.
The red line is the best t whereas the blue line are the inelastic component described
in the text: 1 (solid line), 2 (dashed line) 3 (dash-dotted line).
117
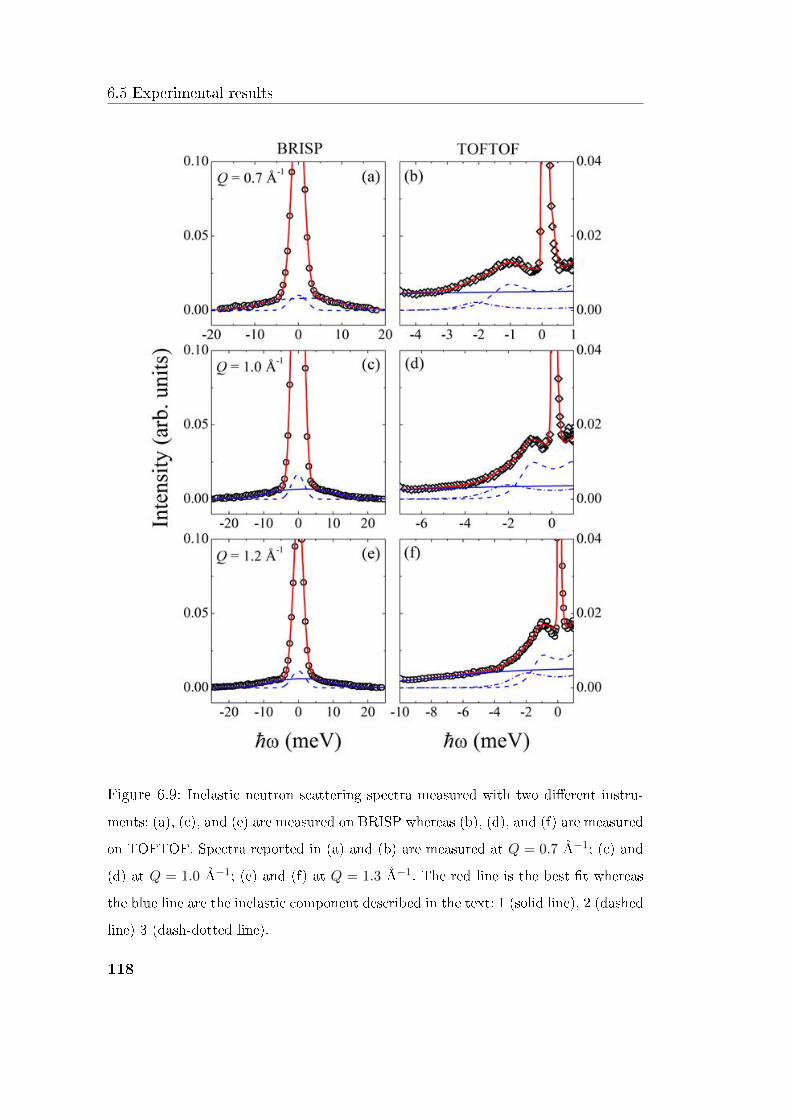
6.5 Experimental results
Figure 6.9: Inelastic neutron scattering spectra measured with two dierent instru-
ments: (a), (c), and (e) are measured on BRISP whereas (b), (d), and (f) are measured
on TOFTOF. Spectra reported in (a) and (b) are measured at Q = 0.7 Å−1; (c) and
(d) at Q = 1.0 Å−1; (e) and (f) at Q = 1.3 Å−1. The red line is the best t whereas
the blue line are the inelastic component described in the text: 1 (solid line), 2 (dashed
line) 3 (dash-dotted line).
118

A glass exhibiting a crystal-like behavior: the case of SiSe2
parameters: the intensity of the elastic line Ael, the intensity Ai, position Ωi,
and damping parameter Γi of the inelastic components, i = 1, 2. The scale factor
I0 (Q) depends on the instrument. Conversely the intensity Ael (Q), A1 (Q) and
A2 (Q) are equal for the three instruments. As a matter of fact, since the static
structure factor S (Q) is the energy integral of the total intensity, they are not
independent.
Despite the large numbers of parameters, the availability of data with dier-
ent resolutions and dierent kinematic ranges allows an accurate determination
of the free parameters from an overall tting procedure. As it can be seen from
table 6.2, in the Q range 0.2 ÷ 0.5 all the three instruments are available. For
Q in the range 0.6÷ 1.5 only BRISP and TOFTOF data are present.
When data measured with more than one instrument are available they are
tted using the same set of parameters, apart from the scale factor I0. In this way
each parameter is accurately determined by a t as much as possible independent
on the starting values and with a reduced number of free parameters. Doing this,
the high-resolution TOFTOF data provide an accurate determination of the
frequency and width of the low energy DHO whereas BRISP and IN3 spectra
are more sensitive to the high energy component. This combined use of the data
allows for a safe determination also of the inelastic intensities.
The model introduced with eq. 6.5 is a rather common assumption for
glasses, and it has been successfully applied to several systems, e.g. [122, 113,
139, 112]. In this case it does not work properly. The rst DHO is easily modeled
using BRISP data whereas the second one is more problematic. As a matter of
fact the clear inelastic peak visible in TOFTOF data cannot be reproduced by
the model function, see gure 6.10.
A complete analysis of TOFTOF spectra suggests the existence of an inten-
sity excess on the tail of the inelastic peak, approximately between -2 and -3
meV. To take into account this feature, we decide to introduce a third DHO
119

6.5 Experimental results
Figure 6.10: Fit of TOFTOF data at Q = 1.0 (black diamonds) using the S (Q,ω)
described in eq. 6.5 (red line). It can be seen that the model cannot reproduce the
low energy feature of the spectrum. The t obtained using the model of eq. 6.6 is also
reported (blue line).
120

A glass exhibiting a crystal-like behavior: the case of SiSe2
function and thus performing a new overall t procedure.
The new model function is:
S (Q,ω) = Aelδ (ω)
+A1
π
Ω21 (Q) Γ1 (Q)
[ω2 − Ω21 (Q)]
2+ ω2Γ2
1 (Q)
+A2
π
Ω22 (Q) Γ2 (Q)
[ω2 − Ω22 (Q)]
2+ ω2Γ2
2 (Q)
+A3
π
Ω23 (Q) Γ3 (Q)
[ω2 − Ω23 (Q)]
2+ ω2Γ3
2 (Q). (6.6)
where the parameters are dened as for eq. 6.5.
The results of this t are reported in gure 6.8 using data from all the in-
struments and in gure 6.9 where only BRISP and TOFTOF data are available.
In both cases there is a good agreement between the model. The meaning of
these three DHOs will be discussed in the following sections.
6.6 Nature of the modes in vitreous SiSe2
The dispersion relation for the three modes is reported in in gure 6.11.
The high frequency mode Ω1 (Q) shows all the typical features of a longi-
tudinal acoustic mode. The maximum of the dispersion curve occurs around
Q(1)m ' 1 Å−1, which is about Q1/2, where Q1 is the position of the rst sharp
diraction peak in S (Q), see gure 6.4. Above Q(1)m the dispersion curve de-
crease. The slope of the low Q rise is compatible with the maximum valuee of
the BLS sound velocity [130]. The low Q slope of the mode dispersion, deter-
mined by a linear t of the rst four points gives a velocity of v1 = 2590 ± 80
m/s, which is ∼ 20% higher than 2170 m/s, the maximum extimated value by
BLS [130]. Figure 6.12 shows the generalized sound velocity v1 calculated as
v1 =Ω1 (Q)
Q(6.7)
121
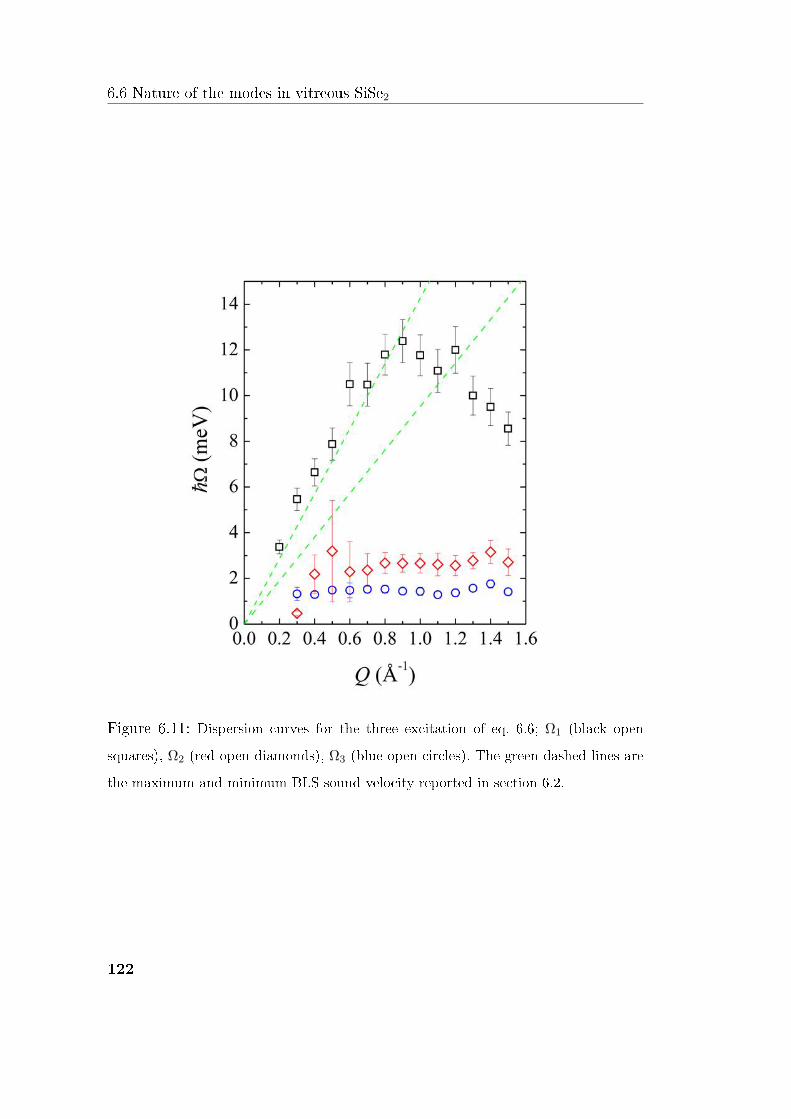
6.6 Nature of the modes in vitreous SiSe2
Figure 6.11: Dispersion curves for the three excitation of eq. 6.6; Ω1 (black open
squares), Ω2 (red open diamonds), Ω3 (blue open circles). The green dashed lines are
the maximum and minimum BLS sound velocity reported in section 6.2.
122

A glass exhibiting a crystal-like behavior: the case of SiSe2
The sound velocity is almost constant for Q ≤ 0.6 Å−1 then it starts to decrease.
This high frequency mode Ω1 (Q) can be associated to the high Q evolution of
the longitudinal acoustic mode.
Figure 6.12: Generalized sound velocity calculated as described in the text. The green
arrows mark the maximum and the minimum sound velocity obtained by BLS, [130],
representing the continuum limit.
The lowest energy excitation Ω3 (Q) displays an oscillating behavior. Figure
6.13(a) shows the behavior of Ω3 (Q). The oscillation is highlighted with the
red dashed line. The Q evolution of this feature is clearly visible also in the
experimental data, as reported in gure 6.13(b).Increasing Q from 0.6 to 1.3 Å−1
the peak oscillates with a maximum around 1.0 Å−1. The minimum of the
oscillation is located at about Q ∼ 1.0 Å−1, and it seems related to the rst peak
in the diraction pattern, namely the concentration pre-peak at Qpp = 0.96 Å−1.
The intermediate frequency excitation Ω2 (Q) has a more evident optic-like
behavior with an almost constant energy E2 ' 2.6 meV, see g. 6.14(a). The
existence of this third excitation is highlighted in gure 6.14(b), where the
TOFTOF spectrum is presented after the subtraction of the longitudinal in-
123

6.6 Nature of the modes in vitreous SiSe2
Figure 6.13: (a) Dispersion relation for Ω2 (Q); the black arrow marks the position
of Qpp, the pre-peak in the structure factor. The red dashed line is a guide for the
eye which highlights the oscillating behavior Ω2 (Q). In (b) we report three selected
TOFTOF spectra displaying the evident oscillation of the peak associated to Ω2 (Q).
The peak position is marked by two black arrows.
elastic component, which is tted using BRISP data. The low energy side of the
inelastic peak associated to Ω3 (Q) is characterized by a bump corresponding to
Ω2 (Q).
The damping parameters of the presented modes are reported in gure
6.15(a). At low Q, up to about 0.6 Å−1, Γ1 (Q) follows a Q2 behavior. Fig-
ure 6.15(b), (c), and (d) show the ration between the damping parameter and
the branch frequency. The rst mode appears to be overdamped for Q > 0.6.
In general, Γ/Ω rise to a constant value above 0.6 Å−1, then Γ (Q) follows the
same periodicity of Ω (Q), i.e. there are no structural eects on the damping.
The natural question which can rise at this point is: what kind of excitation
are Ω2 (Q) and Ω3 (Q)?
As a matter of fact we are dealing with a system which exhibits three exci-
tations, among which two show a propagating behavior, even if with dierent
periodicities.
Neutron scattering experiments performed in the rst Brillouin zone can
124

A glass exhibiting a crystal-like behavior: the case of SiSe2
Figure 6.14: (a) Dispersion relation for Ω3 (Q) (a). In (b) we report a TOFTOF
spectrum after the subtraction of the longitudinal contribution. The red line is the
best t whereas the blue dashed and dash dotted line are the second and the third
excitations; the two corresponding peaks are marked with black arrows.
probe only the longitudinal dynamics. However, as the wavevector is increased,
topologically disordered system can lose their symmetry so that longitudinal and
transverse lose their precise meaning. The visibility of a transverse excitation in
the neutron spectra can thus be justied by the mixing phenomenon [140, 69].
The high frequency transverse dynamics acquire also a longitudinal component
which is thus visible in the scattering signal.
A further clue on the character of second and third excitations can be in-
ferred considering the intensity Q-behavior, as proposed by Leadbetter [24]. As
a matter of fact the scattering intensity in the case of one phonon scattering is
modulated by a polarization factor Q · ej, where ej is the polarization vector of
the mode. In general, for purely transverse mode and purely longitudinal mode
it displays an antiphase behavior:
I (Q,ω) ∝
cos2φ purely longitudinal modes
sin2φ purely transverse modes, (6.8)
where φ is the angle between Q and ej. In polycrystals this leads to a maximum
of the longitudinal intensity for Q = τ ± q where τ is a vector of the reciprocal
125

6.6 Nature of the modes in vitreous SiSe2
Figure 6.15: The damping parameter Γ (Q) is reported in (a) for the rst mode (black
open squares), the second (red open diamonds), and the third (blue open circles); the
black dashed line represent the Q2 behavior of the rst mode. In (b) (c) (d) we report
the ratio Γ (Q) /Ω (Q) for the three excitations; symbols are as in (a).
126

A glass exhibiting a crystal-like behavior: the case of SiSe2
lattice and q the phonon wavector (q ∈ 1BZ). On the other hand, for a purely
transverse phonon the intensity will be maximum at Q = τ [24].
Figure 6.16: Intensities of the three components; the rst is reported with open black
squares, the second with open red diamonds and the third with open magenta circles.
The arrows mark the position of the prepeak in the static structure factor Qpp and of
Qpp/2.
Figure 6.16 shows a comparison between the intensity of the three modes.
The second and the third excitation have the same Q behavior and they are both
in anti-phase with respect to the rst mode. Any further consideration have to
account for the dierent periodicity of the branches. Anyway this ndings could
suggest the idea of a transverse acoustic nature for both Ω2 (Q) and Ω3 (Q).
Summarizing we have presented a glass which displays a crystal-like behavior
127

6.6 Nature of the modes in vitreous SiSe2
having three acoustic branches. However: is it still a glass?
Figure 6.17 shows the static structure factor S (Q) measured by neutron
diraction in ref. [129] compared to αST (Q), where α is an instrument depen-
dent normalization factor and
ST (Q) =
∫ EmaxT (Q)
EminT (Q)
dEITs (Q,E) . (6.9)
The patterns are in good agreement; furthermore, the integrated intensity does
not present any trace of Bragg peaks ruling out the crystallization as origin of the
third sound. In the same gure we report also the total intensity Iel+I1+I2+I3
multiplied for a normalization factor which also shows the same behavior of the
static structure factor.
Figure 6.17: Comparison between the total integrated intensity (red bullets) and the
static structure factor from ref. [129]. The blue open diamond reports the integrated
intensity of the TOFTOF spectra, 6.9. It is worth to note that no Bragg peaks are
visible.
A possible explanation of this quite astonishing crystal-like behavior could
be tracked in the structure of v-SiSe2. As a matter of fact the silicon diselenide is
128

A glass exhibiting a crystal-like behavior: the case of SiSe2
formed by edge sharing covalently bounded tetrahedra. This atomic linkage leads
to the formation of rather long monodimensional chains. These chains are joined
by corner sharing tetrahedra [126, 127] or van der Waals bounds [124, 125]. The
nal structure is considered an example of a glass which exhibiting a strong
medium range order [127] and this is supported by the very similar Raman
spectrum of both glass and crystal [125, 125]. The explanation of the dierent
periodicity felt by the longitudinal excitation and that exhibits by Ω3 is still
pending. As a matter of fact they seems aected by two dierent peaks in the
S (Q).
6.7 Transverse branches and the boson peak
To conclude this discussion about the dynamical properties of vitreous SiSe2 we
can compute the generalized vibrational density of states to have a look to the
boson peak in this system.
The generalized vibrational density of states of a coherent scatterer can be
calculated in the framework of the incoherent approximation. The incoherent ap-
proximation assumes that the interference term in the coherent scattering func-
tion averages to zero at relatively high Q, hence the S (Q,ω) can be described
in terms of an average atom, which scatters only incoherently. In this case, even
using the highest available Q, the incoherent approximation is not strictly ful-
lled. Nonetheless we can calculate an approximated generalized VDOS. It is
worth to note that the term generalized is used to emphasize that this is not
the true density of states, but its reection in the scattering, weighted by the
cross sections and masses of the atoms in the sample.
Figure 6.18(a) shows the measured dispersion relation for the three branches
whereas in gure 6.18(b) is reported the vibrational density of states g (~ω). The
main contribute to the vibrational mode excess is clearly given by the lowest
129

6.7 Transverse branches and the boson peak
Figure 6.18: (a) Dispersion relation compared to the vibrational density of states as
obtained by neutron scattering (b). The red and blue lines represent the mean energies
of the two transverse branches. The black dashed line suggest a connection between
the bump in the vibrational density of states and the minimum of the longitudinal
branch.
130

A glass exhibiting a crystal-like behavior: the case of SiSe2
transverse branch. The bump visible around 8 meV could be due to the minimum
of the longitudinal branch at Q = 1.5 Å−1.
The reduced VDOS g (ω) /ω2 is reported in gure 6.19. The peak position
is EBP = 0.78± 0.01 meV.
Figure 6.19: The reduced density of states in g (ω) /ω2.
6.7.1 The Raman light-vibration coupling function
According to the approach by Galeener and Sen [75], the experimental intensity
in the case of rst-order Raman scattering on a disordered system for a Stokes
process it is given by eq. 3.1, namely:
IRaman(ω) = C(ω)g(ω)[n(ω, T ) + 1]
ω. (6.10)
Dividing by the Bose-Einstein population factor [n(ω, T ) + 1] and by ω we ob-
tain the so-called reduced density of states which is proportional to the reduced
density of states g (ω) /ω2 through the coupling function C (ω). Neutron scat-
tering data allows the determination of a generalized VDOS, thus the coupling
function C (ω) could be determined by the ratio between Raman and neutron
131

6.7 Transverse branches and the boson peak
data. The result of this division is reported in gure 6.20. As highlighted by the
t, the coupling function results linear in the boson peak region. This nding
further conrms the general results of C (ω) ∼ ω in the BP region already found
in many systems [78, 79, 80, 81].
Figure 6.20: Light to vibration coupling function obtained as described in the text.
The red line is a linear t in the BP region.
132

Chapter 7
Conclusions
Non si può cavare il sangue da una rapa.
Italian proverb
In this work we have analyzed the dynamics and structural properties of two
glasses: permanently densied silica and silicon diselenide.
Permanently densied v-SiO2 samples have been obtained by using a high
pressure high temperature apparatus achieving a densication up to the 22%.
The vibrational density of states has been measured by means of Raman scat-
tering. We have found that the peak shifts upwards in frequency and it decreases
in intensity however, at least in a 10% of densication range, the BP shape is
invariant and its evolution is only due to the peak shift. The peak shift has
been thus compared to the modication of the elastic medium described by the
Debye frequency ωD showing a stronger than Debye behavior. The structural
modications induced by the densication have been investigated by means of
positron annihilation lifetime spectroscopy (PALS). This gives us a in-situ infor-
mation on the dimensions of the interstitial voids in the glassy network. PALS
and neutron diraction data support the idea that the densication does not
act on the short range order, i.e. the Si(O1/2
)4tetrahedra, but on the medium
133

range region. As a matter of fact, tetrahedera rotate to ll the void spaces thus
explaining the heavy shrink observed. The voids' radii have also been used to
reproduce the position and evolution of the rst sharp diraction peak, pointing
out their importance within the organization of the medium range order.
The evolution of the boson peak in v-SiO2 has been qualitatively explained
in terms of transverse acoustic modes which pile up at the maximum of the
dispersion curve. This corresponds to an eective Brillouin zone border which
is intimately related to the structure.
A similar relation has also been directly observed by comparing the α-quartz
polycrystal with the permanently densied glass at the same density. We have
observed the appearance of a peak in the vibrational density of states of the
polycrystal which corresponds to the BP in glasses.
Moreover this comparison have also highlighted the existence of a length
ξ marking the crossover between a long wavelength elastic regime and a short
wavelength microscopic dynamics. In this domain α-quartz polycrystal and glass
shows the same behavior.
The nding on v-SiSe2 show the existence of a glass with crystal-like behav-
ior. Its rather low sound velocity allows a low Q investigation of the dynamics by
means of neutron inelastic scattering. Silicon diselenide shows three low energy
excitations: a longitudinal acoustic mode and two transverse-like excitations.
This crystal-like behavior can be qualitatively explained considering the pecu-
liar edge sharing structure which exhibits a relevant medium range order. The
comparison of the vibrational density of states to the dispersion curves shows
that the main contribution in the BP region arises from the transverse excita-
tions.
In conclusion we have add some new proofs able to shed some new light on
the long standing questions of the origin of the boson peak. In any case many
aspects of this work require further investigations. In particular, the existence
134

Conclusions
of glasses exhibiting a crystal-like behavior as well as the existence of the cor-
relation length ξ have to be claried even in the more fundamental scenario of
the glass transition.
135

References
1. S. Caponi, M. Zanatta, A. Fontana, L. E. Bove, L. Orsingher, F. Natali, C.
Petrillo e F. Sacchetti; Ergodicity breaking in strong and network-forming
glassy systems, Phys. Rev. B 79, 172201 (2009).
2. M. Zanatta, G. Baldi, S. Caponi, A. Fontana, E. Gilioli, M. Krisch, C.
Masciovecchio, G. Monaco, L. Orsingher, F. Rossi, G. Ruocco, and R.
Verbeni; Elastic properties of permanently densied silica: a Raman, Bril-
louin light, and x-ray scattering study, Phys. Rev. B 81, 212201 (2010).
3. M. Zanatta, A. Fontana, F. Rossi and E. Gilioli; Eects of permanent
densication on the vibrational density of states of vitreous silica, J. of
Non Cryst. Solids 357, 1892 (2011).
4. S. Caponi, A. Fontana, F. Rossi and M. Zanatta; Inuence of temperature
on the quasi-elastic scattering in v-GeO2 glass, Phil. Mag. 91, 1887 (2011).
5. F. Rossi, G. Baldi, S. Caponi, R. Dal Maschio, A. Fontana, L. Orsingher
and M. Zanatta; The vibrational dynamics of v-GeO2 at the glass transi-
tion: a Raman and Brillouin scattering study, Phil. Mag. 91, 1910 (2011).
6. M. Zanatta, C. Armellini, A. Fontana and F. Rossi; Temperature evolution
of the boson peak and Debye scaling in vitreous B2O3, Phil. Mag. 91, 2028
(2011).
7. M. Zanatta, G. Baldi, S. Caponi, A. Fontana, C. Petrillo, F. Rossi, and
F. Sacchetti; Debye to non-Debye scaling of the Boson Peak dynamics:
critical behavior and local disorder in vitreous Germania, J. Chem. Phys.
135, 174506 (2011).
136

Bibliography
[1] C.A. Angell, P.H. Poole, and J. Shao. Glass-forming liquids, anomalous
liquids and polyamorphism in liquids and biopolymers. Nuovo Cimento
D, 16:993, 1994.
[2] C.A. Angell. The old problem of glass and the glass transition, and many
new twist. Proc. Natl. Acad. Sci. USA, 92:6675, 1995.
[3] A. Cavagna. Supercooled liquids for pedestrians. Phys. Rep., 476:51, 2009.
[4] P.G. Debenedetti and F.H. Stillinger. Supercooled liquids and the glass
transition. Nature, 410:259, 2001.
[5] K. Binder and W. Kob. Glassy materials and disordered solids - An in-
troduction to their statistical mechanics. World Scientic, revised edition,
2011.
[6] S.R. Elliott. Physics of amorphous materials. Longman Scientic & Tech-
nical, second edition, 1990.
[7] J.C. Dyre. Colloquium: the glass transition and elastic models of glass-
forming liquids. Rev. Mod. Phys., 78:953, 2006.
[8] M.D. Ediger, C.A. Angell and S.R Nagel. Supercooled liquids and glasses.
J. Phys. Chem., 100:13200, 1996.
137

BIBLIOGRAPHY
[9] T. Scopigno, G. Ruocco, F. Sette, and G. Monaco. Is the Fragility of a
liquid embedded in the properties of its glass? Science, 302:849, 2003.
[10] R. Böhmer, K.L. Ngai, C.A. Angell, and J. Plazek. Nonexponential relax-
ations in strong and fragile glass formers. J. Chem. Phys., 99:42014209,
1993.
[11] W.H. Zachariasen. The atomic arrangement in glasses. J. Am. Chem.
Soc., 54:3841, 1932.
[12] S.R. Elliott. Medium range structural order in covalent amorphous solids.
Nature, 354:445, 1991.
[13] P.S. Salmon, R.A. Martin, P.E. Mason, and G.J. Cuello. Topological
versus chemical ordering in network glasses at intermediate and extended
length scales. Nature, 435:75, 2005.
[14] P.S. Salmon. The structure of tetrahedral network glass forming systems
at intermediate and extended length scales. J. Phys.: Condens. Matter,
19:455208, 2007.
[15] S. Caponi, M. Zanatta, A. Fontana, L. E. Bove, L. Orsingher, F. Natali,
C. Petrillo, and F. Sacchetti. Ergodicity breaking in strong and network-
forming glassy systems. Phys. Rev. B, 79:172201, 2009.
[16] L. Berthier and G. Biroli. Theoretical perspective on the glass transition
and amorphous materials. Rev. Mod. Phys., 78:953972, 2006.
[17] A.C. Wright. Neutron scattering from vitreous silica. V. The structure of
vitreous silica: What have we learned from 60 years of diraction studies?
J. Non-Cryst. Solids, 179:84, 1994.
138

BIBLIOGRAPHY
[18] S.R. Elliott. The origin of the rst sharp diraction peak in the structure
factor of covalent glasses and liquids. J. Phys. Condens. Matter, 4:7661,
1992.
[19] J. Du and L.R. Corrales. First sharp diraction peak in silicate glasses:
Structure and scattering length dependence. Phys. Rev. B, 72:092201,
2005.
[20] Q. Mei, C.J. Benmore, S. Sen, R. Sharma, and J.L. Yarger. Intermediate
range order in vitreous silica from a partial structure factor analysis. Phys.
Rev. B, 78:144204, 2008.
[21] S.R. Elliott. Origin of the rst sharp diraction peak in the structure
factor of covalent glasses. Phys. Rev. Lett., 67:711, 1991.
[22] A.A. Maraudin, E.W. Montroll, G.H. Weiss, and I.P. Ipatova. Theory of
lattice dynamics in the harmonic approximation. Academic press, second
edition, 1971.
[23] O. Madelung. Introduction to solid state physics. Springer Berlin Heidel-
berg, third edition, 2008.
[24] A.J. Leadbetter. Structure and atomic motion in glasses. In B.T.M. Willis,
editor, Chemical Applications of Thermal Neutron Scattering, chapter 7.
Oxford University Press, 1973.
[25] F. Sette, M.H. Krisch, C. Masciovecchio, G. Ruocco, and G. Monaco.
Dynamics of glasses and glass-forming liquids studied by inelastic X-ray
scattering. Science, 280:1550, 1998.
[26] S. Takeno and M. Goda. A theory of phonons in amorphous solids and
its implication to collective motion in simple liquids. Prog. Theor. Phys.,
45:331, 1971.
139

BIBLIOGRAPHY
[27] S. Takeno and M. Goda. A theory of phonon-like excitations in non-
crystalline solids and liquids. Prog. Theor. Phys., 47:790, 1972.
[28] R. Vacher, E. Courtens, and M. Foret. Anharmonic versus relaxational
sound damping in glasses. II. Vitreous silica. Phys. Rev. B, 72:214205,
2005.
[29] C. Masciovecchio, G. Baldi, S. Caponi, L. Comez, S. Di Fonzo, D. Fioretto,
A. Fontana, A. Gessini, S.C. Santucci, F. Sette, G. Viliani, P. Vilmercati,
and G. Ruocco. Evidence for a crossover in the frequency dependence of
the acoustic attenuation in vitreous silica. Phys. Rev. Lett., 97:035501,
2006.
[30] T. Tohei, A. Kuwabara, F. Oba, and I. Tanaka. Debye temperature and
stiness of carbon and boron nitride polymorphs from rst principles cal-
culations. PhyS. rev. B, 73:064304, 2006.
[31] K. Huang. Statistical Mecchanics. John Wiley & Sons, second edition,
1987.
[32] N.W. Ashcroft and N.D. Mermin. Solid State Physics. Harcourt College
Publishers, 1976.
[33] R.C. Zeller and R.O. Pohl. Thermal conductivity and specic heat of
noncrystalline solids. Phys. Rev. B, 4:2029, 1971.
[34] E. Fabiani, A. Fontana, and U. Buchenau. Neutron scattering study of the
vibrations in vitreous silica and germania. J. Chem. Phys., 128:244507,
2008.
[35] W. Doster, S. Cusack and W. Petry. Dynamical transition of myoglobin
revealed by inelastic neutron scattering. Nature, 337:205106, 1989.
140

BIBLIOGRAPHY
[36] L. Hong, B. Begen, A. Kisliuk, C. Alba-Simionesco, V.N. Novikov, and
A.P. Sokolov. Pressure and density dependence of the boson peak in
polymers. Phys. Rev. B, 78:134201, 2008.
[37] S.N. Taraskin, Y. L. Loh, G. Natarajan, and S.R. Elliott. Origin of the
boson peak in systems with lattice disorder. Phys. Rev. Lett., 86:1255,
2001.
[38] W. Schirmacher. Thermal conductivity of glassy materials and the boson
peak. Europhys. Lett., 73:892, 2006.
[39] W. Schirmacher, G. Ruocco, and T. Scopigno. Acoustic attenuation in
glasses and its relation with the boson peak. Phys. Rev. Lett., 98:025501,
2007.
[40] W. Schirmacher, B. Schmid, C. Tomaras, G. Viliani, G. Baldi, G. Ruocco,
T. Scopigno. Vibrational excitations in systems with correlated disorder.
Phys. Stat. Sol., 5:862, 2008.
[41] T.S. Grigera, V. Martin-Mayor, G. Parisi, and P. Verrocchio. Phonon
interpretation of the boson peak in supercooled liquids. Nature, 422:289,
2003.
[42] B. Rué, D.A. Parshin, E. Courtens, and R. Vacher. Boson peak and its
relation to acoustic attenuation in glasses. Phys. Rev. Lett., 100:015501,
2008.
[43] D.A. Parshin, H.R. Schober, and V.L. Gurevich. Vibrational instability,
two-level systems, and the boson peak in glasses. Phys. Rev. B, 76:064206,
2007.
141
BIBLIOGRAPHY
[44] V.L. Gurevich, D.A. Parshin, and H.R. Schober. Anharmonicity, vibra-
tional instability, and the Boson peak in glasses. Phys. Rev. B, 67:094203,
2003.
[45] E. Duval, A. Mermet, and L. Saviot. Boson peak and hybridization of
acoustic modes with vibrations of nanometric heterogeneities in glasses.
Phys. Rev. B., 75:024201, 2007.
[46] A.P. Sokolov, A. Kisliuk, M. Soltwisch, and D. Quitmann. Medium-range
order in glasses: Comparison of Raman and diraction measurements.
Phys. Rev. Lett., 69:1540, 1992.
[47] L. Börjesson, A.K. Hassan, J. Swenson, L.M. Torrel, and A. Fontana. Is
there a correlation between the rst sharp diraction peak and the low
frequency vibrational behavior in glasses? Phys. Rev. Lett., 70:1275, 1993.
[48] S.W. Lovesey. Theory of neutron scattering from condensed matter.
Clarendon press Oxford, rst edition, 1984.
[49] F. Sette and M. Krisch. Inelastic X-rat scattering from collective atom
dynamics. In F. Hippert, E. Geissler, J.L. Hodeau, E. Lelièvre-Berna, and
J. Regnard, editor, Neutron and X-ray Spectroscopy. Springer, 2006.
[50] T. Scopigno, G. Ruocco, and F. Sette. Microscopic dynamics in liquid
metals: The experimental point of view. Rev. Mod. Phys., 77:901, 2005.
[51] G. Ruocco and F. Sette. High-frequency vibrational dynamics in glasses.
J. Phys. Condens. Matter, 13:9141, 2001.
[52] E. Burkel. Phonon spectroscopy by inelastic x-ray scattering. Rep. Prog.
Phys., 63:171, 2000.
142

BIBLIOGRAPHY
[53] J.M. Carpenter and D.L. Price. Correlated motions in glasses studied by
coherent inelastic neutron scattering. Phys. Rev. B, 54:441, 1985.
[54] D.L. Price and J.M. Carpenter. Correlated motions in glasses studied by
coherent inelastic neutron scattering. Phys. Rev. B, 54:441, 1985.
[55] A. Messiah. Quantum Mechanics. Dover Publications, 1999.
[56] U. Balucani and M. Zoppi. Dynamics of the liquid state. Oxford University
Press, rst edition, 1994.
[57] J.P. Hansen and I.R. McDonald. Theory of simple liquids. Academic
Press, rst edition, 1976.
[58] S. Caponi, A. Fontana, F. Rossi, G. Baldi, and E. Fabiani. Eect of
temperature on the vibrational density of states in vitreous SiO2: a Raman
study. Phys. Rev. B, 76:092201, 2007.
[59] G. Baldi, A. Fontana, G. Monaco, L. Orsingher, S. Rols, F. Rossi, and B.
Ruta. Connection between boson peak and elastic properties in silicate
glasses. Phys. Rev. Lett., 102:195502, 2009.
[60] B. Rué, S. Ayrinhac, E. Courtens, R. Vacher, M. Foret, A. Wischnewski,
and U. Buchenau. Scaling the temperature-dependent boson peak of vit-
reous silica with the high-frequency bulk modulus derived from Brillouin
scattering data. Phys. Rev. Lett., 104:067402, 2010.
[61] M. Zanatta, G. Baldi, S. Caponi, A. Fontana, C. Petrillo, F. Rossi and F.
Sacchetti. Debye to non Debye scaling of the boson peak dynamics: Crit-
ical behavior and local disorder in v-GeO2. J. Chem. Phys., 135:174506,
2011.
143

BIBLIOGRAPHY
[62] K. Niss, B. Begen, B. Frick, J. Ollivier, A. Beraud, A.P. Sokolov, V.N.
Novikov, and C. Alba-Simionesco. Inuence of pressure on the boson
peak: Stronger than elastic medium transformation. Phys. Rev. Lett.,
99:055502, 2007.
[63] T. Deschamps, C. Martinet, D. de Ligny, J. L. Bruneel, and B. Cham-
pagnon. Correlation between boson peak and anomalous elastic behavior
in GeO2 glass: An in situ Raman scattering study under high-pressure. J.
Chem. Phys., 134:224503, 2011.
[64] A. Monaco, A. I. Chumakov, G. Monaco, W.A. Crichton, A. Meyer, L.
Comez, D. Fioretto, J. Korecki, and R. Rüer. Eect of densication on
the density of vibrational states of glasses. Phys. Rev. Lett., 97:135501,
2006.
[65] L. Orsingher, A. Fontana, E. Gilioli, G. Carini Jr., G. Carini, G. Tripodo,
T. Unruh, and U. Buchenau. Vibrational dynamics of permanently den-
sied GeO2 glasses: Densication-induced changes in the boson peak. J.
Chem. Phys., 132:124508, 2010.
[66] A.I. Chumakov, G. Monaco, A. Monaco, W.A. Crichton, A. Bosak, R.
Rüer, A. Mayer, F. Kargl, L. Comez, D. Fioretto, H. Giefers, S. Roitsch,
G. Wortmann, M.H. Manghnani, A. Hashur, Q. Williams, J. Balogh, K.
Parli«ski, P. Jochym, and P. Piekarz. Equivalence of the Boson Peak in
Glasses to the Transverse Acoustic van Hove Singularity in Crystals. Phys.
Rev. Lett., 106:225501, 2011.
[67] S. Caponi, S. Corezzi, D. Fioretto, A. Fontana, G. Monaco, and F. Rossi.
Raman-scattering measurements of the vibrational density of states of a
reactive mixture during polymerization: eect on the boson peak. Phys.
Rev. Lett., 102:027402, 2009.
144
BIBLIOGRAPHY
[68] M. Zanatta, A. Fontana, F. Rossi, and E. Gilioli. Eects of permanent
densication on the vibrational density of states of vitreous silica. J. Phys.
Condens. Matter, 357:1892, 2011.
[69] O. Pilla, S. Caponi, A. Fontana, J.R. Gonsalves, M. Montagna, F. Rossi,
G. Viliani, L. Angelani, G. Ruocco, G. Monaco, and F. Sette. The low
energy excess of vibrational states in v-SiO2: The role of transverse dy-
namics. J. Phys.: Condens. Matter, 105:025501, 2010.
[70] O. Pilla, L. Angelani, A. Fontana, J.R. Gonsalves, and G. Ruocco. Struc-
tural and dynamical consequences of density variation in vitreous silica.
J. Phys.: Condens. Matter, 105:025501, 2010.
[71] N.V. Surovtsev, V.K. Malinovsky, Y.N. Palýanov, A.A. Kalinin, and A.P.
Shebanin. Suppression of fast relaxation and the Raman coupling coe-
cient in densied silica. J. Phys. Condens. Matter, 16:3035, 2004.
[72] Y. Inamura, M. Arai, T. Otomo, N. Kitamura, and U. Buchenau. Density
dependence of the boson peak of vitreous silica. Physica B, 284:1157,
2000.
[73] S. Sugai and A. Onodera. Medium-Range Order in Permanently Densied
SiO2 and GeO2 Glass. Phys. Rev. Lett., 77:4210, 1996.
[74] R. Shuker and R. Gammon. Raman-scattering selection-rule breaking and
the density of states in amorphous materials. Phys. Rev. Lett., 25:22, 1970.
[75] F.L. Galeener and P.N. Sen. Theory for the rst-order vibrational spectra
of disordered solids. Phys. Rev. Lett., 17:1928, 1978.
[76] V.K. Malinovsky, V.N. Novikov, and A.P. Sokolov. Log-normal spectrum
of low-energy vibrational excitations in glasses. Phys. Lett. A, 153:63,
1991.
145

BIBLIOGRAPHY
[77] G. E. Walrafen, Y. C. Chu, and M. S. Hokmabadi. Raman spectroscopic
investigation of irreversibly compacted vitreous silica. J. Chem. Phys.,
92:6987, 1990.
[78] A. P. Sokolov, U. Buchenau, W. Steen, B. Frick, and A. Wischnewski.
Comparison of Raman-and neutron-scattering data for glass-forming sys-
tems. Phys. Rev. B, 52:R9815, 1995.
[79] A. Fontana, R. DellÁnna, M. Montagna, F. Rossi, G. Viliani, G. Ruocco,
M. Sampoli, U. Buchenau, A. Wischnewski. The Raman coupling function
in amorphous silica and the nature of the long-wavelength excitations in
disordered systems. Europhys. Lett., 47:56, 1999.
[80] N.V. Surovtsev and A.P. Sokolov. Frequency behavior of Raman coupling
coecient in glasses. Phys. Rev. B, 66:054205, 2002.
[81] A. Fontana, F. Rossi, G. Viliani, S. Caponi, E. Fabiani, G. Baldi, G.
Ruocco, and R. Dal Maschio. The Raman coupling function in disordered
solids: A light and neutron scattering study on glasses of dierent fragility.
J. Phys.: Condens. Matter, 19:205145, 2007.
[82] L. Orsingher, G. Baldi, A. Fontana, and F. Rossi. The Raman coupling
function in permanently densied GeO2 glasses. Phil. Mag., 91:1857, 2011.
[83] C. Zha, R.J. Hemley, H. Mao, T.S. Duy, and C. Meade. Acoustic veloci-
ties and refractive index of SiO2 glass to 57.5 GPa by Brillouin scattering.
Phys. Rev. B, 50:3907, 1994.
[84] T. Deschamps, C. Martinet, D.R. Neuville, D. de Ligny, C. Coussa-Simon,
and B. Champagnon. Silica under hydrostatic pressure: A non continuous
medium behavior. J. Non-Cryst. Solids, 355:2422, 2009.
146

BIBLIOGRAPHY
[85] T. Scopigno, U. Balucani, G. Ruocco, and F. Sette. Density uctuations
in molten lithium: Inelastic x-ray scattering study. J. Phys. Condens.
Matter, 12:8009, 2000.
[86] G. Monaco and V.M. Giordano. Breakdown of the Debye approximation
for the acoustic modes with nanometric wavelengths in glasses. Proc. Natl.
Acad. Sci. USA, 106:3659, 2009.
[87] D. Fioretto, S. Corezzi, S. Caponi, F. Scarponi, G. Monaco, A. Fontana,
and L. Palmieri. Cauchy relation in relaxing liquids. J. Chem. Phys.,
128:214502, 2008.
[88] P.J. Schultz, K.G.Lynn. Theory of positrons in solids an on solid surfaces.
Rev. Mod. Phys., 66:1994, 1990.
[89] P.J. Schultz, K.G.Lynn. Interaction of positron beams with surfaces, thin
lms, and interfaces. Rev. Mod. Phys., 60:701, 1988.
[90] R.A. Ferrel. Theory of positron annihilation in solids. Rev. Mod. Phys.,
28:308, 1956.
[91] S. Berko, F.L. Hereford. Experimental studies of positron interactions in
solids and liquids. Rev. Mod. Phys., 28:299, 1956.
[92] S. Sampath, C.J. Benmore, K.M. Lantzky, J. Neuefeind, K. Leinenweber,
D.L. Price and J.L. Yarger. Intermediate-range order in permanently
densied GeO2 glass. Phys. Rev. Lett., 90:115502, 2003.
[93] J. Blétry. Sphere and distance models for binary disordered systems. Phil.
Mag. B, 62:469, 1990.
[94] P.J. Mohr, B.N. Taylor, and D.B. Newell. The 2010 CODATA Recom-
mended Values of the Fundamental Physical Constants, 2011.
147

BIBLIOGRAPHY
[95] S. Berko and H.N. Pendleton. Positronium. Ann. Rev. Nucl. Part. Sci.,
30:543, 1980.
[96] C. Hugenschmidt. Positron sources and positron beams. In A. Dupasquier,
A.P. Mills jr. and R.S. Brusa, editor, Proceedings of the International
School of Physics Enrico Fermi - Course CLXXIV. IOS Press, 2010.
[97] W. Egger, P. Sperr, G. Kögel, and G. Dollinger. Pulsed low energy
positron system (PLEPS) at the Munich research reactor FRMII. Phys.
Stat. Sol., 4:3969, 2007.
[98] W. Egger. Pulsed low-energy positron beams in materials sciences. In
A. Dupasquier, A.P. Mills jr. and R.S. Brusa, editor, Proceedings of the
International School of Physics Enrico Fermi - Course CLXXIV. IOS
Press, 2010.
[99] P. Kirkegaard, M. Eldrup. POSITRONFIT EXTENDED: a new version
of a program for analysing positron lifetime spectra. Comput. Phys. Com-
mun., 7:401, 1974.
[100] Y. Sasaki, Y Nagai, H. Ohkubo, K. Inoue, Z. Tang, and M. Hasegawa.
Positronium in silica-based glasses. Rad. Phys. Chem., 68:569, 2003.
[101] R.S. Brusa, S. Mariazzi, L. Ravelli, P. Mazzoldi, G. Mattei, W. Egger, C.
Hugenschmidt, B. Löwe, P. Pikart, C. Macchi, and A. Somoza. Study of
defects in implanted silica glass by depth proling positron annihilation
spectroscopy. Nucl. Instrum. Meth. B, 268:3186, 2010.
[102] Y.C. Jean. Positron annihilation spectroscopy for chemical analysis: A
novel probe for microstructural analysis of polymers.Microchem. J., 42:72,
1990.
148

BIBLIOGRAPHY
[103] S.J. Tao. Positronium annihilation in molecular substances. J. Chem.
Phys., 56:5499, 1972.
[104] M. Eldrup, D. Lightbody, and J.N. Sherwood. The temperature depen-
dence of positron lifetimes in solid pivalic acid. Chem. Phys., 63:52, 1981.
[105] D.W. Gidley, W.E. Frieze, T.L. Dull, A.F. Yee, E.T. Ryan, and H.M.
Ho. Positronium annihilation in mesoporous thin lms. Phys. Rev. B,
60:R5157, 1999.
[106] J.P. Rino, I. Ebbsjö, R.K. Kalia, A. Nakano, and P. Vashishta. Structure
of rings in vitreous SiO2. Phys. Rev. B, 47:3053, 1993.
[107] N.T. Nhan, P.K. Hung D.M. Nghiep, and H.S. Kim. Molecular dynamics
investigation on microstructure and void in amorphous SiO2. Mat. Trans.,
49:1212, 2008.
[108] A.B. Bhatia and T.E. Thornton. Structural aspects of the electrical resis-
tivity of binary alloys. Phys. Rev. B, 2:3004, 1970.
[109] R.D. Shannon. Revised eective ionic radii and systematic studies of
interatomic distances in halides and chalcogenides. Acta. Cryst. A, 32:751,
1976.
[110] G.S. Grest, S.R. Nagel, and A. Rahman. Zone boundaries in glasses. Phys.
Rev. B, 29:5968, 1984.
[111] T. Scopigno, M. DÁstuto, M. Krisch, G. Ruocco, and F. Sette. Obser-
vation of Umklapp processes in noncrystalline materials. Phys. Rev. B,
64:012301, 2001.
[112] B. Ruzicka, T. Scopigno, S. Caponi, A. Fontana, O. Pilla, P. Giura, G.
Monaco, E. Pontecorvo, G. Ruocco, and F. Sette. Evidence of anomalous
149

BIBLIOGRAPHY
dispersion of the generalized sound velocity in glasses. Phys. Rev. B,
69:100201, 2004.
[113] G. Baldi, V. M. Giordano, G. Monaco, F. Sette, E. Fabiani, A. Fontana,
and G. Ruocco. Thermal conductivity and terahertz vibrational dynamics
of vitreous silica. Phys. Rev. B, 77:214309, 2008.
[114] A.I. Chumakov, A. Bosak, and R. Rüer. Contribution of acoustic modes
to the density of vibrational states measured by inelastic scattering tech-
niques. Phys. Rev. B, 80:094303, 2009.
[115] A. Bosak, M. Krisch, I. Fischer, S. Huotari, and G. Monaco. Inelastic x-
ray scattering from polycrystalline materials at low momentum transfer.
Phys. Rev. B, 75:064106, 2007.
[116] G. Baldi, V.M. Giordano, G. Monaco, and B. Ruta. Sound attenuation
at terahertz frequencies and the boson peak of vitreous silica. Phys. Rev.
Lett., 104:195501, 2010.
[117] G. Baldi, V.M. Giordano, and G. Monaco. Elastic anomalies at terahertz
frequencies and excess density of vibrational states in silica glass. Phys.
Rev. B, 83:174203, 2011.
[118] F. Léonforte, A. Tanguy, J.P. Wittmer, and J.L. Barrat. Inhomogeneous
Elastic Response of Silica Glass. Phys. Rev. Lett., 97:055501, 2006.
[119] F. Léonforte. Vibrational states and disorder in continuously compressed
model glasses. J. Non-Cryst. Solids, 357:552, 2011.
[120] B. T. Kolomiets. Vitreous Semiconductors. Phys. Stat. Sol., 7:359, 1964.
[121] A.L. Greer and N. Mathur. Materials science: Changing face of the
chameleon. Nature, 437:1246, 2005.
150

BIBLIOGRAPHY
[122] L. Orsingher, G. Baldi, A. Fontana, L. Bove, T. Unruh, A. Orecchini, N.
Violini, C. Petrillo, and F. Sacchetti. High-frequency dynamics of vitreous
GeSe2. Phys. Rev. B, 82:115201, 2010.
[123] R.W. Johnson, S. Susman, J. McMillan, and K.J. Volin. Preparation and
characterization of SixSe1−x glasses and determination of the equilibrium
phase diagram. Mat. Res. Bull., 21:41, 1986.
[124] M. Tenhover, M.A. Hazle, and R.K. Grasselli. Atomic structure of SiS2
and SiSe2 Glasses. Phys. Rev. Lett., 51:404, 1983.
[125] M. Tenhover, M.A. Hazle, R.K. Grasselli, and C.W. Thompson. Chemi-
cal bonding and the atomic structure of SixSe1−x glasses. Phys. Rev. B,
28:4602, 1983.
[126] J.E. Griths, M. Malyj, G.P. Espinosa, and J.P. Remeika. Crystalline
SiSe2 and SixSe1−x glasses: syntheses, glass formation, structure, phase
separation and Raman spectra. Phys. Rev. B, 30:6978, 1984.
[127] L.F. Gladden and S.R. Eliott. Computer-generated models of a-SiSe2:
evidence for a glass exhibiting medium-range order. Phys. Rev. Lett.,
59:908, 1987.
[128] M. Arai, D.L. Price, S. Susman, K.J. Volin, and U. Walter. Network
dynamics of chalcogenide glasses. II. Silicon diselenide. Phys. Rev. B,
37:4240, 1988.
[129] R.W. Johnson, D.L. Price, S.Susman, M. Arai, T.J. Morrison, and G.K.
Shenoy. The structure of silicon-selenium glasses. I. Short-range order. J.
Non-Cryst. Solids, 83:251, 1986.
[130] R. Bhadra, S. Susman, K.J. Volin, and M. Grimsditch. Elastic properties
of SixSe1−x glasses. Phys. Rev. B, 39:1378, 1989.
151

BIBLIOGRAPHY
[131] A.J. Dianoux and G. Lander. Neutron Data Booklet, 2003.
[132] D. Aisa, S. Aisa, E. Babucci, F. Barocchi, A. Cunsolo, A. De Francesco,
F. Formisano, T. Gahl, E. Guarini, A. Laloni, H. Mutka, A. Orecchini, C.
Petrillo, W.C. Pilgrim, A. Piluso, F. Sacchetti, J.B. Suck, and G. Venturi.
BRISP: A new thermal-neutron spectrometer for small-angle studies of
disordered matter. J. Non-Cryst. Solids, 352:5130, 2006.
[133] Institut Laue Langevin. The Yellow Book 2005 - Guide to neutron research
Facilities, 2005.
[134] Tobias Unruh, Jürgen Neuhaus, Winfried Petry. The high-resolution time-
of-ight spectrometer TOFTOF. Nucl. Instrum. Meth. A, 580:1414, 2007.
[135] C. Petrillo and F. Sacchetti. Analysis of neutron diraction data in the
case of high-scattering cells. Acta Crystallogr., Sect. A: Found. Crystal-
logr., 46:440, 1992.
[136] C. Petrillo and F. Sacchetti. Analysis of neutron diraction data in the
case of high-scattering cells. II. Complex cylindrical cells. Acta Crystal-
logr., Sect. A: Found. Crystallogr., 48:508, 1992.
[137] C. Petrillo, F. Sacchetti, B. Dorner, J.B. Suck. High-resolution neutron
scattering measurement of the dynamic structure factor of heavy water.
Phys Rev E, 62:3611, 2000.
[138] M.J. Cooper and R. Nathans. The resolution function in neutron dirac-
tometry. I. The resolution function of a neutron diractometer and its
application to phonon measurements. Acta Cryst., 23:357, 1967.
[139] L.E. Bove, E. Fabiani, A. Fontana, F. Paoletti, C. Petrillo, O. Pilla, and
I.C.V. Bento. Brillouin neutron scattering of v-GeO2. Europhys. Lett.,
71:563, 2005.
152

BIBLIOGRAPHY
[140] M. Sampoli, G. Ruocco, and F. Sette. Mixing of Longitudinal and Trans-
verse Dynamics in Liquid Water. Phys. Rev. Lett., 79:1678, 1997.
153


