Vibrational Modes of an Uilleann Pipe Reed Patrick Murray Advisor: Jesse Jones IV Undergraduate Thesis Spring 2002 Tufts University Mechanical Engineering Department Medford, Massachusetts 02155
Transcript
Vibrational Modes of an Uilleann Pipe Reed
Patrick Murray
Advisor: Jesse Jones IV
Undergraduate Thesis
Spring 2002
Tufts University
Mechanical Engineering Department
Medford, Massachusetts 02155
1.1”
ABSTRACT
The vibration of an uilleann pipe reed is studied within. Using a Laser Doppler
Velocimeter we have begun to map the modes of vibration for a reed sounding at four
different frequencies. We have mapped these shapes up to five harmonics. Our study
has shown the inadequacy of existing models to describe the motion of a double reed.
We have also begun to describe the phenomena of a “cutoff point” that may separate
vibration between the front and back of the reed.
INTRODUCTION
The uilleann pipes are the national bagpipe of Ireland. The pipes, as they are
referred to, are made up of three main parts. There is the bellows, the bag, and the
chanter. Bellows pump air into the bag where it is compressed by the player’s arm and
then passed into the chanter. This setup allows the player to play continuous sound, and
does not require the use of breath. The sound that is produced comes from the chanter, a
conical tube with eight tone holes. At the apex of the chanter is a double reed with
similar dimensions to a bassoon reed (Fig. 1).
Fig. 1 – The uilleann pipe reed [1]
Since the pipes are powered by ambient air, the reed can be exposed to an extreme
variety of environmental conditions depending on where the musician is playing. As the
relative humidity of the environment changes so does the response of the reed. For this
reason uilleann pipe reeds are extremely difficult to make and maintain.
The pieces of an uilleann pipe reed are as follows. The vibrating material is made
from cane (Arundo Donax), a hard grass tube with an external diameter of about one
.50”
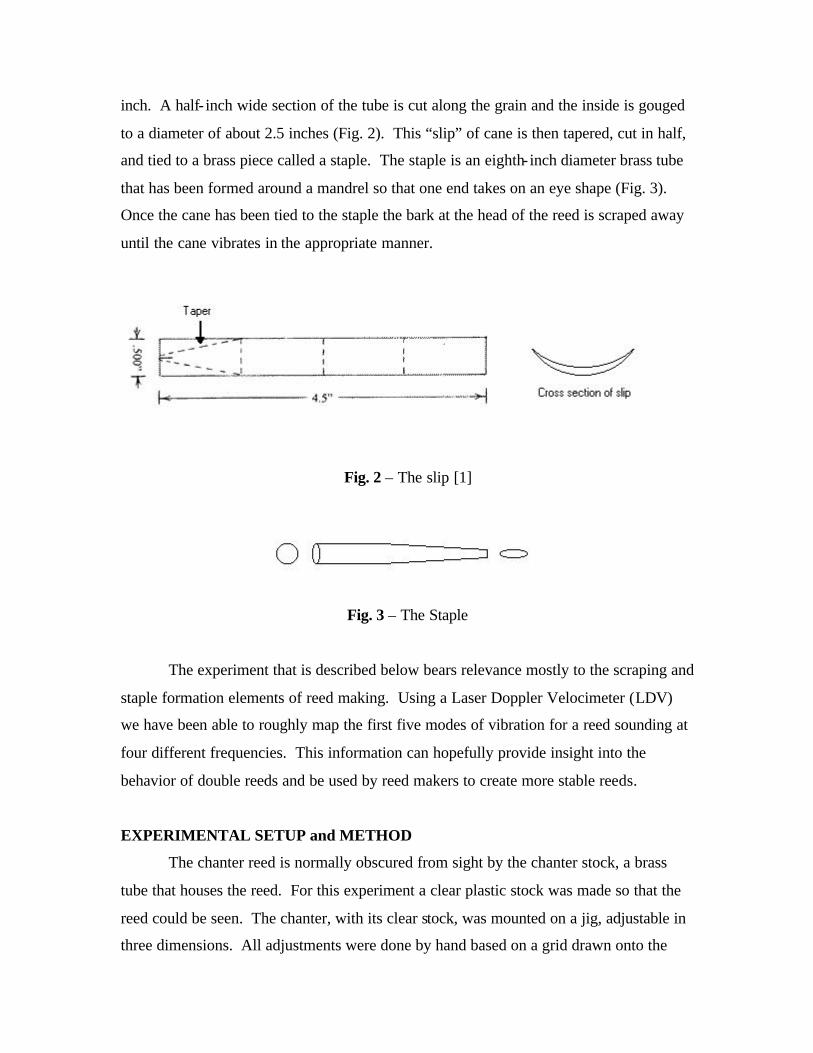
inch. A half- inch wide section of the tube is cut along the grain and the inside is gouged
to a diameter of about 2.5 inches (Fig. 2). This “slip” of cane is then tapered, cut in half,
and tied to a brass piece called a staple. The staple is an eighth- inch diameter brass tube
that has been formed around a mandrel so that one end takes on an eye shape (Fig. 3).
Once the cane has been tied to the staple the bark at the head of the reed is scraped away
until the cane vibrates in the appropriate manner.
Fig. 2 – The slip [1]
Fig. 3 – The Staple
The experiment that is described below bears relevance mostly to the scraping and
staple formation elements of reed making. Using a Laser Doppler Velocimeter (LDV)
we have been able to roughly map the first five modes of vibration for a reed sounding at
four different frequencies. This information can hopefully provide insight into the
behavior of double reeds and be used by reed makers to create more stable reeds.
EXPERIMENTAL SETUP and METHOD
The chanter reed is normally obscured from sight by the chanter stock, a brass
tube that houses the reed. For this experiment a clear plastic stock was made so that the
reed could be seen. The chanter, with its clear stock, was mounted on a jig, adjustable in
three dimensions. All adjustments were done by hand based on a grid drawn onto the
reed. Once mounted, the chanter was supplied air by an air compressor, and tone holes
were covered with tape to produce the desired frequencies. Frequencies were measured
throughout the experiment, and varied no more than 10 cents from the desired frequency.
Fig. 4 – Experimental Setup
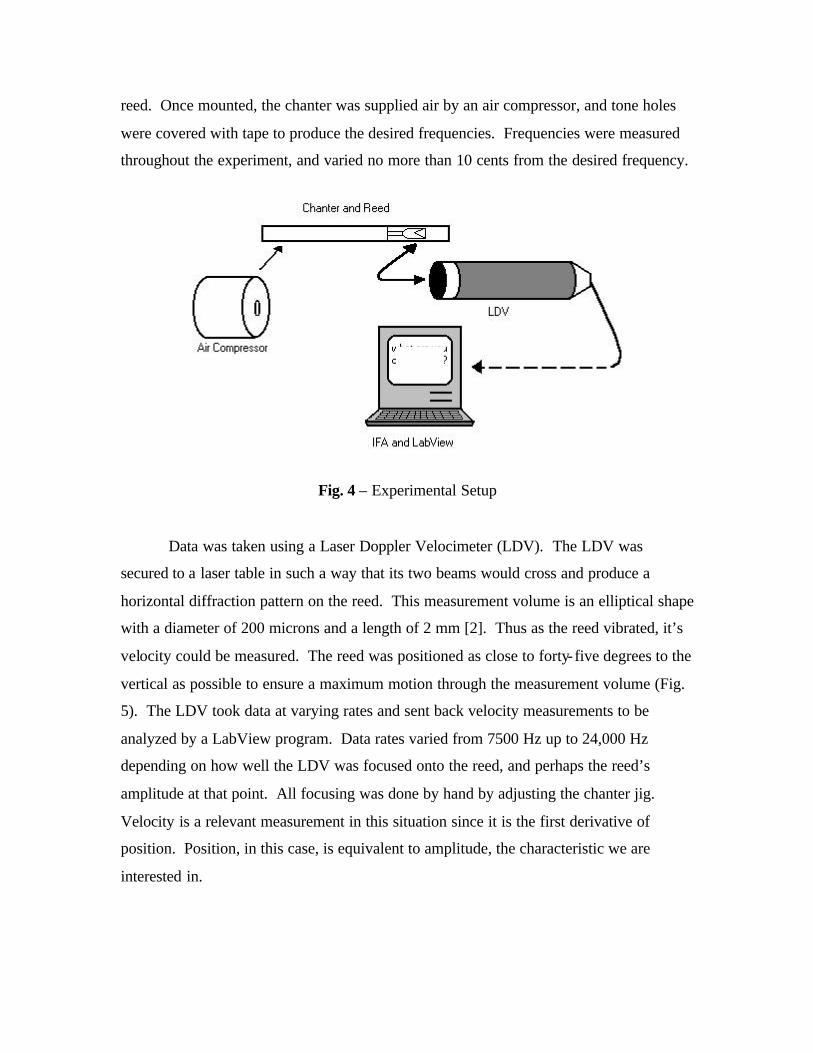
Data was taken using a Laser Doppler Velocimeter (LDV). The LDV was
secured to a laser table in such a way that its two beams would cross and produce a
horizontal diffraction pattern on the reed. This measurement volume is an elliptical shape
with a diameter of 200 microns and a length of 2 mm [2]. Thus as the reed vibrated, it’s
velocity could be measured. The reed was positioned as close to forty-five degrees to the
vertical as possible to ensure a maximum motion through the measurement volume (Fig.
5). The LDV took data at varying rates and sent back velocity measurements to be
analyzed by a LabView program. Data rates varied from 7500 Hz up to 24,000 Hz
depending on how well the LDV was focused onto the reed, and perhaps the reed’s
amplitude at that point. All focusing was done by hand by adjusting the chanter jig.
Velocity is a relevant measurement in this situation since it is the first derivative of
position. Position, in this case, is equivalent to amplitude, the characteristic we are
interested in.
Fig. 5 – Laser focused on the reed
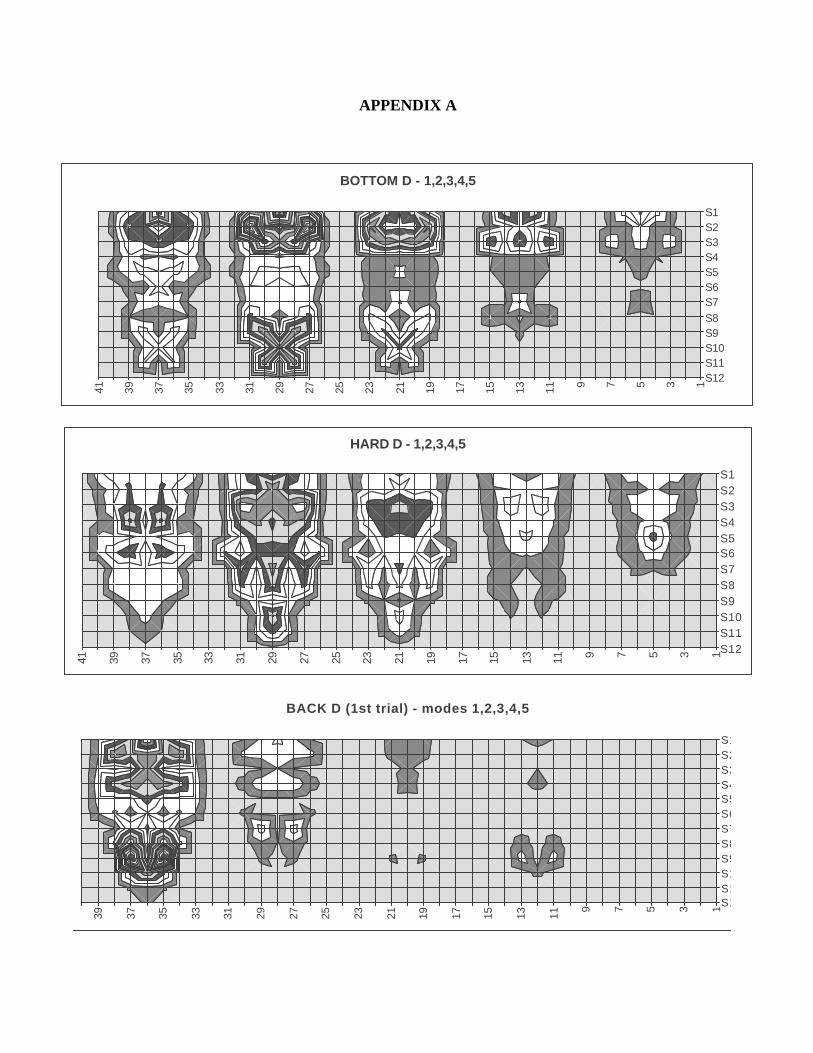
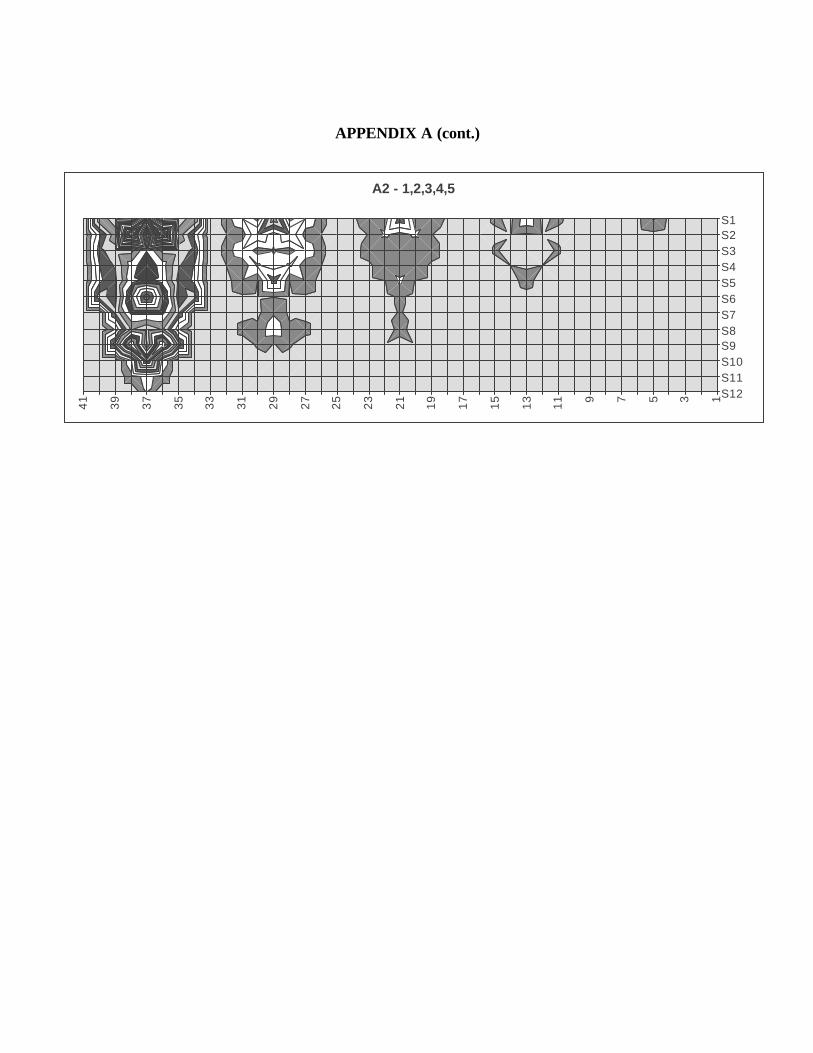
This study looked at four different frequencies (Fig. 6). The corresponding
frequencies span almost the entire range of the chanter. Uilleann pipe chanters are
capable of two octaves starting at D4. The ‘Bottom D’ and ‘Hard D’ are the same
frequency, but sound with different timbres. The title, ‘Back D’ has been given to D5 by
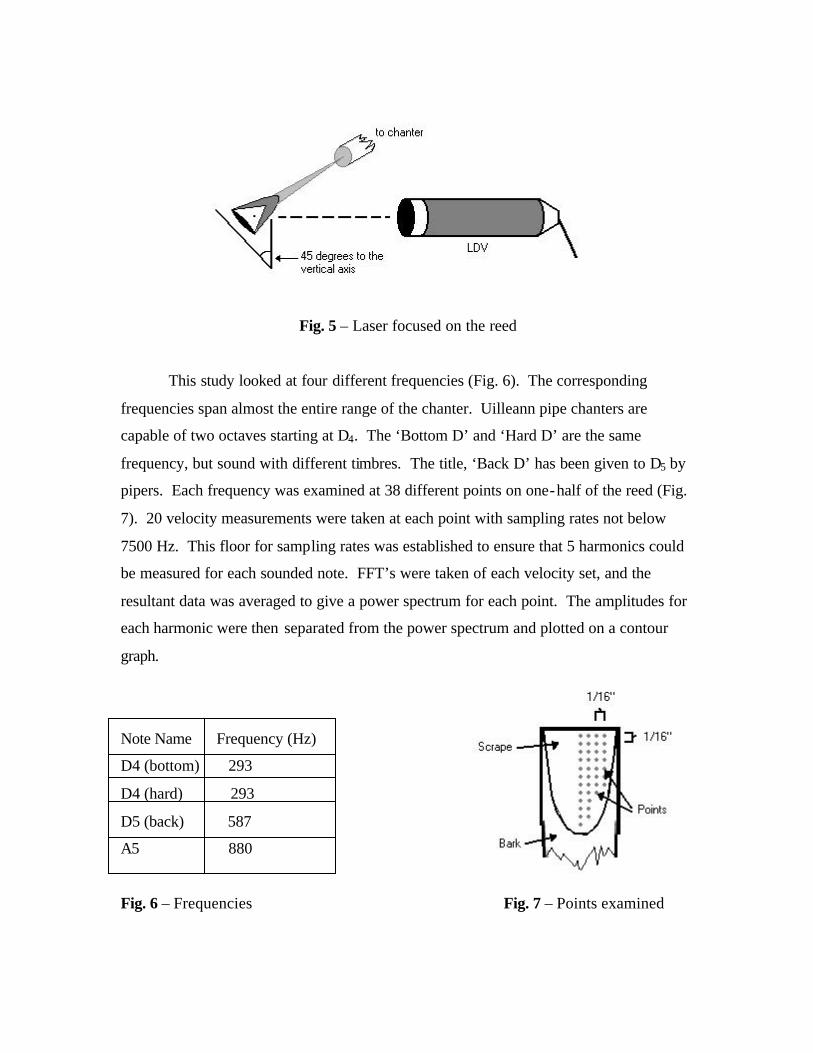
pipers. Each frequency was examined at 38 different points on one-half of the reed (Fig.
7). 20 velocity measurements were taken at each point with sampling rates not below
7500 Hz. This floor for sampling rates was established to ensure that 5 harmonics could
be measured for each sounded note. FFT’s were taken of each velocity set, and the
resultant data was averaged to give a power spectrum for each point. The amplitudes for
each harmonic were then separated from the power spectrum and plotted on a contour
graph.
Note Name Frequency (Hz)
D4 (bottom) 293
D4 (hard) 293
D5 (back) 587
A5 880
Fig. 6 – Frequencies Fig. 7 – Points examined
ERROR
Every effort was taken to eliminate error, but given the difficulty of working with
an LDV, error could be a significant factor. First, focusing the LDV onto the reed proved
to be extremely difficult. In order to get acceptable sampling rates, the chanter jig had to
be adjusted extensively, and with no apparent pattern. As a result, the angle at which the
laser viewed the reed was not perfectly constant. The reed angle was ideally 45 degrees,
but could vary 5 degrees in either rotational direction. As this angle changes, so perhaps
does the perceived amplitude of the reed. This error can be approximated:
This is a significant percentage, but given the tools available this error could not be
avoided.
Secondly, the reed was examined at 38 different points, each a sixteenth of an
inch apart. Given the difficulty focusing the laser, there may be some disparity between
the locations of points from note to note. This disparity could be as high as 1/64”.
An interesting problem that arose is that there seems to be a direct correlation
between sampling rate and amplitude. Although we set a lower limit on sampling rates,
we did not set an upper limit. Thus sampling rates could vary by as much as a factor of
three. In all the data sets the higher sampling rates show higher amplitudes relative to
their immediate neighbors, and lower noise floors. This could perhaps be because points
with greater amplitudes will move through more of the measurement volume and thus
send back more data. We could not establish whether this was the case or not.
Experiments done by Jesse Jones working with titanium dioxide particles in water seem
to show that the magnitude of velocity is independent of sampling rate [2].
Another source of error comes from the fact that the experiment had to deal with
reeds made from cane, an organic material. The nature of reeds is that they change with
time and varying environmental conditions. Our experiment required sounding the reeds
sometimes in excess of four hours. This amount of vibration weakens reeds, and they
tend to “close up”. Thus a reed’s vibration will have smaller amplitude after four hours
than it did at the start of the trial. It was not within the scope of this study to quantify the
effect the reed closing up.
A final problem that we experienced is time. We were unable to repeat
measurements of notes in their entirety because of time constraints. This fact, in
conjunction with the fact that we only took data across one-half of the reed, leads to a
great uncertainty in the data.
THEORY
Some study has been done on the modal behavior of clarinet reeds, but there has
been little to no study of double reeds. Some conjecture can be made as to the modal
behavior of double reeds based on the known behavior of other structures. Cantilever
beams, rectangular membranes, rectangular plates, and spruce plates are all structures
whose modal behaviors have been studied extensively.
The cane used to make uilleann pipe reeds has a very distinct grain that results in
a disparity between the reed’s cross-grain stiffness and the stiffness parallel to the grain.
If we ignore this disparity and assume the reed’s motion is one-dimensional, the reed can
be seen as a cantilever beam. Cantilever beams are beams clamped at one end and free at
the other. The reed’s structure is similar to this as the end of the grain is affixed to the
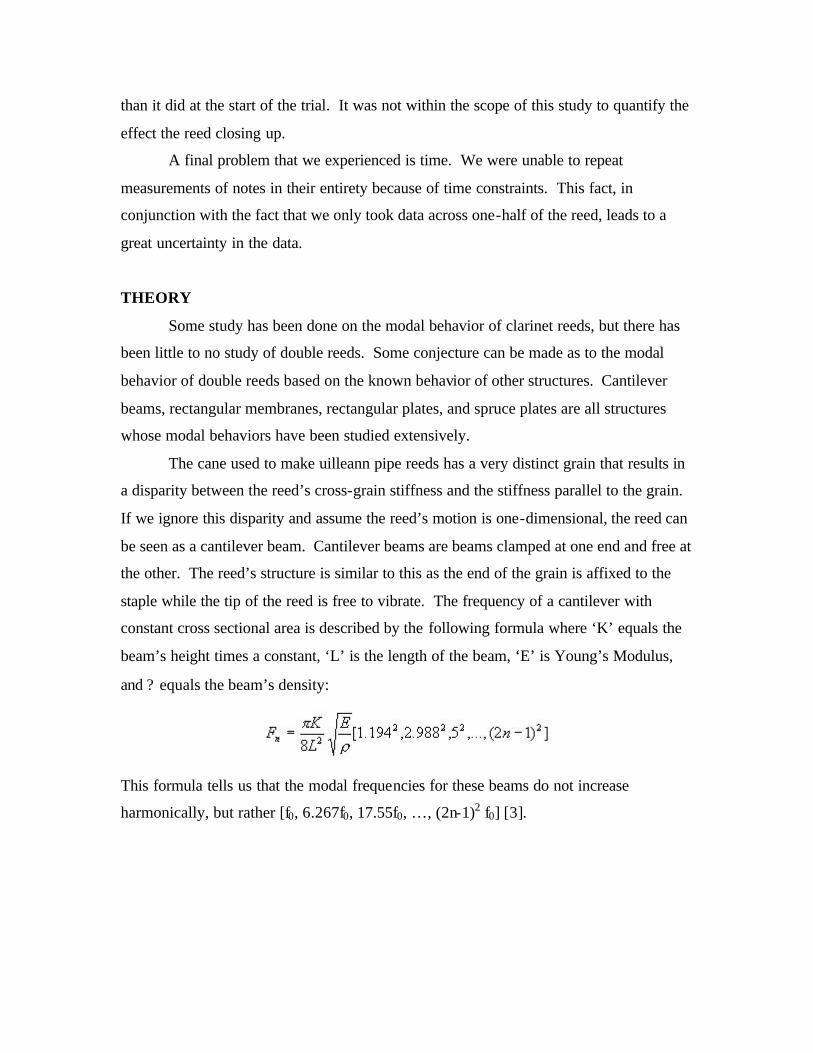
staple while the tip of the reed is free to vibrate. The frequency of a cantilever with
constant cross sectional area is described by the following formula where ‘K’ equals the
beam’s height times a constant, ‘L’ is the length of the beam, ‘E’ is Young’s Modulus,
and ? equals the beam’s density:
This formula tells us that the modal frequencies for these beams do not increase
harmonically, but rather [f0, 6.267f0, 17.55f0, …, (2n-1)2 f0] [3].
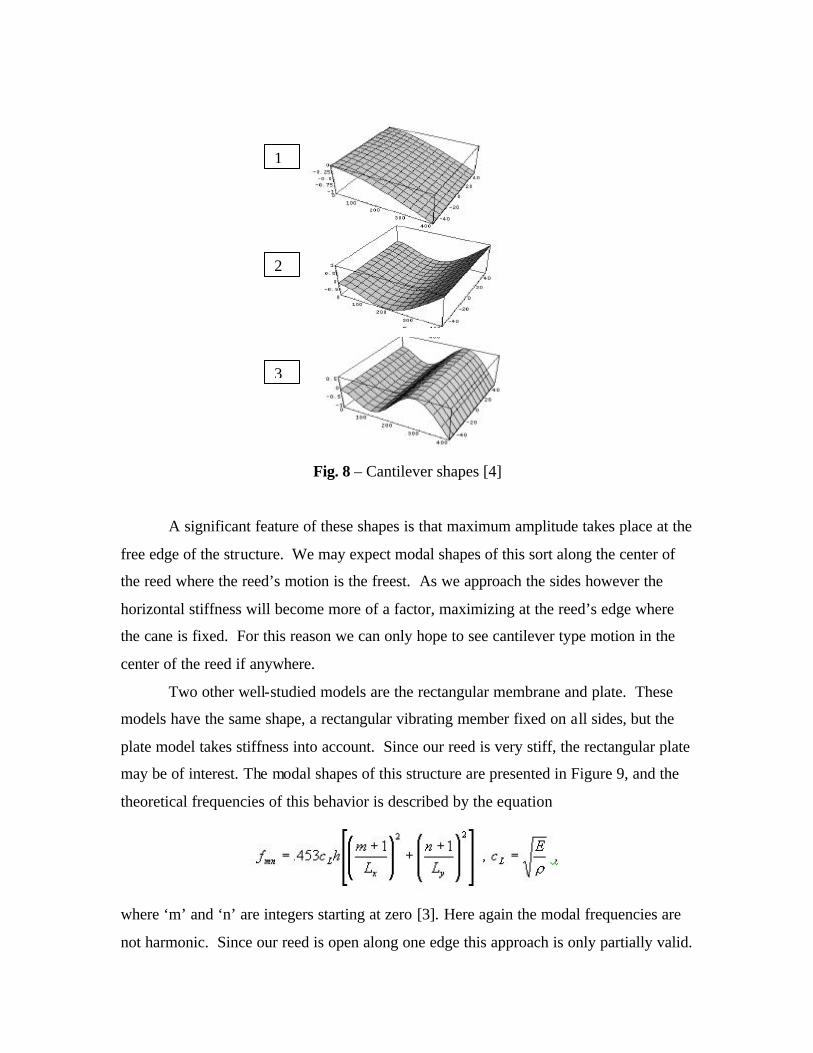
Fig. 8 – Cantilever shapes [4]
A significant feature of these shapes is that maximum amplitude takes place at the
free edge of the structure. We may expect modal shapes of this sort along the center of
the reed where the reed’s motion is the freest. As we approach the sides however the
horizontal stiffness will become more of a factor, maximizing at the reed’s edge where
the cane is fixed. For this reason we can only hope to see cantilever type motion in the
center of the reed if anywhere.
Two other well-studied models are the rectangular membrane and plate. These
models have the same shape, a rectangular vibrating member fixed on all sides, but the
plate model takes stiffness into account. Since our reed is very stiff, the rectangular plate
may be of interest. The modal shapes of this structure are presented in Figure 9, and the
theoretical frequencies of this behavior is described by the equation
where ‘m’ and ‘n’ are integers starting at zero [3]. Here again the modal frequencies are
not harmonic. Since our reed is open along one edge this approach is only partially valid.
1
2
3
Fig. 9 – Rectangular Plate [5]
The final vibrating structure that we should examine is the spruce top. Spruce is a
wood with a very well defined grain, and this model takes that into account.
Fig. 10 – Spruce [3]
The expected frequencies of a spruce board can be calculated via the equation
where cx and cy are constants taking Young’s Modulus, Poisson’s Ratio, and density into
account for any given piece of wood. Again, ‘m’ and ‘n’ are integers starting at zero [3]
Grain
Nodes
1,1 1,2 2,1 2,2
S1
S3
S5
S7
S9
S11
These shapes are for a spruce plate that is free to vibrate on all sides. We can see that the
maximum amplitudes occur parallel to the grain, a characteristic we can probably expect
from the reed even though it is fixed on three sides.
RESULTS and DISCUSSION
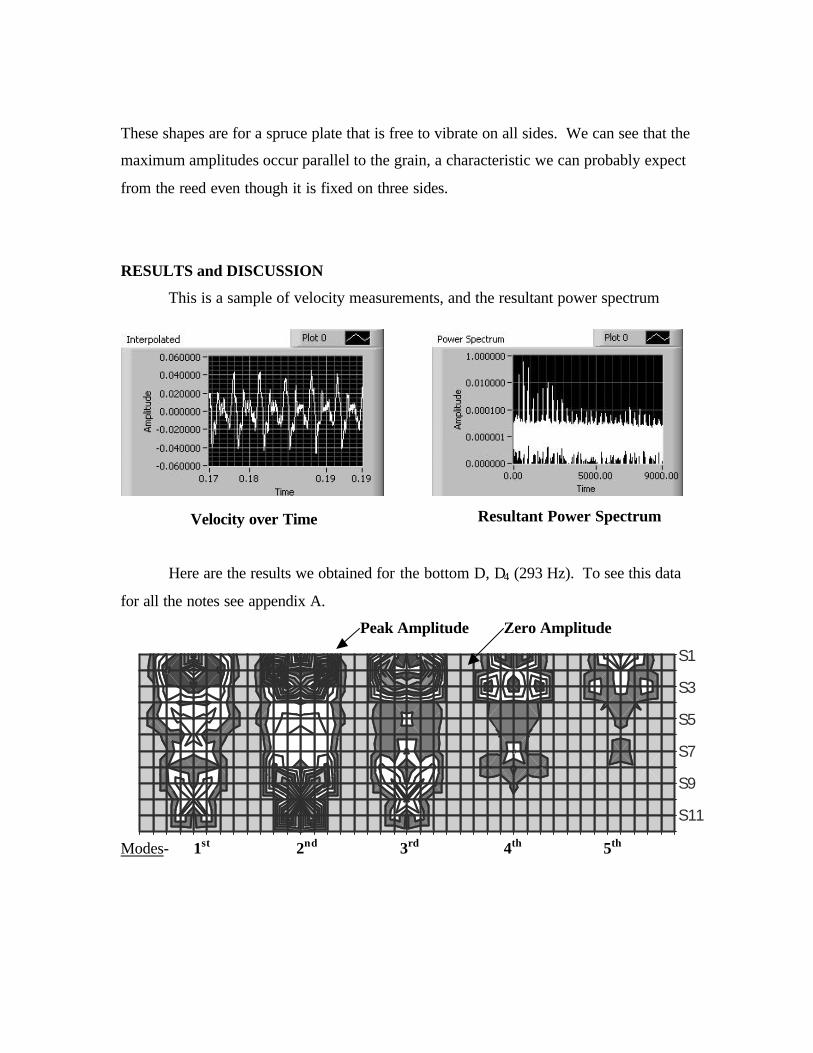
This is a sample of velocity measurements, and the resultant power spectrum
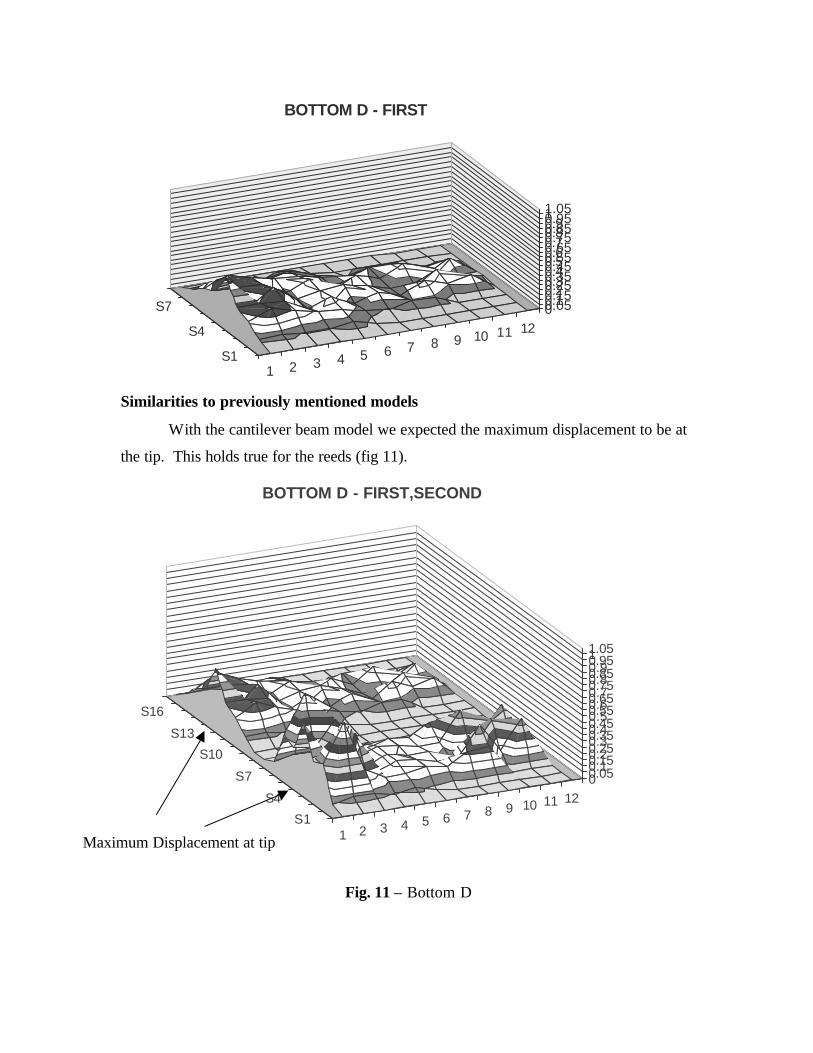
Here are the results we obtained for the bottom D, D4 (293 Hz). To see this data
There are many other elements to the reeds’ vibration that cannot be described by the
cantilever theory. This is due to the cross-grain stiffness of the reed.
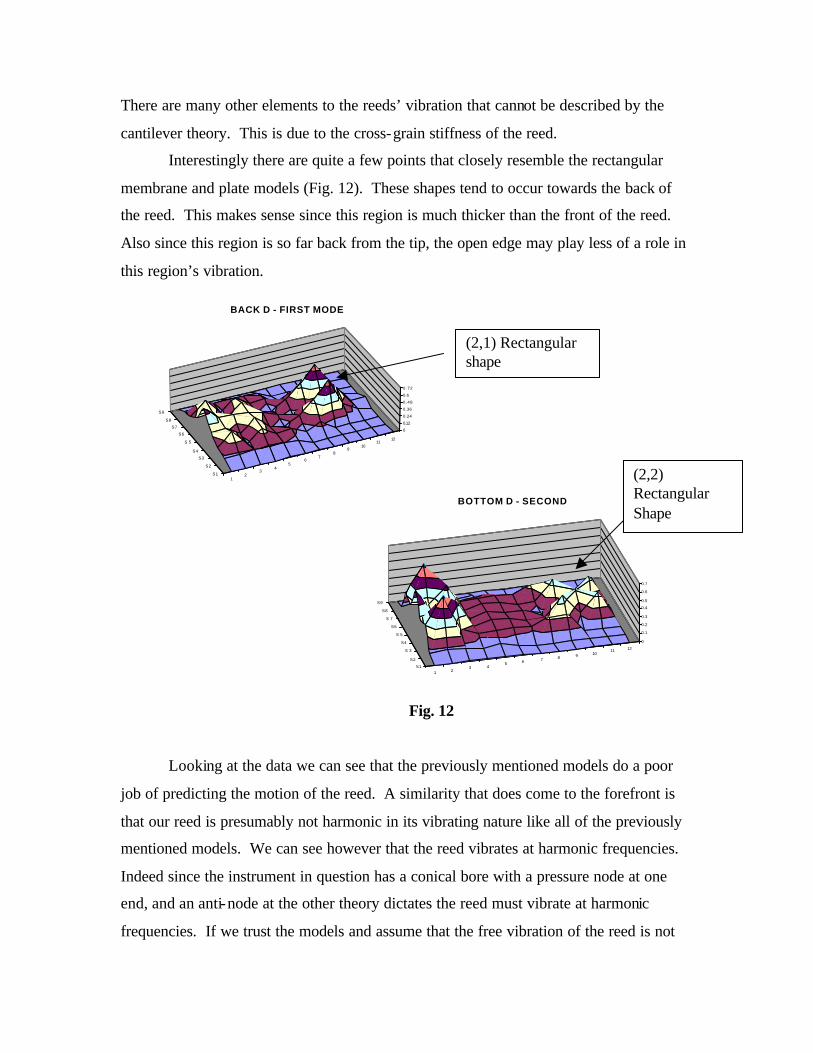
Interestingly there are quite a few points that closely resemble the rectangular
membrane and plate models (Fig. 12). These shapes tend to occur towards the back of
the reed. This makes sense since this region is much thicker than the front of the reed.
Also since this region is so far back from the tip, the open edge may play less of a role in
this region’s vibration.
Fig. 12
Looking at the data we can see that the previously mentioned models do a poor
job of predicting the motion of the reed. A similarity that does come to the forefront is
that our reed is presumably not harmonic in its vibrating nature like all of the previously
mentioned models. We can see however that the reed vibrates at harmonic frequencies.
Indeed since the instrument in question has a conical bore with a pressure node at one
end, and an anti-node at the other theory dictates the reed must vibrate at harmonic
frequencies. If we trust the models and assume that the free vibration of the reed is not
(2,1) Rectangular shape
(2,2) Rectangular Shape
harmonic then we can say that the air column below the reed dominates the vibrational
structure of the reed and forces it to vibrate at harmonic frequencies.
The Cutoff Length
An interesting point that is revealed by the data is a consistent node in the reed.
In all cases there is little motion near the seventh row of points on the reed. This node is
significant because it corresponds to the area of minimum structural pressure in the reed.
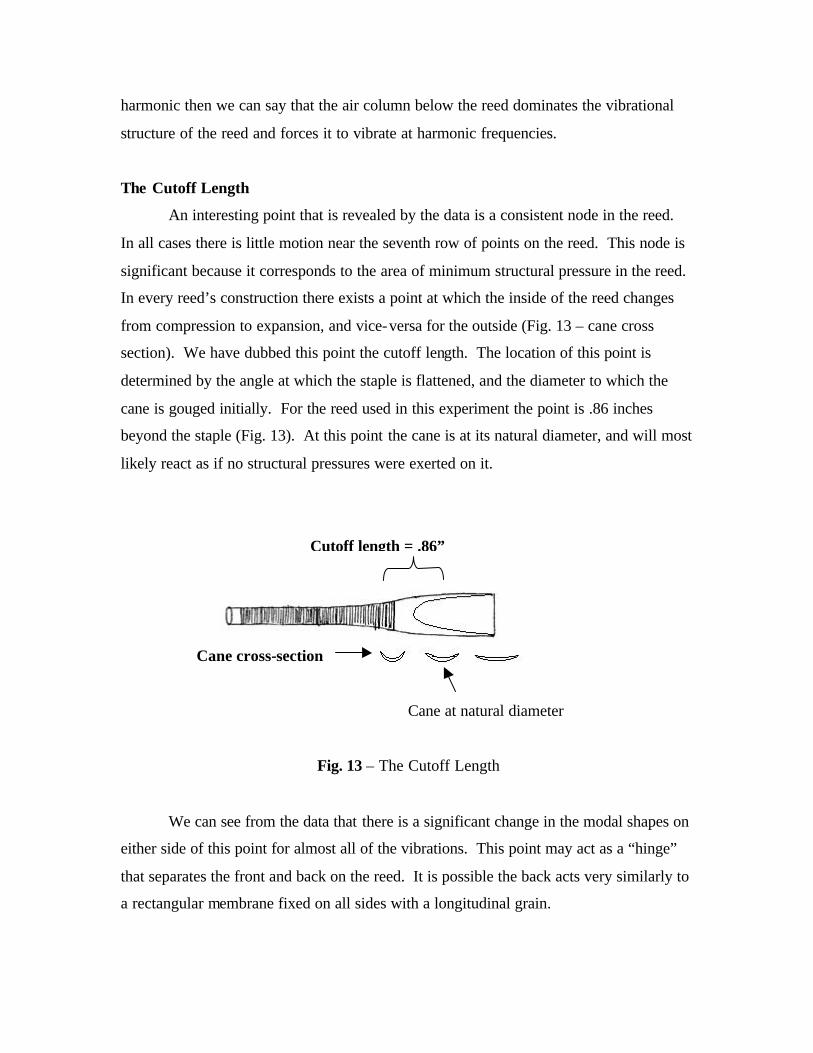
In every reed’s construction there exists a point at which the inside of the reed changes
from compression to expansion, and vice-versa for the outside (Fig. 13 – cane cross
section). We have dubbed this point the cutoff length. The location of this point is
determined by the angle at which the staple is flattened, and the diameter to which the
cane is gouged initially. For the reed used in this experiment the point is .86 inches
beyond the staple (Fig. 13). At this point the cane is at its natural diameter, and will most
likely react as if no structural pressures were exerted on it.
Cane cross-section
Cane at natural diameter
Fig. 13 – The Cutoff Length
We can see from the data that there is a significant change in the modal shapes on
either side of this point for almost all of the vibrations. This point may act as a “hinge”
that separates the front and back on the reed. It is possible the back acts very similarly to
a rectangular membrane fixed on all sides with a longitudinal grain.
Cutoff length = .86”
1
2
3
4
5
6
7
8
9
1 0
1 1
1 2
S 1 S 2 S 3 S4 S 5 S 6 S 7 S 8 S9
Reed Maker’s Knowledge
Every reed maker has certain “rules” that he/she shapes his/her reed by. For
example when a reed’s back D is flat the solution is to cut the reed. Our data should
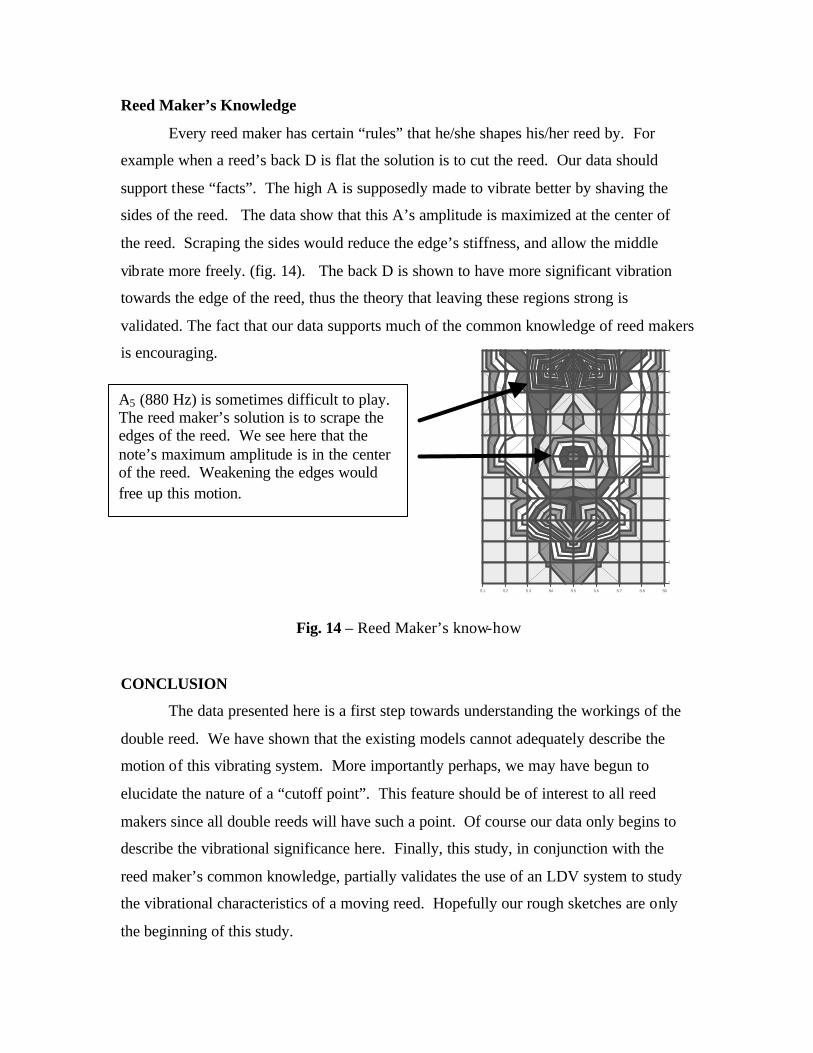
support these “facts”. The high A is supposedly made to vibrate better by shaving the
sides of the reed. The data show that this A’s amplitude is maximized at the center of
the reed. Scraping the sides would reduce the edge’s stiffness, and allow the middle
vibrate more freely. (fig. 14). The back D is shown to have more significant vibration
towards the edge of the reed, thus the theory that leaving these regions strong is
validated. The fact that our data supports much of the common knowledge of reed makers
is encouraging.
Fig. 14 – Reed Maker’s know-how
CONCLUSION
The data presented here is a first step towards understanding the workings of the
double reed. We have shown that the existing models cannot adequately describe the
motion of this vibrating system. More importantly perhaps, we may have begun to
elucidate the nature of a “cutoff point”. This feature should be of interest to all reed
makers since all double reeds will have such a point. Of course our data only begins to
describe the vibrational significance here. Finally, this study, in conjunction with the
reed maker’s common knowledge, partially validates the use of an LDV system to study
the vibrational characteristics of a moving reed. Hopefully our rough sketches are only
the beginning of this study.
A5 (880 Hz) is sometimes difficult to play. The reed maker’s solution is to scrape the edges of the reed. We see here that the note’s maximum amplitude is in the center of the reed. Weakening the edges would free up this motion.