Vibrational Spectrometry of Pesticides and Related Materials on Thin Layer Chromatography Adsorbents MARIA M. GOMEZ-TAYLOR, DONALD KUEHL, and PETER R. GRIFFITHS* Department of Chemistry, Ohio University, Athens, Ohio 46701 Methods of measuring the vibrational spectra of species adsorbed on thin layer chromatography (TLC) plates have been studied by Four- ier transform infrared (FT.ir) and Raman spectrometry. Previous measurements of the transmittance spectra of species separated by TLC (with the adsorbent deposited on AgCI plates) showed poor signal/noise ratio at high frequency due to scattering by the adsorb- ent. Scattering has been minimized in these experiments by treating the TLC plate with Fluorolube, an infrared mulling oil whose refractive index closely matches that of the adsorbent. Spectra of chlorinated hydrocarbon pesticides on silica gel and alumina ad- sorbents measured in this way show differences which can be corre- lated with the mechanism of adsorption. FT-ir spectra of com- pounds on TLC plates can be obtained from microgram quantities of sample but Raman spectrometry is not as sensitive, requiring at least 200 pg of sample. The Raman bands of adsorbed pesticides are weak and considerably broadened with respect to the corresponding bands in the spectra of the pure samples. Index Headings: Fourier transform infrared spectrometry; Raman spectrometry; Techniques, spectroscopic; Analysis, for pesticides. INTRODUCTION Most methods for measuring the infrared spectra of materials separated by thin layer chromatography (TLC) involve removal of the sample from the plate, usually followed by an extraction and concentration step. A general method for measuring the vibrational spectrum of materials which have been separated by TLC is desirable so that qualitative analysis of mixtures can be performed rapidly and with the lowest possible sample loss. We have studied two methods for the direct measurement of the vibrational spectrum of species on TLC plates, one of which involves the use of an infrared Fourier transform (FT-ir) spectrometer and the other which utilizes Raman spectrometry. A recent communication from this laboratory I de- scribed a method by which infrared spectra of materials on specially fabricated TLC plates could be measured directly. The adsorbent (silica gel or alumina) was de- posited on an inert infrared-transmitting substrate (AgC1), and infrared spectra of sorbed samples were measured directly for materials in as small quantities as 1/zg. It was noted that two problem areas due to the spectral properties of the adsorbent (absorption and scattering) limited the general application of the method for the direct measurement of the ir spectrum of species separated by TLC (TLC-ir). To obtain acceptable spectra by this method, the ad- sorbent had to be deposited at such a thickness that the absorption and scattering processes did not prevent a reasonable proportion of the incident radiation from Received 2 March 1976;revision received 19 March 1976. * To whom all correspondenceshould be addressed. reaching the ir detector, but still thick enough that the adsorbent does not become overloaded with the sample during the development of the chromatogram thereby causing a loss in chromatographic resolution. The opti- mum thickness for the adsorbent layer was found to be about I00 ~m. At the thickness of about 100 ~m, the intense Si--O and A1---O stretching modes of silica gel and alumina, respectively, reduced the transmittance of a portion of the spectrum below 5% but, outside the region of this strong band, at least 40% of the incident radiation was transmitted, even though much of the high frequency radiation was scattered so that it was not measured at the ir detector. Scattering of radiation is a function of the relative values of the average diameter of the adsorbent parti- cles (~ and the wavelength of the incident radiation (h). The particle size of the adsorbents typically used for TLC (10 < d < 40 ~m) leads to a value for d/h which is sufficiently small at the long wavelength end of the spectrum that scattering effects do not seriously atten- uate the radiation incident on the detector. However, at the short wavelength end of the spectrum the energy is seriously attenuated due to scattering. It may be noted that the efficiency of the FT-ir spectrometer being used for these measurements is rather low at high fre- quency. 2 For example, around 3000 cm -1 the amount of sample required to yield detectable adsorption bands is about 10 times higher than for the fingerprint region of the spectrum (below 2000 cm -1) due to the combined effects of scattering and the low efficiency of the inter- ferometer. To decrease scattering effects we have studied the feasibility of treating the chromatoplate (after elution, drying and, if necessary, development of the spot by a visualizing agent) with an oil whose refractive index matches that of the adsorbent. Both Nujol and Fluoro- lube were investigated, but in view of the transparency of Flurolube above 1400 cm -1, it was believed this would be the most useful material to increase the sensitivity of TLC-ir at high frequency. Chlorinated hydrocarbon pesticides were used as the samples for this investigation for three principal rea- sons: (a) they are notoriously weak ir absorbers so that any sensitivity figures obtained using these compounds would almost certainly represent a "worst case" for TLC-ir detection limits; (b) they are colorless so that a study of visualization techniques must be made; and (c) sensitivity data obtained in this study can be directly compared to sensitivity data obtained in parallel gas chromatography-ir and liquid chromatography-ir stud- ies being made in this and other laboratories on the same compounds. The spectra measured by TLC-ir were compared to Volume 30, Number 4, 1976 APPLIED SPECTROSCOPY 447
Transcript
Vibrational Spectrometry of Pesticides and Related Materials on Thin Layer Chromatography Adsorbents
MARIA M. GOMEZ-TAYLOR, DONALD KUEHL, and PETER R. GRIFFITHS* Department of Chemistry, Ohio University, Athens, Ohio 46701
Methods of measuring the vibrational spectra of species adsorbed on thin layer chromatography (TLC) plates have been studied by Four- ier transform infrared (FT.ir) and Raman spectrometry. Previous measurements of the transmittance spectra of species separated by TLC (with the adsorbent deposited on AgCI plates) showed poor signal/noise ratio at high frequency due to scattering by the adsorb- ent. Scattering has been minimized in these experiments by treating the TLC plate with Fluorolube, an infrared mulling oil whose refractive index closely matches that of the adsorbent. Spectra of chlorinated hydrocarbon pesticides on si l ica gel and alumina ad- sorbents measured in this way show differences which can be corre- lated with the mechanism of adsorption. FT-ir spectra of com- pounds on TLC plates can be obtained from microgram quantities of sample but Raman spectrometry is not as sensitive, requiring at least 200 pg of sample. The Raman bands of adsorbed pesticides are weak and considerably broadened with respect to the corresponding bands in the spectra of the pure samples. Index Headings: Fourier transform infrared spectrometry; Raman spectrometry; Techniques, spectroscopic; Analysis, for pesticides.
INTRODUCTION
Most methods for measuring the infrared spectra of materials separated by thin layer chromatography (TLC) involve removal of the sample from the plate, usually followed by an extraction and concentration step. A general method for measuring the vibrational spectrum of materials which have been separated by TLC is desirable so that qualitative analysis of mixtures can be performed rapidly and with the lowest possible sample loss. We have studied two methods for the direct measurement of the vibrational spectrum of species on TLC plates, one of which involves the use of an infrared Fourier transform (FT-ir) spectrometer and the other which utilizes Raman spectrometry.
A recent communication from this laboratory I de- scribed a method by which infrared spectra of materials on specially fabricated TLC plates could be measured directly. The adsorbent (silica gel or alumina) was de- posited on an inert infrared-transmitting substrate (AgC1), and infrared spectra of sorbed samples were measured directly for materials in as small quantities as 1/zg. It was noted that two problem areas due to the spectral properties of the adsorbent (absorption and scattering) limited the general application of the method for the direct measurement of the ir spectrum of species separated by TLC (TLC-ir).
To obtain acceptable spectra by this method, the ad- sorbent had to be deposited at such a thickness that the absorption and scattering processes did not prevent a reasonable proportion of the incident radiation from
Received 2 March 1976; revision received 19 March 1976. * To whom all correspondence should be addressed.
reaching the ir detector, but still thick enough that the adsorbent does not become overloaded with the sample during the development of the chromatogram thereby causing a loss in chromatographic resolution. The opti- mum thickness for the adsorbent layer was found to be about I00 ~m. At the thickness of about 100 ~m, the intense Si--O and A1---O stretching modes of silica gel and alumina, respectively, reduced the transmittance of a portion of the spectrum below 5% but, outside the region of this strong band, at least 40% of the incident radiation was transmitted, even though much of the high frequency radiation was scattered so that it was not measured at the ir detector.
Scattering of radiation is a function of the relative values of the average diameter of the adsorbent parti- cles (~ and the wavelength of the incident radiation (h). The particle size of the adsorbents typically used for TLC (10 < d < 40 ~m) leads to a value for d/h which is sufficiently small at the long wavelength end of the spectrum that scattering effects do not seriously atten- uate the radiation incident on the detector. However, at the short wavelength end of the spectrum the energy is seriously attenuated due to scattering. It may be noted that the efficiency of the FT-ir spectrometer being used for these measurements is rather low at high fre- quency. 2 For example, around 3000 cm -1 the amount of sample required to yield detectable adsorption bands is about 10 times higher than for the fingerprint region of the spectrum (below 2000 cm -1) due to the combined effects of scattering and the low efficiency of the inter- ferometer.
To decrease scattering effects we have studied the feasibility of treating the chromatoplate (after elution, drying and, if necessary, development of the spot by a visualizing agent) with an oil whose refractive index matches that of the adsorbent. Both Nujol and Fluoro- lube were investigated, but in view of the transparency of Flurolube above 1400 cm -1, it was believed this would be the most useful material to increase the sensitivity of TLC-ir at high frequency.
Chlorinated hydrocarbon pesticides were used as the samples for this investigation for three principal rea- sons: (a) they are notoriously weak ir absorbers so that any sensitivity figures obtained using these compounds would almost certainly represent a "worst case" for TLC-ir detection limits; (b) they are colorless so that a study of visualization techniques must be made; and (c) sensitivity data obtained in this study can be directly compared to sensitivity data obtained in parallel gas chromatography-ir and liquid chromatography-ir stud- ies being made in this and other laboratories on the same compounds.
The spectra measured by TLC-ir were compared to
Volume 30, Number 4, 1976 APPLIED SPECTROSCOPY 447
reference spectra of the same samples measured using other sampling techniques (KBr pellets, mulls, and so- lutions) for two reasons. First, it was hoped that changes in the band parameters might provide some information as to how the molecules interact with the silica gel or alumina adsorbents. Second, if the TLC-ir technique were to prove generally useful, it is necessary to know whether spectral search programs using stand- ard spectra for the data base can be confidently used to identify compounds whose spectra are measured when the samples are adsorbed on silica gel or alumina.
Raman spectra of these chlorinated hydrocarbon pes- ticides have also been measured both to study the feasi- bility of directly measuring the Raman spectra of mate- rials on TLC plates and to investigate the effect of adsorption on the Raman bands of large molecules. Raman spectrometry should have an advantage over infrared for the identification of species on TLC plates since the severe interferences encountered in ir meas- urements due to the intense Si--O and A1---O stretching modes of the adsorbent should be much smaller for Raman scattering. However as noted by Hendra, 3 the strong infrared bands of these adsorbents are caused by the antisymmetric Si----O and A1---O stretching modes, while the corresponding symmetric modes should cause the most intense bands in the Raman spectrum. In previous measurements of the spectra of adsorbed mole- cules, 4~ these bands were never strong, and in our studies they were not observed at all.
TABLE I. Chlorinated pesticides used in this study and their stated purities.
E) (Brinkmann Instruments Inc., Des Plaines, IL) in 2.5 ml of a 50:50 water-methanol mixture; the plates were dried for 30 minutes at 100°C before use. Heptane was used as the mobile phase for all chromatographic sepa- rations.
For the Raman feasibility studies, samples were pre- pared by mixing 2 ml of a 2% solution of pesticide into 0.25 g of adsorbent and evaporating off the hexane. For studies of the effect of the activity of the adsorbent on the Raman spectrum of the adsorbed species, silica gel was methylated using dichlorodimethylsilane (DMCS) as a 5% solution in toluene, or dehydroxylated at 400°C under a vacuum of 10 -4 Torr for 12 h. Measurements of the weight distribution ratio, K,~, of the sample be- tween hexane and silica gel were performed spectropho- tometrically using a model SP-1800 uv-visible spectro- photometer (Pye-Unicam Ltd., Cambridge, England).
I. EXPERIMENTAL
Infrared spectra were measured using a model FTS-14 infrared Fourier transform spectrophotometer (Digilab Inc., Cambridge, MA). Samples were held at the focus of a 4x reflective beam condenser (Harrick Scientific Corp., Ossining, NY). All spectra were measured at 4 cm-' resolution in the double-precision mode (32 bits per datum point) by signal-averaging 400 scans; single- beam spectra measured through a sample spot on a TLC plate were ratioed against single-beam spectra mea- sured through a neighboring region of the plate on which no sample was present so that transmittance spectra free of bands due to the adsorbent were ob- tained. Raman spectra were measured on a model 81 Raman spectrometer (Cary Instruments, Monrovia, CA) using the 488.0 nm line of a model 53 argon laser (Coherent Radiation Inc., Palo Alto, CA) at an incident power of approximately 0.2 W; 180 ° scattered light was collected, and the sample was held in a glass capillary tube using glycerol as the optical coupling agent. Spec- tral slit widths between 3 and 6 cm-' and scan speeds between 0.1 and 0.5 cm-'/sec were used depending on the intensity of the Raman bands of the adsorbed spe- cies.
Chlorinated hydrocarbon pesticides from Chem Serv- ice Inc. (West Chester, PA) were used without further purification. The pesticides and their stated purities are shown in Table I.
For the infrared studies, TLC plates were prepared by coating AgC1 plates (Harshaw Chemical Co., Crystal and Electronic Products Div., Solon, OH) with a slurry of i g of either Silica Gel H or Aluminum Oxide G (type
II. RESULTS AND DISCUSSION
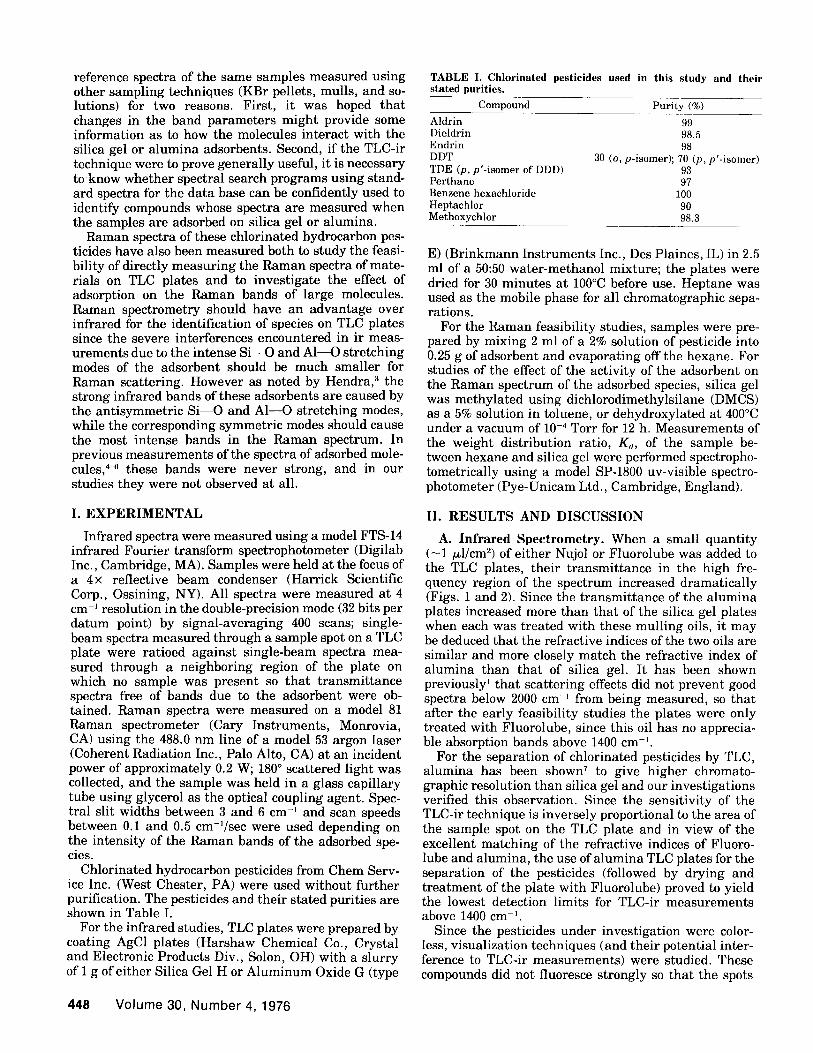
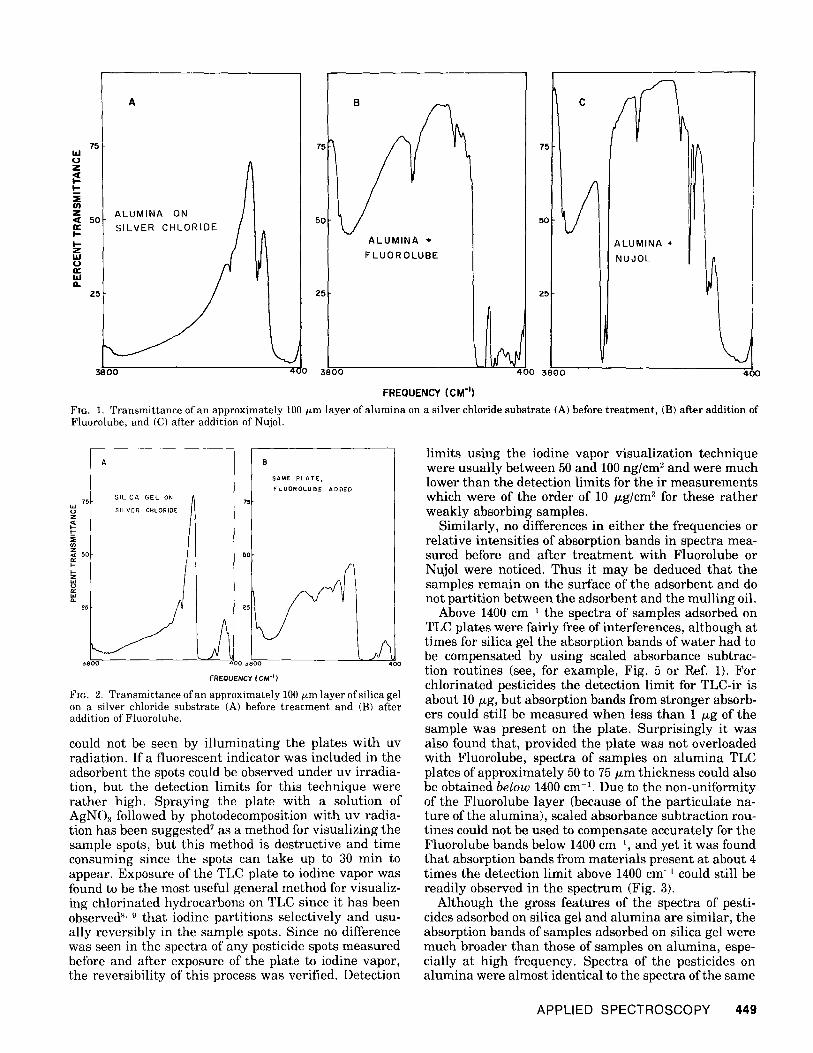
A. Infrared Spectrometry. When a small quantity ( -1/zl /cm 2) of either Nujol or Fluorolube was added to the TLC plates, their transmittance in the high fre- quency region of the spectrum increased dramatically (Figs. 1 and 2). Since the transmittance of the alumina plates increased more than that of the silica gel plates when each was treated with these mulling oils, it may be deduced that the refractive indices of the two oils are similar and more closely match the refractive index of alumina than that of silica gel. It has been shown previously' that scattering effects did not prevent good spectra below 2000 cm -~ from being measured, so that after the early feasibility studies the plates were only treated with Fluorolube, since this oil has no apprecia- ble absorption bands above 1400 cm-'.
For the separation of chlorinated pesticides by TLC, alumina has been shown 7 to give higher chromato- graphic resolution than silica gel and our investigations verified this observation. Since the sensitivity of the TLC-ir technique is inversely proportional to the area of the sample spot on the TLC plate and in view of the excellent matching of the refractive indices of Fluoro- lube and alumina, the use of alumina TLC plates for the separation of the pesticides (followed by drying and treatment of the plate with Fluorolube) proved to yield the lowest detection limits for TLC-ir measurements above 1400 cm '.
Since the pesticides under investigation were color- less, visualization techniques (and their potential inter- ference to TLC-ir measurements) were studied. These compounds did not fluoresce strongly so that the spots
448 Volume 30, Number 4, 1976
Z5
ALUMINA ON l
ALUMINA + FLUOROLUBE
75 I
50
ALUMINA + NUJOL
4(
W
t -
,Y
I-- I-- Z I.g O
I.=.1 a.
c
/
3 8 0 0 4( 3800 400 3800 400
FREQUENCY (CM") Fro. 1. Transmittance of an approximately 100 tLm layer of alumina on a silver chloride substrate (A) before treatment, (B) after addition of Fluorolube, and (C) after addition of Nujol.
~ o ~ 75 t A
~so
E5
SILICA GEL ON SILVER CHLORIDE
J 3800
SAME PLATE, FLDOROLUBE ADDED
5O
400 400 FREOUENCYICM-'~
FIG. 2. Transmittance of an approximately 100 #m layer of silica gel on a silver chloride substrate (A) before treatment and (B) after addition of Fluorolube.
could not be seen by i l lumina t ing the pla tes wi th uv radiat ion. I f a f luorescent indicator was included in the adsorbent the spots could be observed under uv i r radia- tion, but the detection l imits for this technique were r a the r high. Spray ing the pla te wi th a solution of AgNO:~ followed by photodecomposi t ion with uv radia- tion has been suggested 7 as a method for visual iz ing the sample spots, bu t this method is des t ruct ive and t ime consuming since the spots can t ake up to 30 min to appear . Exposure of the TLC plate to iodine vapor was found to be the most useful general method for visualiz- ing chlor inated hydrocarbons on TLC since it has been observed s, :~ t ha t iodine par t i t ions select ively and usu- ally revers ib ly in the sample spots. Since no difference was seen in the spectra of any pesticide spots measu red before and af ter exposure of the pla te to iodine vapor, the revers ibi l i ty of this process was verified. Detect ion
l imits us ing the iodine vapor v isual iza t ion technique were usua l ly be tween 50 and 100 ng/cm 2 and were much lower t h a n the detect ion l imits for the ir m e a s u r e m e n t s which were of the order of 10 tzg/cm 2 for these r a t h e r weak ly absorbing samples .
Similar ly , no differences in e i ther the frequencies or re la t ive in tensi t ies of absorpt ion bands in spectra mea- sured before and af ter t r e a t m e n t wi th Fluorolube or Nujol were noticed. Thus it m a y be deduced tha t the samples r e m a i n on the surface of the adsorbent and do not par t i t ion be tween the adsorben t and the mul l ing oil.
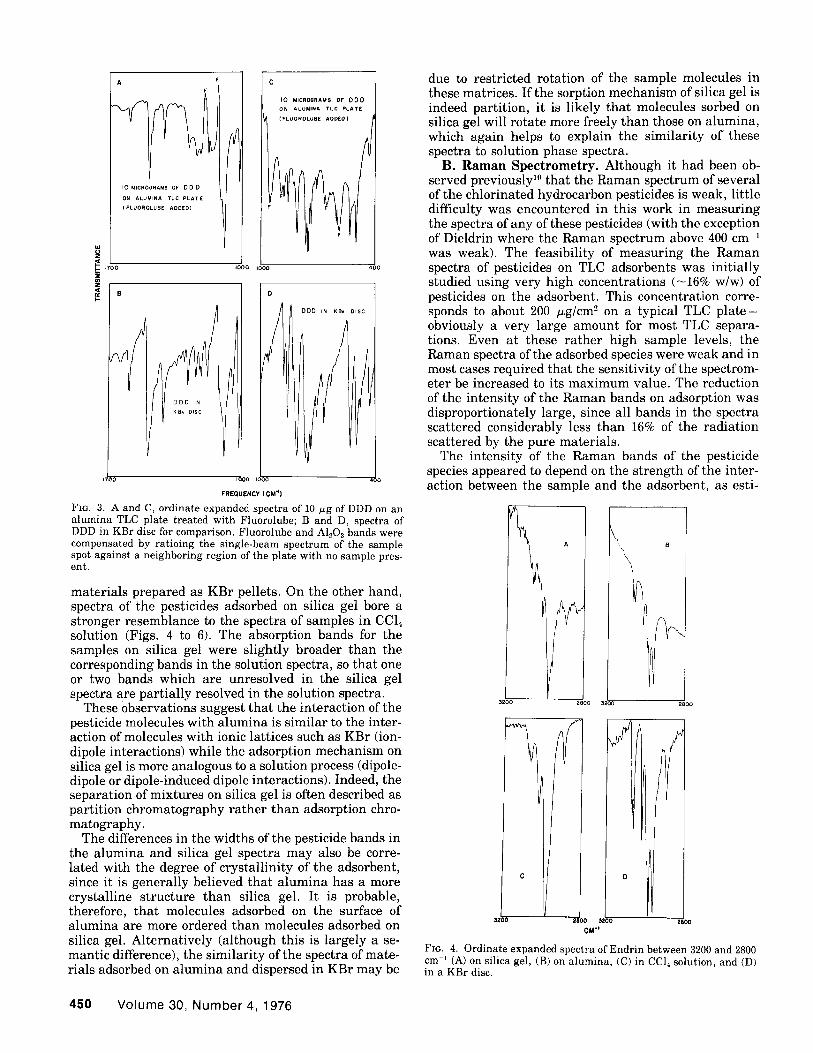
Above 1400 cm t the spectra of samples adsorbed on TLC plates were fair ly free of interferences, a l though at t imes for silica gel the absorpt ion bands of wa t e r had to be compensa ted by us ing scaled absorbance subtrac- tion rout ines (see, for example , Fig. 5 or Ref. 1). For chlor inated pesticides the detect ion l imit for TLC-ir is about 10 ~g, but absorpt ion bands f rom s t ronger absorb- ers could still be measu red when less t h a n 1 tag of the sample was presen t on the plate. Surpr i s ingly it was also found tha t , provided the p la te was not overloaded with Fluorolube, spectra of samples on a l u m i n a TLC plates of approx ima te ly 50 to 75 tzm th ickness could also be obtained below 1400 cm -1. Due to the non-uni formi ty of the Fluorolube layer (because of the par t icu la te na- ture of the a lumina) , scaled absorbance subtract ion rou- t ines could not be used to compensa te accura te ly for the Fluorolube bands below 1400 c m - ' , and yet it was found tha t absorpt ion bands f rom ma te r i a l s p resen t a t about 4 t imes the detect ion l imit above 1400 cm -t could still be readi ly observed in the spec t rum (Fig. 3).
Al though the gross fea tures of the spectra of pesti- cides adsorbed on silica gel and a l u m i n a are s imilar , the absorpt ion bands of samples adsorbed on silica gel were much broader t h a n those of samples on a lumina , espe- cially a t h igh frequency. Spectra of the pesticides on a lumina were a lmost identical to the spectra of the same
APPLIED SPECTROSCOPY 449
z
J700
A
I0 MICROGRAMS OF DD D
ON ALUMINA TLC PLATE
{FLUOROLUBE ADDED)
C
I0 MICROGRAMS OF ODD ON ALUMINA TLC PLATE
( FLUOROLUBE ADDED)
fOOD fOOD
f ,O )0
FREQUENCY ( CM "1)
FIG. 3. A and C, ordinate expanded spectra of 10 ~g of DDD on an a lumina TLC plate treated with Fluorolube; B and D, spectra of DDD in KBr disc for comparison. Fluorolube and Al.~O3 bands were compensated by ratioing the single-beam spectrum of the sample spot against a neighboring region of the plate with no sample pres- ent.
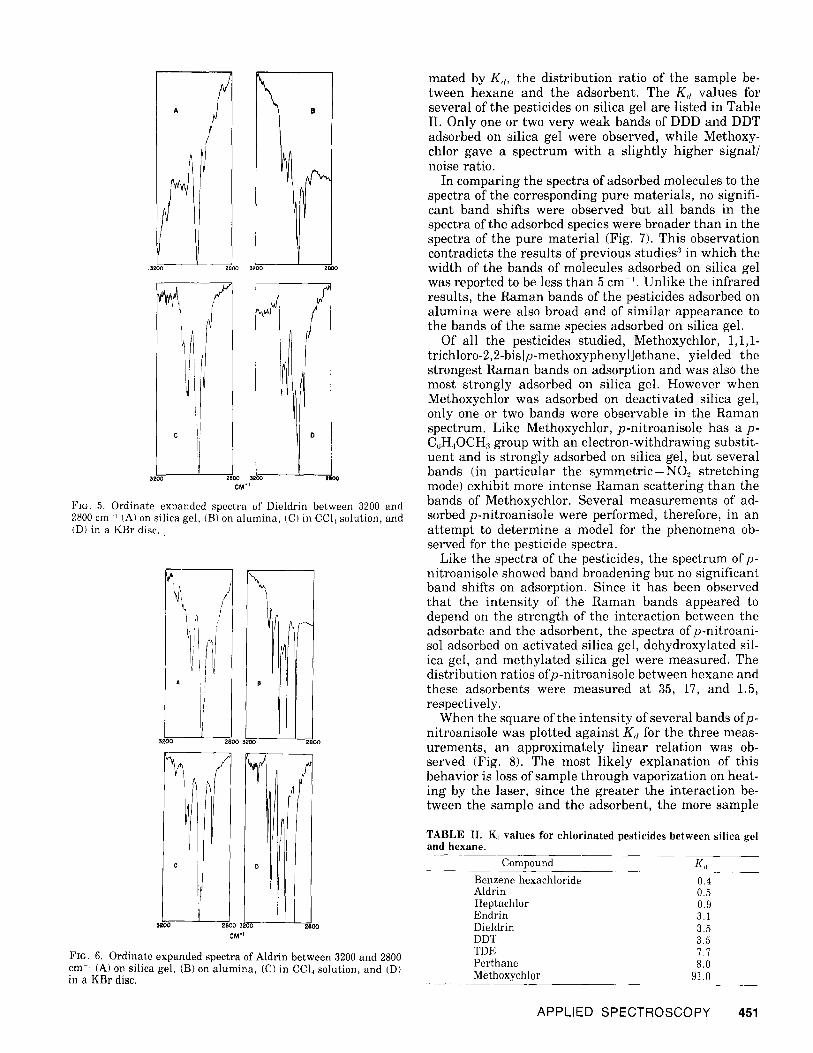
materials prepared as KBr pellets. On the other hand, spectra of the pesticides adsorbed on silica gel bore a stronger resemblance to the spectra of samples in CC14 solution (Figs. 4 to 6). The absorption bands for the samples on silica gel were slightly broader than the corresponding bands in the solution spectra, so that one or two bands which are unresolved in the silica gel spectra are partially resolved in the solution spectra.
These observations suggest that the interaction of the pesticide molecules with alumina is similar to the inter- action of molecules with ionic lattices such as KBr (ion- dipole interactions) while the adsorption mechanism on silica gel is more analogous to a solution process (dipole- dipole or dipole-induced dipole interactions). Indeed, the separation of mixtures on silica gel is often described as partition chromatography rather than adsorption chro- matography.
The differences in the widths of the pesticide bands in the alumina and silica gel spectra may also be corre- lated with the degree of crystallinity of the adsorbent, since it is generally believed that alumina has a more crystalline structure than silica gel. It is probable, therefore, that molecules adsorbed on the surface of alumina are more ordered than molecules adsorbed on silica gel. Alternatively (although this is largely a se- mantic difference), the similarity of the spectra of mate- rials adsorbed on alumina and dispersed in KBr may be
due to restricted rotation of the sample molecules in these matrices. If the sorption mechanism of silica gel is indeed partition, it is likely that molecules sorbed on silica gel will rotate more freely than those on alumina, which again helps to explain the similarity of these spectra to solution phase spectra.
B. Raman Spectrometry. Although it had been ob- served previously '° that the Raman spectrum of several of the chlorinated hydrocarbon pesticides is weak, little difficulty was encountered in this work in measuring the spectra of any of these pesticides (with the exception of Dieldrin where the Raman spectrum above 400 cm ' was weak). The feasibility of measuring the Raman spectra of pesticides on TLC adsorbents was initially studied using very high concentrations (-16% w/w) of pesticides on the adsorbent. This concentration corre- sponds to about 200 t~g/cm ~ on a typical TLC p la t e - obviously a very large amount for most TLC separa- tions. Even at these rather high sample levels, the Raman spectra of the adsorbed species were weak and in most cases required that the sensitivity of the spectrom- eter be increased to its maximum value. The reduction of the intensity of the Raman bands on adsorption was disproportionately large, since all bands in the spectra scattered considerably less than 16% of the radiation scattered by the pure materials.
The intensity of the Raman bands of the pesticide species appeared to depend on the strength of the inter- action between the sample and the adsorbent, as esti-
B \
\
C
32
2800 32C~0
2
{ 2800 $200
CM "o
/W
2800
FIG. 4. Ordinate expanded spectra of Endrin between 3200 and 2800 cm-' (A) on silica gel, (B) on alumina, (C) in CC14 solution, and (D) in a KBr disc.
450 Volume 30, Number 4, 1976
A
N
.3zoo 2800 32OO
2800 32OO CM "=
¢4
A
0
FIG. 5. Ordinate expanded spectra of Dieldrin between 3200 and 2800 cm ~ (A) on silica gel, (B) on alumina, (C) in CCI+ solution, and (Dt in a KBr disc.
3200 28C~ 3200
c
i
5200
CM'I
II I
B P!
FIG. 6. Ordinate expanded spectra of Aldrin between 3200 and 2800 cm ~ (A) on silica gel, (B) on alumina, (C) in CC14 solution, and (D) in a KBr disc.
mated by K,/, the distribution ratio of the sample be- tween hexane and the adsorbent. The K,t values for several of the pesticides on silica gel are listed in Table II. Only one or two very weak bands of DDD and DDT adsorbed on silica gel were observed, while Methoxy- chlor gave a spectrum with a slightly higher signal/ noise ratio.
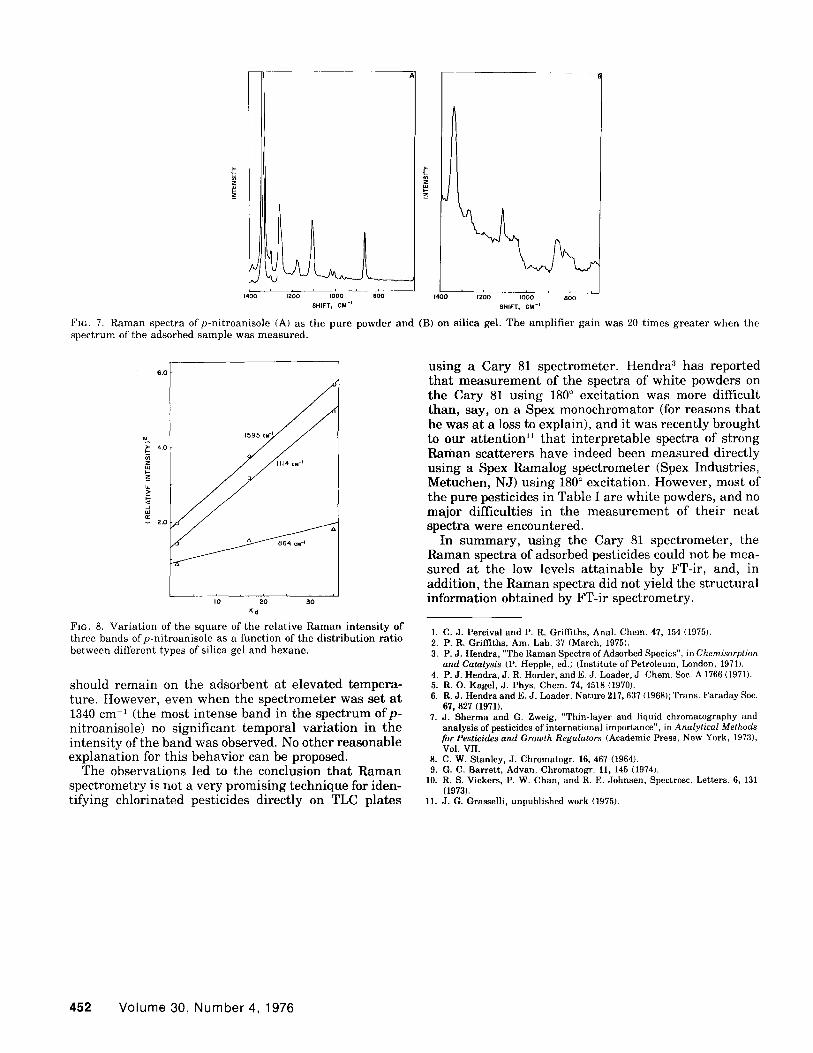
In comparing the spectra of adsorbed molecules to the spectra of the corresponding pure materials, no signifi- cant band shifts were observed but all bands in the spectra of the adsorbed species were broader than in the spectra of the pure material (Fig. 7). This observation contradicts the results of previous studies ~+ in which the width of the bands of molecules adsorbed on silica gel was reported to be less than 5 cm -1. Unlike the infrared results, the Raman bands of the pesticides adsorbed on alumina were also broad and of similar appearance to the bands of the same species adsorbed on silica gel.
Of all the pesticides studied, Methoxychlor, 1,1,1- trichloro-2,2-bis[p-methoxyphenyl]ethane, yielded the strongest Raman bands on adsorption and was also the most strongly adsorbed on silica gel. However when Methoxychlor was adsorbed on deactivated silica gel, only one or two bands were observable in the Raman spectrum. Like Methoxychlor, p-nitroanisole has a p- C(+H4OCH:+ group with an electron-withdrawing substit- uent and is strongly adsorbed on silica gel, but several bands (in particular the symmetr ic-NOr stretching mode) exhibit more intense Raman scattering than the bands of Methoxychlor. Several measurements of ad- sorbed p-nitroanisole were performed, therefore, in an attempt to determine a model for the phenomena ob- served for the pesticide spectra.
Like the spectra of the pesticides, the spectrum ofp- nitroanisole showed band broadening but no significant band shifts on adsorption. Since it has been observed that the intensity of the Raman bands appeared to depend on the strength of the interaction between the adsorbate and the adsorbent, the spectra ofp-nitroani- sol adsorbed on activated silica gel, dehydroxylated sil- ica gel, and methylated silica gel were measured. The distribution ratios ofp-nitroanisole between hexane and these adsorbents were measured at 35, 17, and 1.5, respectively.
When the square of the intensity of several bands ofp- nitroanisole was plotted against Ka for the three meas- urements, an approximately linear relation was ob- served (Fig. 8). The most likely explanation of this behavior is loss of sample through vaporization on heat- ing by the laser, since the greater the interaction be- tween the sample and the adsorbent, the more sample
TABLE II. K. values for chlorinated pesticides between silica gel and hexane.
FIG. 7. Raman spectra of p-ni t roanisole (A) as the pure powder and (B) on silica gel. The amplif ier gain was 20 t imes grea ter when the spectrum of the adsorbed sample was measured.
6.0
i 4.0
o~ 2.0
1595 CM " i
I0 20 30
Kd
Fia. 8. Variat ion of the square of the relat ive Raman intensi ty of three bands ofp-ni t roanisole as a function of the dis t r ibut ion rat io between different types of silica gel and hexane.
should remain on the adsorbent at elevated tempera- ture. However, even when the spectrometer was set at 1340 cm ~ (the most intense band in the spectrum ofp- nitroanisole) no significant temporal variation in the intensity of the band was observed. No other reasonable explanation for this behavior can be proposed.
The observations led to the conclusion that Raman spectrometry is not a very promising technique for iden- tifying chlorinated pesticides directly on TLC plates
using a Cary 81 spectrometer. Hendra :~ has reported that measurement of the spectra of white powders on the Cary 81 using 180 ° excitation was more difficult than, say, on a Spex monochromator (for reasons that he was at a loss to explain), and it was recently brought to our attention ~ that interpretable spectra of strong Raman scatterers have indeed been measured directly using a Spex Ramalog spectrometer (Spex Industries, Metuchen, NJ) using 180 ° excitation. However, most of the pure pesticides in Table I are white powders, and no major difficulties in the measurement of their neat spectra were encountered.
In summary, using the Cary 81 spectrometer, the Raman spectra of adsorbed pesticides could not be mea- sured at the low levels attainable by FT-ir, and, in addition, the Raman spectra did not yield the structural information obtained by FT-ir spectrometry.
1. C. J. Percival and P. R. Griffiths, Anal. Chem. 47, 154 (1975). 2. P. R. Griffiths, Am. Lab. 37 (March, 1975). 3. P.J. Hendra, "The Raman Spectra of Adsorbed Species", in Chemisorption
and Catalysis (P. Hepple, ed.) (Institute of Petroleum, London, 1971). 4. P.J. Hendra, J. R. Horder, and E. J. Loader, J. Chem. Soc. A 1766 (1971). 5. R. O. Kagel, J. Phys. Chem. 74, 4518 (1970). 6. R.J. Hendra and E. J. Loader, Nature 217, 637 (1968); Trans. Faraday Soc.
67, 827 (1971). 7. J. Sherma and G. Zweig, "Thin-layer and liquid chromatography and
analysis of pesticides of international importance", in Analytical Methods for Pesticides and Growth Regulators (Academic Press, New York, 1973), Vol. VII.
8. C. W. Stanley, J. Chromatogr. 16, 467 (1964). 9. G. C. Barrett, Advan. Chromatogr. 11, 145 (1974).
10. R. S. Vickers, P. W. Chan, and R. E. Johnsen, Spectrosc. Letters. 6, 131 (1973).