Vibrational Spectroscopy for Pharmaceutical Analysis. Part VI. Interpretation of Infrared Spectra & Applications Rodolfo J. Romañach, Ph.D. Interpretation of Mid-IR Spectra. - PowerPoint PPT Presentation
18
10/11/2005 1 ENGINEERING RESEARCH CENTER FOR STRUCTURED ORGANIC PARTICULATE SYSTEMS RUTGERS UNIVERSITY PURDUE UNIVERSITY NEW JERSEY INSTITUTE OF TECHNOLOGY UNIVERSITY OF PUERTO RICO AT MAYAGÜEZ Vibrational Spectroscopy Vibrational Spectroscopy for Pharmaceutical Analysis for Pharmaceutical Analysis Part VI. Interpretation of Infrared Spectra & Applications Rodolfo J. Romañach, Ph.D.
Transcript
10/11/2005
1
ENGINEERING RESEARCH CENTER FOR
STRUCTURED ORGANIC PARTICULATE SYSTEMS
RUTGERS UNIVERSITYPURDUE UNIVERSITYNEW JERSEY INSTITUTE OF TECHNOLOGYUNIVERSITY OF PUERTO RICO AT MAYAGÜEZ
Vibrational Spectroscopy for Vibrational Spectroscopy for Pharmaceutical Analysis Pharmaceutical Analysis
Part VI. Interpretation of Infrared Spectra & Applications
Rodolfo J. Romañach, Ph.D.
2
Interpretation of Mid-IR SpectraInterpretation of Mid-IR Spectra
• Mid-IR spectroscopy is a powerful tool for chemists that want to determine the structure of a process impurity or degradation product.
3
Dividing LineDividing Line
1500 cm-1 dividing line: above 1500 cm-1 if a band has a reasonable intensity, it is a group frequency.
Below 1500 cm-1 the band may be either a group or fingerprint frequency.
Below 1500 cm-1 called the fingerprint region.
4
Group FrequenciesGroup Frequencies
Characteristic of functional groups such as -O-H, -CH3, -COCH3, and COOH.
Determined empirically by studying the spectra of many related molecules.
Always found in the spectrum of a molecule containing that group, and always occurs in the same narrow frequency range.
The form of the bands is nearly always the same in every molecule containing that group.
5
Fingerprint FrequenciesFingerprint Frequencies
Highly Characteristic of the Specific Molecule. Due to Vibrations of the Molecule as a whole. The numerical values cannot be predicted in most
cases. Valuable in characterizing a molecule. Fingerprint region is useful for discriminating
between molecules that resemble each other.
6
Group FrequenciesGroup Frequencies
O-H Stretch – Position is Highly Dependent on Hydrogen Bonding.
Intense – Easy to Identify. Carboxylic Acids – Very broad and strong, form
dimers. This band will grow in intensity if you have a
This stretching will be observed for ethers, alcohols, esters, anhydrides, and carboxylic acids.
Present in carbohydrates (lactose, microcrystalline cellulose, mannitol are commonly used in pharmaceutical processing.
Very intense bands in 1000 – 1250 cm-1 region which are subject to erratic shifts from small structural changes.
10
Carbohydrate Spectrum.
11
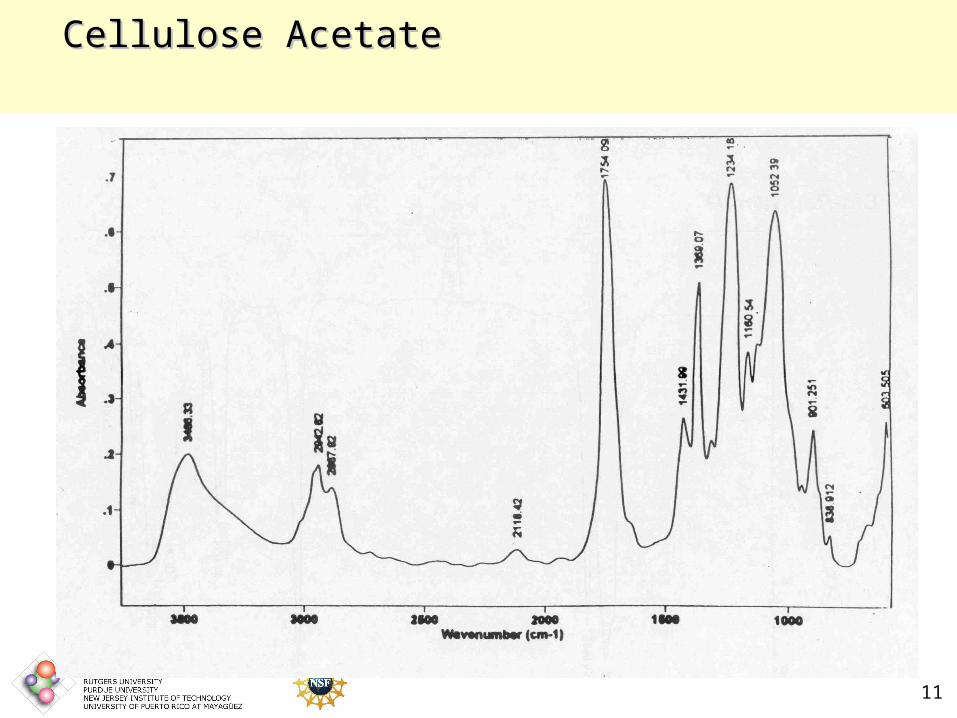
Cellulose AcetateCellulose Acetate
12
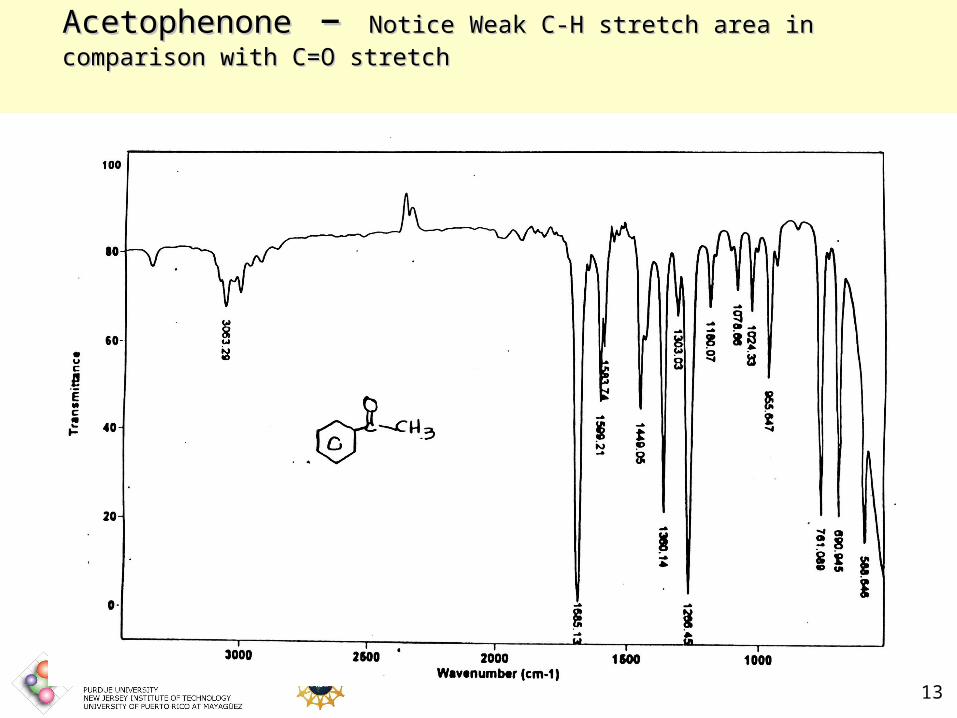
C=O Stretch C=O Stretch
Provides a very strong signal and is found in many organic molecules.
It occurs in a region of the spectrum where few other functional groups are observed.
Range of carbonyl frequencies is from 1750 ± 200 cm-1. The changes in frequency have been thoroughly studied and provide significant structural information.
13
AcetophenoAcetophenonene – – Notice Weak C-H stretch area in comparison with Notice Weak C-H stretch area in comparison with C=O stretchC=O stretch
14
Corn OilCorn Oil
15
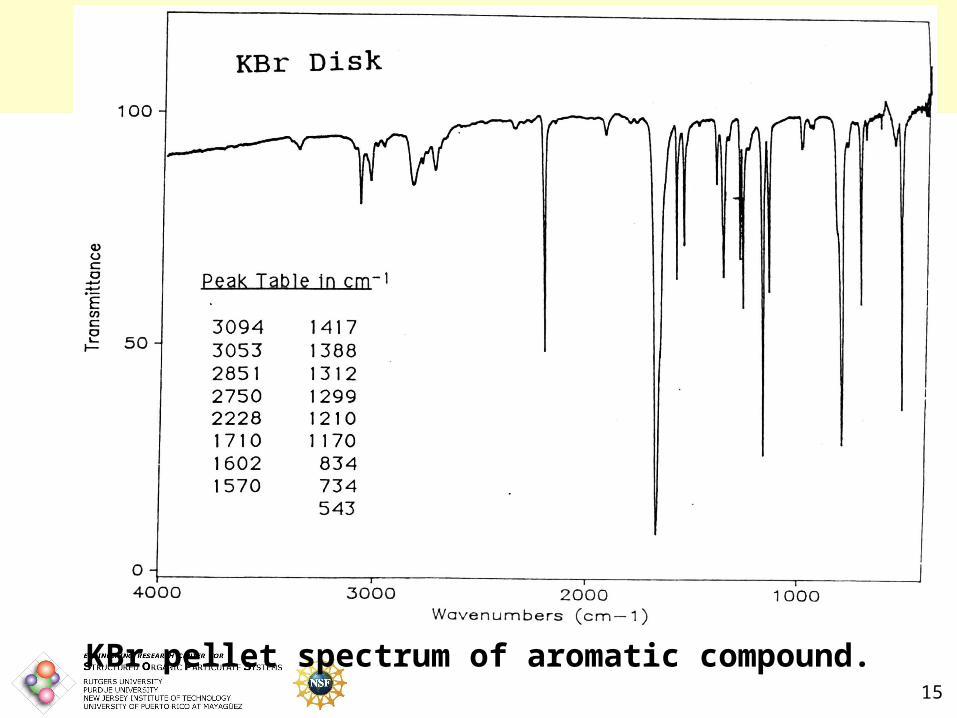
KBr pellet spectrum of aromatic compound.
16KBr pellet spectra.
17
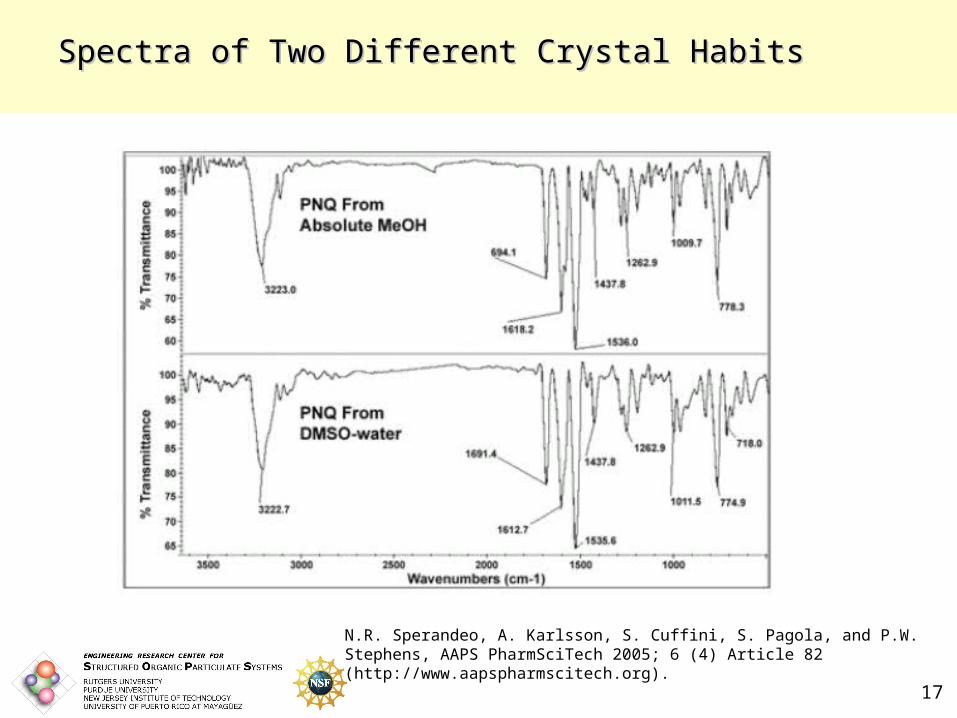
Spectra of Two Different Crystal HabitsSpectra of Two Different Crystal Habits
N.R. Sperandeo, A. Karlsson, S. Cuffini, S. Pagola, and P.W. Stephens, AAPS PharmSciTech 2005; 6 (4) Article 82 (http://www.aapspharmscitech.org).
18
Information from PNQ SpectraInformation from PNQ Spectra
• Spectra are very similar, indicating same compound.
• O-H and N-H were free (not involved in hydrogen bonding) then absorbances near 3500 cm-1 would be observed.
• The fact that N-H and O-H are near 3200 cm-1 is indicative that they are involved in hydrogen bonding.