APPROVED: Michael Beyerlein, Major Professor and Chair Douglas Johnson, Committee Member and Coordinator of the Program in Industrial/Organizational Psychology Terry Halfhill, Committee Member Ernest H. Harrell, Chair of the Department of Psychology C. Neal Tate, Dean of the Robert B. Toulouse School of Graduate Studies VICARIOUS LEARNING: THE RELATIONSHIP BETWEEN PERCEIVED LEADER BEHAVIOR AND WORK GROUP MEMBER BEHAVIOR Diem Brown, B.S. Thesis Prepared for the Degree of MASTER OF SCIENCE UNIVERSITY OF NORTH TEXAS December 2002
Transcript
APPROVED: Michael Beyerlein, Major Professor and Chair Douglas Johnson, Committee Member and Coordinator of
the Program in Industrial/Organizational Psychology Terry Halfhill, Committee Member Ernest H. Harrell, Chair of the Department of Psychology C. Neal Tate, Dean of the Robert B. Toulouse School of
Graduate Studies
VICARIOUS LEARNING: THE RELATIONSHIP BETWEEN PERCEIVED
LEADER BEHAVIOR AND WORK GROUP MEMBER BEHAVIOR
Diem Brown, B.S.
Thesis Prepared for the Degree of
MASTER OF SCIENCE
UNIVERSITY OF NORTH TEXAS
December 2002
Brown, Diem, Vicarious Learning: The Relationship Between Perceived Leader
Behavior and Work Group Member Behavior. Master of Science (Industrial Psychology),
December 2002, 77 pp., 26 tables, references, 26 titles.
The relationship between perceived leader behavior and work group behavior was
examined. Archival survey data was used in the analyses. The company that developed
the survey randomly selected 595 employees to complete the survey. Results suggest
there is a strong and significant relationship between leader and subordinate behavior.
Group members who report that their leader demonstrates a particular behavior also
report that their work group demonstrates the same or similar behavior, suggesting that
subordinates may be modeling the behavior of their leader. Leadership behaviors related
to trust, availability, respect, conflict, and support seem to be the best predictors of work
group behavior. Furthermore, whether or not group members have received team training
appears to have an effect on their perceptions of their leader and work group. The
challenge for leaders is to understand modeling principles so that they can facilitate the
modeling of functional rather than dysfunctional behaviors.
ii
Copyright 2002
by
Diem Brown
iii
ACKNOWLEDGMENTS
The survey on which this research is based was created with the help of several
members of a steering team. This work was made possible through their efforts and that
of past and present steering team members, and through the guidance of Dr. Michael
Beyerlein, Ph.D, from the Center for the Study of Work Teams at the University of North
Texas. I would also like to thank Eric Simpson, former associate of The Center for the
Study of Work Teams, for all of the work he put into leading the development of the
survey and managing the data collection process.
iv
TABLE OF CONTENTS
Page
ACKNOWLEDGMENTS ................................................................................................ iii LIST OF TABLES ............................................................................................................ v Chapter
Defining Leadership Theories on Human Behavior Theories on Organizational Behavior Organizational Behavior Modeling Relationships Between Leadership and Work Group Behavior Research Hypotheses
Table Page 1. Correspondence of Different Leadership Concepts ....................................................... 6 2. Item Total Statistics for Work Group Behavior Scale .................................................... 27 3. Item Total Statistics for Leadership Behavior Scale ....................................................... 28 4. Results of Factor Analysis for Work Group Behavior Items........................................... 29 5. Results of Factor Analysis for Leadership Behavior Items.............................................. 30 6. Descriptive Statistics for Work Group Behavior (RWT) and Leadership Behavior
(RL) Scales and Items.................................................................................................. 35 7. Descriptive Statistics for Work Group Behavior (RWT) and Leadership Behavior
(RL) Scales and Items for Group Members Who Have Received Team Training ........... 36 8. Descriptive Statistics for Work Group Behavior (RWT) and Leadership Behavior
(RL) Scales and Items for Group Members Who Have Not Received Training.............. 37 9. Descriptive Statistics for Work Group Behavior (RWT) and Leadership Behavior
(RL) Scales and Items for Production Workers Only .................................................... 38 10. Descriptive Statistics for Work Group Behavior (RWT) and Leadership Behavior
(RL) Scales and Items for Production Workers Who Have Received Training............... 39 11. Descriptive Statistics for Work Group Behavior (RWT) and Leadership Behavior
(RL) Scales and Items for Production Workers Who Have Not Received Training........ 40 12. Descriptive Statistics for Work Group Behavior (RWT) and Leadership Behavior
(RL) Scales and Items for Management and Support Workers Only.............................. 41 13. Descriptive Statistics for Work Group Behavior (RWT) and Leadership Behavior
(RL) Scales and Items for Management and Support Workers Who Have Received Training........................................................................................................................ 42
14. Descriptive Statistics for Work Group Behavior (RWT) and Leadership Behavior
(RL) Scales and Items for Management and Support Workers Who Have Not Received Training......................................................................................................... 43
vi
15. Inter-Item Correlations for Work Group Behavior Scale(RWTScale)............................ 44 16. Inter-Item Correlations for Leadership Behavior Scale (RLScale).................................. 45 17. Correlations Between Work Group and Leadership Behavior Scales and Items............. 47 18. Correlations Between Work Group and Leadership Behavior Scales by Job Title .......... 48 19. Overall Correlations Between the Leadership Behavior and Work Group Behavior
Items .......................................................................................................................... 51 20. Correlations Between Leadership Behavior and Work Group Behavior Items for
Production Workers Only ............................................................................................ 51 21. Overall Bivariate and Partial Correlations of the Predictors with the Work Group
Behavior Scale............................................................................................................. 53 22. Overall Bivariate and Partial Correlations of the Predictors with the Work Group
Behavior Scale for Group Members Who Have Received Team Training ...................... 54 23. Overall Bivariate and Partial Correlations of the Predictors with the Work Group
Behavior Scale for Group Members Who Have Not Received Team Training ............... 55 24. Bivariate and Partial Correlations of the Predictors with the Work Group Behavior
Scale for Production Workers Only.............................................................................. 56 25. Bivariate and Partial Correlations of the Predictors with the Work Group Behavior
Scale for Production Workers Who Have Not Received Team Training........................ 57 26. Summary of Predictors By Group and Training History................................................. 58
1
CHAPTER 1
INTRODUCTION: LEADERSHIP CONCEPTS
For decades, researchers have been studying leadership behavior in terms of its
effects on individuals and organizations. In the workplace, leadership has been judged to
be important because of its assumed and demonstrated connection to organizational
effectiveness. Specifically, the relationship between leader behavior or traits and
subordinate satisfaction, performance, and behavior has been the focus of much of the
literature. Many studies have tried to identify characteristics that would make a leader
more effective, while others have chosen to investigate the effects of those attributes that
are considered undesirable for leadership. In this paper, the primary concern is with the
relationship between a leader’s behavior and the behavior of his or her work group.
Defining Leadership
According to Bowers and Seashore (1966), leadership is essentially a collection of
behaviors that can be classified in a number of ways. They describe it as
“organizationally useful behavior by one member of an organizational family toward
another member or members of that same organizational family” (p. 240). In 1957,
Hemphill and Coons conducted a factor analysis of 11 leadership behavior dimensions,
nine of which were taken from the dimensions used in the Leader Behavior Description
Questionnaire (? J. Hemphill and A. Coons, Bureau of Business Research, College of
Commerce and Administration, The Ohio State University, Columbus, OH). Based upon
2
data from a sample composed largely of educational groups, they obtained three
orthogonal factors:
1. Maintenance of membership character -- behavior by a leader which allow him to be
seen as socially agreeable to his work group.
2. Objective Attainment Behavior -- behavior related to the productivity of the group,
such as setting group goals and objectives.
3. Group interaction facilitation behavior -- behavior that encourages communication
among group members, reduction of conflicts, and a positive group atmosphere
With data collected from air-force crews, subsequent studies on the dimensions in the
Leader Behavior Description Questionnaire yielded four orthogonal factors:
1. Consideration -- behavior associated with friendship, mutual trust, respect, and
warmth.
2. Initiating Structure -- behavior that organizes and defines relationships, roles,
channels of communication, and ways of getting jobs done.
3. Production emphasis -- behavior that motivates the group by emphasizing the mission
or job to be done.
4. Sensitivity (social awareness) -- behavior that demonstrates a sensitivity and
awareness of social interrelationships and pressures inside or outside the group.
Researchers eventually dropped the third and fourth factors because they accounted for
too little variance. Thus, consideration and initiating structure became more widely
known and used. Some refer to these concepts as the Ohio State leadership dimensions
(Bowers and Seashore, 1966, p.242). There is evidence to show that managers do
demonstrate behaviors associated with these dimensions. Brown and Dalton (1980), for
3
instance, found that business managers use consideration and initiating structure as
leadership styles concurrently.
Studies conducted at the University of Michigan Survey Research Center focused
on identifying leadership behaviors that correlated with each other and with effectiveness
criteria. Researchers discovered two elements of leadership, which they labeled
employee orientation and production orientation. Employee orientation is described as
behavior by a supervisor that indicates he takes an interest in his group members, takes an
interest in their personal needs, and feels interpersonal relationships are an important
aspect of the job. Production orientation, on the other hand, has to do with behaviors that
emphasize the production and technical aspects of a job. This dimension, in particular,
corresponds with the Ohio State dimensions of initiating structure and production
emphasis (Bowers & Seashore, 1966, p. 242).
According to Bowers and Seashore (1966), Katz and Kahn, based upon the
Research Center findings and additional studies, presented their model of leadership,
which consists of four dimensions:
1. Differentiation of supervisory role -- behavior that is considered truly supervisory in
nature, as opposed to spending time doing paperwork and performing the work of the
manager’s subordinates.
2. Closeness of supervision -- behavior related to the delegation of authority, such as
checking on subordinates and giving them instructions less frequently, and allowing
them to perform their work in their own way, at their own pace.
4
3. Employee orientation -- behavior that creates supportive relationships and indicates a
personal interest in employees, such as being more understanding, less punishing, and
willing to help mentor employees.
4. Group relationships -- behavior that creates cohesiveness, pride by subordinates in
their work group, a feeling of membership in the group, and mutual help on the part
of those subordinates.
Following these studies and building upon their findings, Floyd Mann (1965)
proposed that leadership consists of three necessary skills rather than behaviors. The first
is human relations skills. This is the ability to work with people, including knowledge of
the principles of human behavior, interpersonal relations, and human motivation. The
second is technical skills, which Mann defines as the ability to use technical knowledge,
techniques, and equipment to perform the necessary tasks. The third and final
competency is administrative skills. This is the ability to plan, organize, coordinate,
assign, and inspect work. According to Bowers and Seashore (1966), skills and
behaviors requiring a particular set of skills, although not perfectly aligned, can still be
considered as corresponding with each other.
Similar to the University of Michigan’s employee orientation and production
orientation concepts, Cartwright and Zander (1960), on the basis of studies conducted at
the Research Center for Group Dynamics, describe leadership in terms of only two
functions:
1. Goal achievement functions -- behavior associated with helping members stay
focused on the goal.
5
2. Group maintenance functions -- behavior that sustains positive interpersonal
relationships, resolves conflict, and promotes interdependence among group members
(Bowers & Seashore, 1966).
According to Bowers and Seashore (1966), these dimensions appear to encompass a
broad range of behaviors. For instance, goal achievement functions include behaviors
associated with dimensions previously mentioned, such as initiating structure, production
emphasis, objective attainment behavior, and production orientation. Group maintenance
functions include behaviors related to the dimensions of consideration, maintenance of
membership character, and employee orientation.
There seems to be a great deal of overlap in how researchers have conceptually
defined leadership. Bowers and Seashore (1966) have attempted to integrate the findings
from various studies in order to develop a basic set of behaviors to characterize
leadership. They contend that leadership is essentially comprised of four major
dimensions:
1. Support -- behavior that increases someone else’s feeling of personal worth and
importance.
2. Interaction facilitation -- behavior that promotes members of the group to develop
close, mutually satisfying relationships.
3. Goal emphasis -- behavior that encourages enthusiasm for meeting the group’s goal
or achieving excellent performance.
4. Work facilitation -- behavior that helps achieve goals through such activities as
scheduling, coordinating, planning, and by providing resources such as tools,
materials, and technical knowledge.
6
Table 1
Correspondence of Different Leadership Concepts
Bowers and Seashore
Hemphill and Coons
Halpin and Winer
Katz et al. Katz and Kahn
Cartwright and Zander
Employee orientation
Support Maintaining membership character
Consid-eration
Employee orientation
Closeness of supervision
Interaction Facilitation
Group facilitation behavior
Sensitivity
Group maintenance functions
Goal Emphasis
Production emphasis
Group relationship
Differen-tiation of supervisory role
Work Facilitation
Objective attainment behavior
Initiating structure
Production orientation
Closeness of supervision
Goal achievement functions
Note. Adapted from “Predicting Organizational Effectiveness with a Four-Factor Theory of Leadership,” by D.G. Bowers and S.E. Seashore, 1966, Administrative Science Quarterly, 11(2), p.248.
7
Bowers and Seashore (1966) compared their dimensions to every one of the
dimensions discussed earlier. According to the researchers, each of their four dimensions
appears in all but one of the frameworks previously mentioned, as shown in Table 1.
Leadership has been conceptualized as consisting of categories of behaviors like the ones
discussed thus far. Bowers and Seashore (1966) contend that these behaviors must be
present in order for a group to be effective. They may be provided by a formally
designated leader, by members of the group, or by both. However, the researchers
believe that a formally designated leader, through his or her leadership behavior, acts as a
role model for subordinates. Subordinates, in turn, will supply each other with mutual
leadership.
Theories on Human Behavior
There are a number of theories that attempt to explain human behavior in
organizations. These theories are based upon concepts such as motivation, satisfaction,
leadership, and learning. Social exchange theory, for instance, tries to explain behavior
in terms of motivation. The basic principle is that individuals are motivated by a desire
to increase rewards and reduce losses. Hence, exchanges must occur between the
supervisor and subordinate that produces mutually beneficial results. For example, in the
workplace, the supervisor provides a subordinate with support and monetary rewards
while in exchange, the subordinate contributes expertise and devotion to the work.
Supervisor-subordinate relationships providing more rewards than costs will produce
lasting mutual trust and attraction (Deluga, 1994).
Leader-member exchange (LMX) theory can also be understood in terms of social
exchanges. This theory asserts that supervisors treat individual subordinates differently.
8
Consequently, some individuals have higher-quality exchanges with their supervisor,
while others have lower-quality exchanges. LMX has been found to be positively
correlated with job satisfaction, satisfaction with the supervisor, and stronger
organizational commitment. Higher-quality exchanges are characterized by mutual trust
and support, interpersonal attraction, friendly working relationships, and loyalty. Higher-
quality exchange subordinates receive rewards such as favorable performance appraisals,
promotions, and greater job responsibilities (Liden & Graen, 1980). In return,
supervisors receive committed and conscientious subordinates. Subordinates with lower
quality exchanges receive less leader attention, support, consideration, and
communication, and suffer more work problems. They also receive less challenging
assignments, get fewer promotions, and experience slower career progress that high LMX
employees (Townsend, Phillips, & Elkins, 2000). Because of the obvious advantages,
higher-quality exchanges are likely to arouse feelings of unfairness among lower-quality
exchange subordinates (Deluga, 1994).
Measurement of leader-member exchange relationships has generally been from
the subordinate’s perspective. Studies comparing the perspective of the leader with that
of the subordinate reveal moderate to low agreement. Agreement between leaders and
subordinates on mutually experienced events varied as a function of LMX quality.
Specifically, agreement with leaders was stronger for members reporting higher LMX.
Although subordinate LMX perceptions are correlated with leader performance ratings,
the relationship is not as strong as the correlation between leader LMX and performance
ratings (Gerstner & Day, 1997). Some researchers suggest that a leader’s higher
expectations of a subordinate would result in higher performance. According to Gerstner
9
and Day (1997), leaders may change the actual performance levels of employees by
creating positive or negative expectations about an employee through the development of
LMX relationships (i.e., self-fulfilling prophecies). When a leader delegates authority
and responsibility to a subordinate, the subordinate will likely value this behavior
because it demonstrates the leader’s trust in that subordinate. When the subordinate
perceives the leader’s trust to be high, his or her attitudes will become more positive and
his or her sense of obligation to the leader will increase. In addition, the subordinate will
be more satisfied, committed, and likely to engage in behaviors that go beyond their job
requirements (Brower, Schoorman, & Tan, 2000). These behaviors are referred to as
“citizenship behaviors,” and will be discussed further in the following sections.
Equity theory explains organizational behavior as a consequence of satisfaction.
This theory maintains that subordinates are most satisfied when the ratio between benefits
received and their contributions is similar, compared to that of their coworkers. If
unfairness is believed to exist, equity theory anticipates subordinates will respond by
reducing their contributions or expect additional rewards to eliminate the inequities
(Deluga, 1994). This theory is consistent with research suggesting that employees with
poor LMX relationships may retaliate by engaging in negative behaviors, especially when
they are aware that their leader’s treatment of them is worse than that of their peers.
Examples of negative behaviors may include taking excessively long or undeserved
breaks, calling in sick when healthy, and damaging equipment or work processes
(Townsend, Phillips, & Elkins, 2000). Subordinates rather than supervisors may be more
likely to engage in retaliatory behavior because poor exchange relationships can affect
their status in the organization. On the other hand, high LMX employees will tend to
10
reciprocate for benefits they receive at work. In an attempt to reduce feelings of
imbalance for example, rewarded employees my increase attendance, improve
performance, and engage in citizenship behaviors. Research on LMX also indicates that
subordinates with high LMX perceive their organization as more supportive than those
with low LMX. Subordinates who view their organization as more supportive are also
more likely to exhibit safety-conscious behaviors (Townsend et al., 2000).
Social exchange, leader-member exchange, and equity theory all have leader
reward behavior as a key component of their model. Past research does provide evidence
of a relationship between supervisor reward behavior and subordinate behavior. A
significant amount of research indicates rewards such as recognition, social support, and
merit increases are positively related to subordinate performance (Sims and Szilagyi,
1975; Williams and Podsakoff, 1992). In addition, Podsakoff and Todor (1985) found
that work group cohesiveness increases when leaders reward productivity. Group
cohesiveness has been defined as ‘the resultant of all the forces acting on members to
remain in the group’ (Dobbins & Zaccaro, 1986). Highly cohesive groups tend to have
characteristics such as less conflict, higher member trust, and better group interaction
(Dobbins & Zaccaro, 1986). A cohesive work team seems to be more loyal to the
organization and has more enthusiasm and drive toward work (Putti, 1985).
Past research has also focused on behaviors that are not associated with rewards.
These behaviors are referred to as organizational citizenship behaviors (OCBs). As
mentioned previously, OCBs exist when the subordinate, of his or her own accord, goes
beyond the stated job requirements and performs non-mandatory behaviors without the
expectation of receiving explicit recognition or compensation. OCBs have been linked
11
with organizational effectiveness, job satisfaction, trust in and loyalty to the leader, and
perceptions of supervisor fairness. Deluga (1994) found data to support the idea that
fairness is the supervisor behavior most closely associate with the organizational
citizenship behaviors of conscientiousness, sportsmanship, courtesy, and altruism. Thus,
utilizing principles of equity theory, one can argue that subordinates who receive fair
treatment may go beyond formal job requirements and voluntarily perform acts which
benefit the organization. According to Deluga (1994), organizational citizenship
behaviors are essential for peak productivity since organizations cannot predict the entire
range of subordinate behaviors needed for achieving goals. Thus, identifying supervisor
behaviors that induce OCB is essential.
Theories on Organizational Behavior
Theoretical frameworks for organizational behavior have been summarized into
three major approaches. One approach explains organizational behavior as a function of
the person. Specifically, “internal psychological constructs such as motivation,
perception, attitudes, expectancies, and personality characteristics are used to explain
why people behave the way they do” (Davis & Luthans, 1980, p. 281). A second
approach takes the opposite view, and explains behavior as a function of the
environment. Most closely associated with theory of operant conditioning, this approach
claims that all behavior is controlled by environmental consequences. The third major
theory of organizational behavior combines both approaches and asserts that behavior is a
function of the person and the environment. However, there is a fourth explanation for
human behavior that has generally gone unnoticed by organizational behavior
researchers. Social learning theory, as it is called, is a behavioral model derived from a
12
combination of several organizational behavior theories and theories unique to social
learning.
According to Davis and Luthans (1980), existing frameworks provide only a
partial explanation of organizational behavior. In their opinion, social learning theory
seems to best fill some of these deficiencies because it is able to integrate all the variables
of organizational behavior – the behavior itself, the environment, and the person. Social
learning theory asserts that the person and the environment determine each other in a
reciprocal manner, rather than functioning as independent units. Through their actions,
people produce the environmental conditions that affect their behavior. The
environmental conditions created by behavior also partly determine what a person
becomes and can do, which affects subsequent behavior (Davis and Luthans, 1980).
Therefore, organizational behavior is seen as affecting and being affected by the person,
the environment, and the interaction of all three organizational behavior variables.
One way to better understand social learning theory is to distinguish it from B.F.
Skinner’s more established theory of operant conditioning. The two theories are similar
in that both derive learning from the consequences of behavior. In other words, the
person learns from the consequences that a certain behavior has on the environment.
However, the theories are different on the basis of three major elements. The first
element pertains to the effects of cognitive processes. Operant theory sees a person as
‘operating’ on the environment, but that behavior is controlled by environmental
consequences. Social learning theory however, views each person as responding not only
to the environment but also to a cognitive representation of the environment. This
suggests that an individual’s interpretation of the environment may be different from
13
another individual’s interpretation of the same environment. In addition, people can
create consequences entirely through their own imagination, which allow them to think
through possible courses of action and imagine the consequences without having to
experience them directly (Davis and Luthans, 1980).
The second major difference between social and operant theory involves the part
played by self-control processes. Operant theory places almost total control of behavior
on the environment. Social learning theory, on the other hand, emphasizes self-control.
Davis and Luthans (1980) explain their interpretation of self-control processes as follows:
A given action typically produces two outcomes – an external
environmental consequence and an internal self-evaluative consequence.
In other words, people are affected not only by the external consequences
of their behavior but also by the consequences they create for
themselves…this suggests that people learn to modify their behavior when
their own self-created consequences or standards are not fulfilled. The
self-reinforcement consequence is particularly important to virtually all
sustained goal-oriented behavior and explains how behavior persists
despite the lack of immediately compelling external support (p. 286).
Bandura (1976) provides an example of self-controlling processes by explaining that
authors do not need someone sitting at their sides, reinforcing each written statement until
an acceptable version is produced. Rather, authors possess a standard of what constitutes
acceptable work and they repeatedly self-edit their own work.
The third element that distinguishes social learning theory from operant
conditioning theory is the role of vicarious processes (i.e., modeling). Operant theory, as
14
it applies to organizations, contends that work behavior is a function of its consequences.
In other words, people are more likely to increase the frequency of behavior that has
resulted in positive consequences. Likewise, people will tend to decrease the frequency
of behavior that has resulted in negative consequences (Manz & Sims, 1981). Although
social learning theory agrees with the operant view that learning takes place as a result of
experiencing the consequences of one’s behavior, it also emphasizes that learning can
take place by observing the consequences of someone else’s behavior. This is called
‘antecedent learning’ because it occurs before the behavior (Manz & Sims, 1981, p. 105).
Vicarious learning, or modeling is an example of antecedent learning. According to
Bandura (1976), most of the behaviors that people exhibit are learned either intentionally
or inadvertently, through the influence of example. Thus, direct experience of the
consequences of behavior is not needed in order for learning to take place. Learning by
observing others allows people to avoid making costly errors (Manz & Sims, 1981).
A substantial amount of research has shown that people quickly duplicate the
actions, attitudes, and emotional responses exhibited by models (Davis & Luthans, 1980).
According to Kahn and Cangemi (1979), the majority of socially desirable behavior is
learned through imitation or modeling others such as parents and teachers. “Vicarious,
imitative learning seems to better explain the rapid transference of behavior than does the
tedious selective reinforcement of each discriminable response” (Davis and Luthans,
1980, p. 283). Therefore, operant learning theory is correct, but incomplete in its
explanation of organizational behavior. Social learning theory presents a more
comprehensive view of learning by taking into account learning through observation or
modeling the behavior of others.
15
There are generally three types of learning associated with modeling. The first
type, which has already been discussed, is learning by observing a model. The second
type has to do with inhibitory and disinhibitory effects associated with observing the
consequences of a model’s behavior. If the model’s behavior is punished, then the
observer is likely to be inhibited. If the model’s behavior is reinforced, then the observer
is likely to be disinhibited (Manz & Sims, 1981, p. 106). Essentially, individuals are less
likely to model the behavior if they believe there will be a negative effect than if they
anticipate a positive outcome (Robinson & O’Leary-Kelly, 1996). The third type of
learning is called a behavioral facilitation effect. This effect occurs when a model acts as
a cue for the observer to begin a previously learned behavior (Manz & Sims, 1981). For
example, in a courtroom, everyone is expected to stand when the judge enters the room.
When the judge sits down, this action acts as a cue for everyone in the courtroom to sit as
well. Thus, the observers have modeled or imitated the behavior of sitting down.
According to Manz and Sims (1981), one view of how models influence
observers’ behavior is by influencing their expectations. There are two kinds of
expectations thought to be susceptible to influence. The first is self-efficacy
expectations, which is defined as the belief that one can successfully carry out the
behavior required to produce the outcomes (Manz & Sims, 1981). The greater the
perception of self-efficacy, the more effort an individual will put into the task. The
second type of expectation is called outcome expectations. In this instance, the belief is
that by observing the consequences of a model’s behavior, the observer forms
expectations of outcomes. In other words, the observer expects to achieve the same
outcome as the model if he or she were to perform the same behavior as the model.
16
However, characteristics of the model and the observer can influence whether or
not the behavior is imitated. Models who possess interpersonal attraction are sought out
and those who do not are generally rejected or ignored (Manz & Sims, 1981). Therefore,
it is possible that models who are perceived to be successful exert greater influence than
those who are not seen as successful. Some argue that modeling-based training programs
will be more successful if the models are of high status and competence (Manz & Sims,
1981). A study by Weiss (1977) lends some credence to this assertion. Weiss found that
subordinates showed greater similarity in behavior to superiors who were believed to be
competent and successful.
The way a model carries out a task can also affect how much influence the
modeled behavior has on the observer. Models who display no apprehension or difficulty
in completing a task are less effective than those who do show apprehension and
difficulty. One explanation for this finding is that an observer can more readily identify
with a model who struggles and overcomes difficulties than one who has no problems.
Thus, to the observer, an individual perceived to have greater abilities might not be an
ideal person to emulate (Manz & Sims, 1981).
Characteristics of the observer can also act as a moderator in the modeling
process. If the observer does not value the rewards received by the model, then the
modeled behavior is less likely to be adopted (Weiss, 1977). In addition, Brown and
Inouye (1978) suggest that observers exposed to models unsuccessful in completing a
task may be less likely to perform the task at a later time. By observing the model’s
failure, the observer may lower his self-efficacy expectations. According to Manz and
17
Sims (1981), researchers believe that individual characteristics such as self-esteem, self-
expectations, and personal fears can influence vicarious learning.
Organizational Behavior Modeling
There is a substantial amount of research on the topic of behavior modeling; yet,
very little of it has focused on modeling within organizations. Still, some researchers
contend that modeling does occur in the workplace. Robinson and O’Leary-Kelly (1996)
found that the presence of aggressive workplace models is associated with a higher
degree of individual aggressive behavior. In addition, the findings of Haunschild and
Miner (1997) indicate organizations model the practices of other organizations. The
researchers refer to this practice as “interorganizational imitation” (p. 472). However,
the area of subordinate modeling of leader or supervisor behavior has not been studied at
length. Manz and Sims (1981) believe the implications to managers and their
organizations are great because modeling is a process whereby undesirable as well as
desirable behaviors can be learned. Modeling can occur on a daily basis through the day-
to-day relationships between managers and subordinates, even if the parties are unaware
of it (Manz & Sims, 1991). In addition, evidence does indicate employees are more
likely to model the behavior of a manager than a co-worker because of the status,
experience, and prestige of those with managerial positions (Manz & Sims, 1981).
Relationships Between Leadership and Work Group Behavior
There is some evidence that demonstrates the relationships between leadership
behavior variables and group behavior variables are strong and significant. According to
Putti (1985), correlations between leader and group behavior variables suggest that
leadership variables seem to influence group variables such as cohesiveness, loyalty, and
18
drive in a positive way. His study also indicates that certain leadership variables are
better predictors of group variables than others. Particularly, the ability of the leader to
coordinate the activities of the group and make them work as a team is strongly related to
group cohesiveness, productivity, drive, and loyalty. To be more specific, results reveal
that loyalty and drive variables of work improvement teams demand the ability of the
leader to reconcile conflicts and restore order (interaction facilitation behavior). Group
cohesiveness also requires the leader to demonstrate interaction facilitation behavior, as
well as consideration behavior. Putti (1985) asserts that a leader needs to exhibit
production emphasis and interaction facilitation behaviors in order to affect group
productivity. In terms of how work group members define leadership, Putti’s (1985)
findings reveal that work improvement teams describe a leader as one who shows
concern for the welfare of the team members (consideration); one who has the ability to
coordinate the activities of the group (work facilitation); keeps the members working as a
team (interaction facilitation); and actively exercises the leadership role (differentiation
of supervisory role).
In a study of leadership and subordinate characteristics, Bowers and Seashore
(1966) found there is a strong and significant relationship between a manager’s behavior
and that of his subordinates. Their findings also reveal that in regards to leadership
characteristics, the best predictor of group member leadership behavior is managerial
leadership behavior. They suggest that if a manager wants to increase the degree to
which his subordinates support one another, he must also increase his support. If he
wants to increase subordinate emphasis on goals, he must increase his interaction
facilitation and goal emphasis behaviors. By increasing his work facilitation behavior, he
19
will increase the likelihood that his subordinates will do the same. Finally, if a manager
increases his facilitation of group interaction, his subordinates will in turn facilitate
interactions among themselves.
As mentioned earlier, Bowers and Seashore (1966) have integrated the findings
from various research programs and have come up with four dimensions of leadership:
1. Support -- behavior that increases someone else’s feeling of personal worth and
importance.
2. Interaction facilitation -- behavior that encourages positive interactions among group
members.
3. Goal emphasis -- behavior that emphasizes group goal achievement.
4. Work facilitation -- behavior that helps accomplish goals.
This study will utilize past research findings and the four leadership dimensions
developed by Bowers and Seashore as the basis for the hypotheses. This study will also
try to answer the following questions:
1. What kind of relationship exists between perceived leader behavior and work group
behavior?
2. Which leadership behaviors are the best predictors of work group behavior?
Hypotheses
The research hypotheses proposed are as follows:
1) There is a significant positive correlation between the leadership behavior scale and
the work group behavior scale.
2) There is a significant positive correlation between specific work group behaviors and
the perceived behaviors of their leader.
20
The following items within the leadership and work group behavior scales will be
examined as sub-hypotheses:
2a) There is a significant positive correlation between the perception of a leader’s
trust building behavior and the degree of trust between group members.
2b) There is a significant positive correlation between the perception of the degree
of respect leaders show their group members and the degree of respect group members
have for each other.
2c) There is a significant positive correlation between the perception of a leader’s
conflict resolution behavior and the degree of conflict resolution behavior demonstrated
by group members.
2d) There is a significant positive correlation between the perception of a leader’s
communication practices (i.e., listens openly to group members’ concerns, ideas, and
suggestions) and the communication practices of group members.
2e) There is a significant positive correlation between the perception of a leader’s
supportive behavior (i.e., supports team members when there are problems) and the
degree of support between group members.
3) Leadership behaviors related to trust, conflict resolution, and support will have the
highest correlation (R squared value) with the work group behavior scale, indicating they
account for the most variance in the work group behavior scale and are the best predictors
of work group behavior.
21
CHAPTER 2
METHOD
Participants
This research utilizes archival survey data from a manufacturing facility in Texas.
The survey was jointly developed by associates of The Center for the Study of Work
Teams at the University of North Texas and a committee consisting of production and
support employees and managers. The subjects range in age from 18-51+ years. 56% of
the subjects were male and 42% were female. Employees from each major division of
the company were asked to participate in the survey. Calculations determined that
approximately 30% of the facility’s entire population would need to complete the survey
in order to obtain a representative sample. Since the majority of the population consisted
of production workers, 20% of the survey participants were from this group. The second
largest group of employees worked in various departments serving in a support role.
Therefore, calculations revealed that 9% of the survey participants should be employees
in support positions. Managers were the third group of participants and they made up 1%
of the subjects surveyed. At the time the survey was administered, 80% of the
participants had been members of their work group for at least six months. 59% were
members of their work group for one year or more. Data from all 595 participants will be
utilized in the analysis.
22
Instrument
In 1999, a steering committee was formed to begin the design and implementation
of a Team Based Organization (TBO) within the facility. As part of this initiative, the
TBO Steering Committee decided that more detailed information would be needed, in
key areas, to develop a baseline of current practices, identify changes as they occur in the
system, and to determine how well the initiative was being implemented. To gather this
information in a systematic and efficient manner, a company-specific survey was needed.
Members of the TBO Steering Committee, which consisted of management, support, and
production workers, created items for the survey and then grouped them into categories
or scales, prior to conducting any factor analyses. A draft of the survey was shown to
several focus groups for further development. These focus groups consisted of randomly
selected employees from various departments within the organization. Each focus group
session lasted 90 minutes and consisted of two phases. During the first phase, the
attendees were asked to fill out the survey in its current form (this took about 30-45
minutes). Following a short break, phase two consisted of attendees providing the survey
development sub-team with some direct feedback on the content, administration process,
and general appearance of the TBO Survey. These focus groups were conducted by
associates of the Center for the Study of Work Teams. The final version was ready for
use across the facility in August 1999.
Participants were asked to respond to each survey question by choosing the
number that best reflects their opinion. The questions are divided into eight constructs or
scales. Each scale was developed by asking the survey development sub-team to group
together questions that appeared to relate to one another. Focus group participants were
23
also asked to examine the categorization of the questions. Using feedback from both the
survey sub-team and focus groups, the following scales emerged: 1) leadership and
Table 17 Continued Correlations Between Work Group and Leadership Behavior Scales and Items
RL92 RL93
RW55 .371 .339 RW56 .388 .366 RW57 .311 .329 RW58 .419 .375 RW59 .298 .290 RW60 .405 .357 RW61 .320 .318 RW62 .389 .344 Note: p < .001 for all correlations. Table 18 Correlations Between Work Group and Leadership Behavior Scales by Job Title
Job Title Correlations Between Scales (r) n Overall .56** 593 Production .54** 357 Support .54** 167 Management .59* 26 Note: * p = .001. ** p < .001.
49
The second hypothesis states that there is a significant positive correlation
between specific work group behaviors and the behaviors of their leader. As shown in
Table 19, Pearson correlation coefficients were computed between the work group
behavior and leadership behavior items. Hypothesis 1a) asserts that there is a significant
correlation between the perception of a leader’s trust building behavior and the
perception of trust between group members. The correlation between perceived leader
and group member trust behavior was significant, r (583) = .40, p < .001. Hypothesis 1b)
states there is a significant positive correlation between the perceived degree of respect
leaders show their group members and the perceived degree of respect group members
show for each other. The correlation between perceived leader and group member
respect behavior was significant, r (589) = .37, p < .001. Hypothesis 1c) states there is a
significant positive correlation between the perception of a leader’s conflict resolution
behavior (i.e., addresses conflict when needed) and the perception of conflict resolution
behavior demonstrated by group members (i.e., solves conflicts constructively). The
correlation between perceived leader and group member conflict resolution behavior was
significant, r (583) = .41, p < .001. Hypothesis 1d) states there is a significant positive
correlation between the perception of a leader’s listening behavior (e.g., listens openly to
group members’ concerns, ideas, and suggestions) and the perceived listening behavior of
group members. The correlation between perceived leader and group member
communication behavior was significant, r (591) = .41, p < .001. Finally, hypothesis 1e)
states there is a significant positive correlation between perceived leader support behavior
(i.e., supports members when there are problems related to work or personal matters) and
perceived support between group members (e.g., group members help each other when
50
needed). The correlation between perceived leader and group member support behavior
was significant, r (579) = .25, p < .001.
Pearson correlations were also computed between the leadership behavior and
work group behavior items for those group members who have and have not received
team training in the past. For those members who have received team training, all five
correlations were statistically significant and were greater than or equal to .24, as shown
in Table 19. For group members who have not received team training, all five
correlations were statistically significant and were greater than or equal to .24.
Pearson correlations were computed between the scale items for production
workers only. As shown in Table 20, all five correlations were statistically significant
and were greater than or equal to .29. The five correlations for production workers who
have and have not received team training were also statistically significant and were
greater than or equal to .32 and .19, respectively, as indicated in Table 20.
51
Table 19 Overall Correlations Between Leadership Behavior and Work Group Behavior Items
Variables Overall n Overall Training n
Training No Training n No Training
Trust .40* 584 .42* 407 .34* 237
Respect .37* 590 .36* 409 .37* 238
Conflict .41* 584 .44* 404 .33* 237
Listens .41* 592 .46* 411 .30* 239
Support with Problems
.25* 580 .24* 403 .24* 234
Note: * p < .001. Table 20 Correlations Between Leadership Behavior and Work Group Behavior Items for Production Workers Only
Variables Overall n Overall Training n
Training No Training n No Training
Trust .33*** 356 .39*** 171 .20* 114
Respect .30*** 361 .33*** 174 .24** 117
Conflict .40*** 359 .44*** 173 .29* 116
Listens .37*** 362 .45*** 174 .19* 117
Support with Problems
.29*** 353 .32*** 170 .19* 113
Note: * p < .05. ** p < .01. *** p < .001.
52
Hypothesis three states that leadership behaviors related to trust, conflict
resolution, and support (i.e., supports members when problems occur) will have the
highest correlation (R squared value) with the work group behavior scale. A stepwise
regression analysis was conducted to determine how well items in the leadership behavior
scale predict work group behavior. The independent variables were the 19 leadership
behavior scale items, while the dependent variable was the work group behavior scale.
The first step in the regression procedure involved entering all 19 leadership behavior
scale items as independent variables, all at once, using the “Enter” method. Items with a
p-value of less than .05 were then chosen for the second step in the regression procedure,
which involved entering these items as independent variables one at a time, using the
“Stepwise” method. Items were entered in order of descending beta weights.
Results of the analysis indicate that perceived leader trust behavior is significantly
related to the work group behavior scale, R square = .26, adjusted R square = .26, F (1,
580) = 199.65, p < .001. Perceived leader behavior related to availability (i.e., is
available when needed) was significantly related to the work group behavior scale, R
square = .30, adjusted R square = .29, F (1, 579) = 32.58, p < .001. Finally, perceived
leader behavior related to conflict (i.e., addresses conflict when needed) was significantly
related to the work group behavior scale, R square = .31, adjusted R square = .31, F (1,
578) = 14.64, p < .001. However, perceived leader support behavior (i.e., supports team
members when there are problems) was not a predictor. As shown in Table 21, all of the
bivariate and partial correlations between the leadership behavior items and the work
group behavior scale were positive, as expected, and statistically significant.
53
Table 21
Overall Bivariate and Partial Correlations of the Predictors with the Work Group
Behavior Scale
Predictors Correlation Between Each Predictor and the Work Group Behavior Scale
Correlation Between Each Predictor and the Work Group Behavior Scale Controlling for All Other Predictors
n
Trust .51* .51* 580
Available .45* .23* 579
Conflict .46* .16* 578
Note: * p < .001.
54
For those group members who have received team training in the past, a stepwise
regression analysis was also conducted to determine how well items in the leadership
behavior scale predicted work group behavior. The independent variables were the 19
leadership behavior scale items, while the dependent variable was the work group
behavior scale. Perceived leader behavior related to availability was significantly related
to the work group behavior scale, R square = .26, adjusted R square = .26, F (1, 395) =
138.05, p < .001. Perceived leader behavior related to conflict was significantly related
to the work group behavior scale, R square = .33, adjusted R square = .33, F (1, 394) =
42.42, p < .001. Perceived leader behavior related to support of group decisions was also
significantly related to the work group behavior scale, R square = .36, adjusted R square
= .35, F (1, 393) = 14.37, p < .001. As shown in Table 22, all of the bivariate and partial
correlations between the leadership behavior items and the work group behavior scale
were positive and statistically significant.
Table 22
Overall Bivariate and Partial Correlations of the Predictors with the Work Group
Behavior Scale for Group Members Who Have Received Team Training
Predictors Correlation Between Each
Predictor and the Work Group Behavior Scale
Correlation Between Each Predictor and the Work Group Behavior Scale Controlling for All Other Predictors
n
Available .51* .51* 395
Conflict .50* .31* 394
Supports Decisions .48* .19* 393
Note: * p < .001.
55
For those group members who have not received team training in the past,
regression analyses indicate that perceived leader behavior related to respect (i.e., treats
all group members with respect) is significantly related to the work group behavior scale,
R square = .16, adjusted R square = .16, F (1, 172) = 33.09, p < .001. Perceived leader
trust behavior was also significantly related to the work group behavior scale, R square =
.23, adjusted R square = .22, F (1, 171) = 15.31, p < .001. All bivariate correlations were
positive and statistically significant. As shown in Table 23, all partial correlations were
positive and statistically significant.
Table 23
Overall Bivariate and Partial Correlations of the Predictors with the Work Group
Behavior Scale for Group Members Who Have Not Received Team Training
Predictors Correlation Between Each
Predictor and the Work Group Behavior Scale
Partial Correlation Between Each Predictor and the Work Group Behavior Scale Controlling for All Other Predictors
n
Respect .40* .40* 172
Trust .46* .29* 171 Note: * p < .01.
56
A stepwise regression analysis was also conducted to determine how well items in
the leadership behavior scale predicted work group behavior for production workers only.
Results of the analysis indicate that perceived leader behavior related to support of group
decisions was significantly related to the work group behavior scale, R square = .22,
adjusted R square = .22, F (1, 349) = 98.84, p < .001 and perceived leader behavior
related to availability was significantly related to the work group behavior scale, R square
= .28, adjusted R square = .28, F (1, 348) = 28.72, p < .001. All bivariate and partial
correlations were positive and statistically significant, as indicated in Table 24.
Table 24
Bivariate and Partial Correlations of the Predictors with the Work Group Behavior Scale
for Production Workers Only
Predictors Correlation Between Each Predictor and the Work Group Behavior Scale
Correlation Between Each Predictor and the Work Group Behavior Scale Controlling for All Other Predictors
n
Supports Decisions .47* .47* 349
Available .45* .28* 348
Note: * p < .001.
57
For those production workers who have received team training in the past,
perceived leader behavior related to support of group decisions was significantly related
to the work group behavior scale, R square = .28, adjusted R square = .27, F (1, 230) =
87.16, p < .001 . The bivariate correlation, r (230) = .52, p < .001, and partial correlation,
r (230) = .52, p < .001, was positive and statistically significant.
For those production workers who have not received team training in the past,
perceived leader behavior related to availability was significantly related to the work
group behavior scale, R square = .10, adjusted R square = .09, F (1, 114) = 12.49, p =
.001. The bivariate correlation, r (115) = .31, p = .001, and partial correlation, r (115) =
.31, p = .001, were positive and statistically significant, as shown in Table 25. A
summary of all the predictors by group and training history is represented in Table 26.
Table 25
Bivariate and Partial Correlations of the Predictors with the Work Group Behavior Scale
for Production Workers Who Have Not Received Team Training
Predictors Correlation Between Each Predictor and the Work Group Behavior Scale
Correlation Between Each Predictor and the Work Group Behavior Scale Controlling for All Other Predictors
n
Available .31* .31* 115
Note: * p = .001.
58
Table 26
Summary of Predictors By Group and Training History
Overall Overall Train
Overall No Train
Production Production Train
Production No Train
Trust Available Respect Supports Decisions
Supports Decisions Available
Available Conflict Trust Available
Conflict Supports Decisions
59
CHAPTER 4
DISCUSSION
The purpose of this study was to examine the relationship between perceived
leader behavior and work group behavior. Results of the item and factor analyses suggest
that the items used in the study form true scales. Overall, the results supported the
predictions. The first hypothesis that there is a significant positive correlation between
the leadership behavior scale and the work group behavior scale was confirmed.
Correlations between the leadership behavior items and the work group behavior scale
were also positive and significant. The results suggest that indeed there is a relationship
between perceived leader behavior and work group behavior. In general, leadership
behavior related to trust had the strongest relationship with the work group behavior
scale. Whether or not a group member received team training in the past was examined
as a potential moderator variable. Correlations between the leadership behavior and work
group behavior scales and items for members who have received team training in the past
were higher than those who have not received team training. This suggests that whether
or not a group member has received team training does affect their perception of their
leader’s behavior and the behavior of their peers.
The second hypothesis that there is a significant positive correlation between
work group and leadership behaviors was confirmed. Specifically, there is a significant
positive correlation between the perception of leader and work group behaviors related to
trust, respect, conflict resolution, listening, and support. In other words, these results
60
suggest that there is a positive relationship between group members’ perceptions of the
how often their leader demonstrates a particular behavior and their perception of how
often they see the same behavior in their peers. Once again, the correlations between
perceived leader behavior and work group behavior are higher for group members who
have had team training in the past. It is possible that groups who have had team training
are more receptive to modeling their leader because training has taught them to see the
value of demonstrating leadership characteristics, which are typically taught as part of
team training. As discussed previously, studies have shown that subordinates showed
greater similarity in behavior to superiors who were believed to be competent and
successful. Supervisors who demonstrate leadership characteristics may be perceived by
their group members as being competent; thus, these supervisors are more likely to be
imitated.
The third hypothesis states that leadership behaviors related to trust, conflict
resolution, and support (i.e., supports members when problems occur) will be the best
predictors of overall work group behavior. As predicted, perceived leader trust and
conflict behavior was significantly related to the work group behavior scale. Behavior
related to leader availability also emerged as a predictor of work group behavior.
Therefore, perceptions of whether or not a leader develops group member trust, addresses
conflict when needed, and is available when needed has an impact on the performance of
his or her work group. Results suggest that leaders who pay attention to these areas have
work groups that perform better than leaders who do not emphasize these areas. A
stepwise regression analysis of the leadership behavior items with the work group
behavior scale was conducted for group members who have and have not received team
61
training. For team members who have received team training in the past, results indicate
that leader behavior related to availability, conflict, and support of group decisions were
the best predictors of work group behavior. For team members who have not received
team training in the past, leadership behavior related to respect and trust were the best
predictors. Group members who have had team training in the past tend to emphasize
what Bowers and Seashore call “work facilitation” behaviors (e.g., leader support of
group decisions), which are behaviors that help work groups accomplish goals. Group
members who have not received team training in the past seem to focus more on
“support” behaviors (e.g., trust, respect), which are behaviors that increases a person’s
feelings of personal worth and importance. One explanation for the results could be that
members who have received team training in the past may come to value more advanced
teaming behaviors from their leader, such as dealing with group conflict and supporting
group decisions. Members who have not received team training may tend to focus on
more traditional leadership behaviors such as trust and respect.
A stepwise regression analysis of the leadership behavior items was conducted for
production workers only. Results indicate that perceived leader support of group
decisions and availability were the best predictors of work group behavior for production
workers overall. Leader support of group decisions emerged as the best predictor of
work group behavior for production workers who have received team training. For
production workers who have not received team training in the past, leader behavior
related to availability emerged as a predictor of work group behavior. Results indicate
that in general, perceived leader support of group decisions predicts production worker
behavior. One explanation for this may be that production workers tend to value support
62
from their leader when they attempt to make a group decision, since in general,
production workers are the group least likely to have the freedom to make decisions on
their own, especially when compared to support and management employees. Leader
support of group decisions did not emerge as a predictor of work group behavior for
production workers who have not received team training. Perhaps group members who
have not received team training have not been taught to understand that their group or
team has the capability to effectively make decisions on their own, and the role of a true
leader is to provide guidance and support.
Leader behavior related to support of team members (when problems related to
work or personal matters occur) did not emerge as a predictor of work group behavior
overall or for production workers. However, exploratory analyses did determine that for
management and support workers combined, support of team members when problems
occur did emerge as a predictor of work group behavior, as predicted by the hypothesis.
This suggests that perceptions of leader support in general, whether it is support of group
decisions or support when problems occur, do impact group behavior.
Implications for Research and Practice
Through modeling, employees can learn desirable as well as undesirable work
behaviors. The challenge for managers is to understand modeling principles so that they
can facilitate the modeling of functional rather than dysfunctional behaviors (Manz and
Sims, 1981). Since leadership behavior related to trust and conflict had the highest
correlation with the work group behavior scale, organizations may benefit from focusing
their leadership development programs on teaching leaders techniques for building trust
and resolving conflict between their group members. Furthermore, behavior modeling
63
has been used successfully as a technique for interpersonal skills training. According to
Manz and Sims (1981), learning through modeling can be easier and more enjoyable than
the more traditional approaches to learning. Traditional approaches have been widely
criticized for focusing on changing a person’s attitude rather than their behavior. Thus,
organizations can benefit from incorporating different learning techniques into their
training programs, such as the imitation of desirable models. Rather than just demanding
that subordinates behave in a certain way, supervisors must display the desired behavior
if they want to see that same behavior in their subordinates. Research does indicate that
employees are more likely to model the behavior of a manager than a co-worker because
of the status, experience, and prestige of those with managerial positions (Manz & Sims,
1981).
Limitations of the Study
This study was only able to examine group members’ perceptions of their leader’s
behavior. Studies on leader-member exchanges have already shown that subordinate
perceptions of their leader can depend upon the quality of their relationship with him or
her. Therefore, researchers may not get an accurate assessment of a leader’s behavior if
they rely solely on subordinate ratings. Similar studies on leadership behavior should
obtain data from multiple sources, such as group member ratings, leader self-ratings, and
possibly ratings from the leader’s immediate supervisor. In addition, there is a chance
that the correlations are inflated by shared method variance since all variables were
measured by items with the same format. Although results of this study seem to support
the theory of organizational modeling, it does not prove that work groups demonstrate the
same behaviors as their leader because they are modeling him or her. In fact, just the
64
opposite may be the case. It is possible that the behavior of work group members is
influencing how a supervisor or leader behaves.
Future Study
Research has shown that modeling does occur; yet, very few studies have focused
on subordinates modeling the behavior of their supervisor or leader. Although results of
this study supports the theory that subordinates model the behavior of their leader or
supervisor, the topic of behavior modeling within organizations still needs further
investigation. Also, future studies may want to explore the effect of team training on
employee perceptions of their leader.
Conclusion
The results of this study support past research findings that there is a strong and
significant relationship between a leader’s behavior and that of his or her subordinates.
Moreover, results suggest that group members who report that their leader demonstrates a
particular behavior also report that their work group demonstrates the same or similar
behavior. The theory of vicarious learning or modeling has been proposed as an
explanation for this correlation. Research has shown that subordinates, under certain
circumstances, will imitate the behavior of their leader, especially if they perceive their
leader to be competent and if they feel modeling the behavior will be of benefit to them.
This study’s findings seem to support the theory of organizational modeling. Results also
support past research findings that suggest leadership behaviors related to trust, respect,
and reconciling conflict are the best predictors of group behavior. However, whether or
not a group member has received team training affects the results, indicating that group
members who have received team training in the past perceive their leader differently and
65
tend to emphasize different leadership characteristics than those who have not received
team training. The topic of the relationship between leader and subordinate behavior still
needs further study in order to determine if subordinates are indeed modeling their
leaders and what effect team training has on the relationship between leader and work
group behavior.
66
APPENDIX
TEAM BASED ORGANIZATION SURVEY
67
Team Based Organization Survey
Purpose: To gather employee feedback in key areas for use in the improvement of Team Based Organization (TBO) processes throughout the facility. Key Areas:
This survey is based on the following eight broad-based areas of interest: 1. Leadership &
Morale 4. Information, Measurement, &
Performance Improvement 7. Team Environment
2. Recognition 5. Decision Making 8. Relationships
3. Customer Focus 6. Training
Questions You May Have:
?? How is my confidentiality protected?
To help you respond openly and honestly, an outside party will evaluate data collected from this survey. Your responses will be sent directly to the University of North Texas Center for the Study of Work Teams for evaluation and data analyses. Your individual responses will NOT be made available to anyone within the company. Further, results will NOT be presented in a way that identifies individuals.
?? How should I respond to questions?
When responding to questions, use your current opinions as a reference point. Also, try your best to answer questions fairly and accurately.
?? What happens after I complete my survey?
Surveys will be collected and sealed by survey administrator. They will be sent to the UNT Center for the Study of Work Teams where the results will be tabulated.
?? How will the results be shared with us?
After a sufficient number of surveys have been administered, they will be compiled for plant-wide analysis. This information will be shared with all employees via the web, postings on bulletin boards, and publication in the newsletter. Remember: Individual results will not be identified.
?? Are there plans to do surveys like this in the future so that we can measure our progress on TBO issues?
Yes
?? How does this survey relate to other company surveys? This survey is unique to this facility and is not connected to other company survey processes.
68
Definitions
?? Team-Based Organization – A team-based organization uses teams to perform the core work of the organization. The whole organization consists of various teams who work together to produce a certain product &/or service. People work with their peers in the team, and teams work with other teams to accomplish tasks and make decisions.
?? Team – A group of employees that can identify with and are responsible for a common deliverable process or service and who work together toward a common goal.
?? Team Environment – One in which employees are involved in action planning and problem solving. Employees are provided with feedback on their performance. Ideas, suggestions, & opportunities for improvement are handled appropriately. Communication is frequent and effective.
?? FTL – Functional Team Leaders are senior managers who lead various functions. FTL’s supervise several Area Team Leaders.
?? ATL – Area Team Leaders are managers who lead a work group or team and who report to FTL’s.
?? OJT – On The Job Trainers are individuals who provide technical on the job training to individuals and teams.
?? Coordinator – Coordinators are individuals who organize the activities of team members within specific areas. They work day-to-day issues to assist the team.
?? Production System (CPS) – Initiatives focused on removing non-value-added activities from our work processes.
?? CQI – Continuous Quality Improvement.
?? AIW – Accelerated Improvement Workshops (part of the CPS Initiative).
?? QCDSM – Quality, Cost, Delivery, Safety, and Morale.
?? Business Information – Information pertaining to the operation and maintenance of this facility (see QCDSM).
?? Internal Customers – Customers within the facility; any team you or your team interact with and provide products &/or services to.
?? External Customers – Organizations which buy products &/or services from this facility.
69
Instructions The following information will be used to better understand the opinions of all employees throughout the facility. These questions will be used for summary purposes only and will not be used to identify you in any way. ??Please read all directions carefully and mark answers only on the answer
sheet provided (Do not mark on this form).
??Please do not put your name on the answer sheet. ??If you have any questions, please let the administrator know. Begin on the left side of the answer sheet:
Gender Please enter in the area marked “sex” on your answer sheet Male Female Job Title Please enter in the area marked “grade or educ” 0. Production
(Production Associate, OJT, etc.) 1. Production Support
(Material Associate, Fab Tech, PA Floor Scheduler, Quality Control Associate, Test, etc.)
2. Support – Non-Exempt
(Planner, Production Scheduler, HR Coordinator, Computing Specialist, Technical Specialist, etc.)
3. Support – Exempt
(Accountant, Engineer, Instructor, Nurse, Systems Analyst, Hardware Focal, etc.)
4. Manager – Production
(ATL Production Manager, etc.)
5. Manager – Production Support (ATL Finance, ATL Engineering, ATL Quality, etc.)
70
Begin using the numbered area of answer sheet
1. Shift
1. First
2. Second
3. Third
2. Total Length of time employed at this facility
(DO NOT including temporary or contract work)
1. Less than 6 months 2. 6 months – 1 year 3. 1 year – 2 years
4. 2 years – 4 years
5. 4+ years
3. Length of time on
current team:
1. Less than 6
weeks
2. 6 weeks – 6 months
3. 6 months – 1
year
4. 1+ year
4. Age:
1. 18-24
2. 25-30
3. 31-40
4. 41-50
5. 51+
5. Members of our team have
participated in Accelerated Improvement Workshops (AIW's).
1. YES
2. NO
6. Our team has participated in the
TBO Chartering Process at this facility
1. YES
2. NO
If you are unsure, please answer no.
7. I have participated in team training
in the past (here or elsewhere).
1. YES
2. NO
Survey Directions Please respond to each question by choosing the number that best reflects your opinion over the last 6 months: (1) Rarely, (2) Some of the time, (3) Most of the time, (4) Always. If a question does not apply to you or your team, mark 5 (NA) for "Not Applicable" (please use this only as a last resort).
Rarely
Som
e of the tim
e
Most of the
time
Alw
ays
Not
Applicable
I. Leadership & Morale
8. Senior managers (FTL’s) show by their actions that they support a Team
Based Organization (TBO). 1 2 3 4 NA
9. ATL's show by their actions that they support a TBO. 1 2 3 4 NA 10. Leaders show by their behavior that they understand the requirements of a
team environment. 1 2 3 4 NA
11. I feel positive about the direction this facility is moving to remain a preferred electrical supplier for The Boeing Company. 1 2 3 4 NA
12. I look forward to coming to work. 1 2 3 4 NA 13. My team’s morale is good. 1 2 3 4 NA 14. I understand how the product &/or service I provide is used. 1 2 3 4 NA 15. I understand how my team’s goals link to company goals. 1 2 3 4 NA
71
Rarely
Som
e of the tim
e
Most of the
time
Alw
ays
Not
Applicable
II. Recognition
16. Leaders recognize teams for meeting and/or exceeding their goals. 1 2 3 4 NA 17. Leaders recognize individuals for their contributions in meeting and/or
exceeding group goals. 1 2 3 4 NA
III. Customer Focus
18. Our team knows who all our customers are; both internal and external. 1 2 3 4 NA 19. Our team provides quality products/services to our internal customers (to
the next step in the process). 1 2 3 4 NA
20. Our team provides products/services to our internal customers (to the next step in the process) in a timely manner. 1 2 3 4 NA
21. We measure our team’s customer satisfaction levels on a regular basis. 1 2 3 4 NA 22. We receive support from our internal suppliers in a timely manner. 1 2 3 4 NA
IV. Information, Measurement, & Performance Improvement
23. Our team measures/tracks Quality in our area. 1 2 3 4 NA 24. We are using that information to improve our Quality. 1 2 3 4 NA 25. Our team measures/tracks Cost in our area. 1 2 3 4 NA 26. We are using that information to improve our Cost. 1 2 3 4 NA 27. Our team measures/tracks Delivery (Scheduling) in our area. 1 2 3 4 NA 28. We are using that information to improve our Scheduling (Delivery). 1 2 3 4 NA 29. Our team measures/tracks Safety in our area. 1 2 3 4 NA 30. We are using that information to improve our Safety. 1 2 3 4 NA 31. Our team measures/tracks Morale in our area. 1 2 3 4 NA 32. We are using that information to improve our Morale. 1 2 3 4 NA 33. Our team has access to the business information we need to develop goals
and priorities (i.e. rework, defects, schedule, etc…). 1 2 3 4 NA
34. Our team is given enough time to discuss, understand, & utilize the information we receive. 1 2 3 4 NA
35. Our team uses the time it’s given appropriately. 1 2 3 4 NA
V. Decision Making
36. Our team understands which decisions it is responsible for making 1 2 3 4 NA 37. Our team makes the decisions needed to perform our work. 1 2 3 4 NA 38. Our ATL is supportive of the decisions our team makes. 1 2 3 4 NA
VI. Training
39. Our team receives the job skills training (i.e., floor training) needed to
perform our jobs. 1 2 3 4 NA
40. Individuals on our team receive the certification training needed to perform their jobs in a timely manner. 1 2 3 4 NA
41. Our team receives training on how to perform other team members’ jobs (i.e., cross training). 1 2 3 4 NA
42. Our team gets the business training necessary to understand the information we receive on Quality, Cost, Delivery, Safety, & Morale (QCDSM).
1 2 3 4 NA
43. Our team receives training on how to work together in teams (e.g., team decision-making, resolving group conflict, etc.).
1 2 3 4 NA
72
Rarely
Som
e of the tim
e
Most of
the time
Alw
ays
Not
Applicable
44. Our team has received the training necessary to understand process improvement activities. 1 2 3 4 NA
45. Our manager is being trained to deal with a team environment effectively. 1 2 3 4 NA
VII. Team Environment
46. Our team discusses problems that occur in our work area and constructive
ways to resolve them. 1 2 3 4 NA
47. Our team maintains an environment in which everyone is listened to and all ideas are considered. 1 2 3 4 NA
48. Our team utilizes continuous improvement tools (i.e.; CQI, AIW, CPS). 1 2 3 4 NA 49. In our team, experienced group members help new group members when
problems arise. 1 2 3 4 NA
50. Our team is given time to meet and deal with team issues. 1 2 3 4 NA
VIII. Relationships **Managers, please consider your management team for all “relationship” questions**
Relationships within your Team The following questions have to do with the relationship between yourself and the people you work most closely with. Using the scale after each question and your experiences in the last six months of work as a reference point, please circle the number that corresponds with your answer.
Members of My Team : 51. Trust each other. 1 2 3 4 NA 52. Solve work problems and conflicts in a constructive, positive manner. 1 2 3 4 NA 53. Listen to each other's suggestions, ideas, and concerns. 1 2 3 4 NA 54. Use each other's suggestions and ideas to improve work processes. 1 2 3 4 NA 55. Give each other feedback. 1 2 3 4 NA 56. Are open to the feedback they receive. 1 2 3 4 NA 57. Treat each other with respect. 1 2 3 4 NA 58. Show appreciation for good work. 1 2 3 4 NA 59. Help others when needed. 1 2 3 4 NA 60. Behave in ways that show that they understand how their performance
effects team goals. 1 2 3 4 NA
61. Admit mistakes and work to correct them. 1 2 3 4 NA 62. Take team needs into consideration when making individual decisions. 1 2 3 4 NA
RELATIONSHIP BETWEEN YOUR TEAM AND OTHER TEAMS (SAME SHIFT) WITHIN THIS FACILITY The following has to do with the relationship between team members in your immediate work area and other teams within this facility. Using the scale after each question and your experiences within the last six months as a reference point, please circle the appropriate number.
Our team: 63. Understands how we are linked to other teams within this facility. 1 2 3 4 NA 64. Communicates important business information to other teams. 1 2 3 4 NA 65. Solves work problems and conflicts with other teams. 1 2 3 4 NA 66. Listens to concerns of other teams. 1 2 3 4 NA 67. Uses other teams suggestions and ideas to improve work processes. 1 2 3 4 NA 68. Treats other groups with respect. 1 2 3 4 NA 69. Shows appreciation for good work with other teams. 1 2 3 4 NA 70. Helps other teams when needed. 1 2 3 4 NA
73
Relationship between your team and other shifts The following questions have to do with the relationship between team members in your immediate work area and team members on other shifts. Using the scale after each question and your experiences within the last six months as a reference point, please circle the number that corresponds with your answer.
Rarely
Som
e of the tim
e
Most of the
time
Alw
ays
Not
Applicable
Our team: 71. Is able to complete work started by other shifts without difficulty (minimal
starting over). 1 2 3 4 NA
72. Communicates important information to the next shift. 1 2 3 4 NA 73. Receives important information from the previous shift. 1 2 3 4 NA 74. Has a cooperative relationship with other shifts. 1 2 3 4 NA 75. Is given time to work out problems with other shifts. 1 2 3 4 NA
Relationship with your Leader (the person you report to directly –- ATL or FTL) The following questions have to do with the relationship between team members in your immediate work area and your Leader. Using the scale after each question and the last six months as a frame of reference, please circle the number that corresponds with your answer. The Leader in my work area: 76. Develops group member trust. 1 2 3 4 NA 77. Shares QCDSM information with our group 1 2 3 4 NA 78. Addresses conflict when needed. 1 2 3 4 NA 79. Provides feedback on performance regularly. 1 2 3 4 NA 80. Provides feedback in a positive manner. 1 2 3 4 NA 81. Treats all group members with respect. 1 2 3 4 NA 82. Listens openly to group members’ concerns, ideas, suggestions, etc. 1 2 3 4 NA 83. Shows appreciation for good work. 1 2 3 4 NA 84. Is approachable when problems occur. 1 2 3 4 NA 85. Is available when needed. 1 2 3 4 NA 86. Supports team members when there are problems related to work or
personal matters. 1 2 3 4 NA
87. Addresses unsafe practices immediately. 1 2 3 4 NA 88. Encourages participation in Ergo exercises. 1 2 3 4 NA 89. Takes steps to prevent accidents and injuries. 1 2 3 4 NA 90. Removes obstacles to good team performance. 1 2 3 4 NA 91. Helps us to receive the training we need. 1 2 3 4 NA 92. Balances company needs with team member needs. 1 2 3 4 NA 93. Administers discipline in a fair and consistent manner. 1 2 3 4 NA
74
Rarely
Som
e of the tim
e
Most of the
time
Alw
ays
Not
Applicable
Relationship with your OJT or Coordinator The following questions have to do with the relationship between team members in your immediate work area and your OJT or Coordinator. Using the scale after each question and the last six months as a frame of reference, please circle the number that corresponds with your answer. The OJT or Coordinator in my work area: 94. Develops group member trust. 1 2 3 4 NA 95. Shares information with our group 1 2 3 4 NA 96. Provides feedback regularly. 1 2 3 4 NA 97. Provides feedback in a positive manner. 1 2 3 4 NA 98. Treats all group members with respect. 1 2 3 4 NA 99. Is available when needed. 1 2 3 4 NA 100. Trains me in an effective manner (is experienced, knowledgeable of the
product/process, etc.…) 1 2 3 4 NA
In the space marked "Special Codes" K & L (To the left of the numbered area) Please bubble in your response
K. What do you think of surveys such as this one? L. How likely is it that we will be successful in our
mission to create a team-based organization within this facility?
0 = They are not useful at all 0 = Not at all likely
1 thru 8
=
Somewhere in between “not at all” and “extremely useful” (Use whichever number most closely reflects your opinion)
1 thru8
=
Somewhere in between “not at all” and “extremely likely” (Use whichever number most closely reflects your opinion)
9 = They are extremely useful 9 = Extremely likely
Thank you for completing this survey. Collective results will be shared with you in the near future.
75
REFERENCES Bandura, A. (1976). Social learning theory. Behavioral Approaches to Therapy.
Morisstown, N.J.: General Learning Press. Barbuto, Jr., J.E. (2000). Influence triggers: A framework for understanding follower
a four-factor theory of leadership. Administrative Science Quarterly, 11(2), 238-263. Brower, H.H., Schoorman, F.D., & Tan, H.H. (2000). A model of relational
leadership: The integration of trust and leader-member exchange. Leadership Quarterly, 11(2), 227-250.
Brown, I., & Inouye, D.K. (1978). Learned helplessness through modeling: The role of perceived similarity in competence. Journal of Personality & Social Psychology, 36, 900-908.
Brown, S.E. & Dalton, S.L. (1980). Relationship between initiating structure and
consideration leadership dimensions of school business managers. Education, 100(3), 209-213.
Burnaska, R.F. (1976). The effects of behavior modeling training upon managers’
behaviors and employees’ perceptions. Personnel Psychology, 29, 329-335. Cartwright, D. & Zander, A. (1960). Group Dynamics Research and Theory.
Evanston: Row, Peterson, & Co. Davis, T.R.V & Luthans, F. (1980). A social learning approach to organizational
behavior. Academy of Management Review, 5(2), 281-290. Deluga, R.J. (1994). Supervisor trust building, leader-member exchange and
Dobbins, G.H. & Zaccaro, S.J. (1986). The effects of group cohesion and leader behavior on subordinate satisfaction. Group & Organization Studies, 11(3), 203-220.
Gerstner, C.R & Day, D.V. (1997). Meta-analytic review of leader-member
exchange theory correlates and construct issues. Journal of Applied Psychology, 82(6), 827-844.
76
Haunschild, P.R. & Miner, A.S. (1997). Modes of interorganizational imitation: The
effects of outcome salience and uncertainty. Administrative Science Quarterly, 42(3), 472-500.
Hemphill, J.K. & Coons, A.E. (1957). Development of the leader behavior
description questionnaire. Leader Behavior: Its Description and Measurement. Columbus: Bureau of Business Research, the Ohio State University.
Khan, K.H. & Cangemi, J.P. (1979). Social learning theory: The role of imitation in
learning socially desirable behavior. Education, 100(1), 41-46. Liden, R.C. & Graen, G. (1980). Generalizability of the vertical dyad linkage model
of leadership. Academy of Management Journal, 23(3), 451-465. Mann, F.C. (1965). Leadership and Productivity. San Francisco: Chandler
Publishing Company. Manz, C.C. & Sims Jr., H.P. (1991). Superleadership: Beyond the myth of heroic
leadership. Organizational Dynamics, 19(4), 18-35. Manz, C.C. & Sims Jr., H.P. (1981). Vicarious learning: The influence of modeling
on organizational behavior. Academy of Management Review, 6(1), 105-113. Podsakoff, P.M., & Todor, W. D. (1985). Relationships between leader reward and
punishment behavior and group processes and productivity. Journal of Management, 11, 55-73.
Putti, J.M. (1985). Leader behavior and group characteristics in work improvement
teams – the asian context. Public Personnel Management, 14(3), 301-306. Robinson, S.L. & O’Leary-Kelly, A. (1996). Monkey see, monkey do: The role of
role models in predicting workplace aggression. Academy of Management Proceedings, 288-292.
Sims Jr., H.P. & Szilagyi, A.D. (1975). Leader reward behavior and subordinate
satisfaction and performance. Academy of Management Proceedings, 161-163. Townsend, J., Phillips, J.S. & Elkins, T.J. (2000). Employee retaliation: The
neglected consequence of poor leader-member exchange relations. Journal of Occupational Health Psychology, 5(4), 457-463.
Weiss, H.M. (1977). Subordinate imitation of supervisor behavior: The role of
modeling in organizational socialization. Organizational Behavior & Human Decision Processes, 19(1), 89-105.
77
Williams, M.L.& Podsakoff, P.M. (1992). Effects of group-level and individual-
level variation in leader behaviours on subordinate attitudes and performance. Journal of Occupational & Organizational Psychology, 65(3), 115-129.


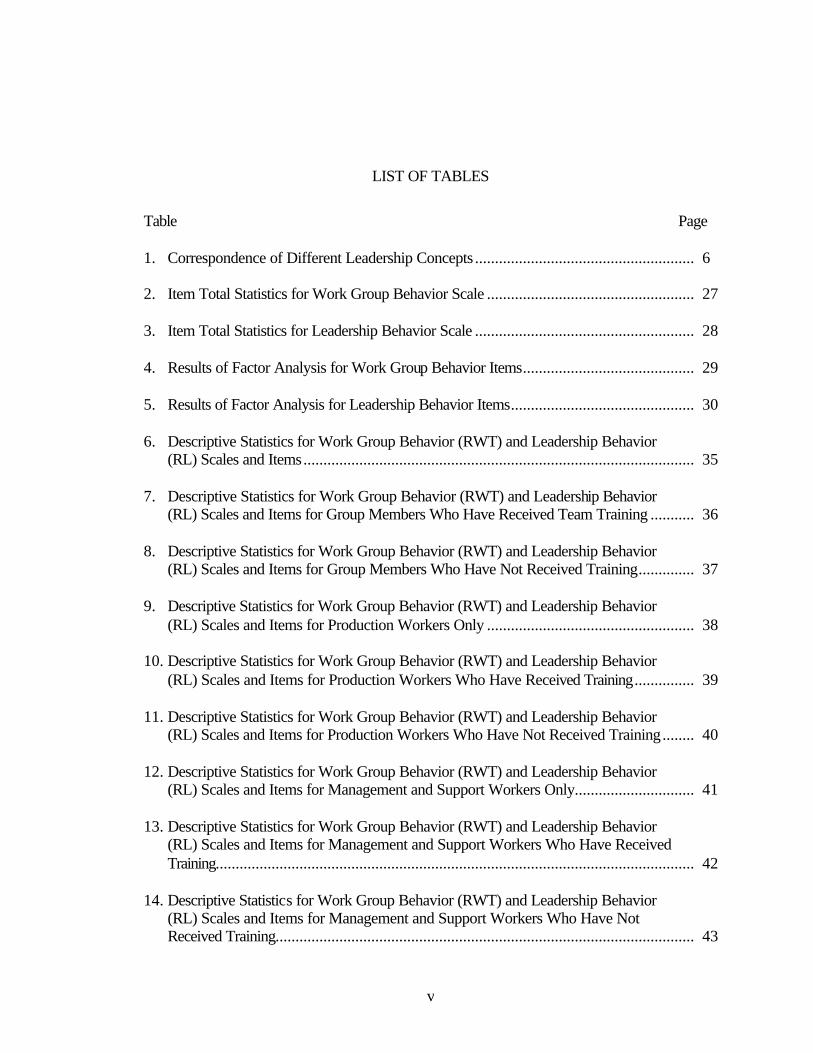
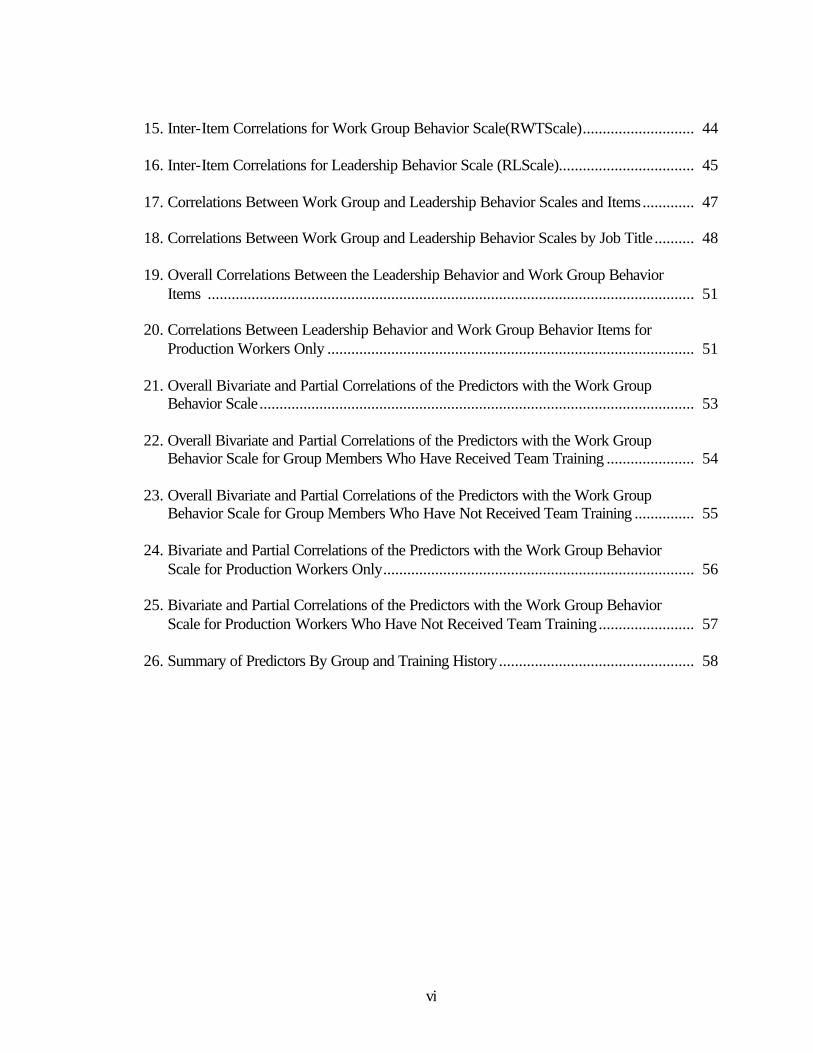

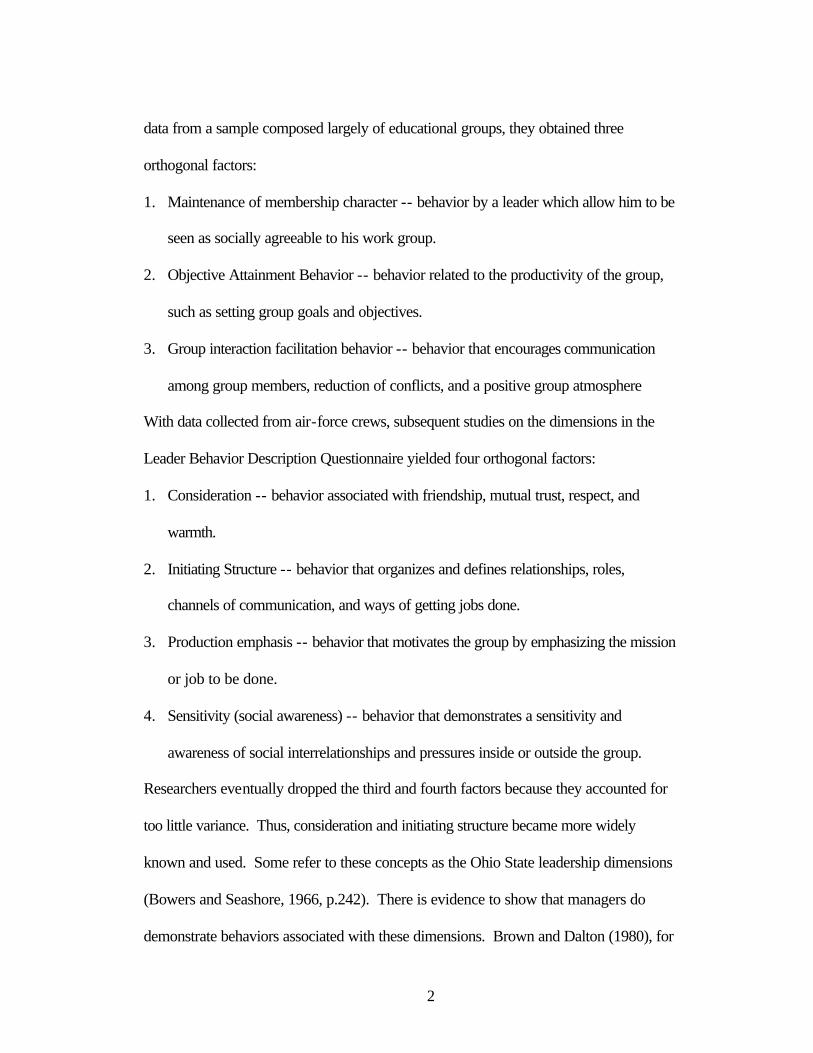


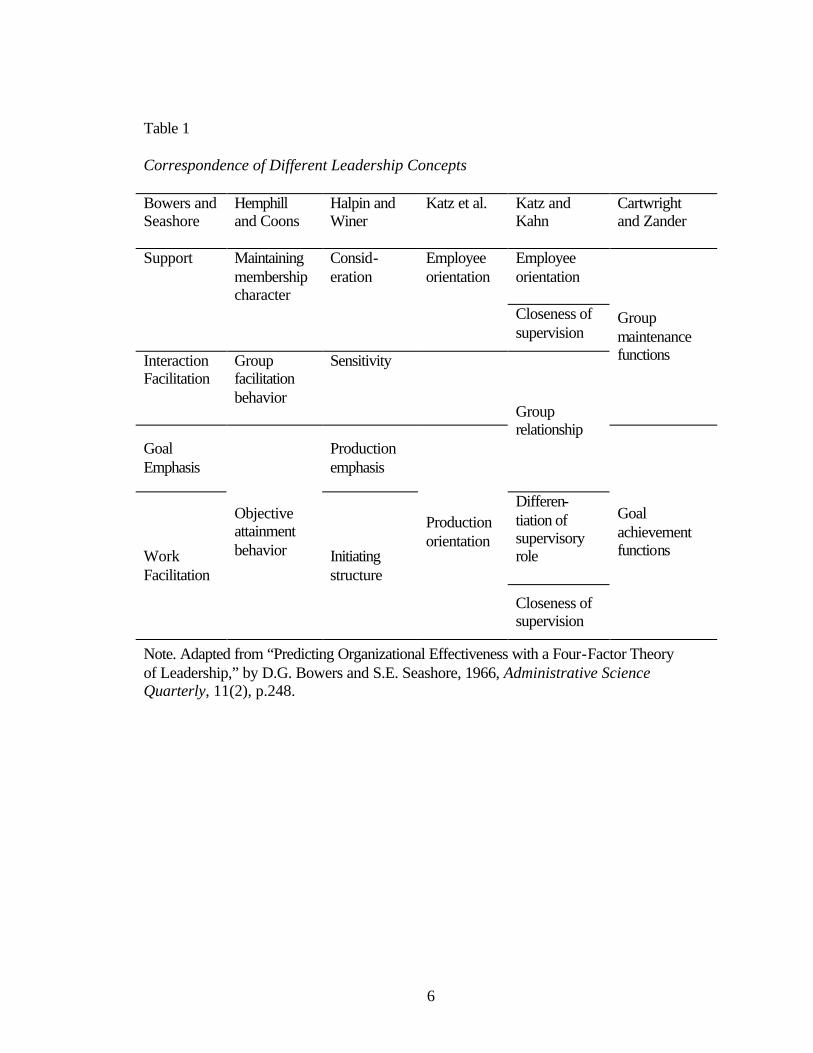


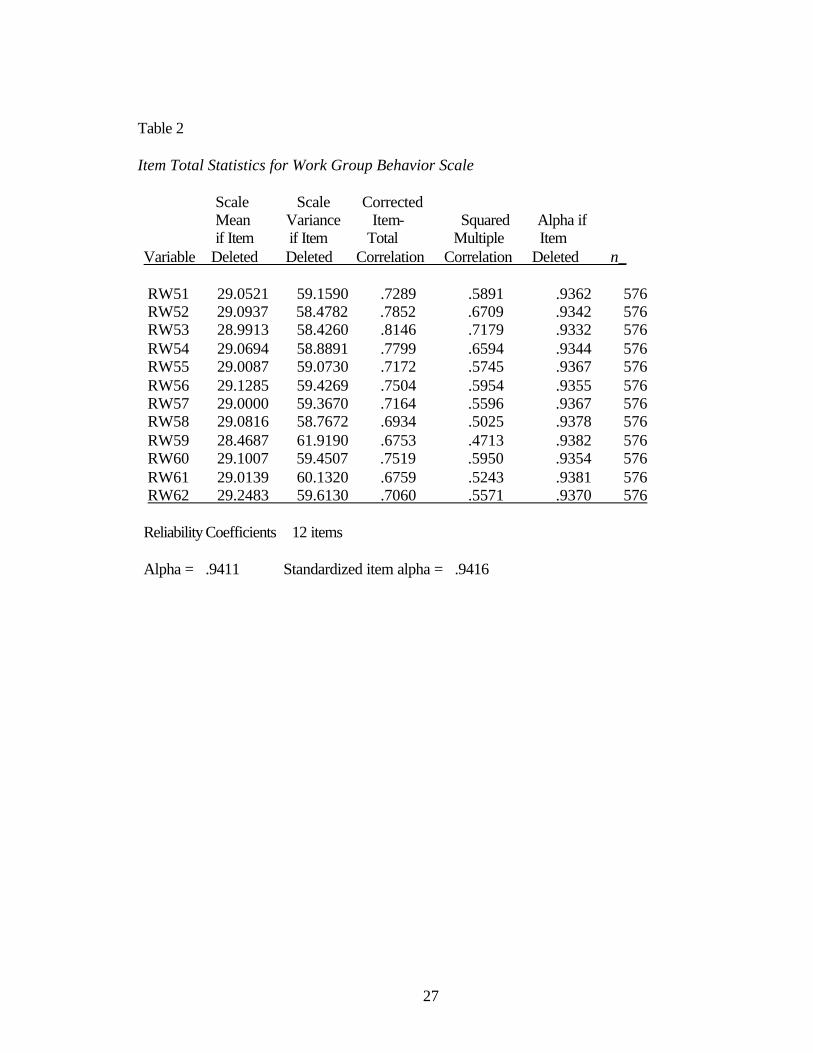
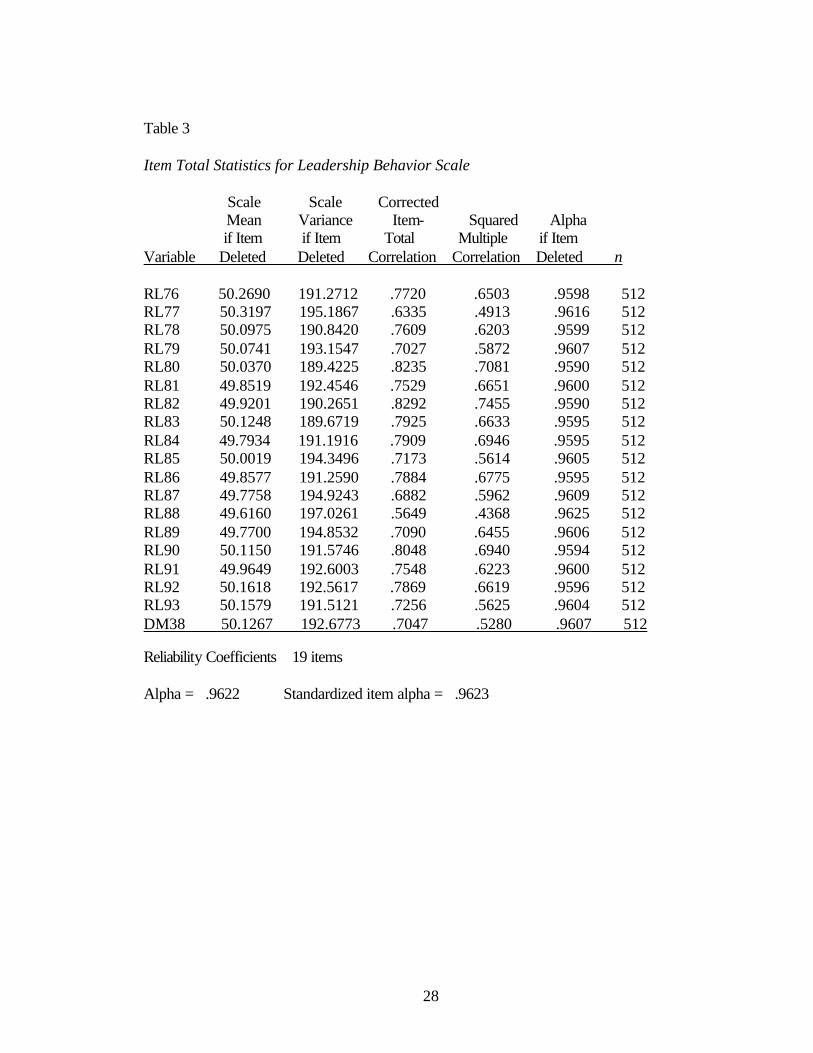

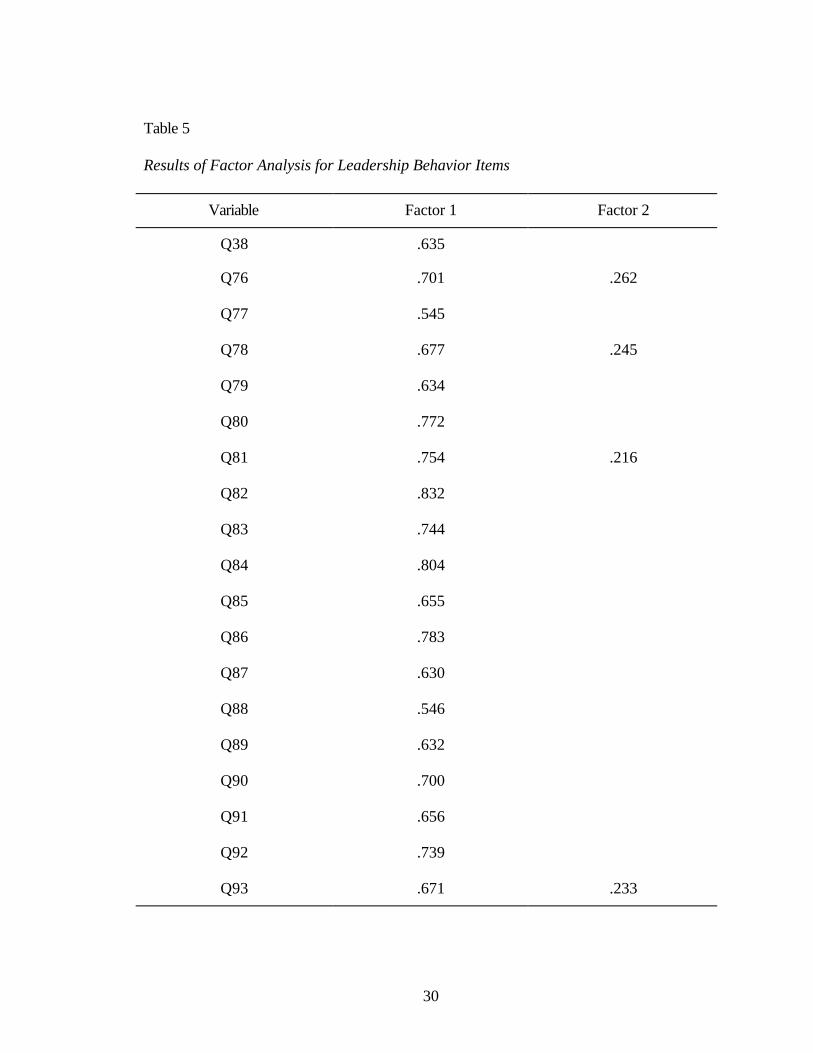


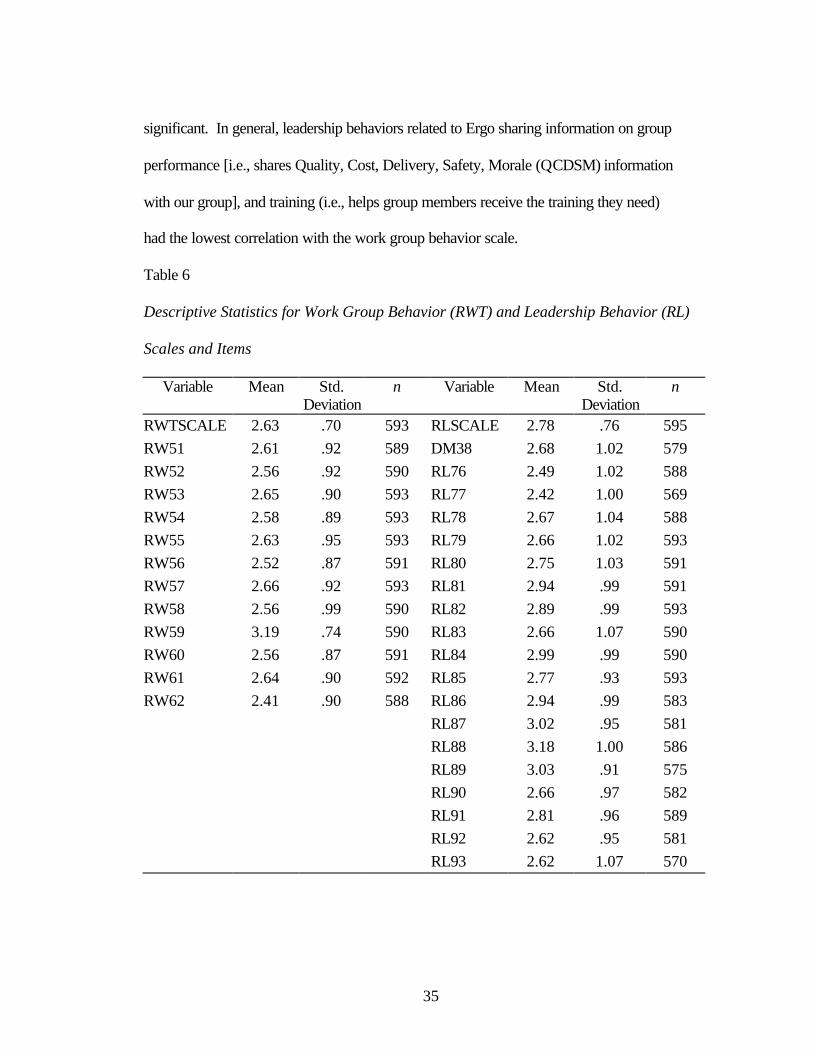
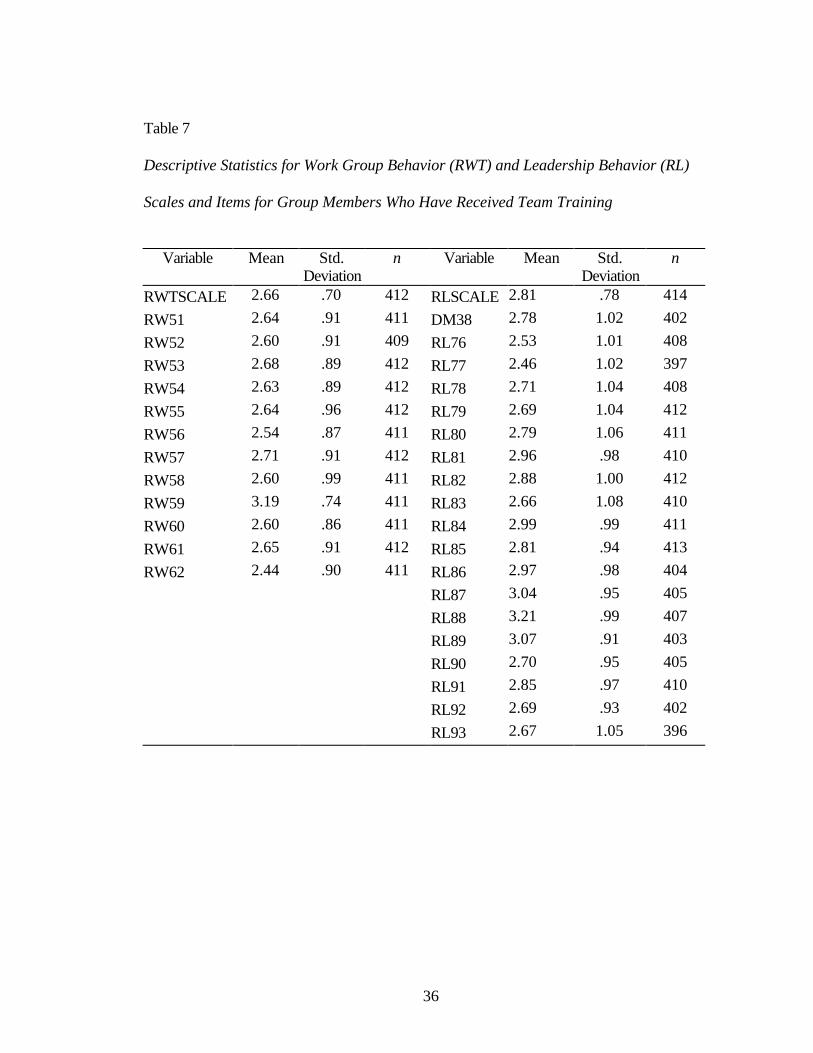
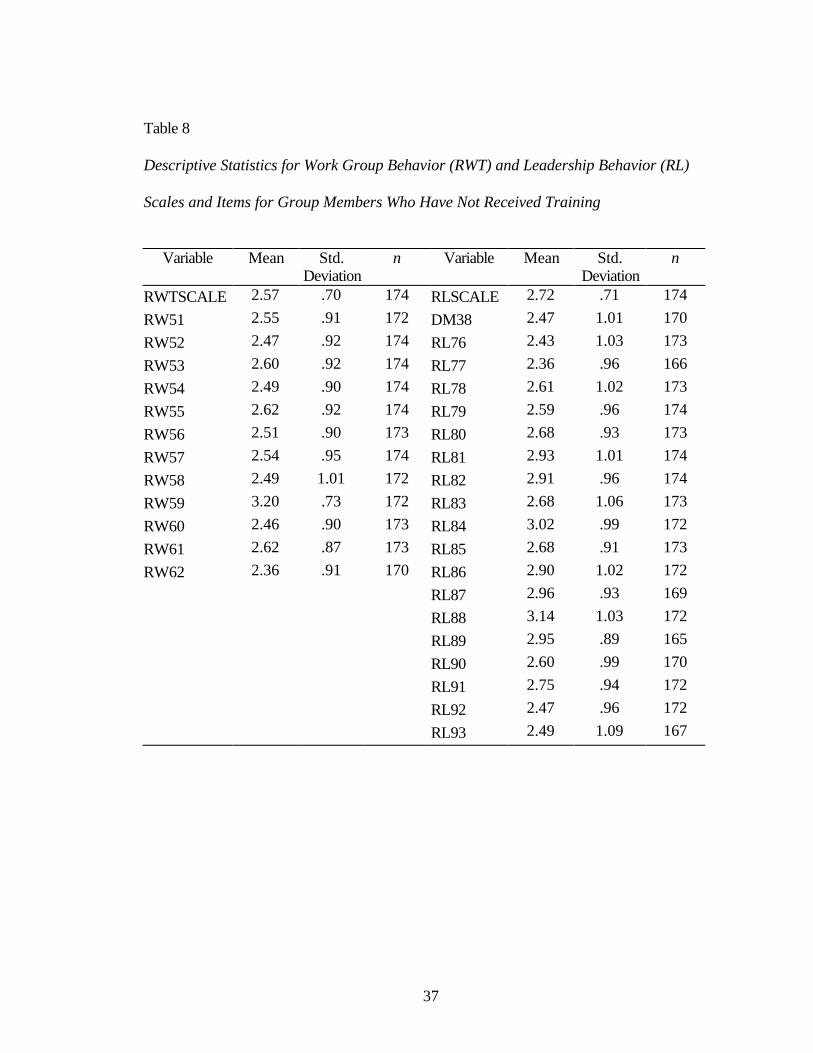

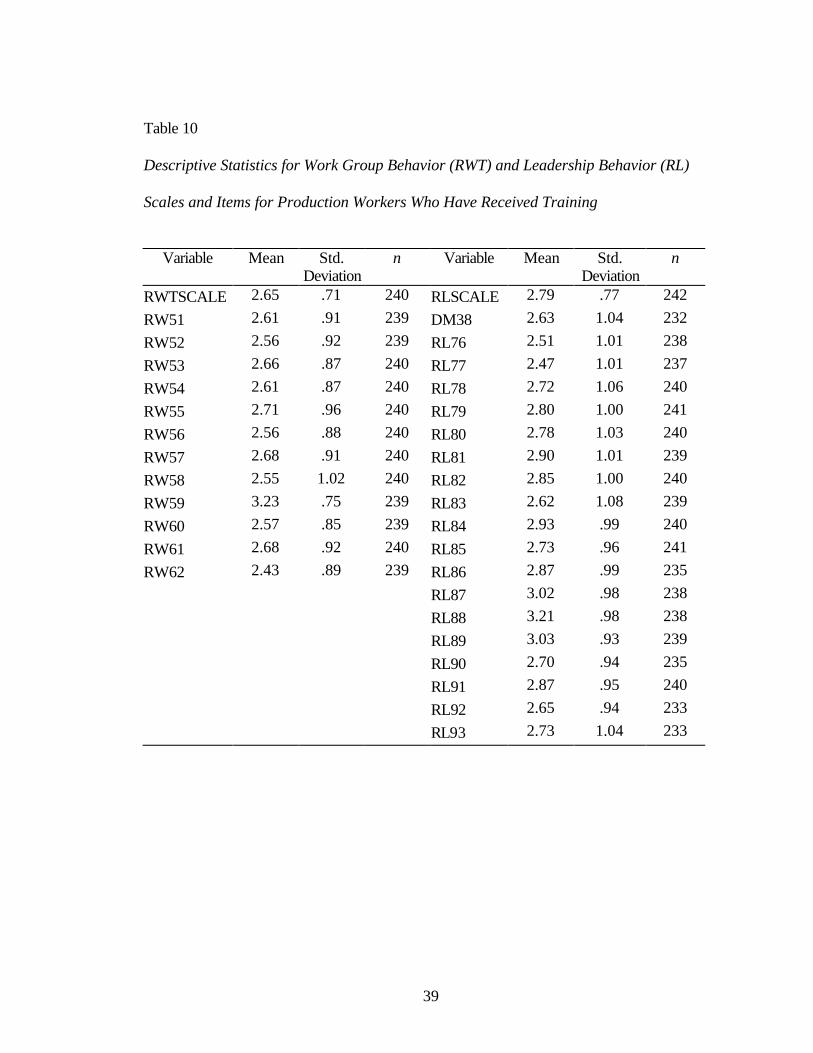
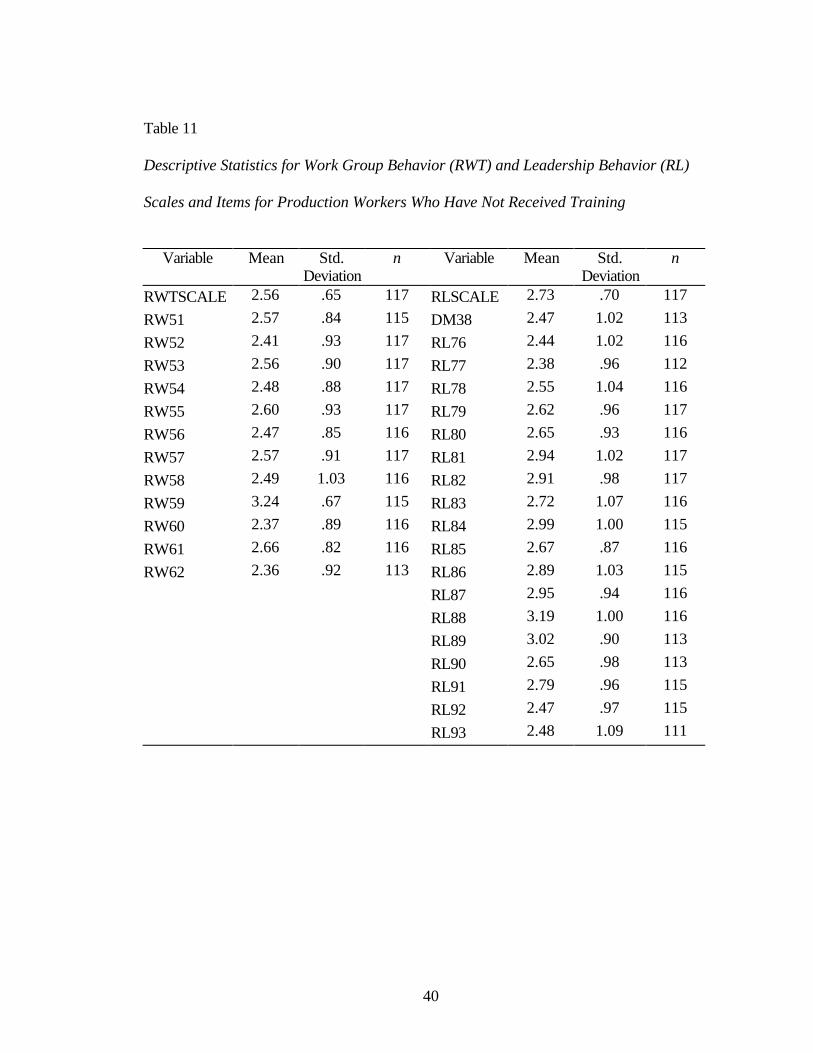

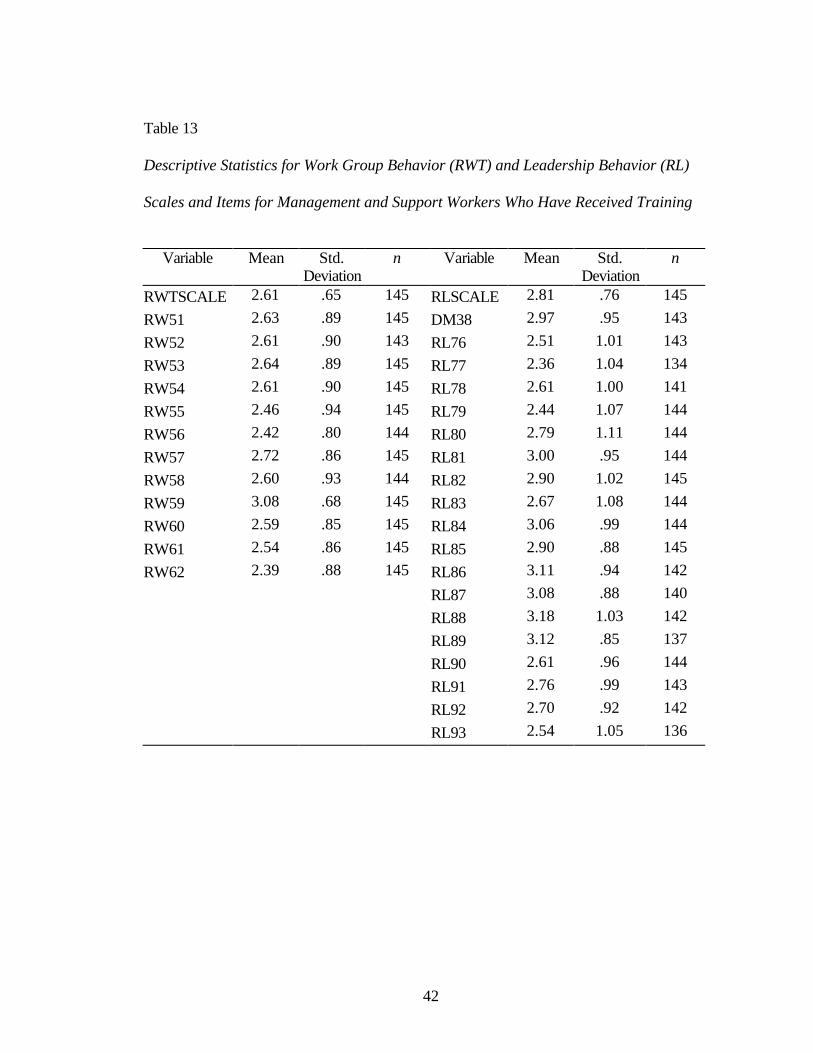
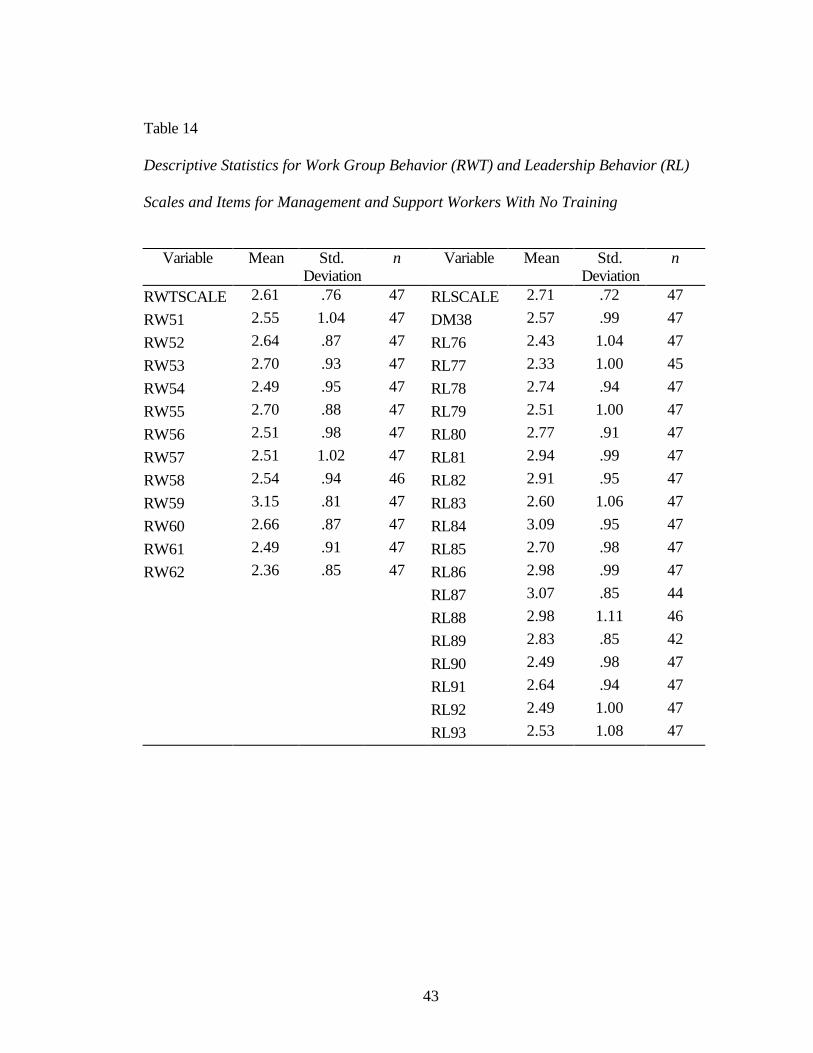


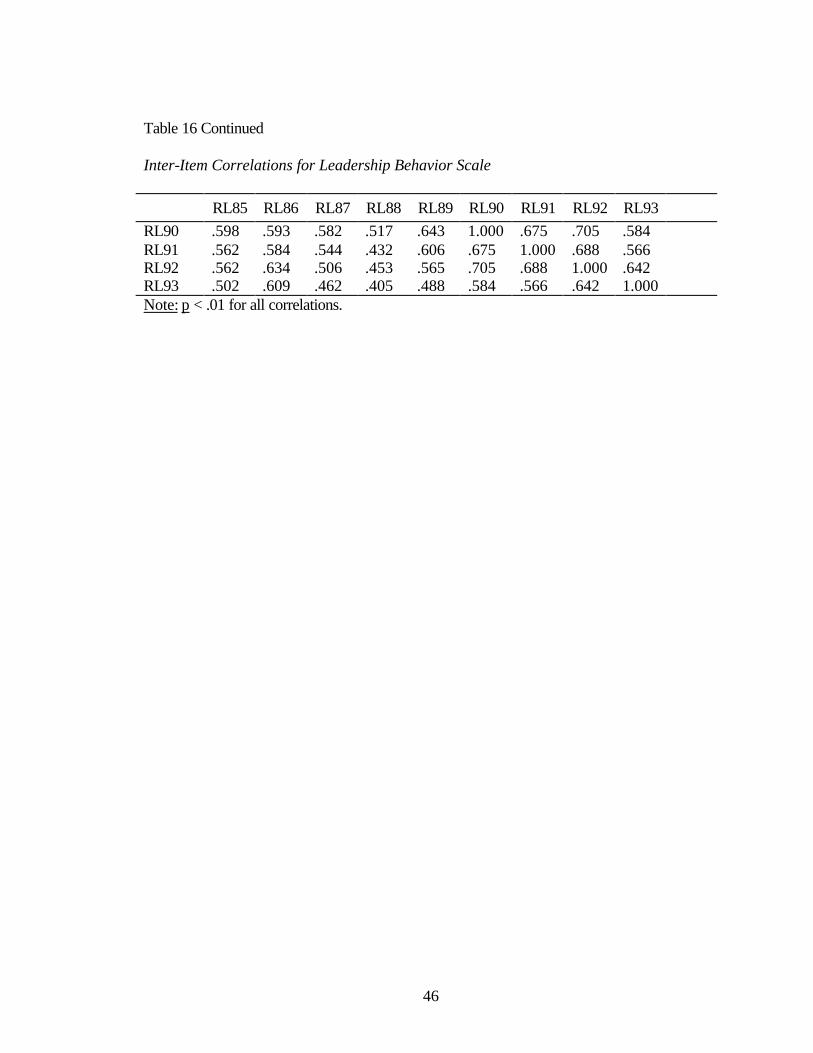

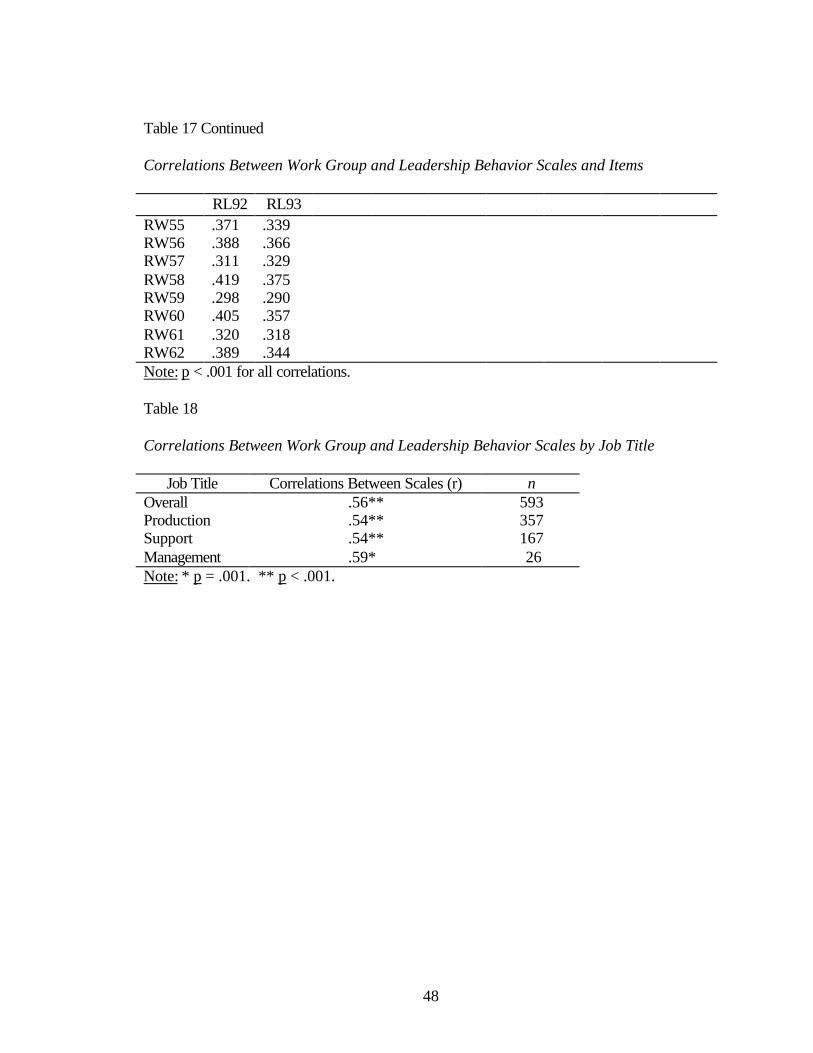
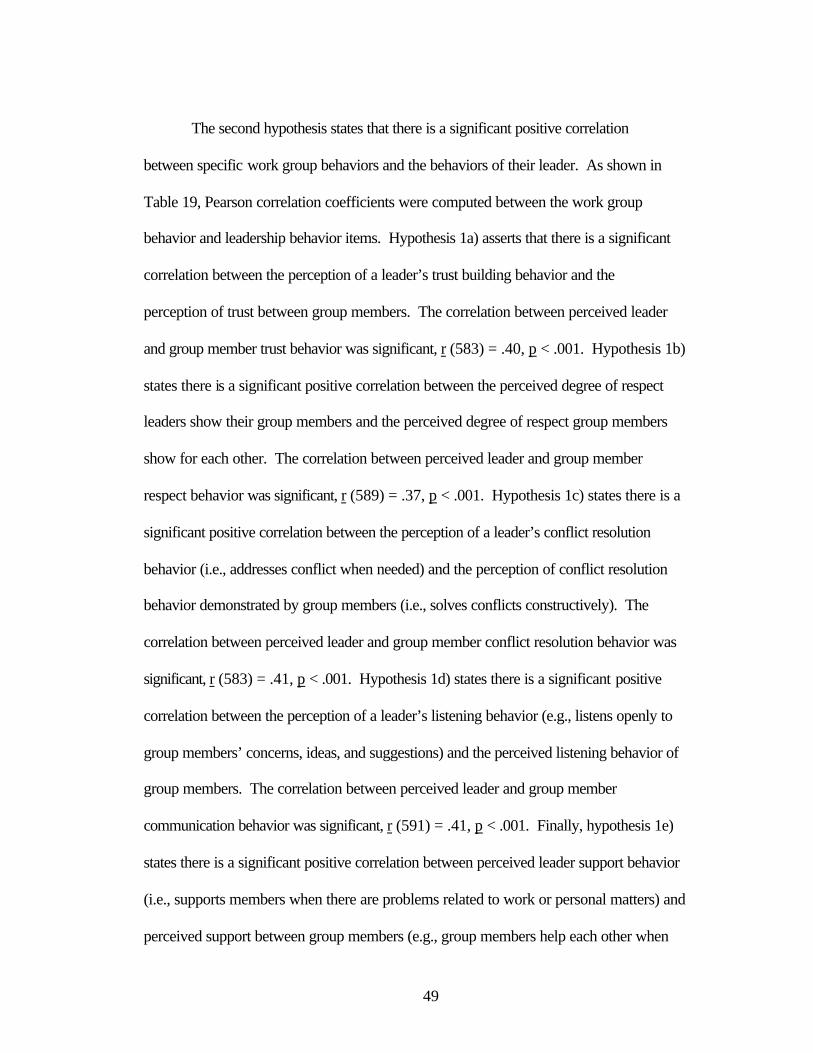
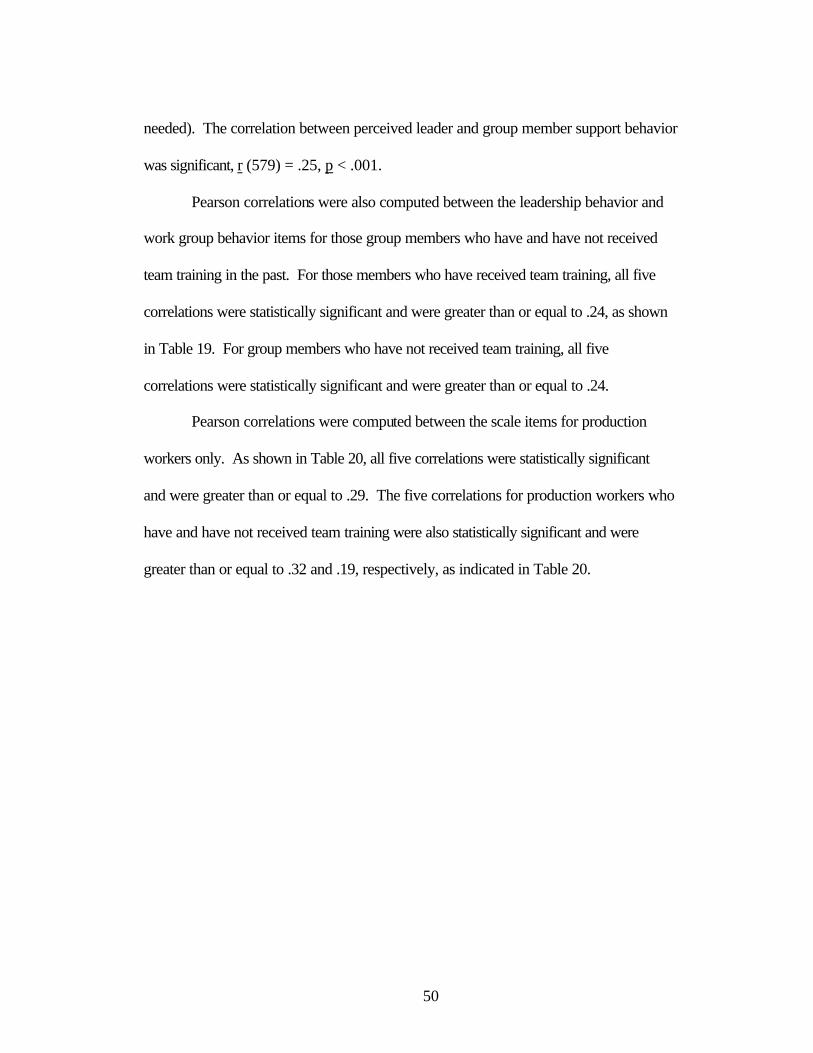

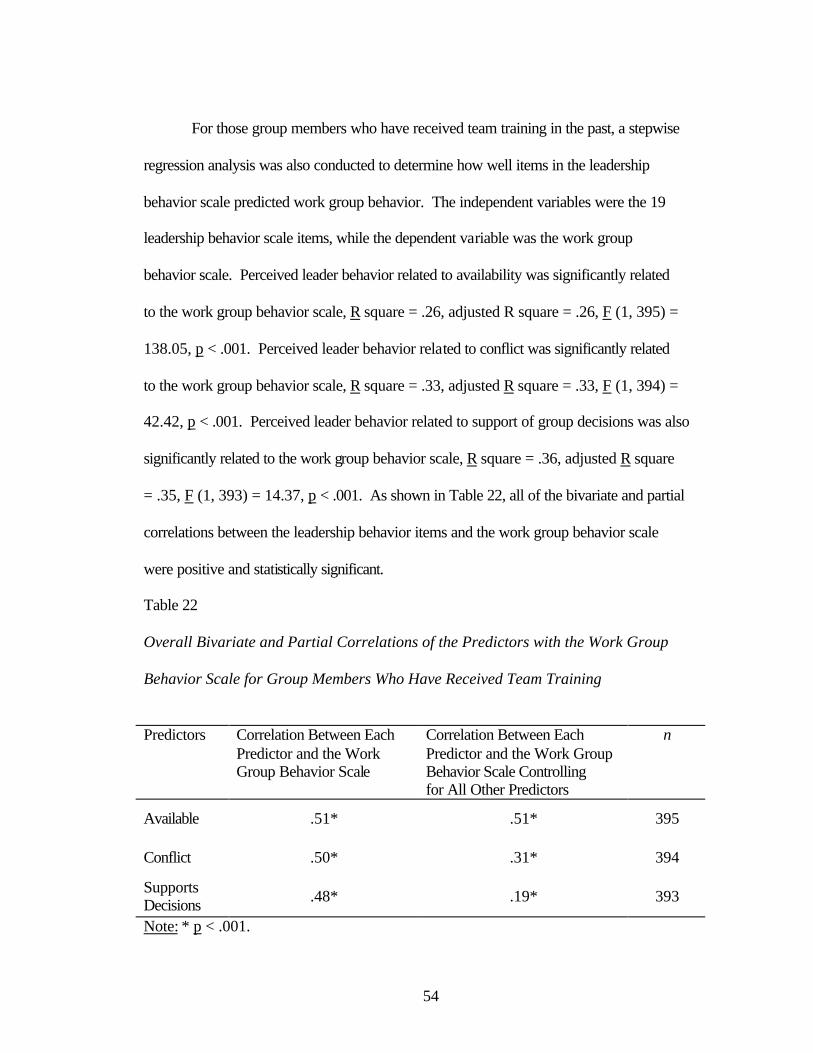
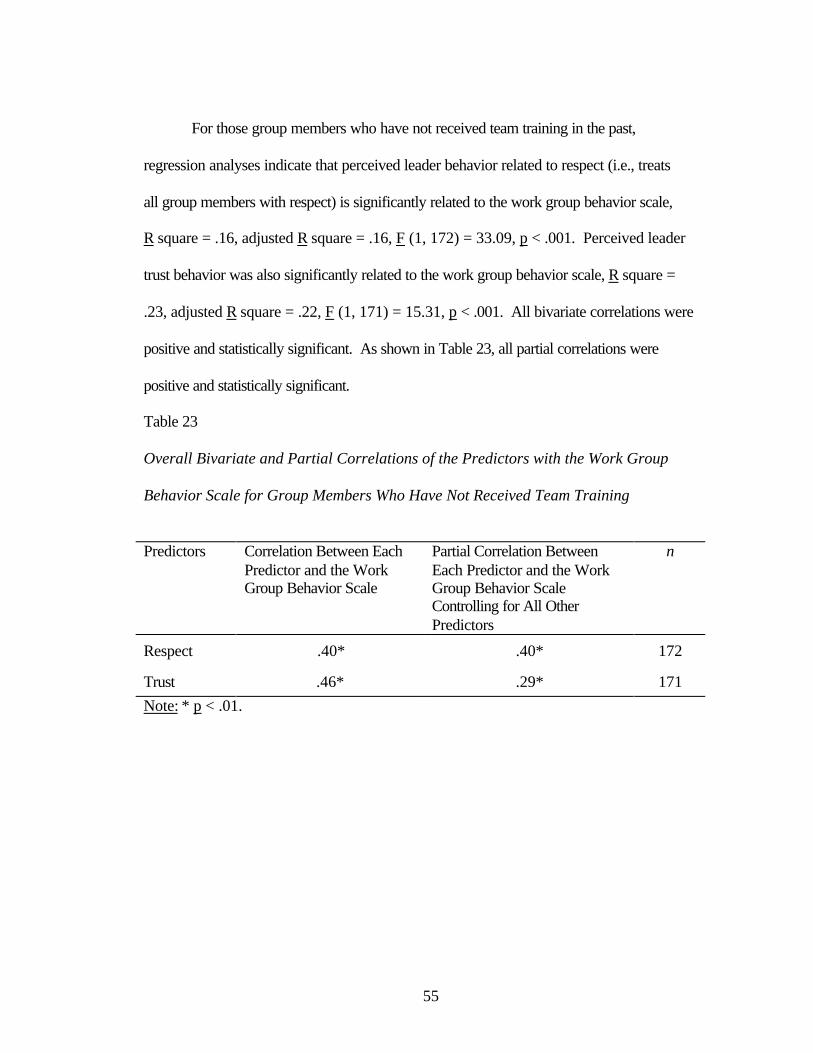
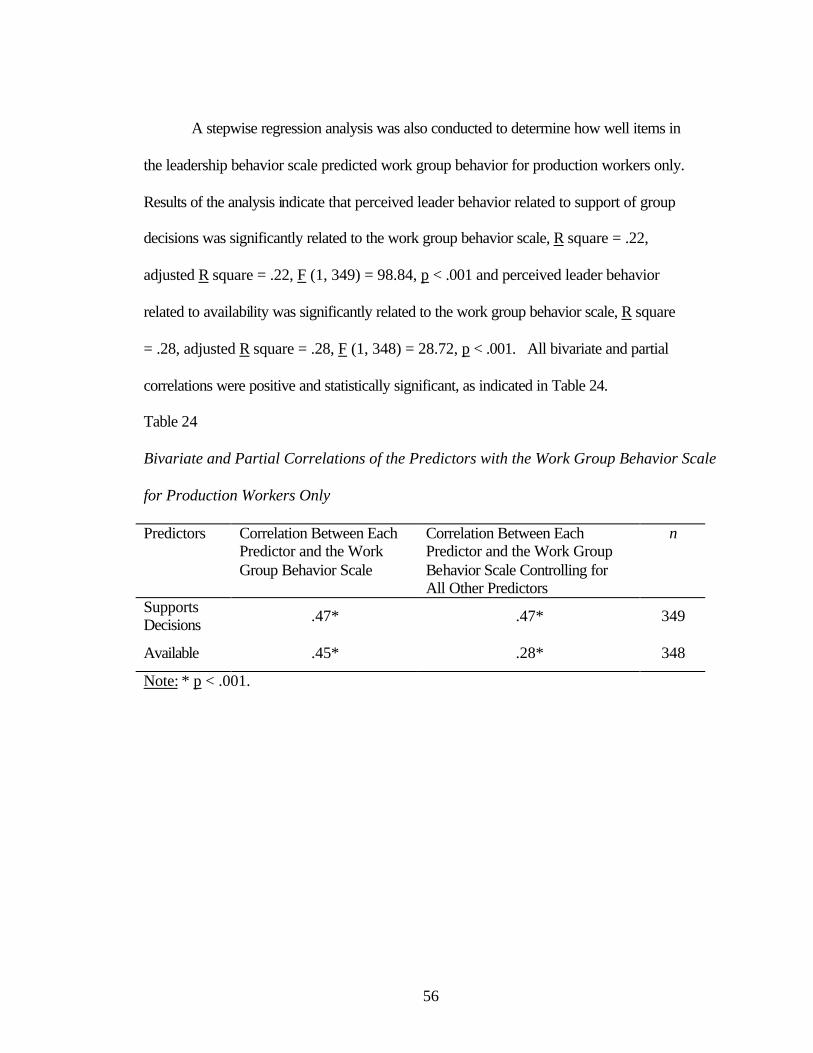
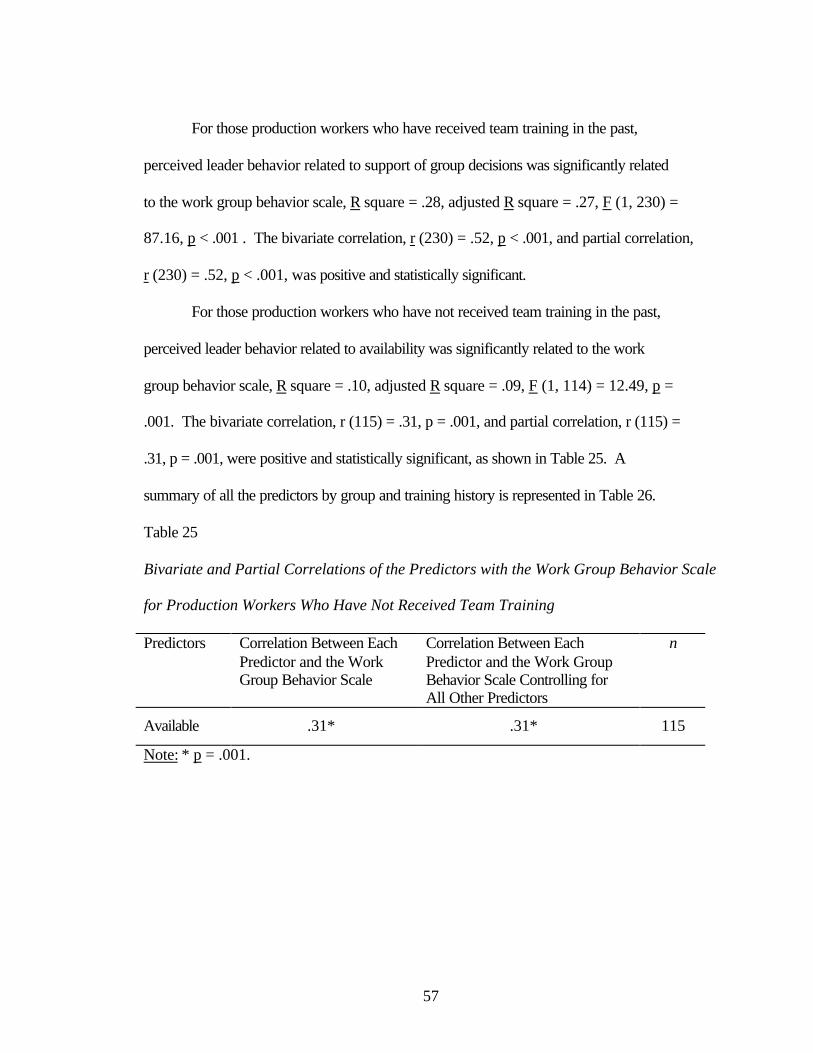
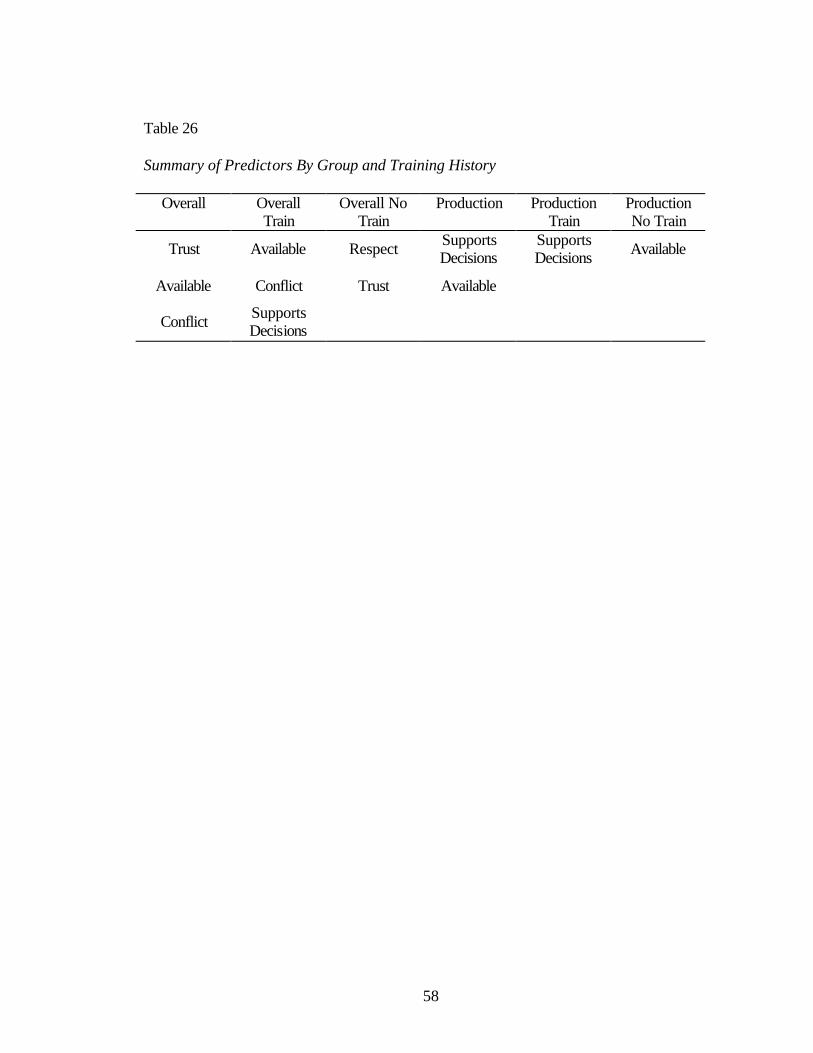


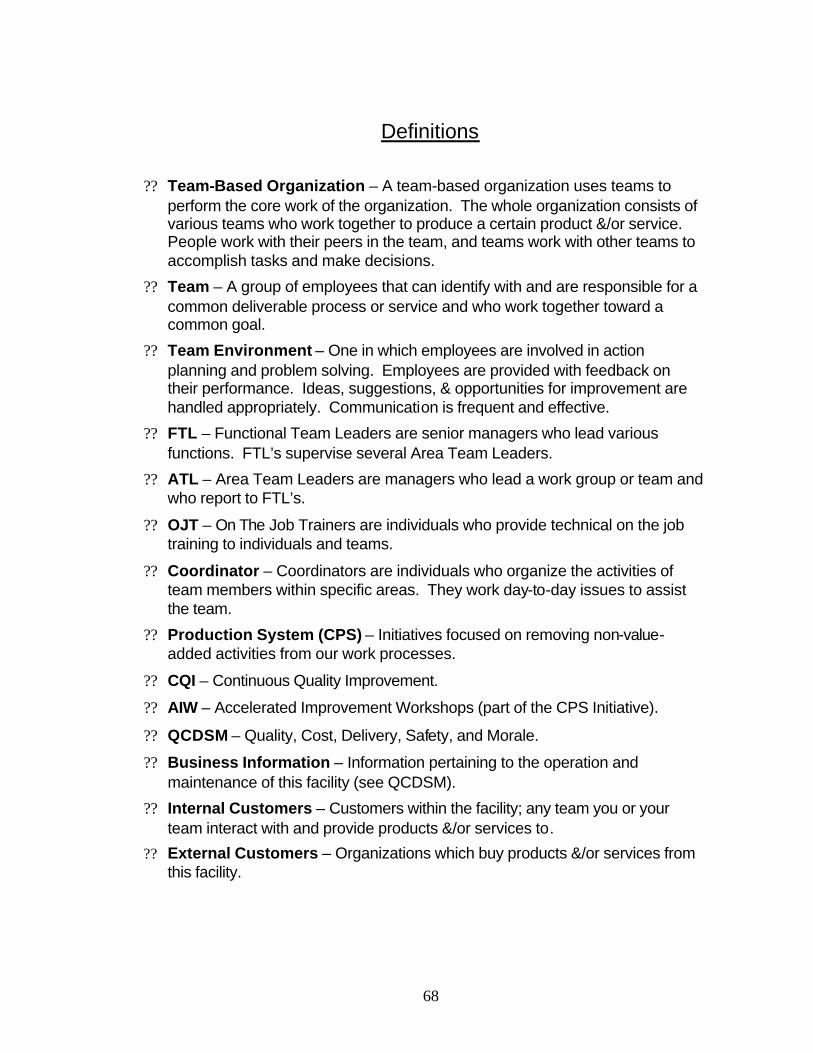
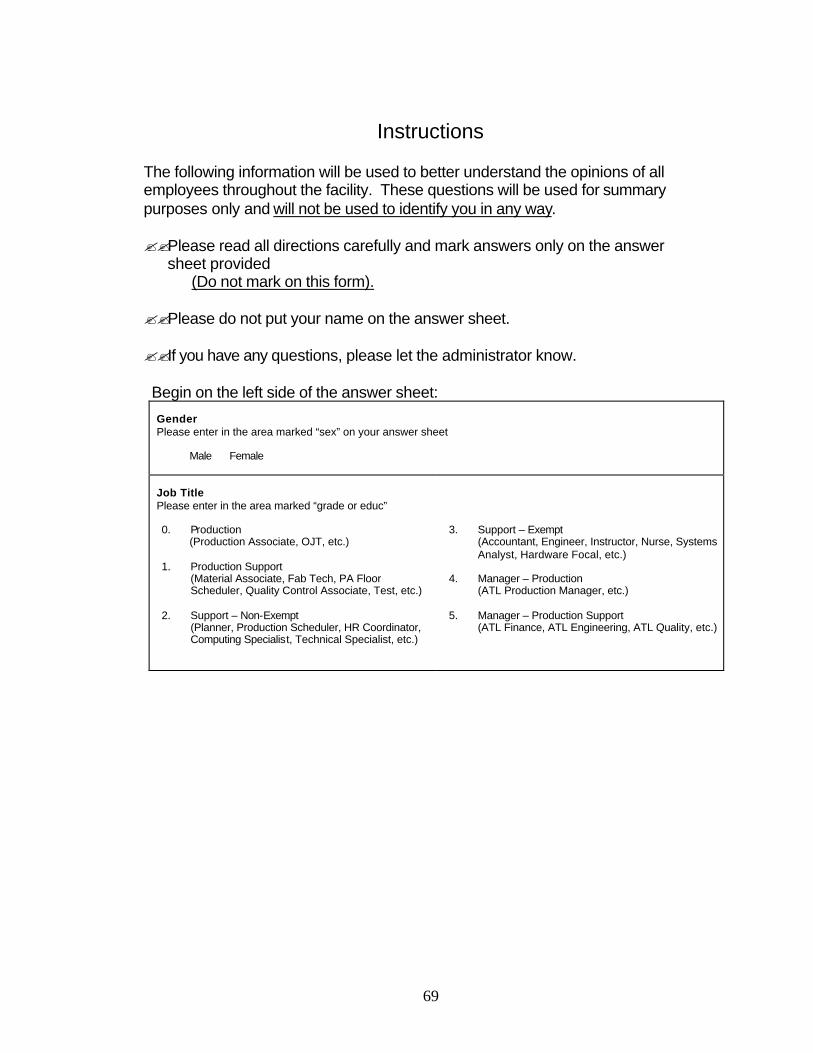

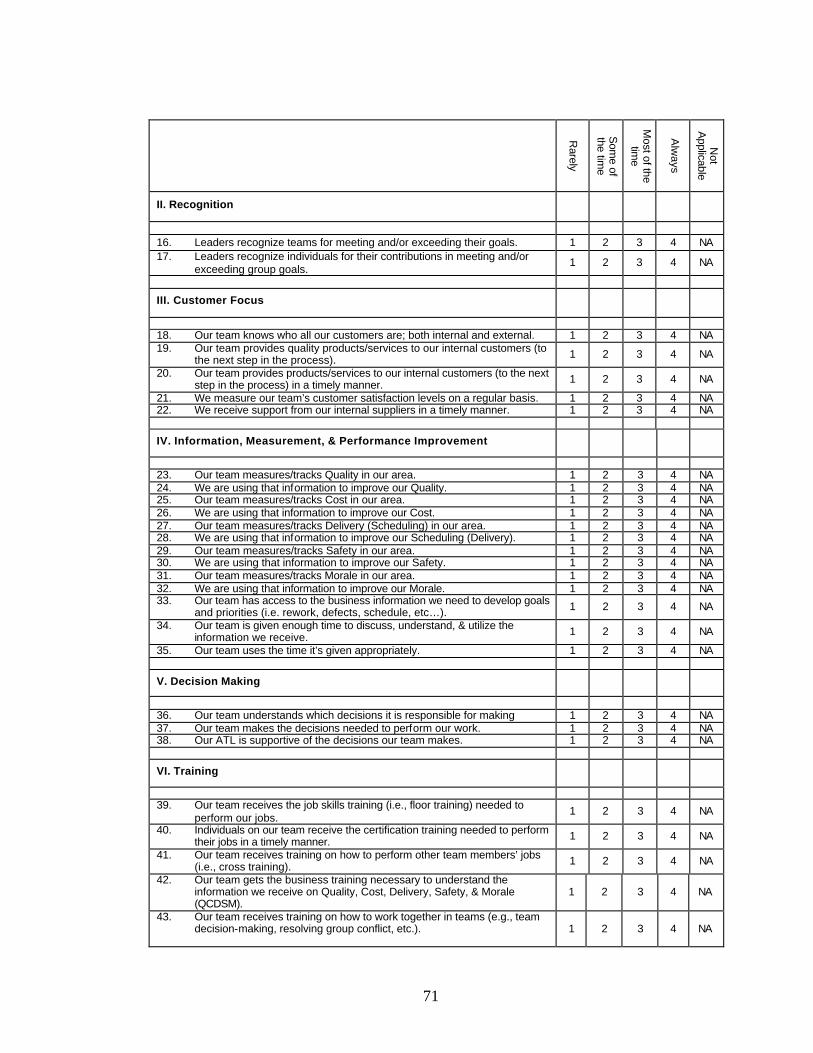
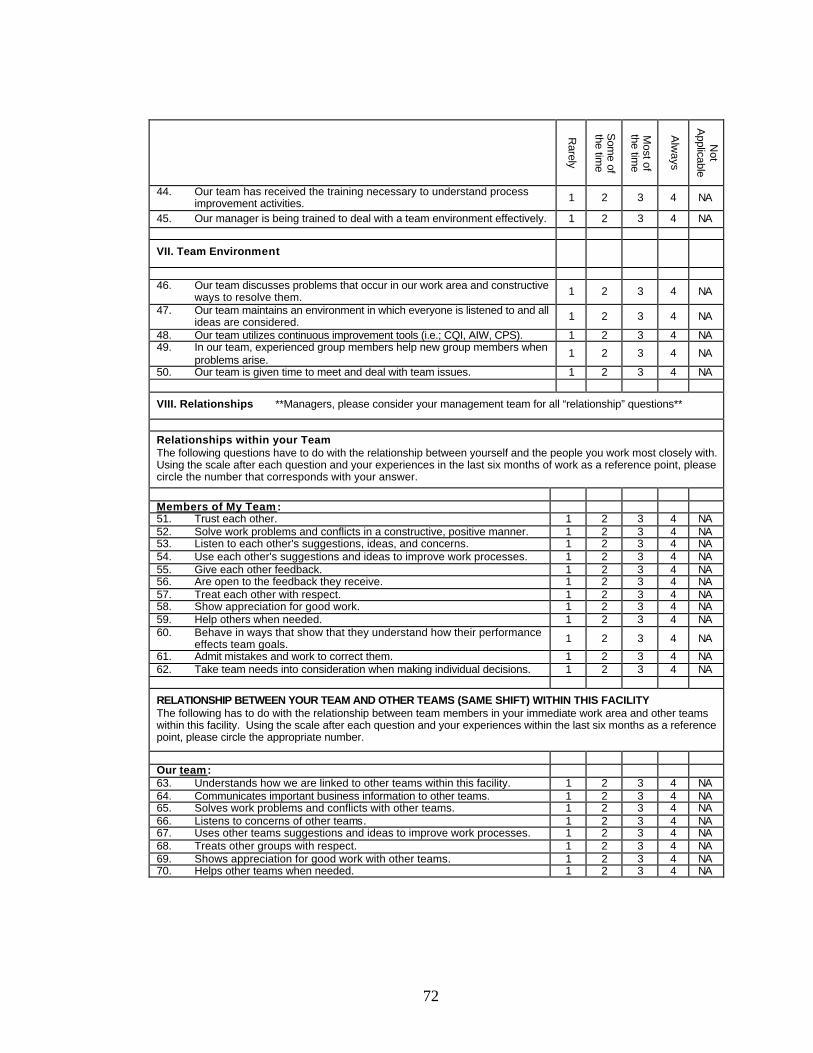
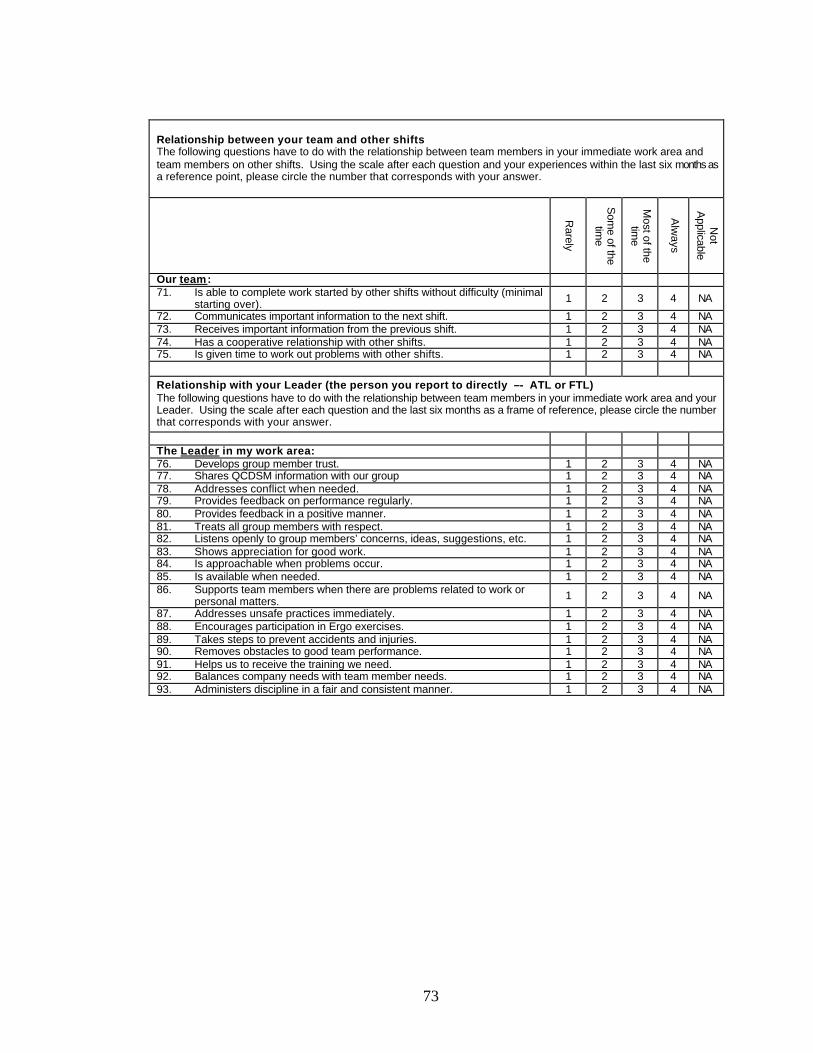
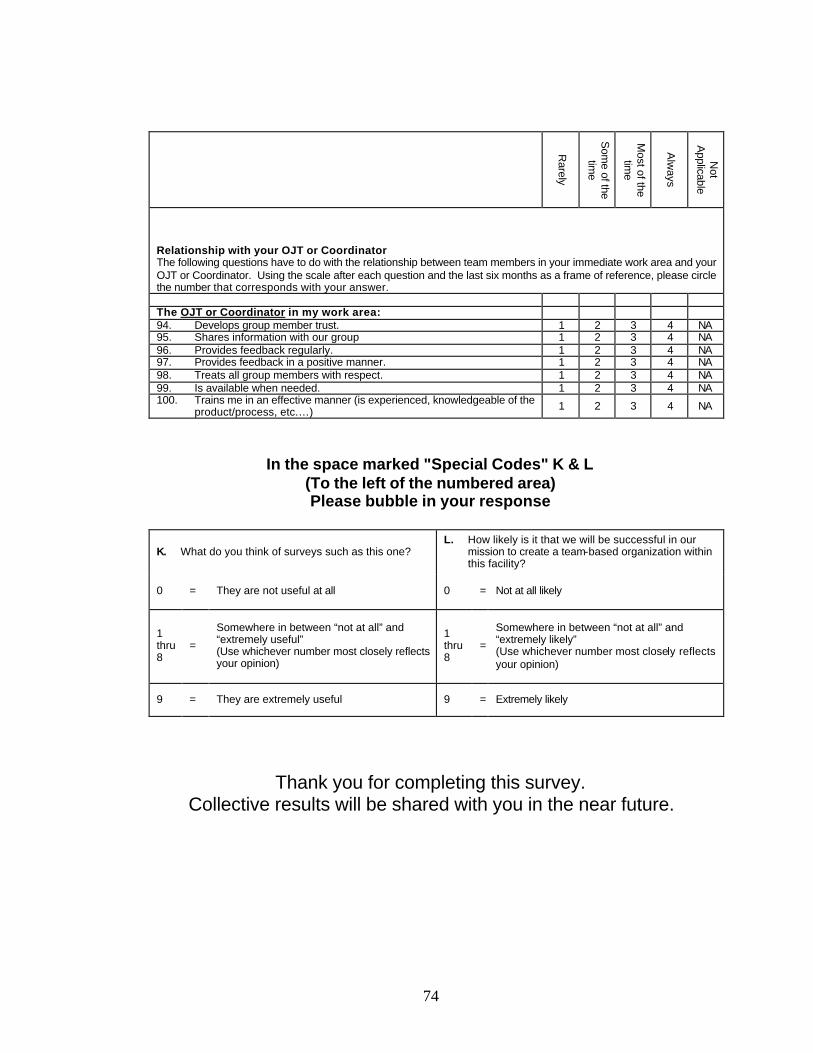


![Vicarious Liability 2018 [Read-Only]elderabuseconference.org/.../09/Vicarious-Liability... · Vicarious liability means that "a person is liable not because he personally committed](https://static.documents.pub/doc/80x56/5fa8c4e76b57ec4c3a35aefd/vicarious-liability-2018-read-only-vicarious-liability-means-that-a-person.jpg)


