166
2013 ANNUAL REPORT

2013ANNUAL REPORT
VICAT 2013 ANNUAL REPORT
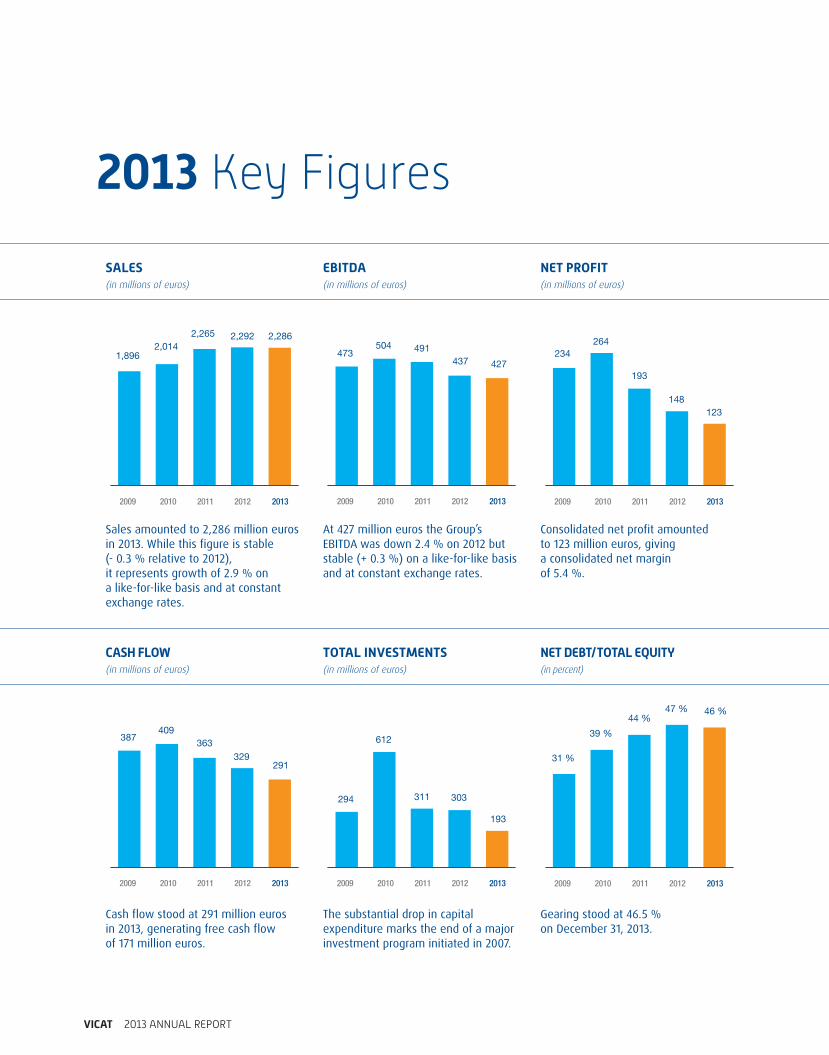
2013 Key Figures
SALES(in millions of euros)
2009 2010 2011 2012 2013
1,8962,014
2,265 2,292 2,286
Sales amounted to 2,286 million euros in 2013. While this figure is stable (- 0.3 % relative to 2012), it represents growth of 2.9 % on a like-for-like basis and at constant exchange rates.
EBITDA(in millions of euros)
2009 2010 2011 2012 2013
473504 491
437 427
At 427 million euros the Group’s EBITDA was down 2.4 % on 2012 but stable (+ 0.3 %) on a like-for-like basis and at constant exchange rates.
NET PROFIT(in millions of euros)
2009 2010 2011 2012 2013
234
264
193
148
123
Consolidated net profit amounted to 123 million euros, giving a consolidated net margin of 5.4 %.
CASH FLOW(in millions of euros)
2009 2010 2011 2012 2013
387409
363
329291
Cash flow stood at 291 million euros in 2013, generating free cash flow of 171 million euros.
TOTAL INVESTMENTS(in millions of euros)
2009 2010 2011 2012 2013
294
612
311 303
193
The substantial drop in capital expenditure marks the end of a major investment program initiated in 2007.
NET DEBT/TOTAL EQUITY(in percent)
2009 2010 2011 2012 2013
31 %
39 %
44 %47 % 46 %
Gearing stood at 46.5 % on December 31, 2013.

OPERATING REVENUE
51 %
15 %
34 %
15 %
33 %52 %
20122013
EBITDA
74 %
8 %
18 %
8 %
15 %
77 %
20122013
CAPITAL EMPLOYED
77 %
6 %
17 %
5 %
17 %
78 %
20122013
OPERATING REVENUE
38 %
18 %
20 %
14 %
10 %
19 %
16 %
8 %
39 %
18 %
20122013
EBITDA
37 %
27 %
20 %
15 %
1 %
21 %
19 %
-1 %
37 %
24 %
20122013
CAPITAL EMPLOYED
20 %
15 %
34 %
21 %10 %
36 %
21 %10 %
19 %
14 %
20122013
PER BUSINESS
PER GEOGRAPHICAL AREA
CEMENT CONCRETE & AGGREGATE OTHER PRODUCTS & SERVICES
FRANCE ASIAREST OF EUROPE UNITED STATES AFRICA & MIDDLE EAST

11BUSINESS LOCATIONS
THROUGHOUT THE WORLD
FRANCESWITZERLAND
ITALYUNITED STATES
EGYPTSENEGAL
MALIMAURITANIA
TURKEYKAZAKHSTAN
INDIA
7,657AVERAGE HEADCOUNT
€ 2,286 MSALES
€ 123 MCONSOLIDATED NET PROFIT
THE VICAT GROUP IN 2013 1Profi le 1Message from the Chairman 2Message from the Chief Executive Offi cer 3Strategic focuses 4Development & Innovation 6Governance & Shareholders 8Stock market & Financial information 9
CORPORATE SOCIAL RESPONSIBILITY 10
2013 BUSINESS 12France 14Europe 20United States 24Africa & Middle East 26Asia 30
FINANCIAL REPORT 37Comments on results and fi nancial position 38Consolidated fi nancial statements as of December 31, 2013 50Statutory fi nancial statements as of December 31, 2013 105
ENVIRONMENTAL AND SOCIAL RESPONSIBILITY 125
LEGAL INFORMATION 149
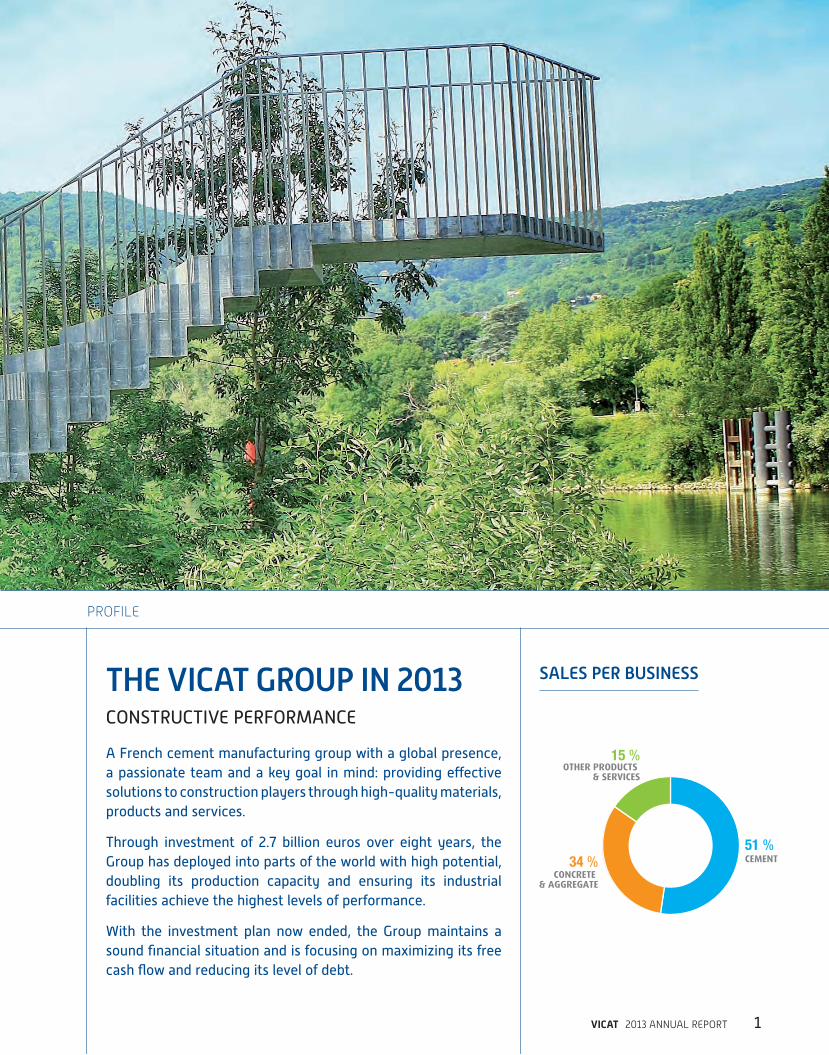
Beautiful Steps #7, a twisted staircase cantilevered out over the Saône River, was built with Vicat’s BCV high-performance concrete. It is the work of artists Sabina Lang & Daniel Baumann.
VICAT 2013 ANNUAL REPORT 1
PROFILE
THE VICAT GROUP IN 2013CONSTRUCTIVE PERFORMANCE
A French cement manufacturing group with a global presence, a passionate team and a key goal in mind: providing eff ective solutions to construction players through high-quality materials, products and services.
Through investment of 2.7 billion euros over eight years, the Group has deployed into parts of the world with high potential, doubling its production capacity and ensuring its industrial facilities achieve the highest levels of performance.
With the investment plan now ended, the Group maintains a sound fi nancial situation and is focusing on maximizing its free cash fl ow and reducing its level of debt.
SALES PER BUSINESS
51 %CEMENT
CONCRETE & AGGREGATE
OTHER PRODUCTS & SERVICES
15 %
34 %

VICAT 2013 ANNUAL REPORT2
“VICAT IS TACKLING THE FUTURE AND ADVANCING WITH CONFIDENCE”
MESSAGE FROM THE CHAIRMANJACQUES MERCERON-VICAT
A period of intensive capital investment came to an end in 2013. It
started in 2006 with the Performance 2010 plan, the main achievements
of which were the construction of new kiln lines at Ba ta in Turkey,
Sococim Industries in Senegal, and Sinai Cement Company in Egypt,
an increase in kiln capacity for Vigier in Switzerland, and installation of
a new cement mill at Montalieu in France. The Group also set foot in
Kazakhstan, building a cement plant between Almaty and Astana, and
in India, where it acquired a company in the State of Andhra Pradesh,
Bharathi Cement, and built a cement plant in Karnataka.
Last April, the Vicat Sagar plant came on line and is gradually ramping up
production. Cost prices are excellent.
These achievements have resulted in a doubling of the Group’s cement
production capacity which now stands at 30 million metric tons per year.
2013 was marked by a succession of crises and difficulties, including
political instability in Egypt, a drop in cement sales in France, the start-up
of a new cement plant in India, much greater tax pressure, and large
fluctuations in exchange rates. However, these negative aspects were
offset by sound business in Switzerland, Turkey, and Kazakhstan, with
the result that our EBITDA is at much the same level as in 2012, on a
like-for-like basis and at constant exchange rates.
It is worthy of note that the Group’s presence in different countries on
different continents spreads risks and helps maintain very respectable
results for a period of crisis.
The year ahead is expected to be one of improvement. Not only will
businesses that performed well in 2013 continue to prosper, but business
in India should continue to grow, penetrating new markets, and results
in Egypt too are likely to improve. The priority objectives for this year are
gradual marketing of spare cement capacity, a rise in selling prices, and
reduction of debt.
Vicat is tackling the future with confidence, advancing in accordance with
its motto, ‘like mountain troops, with small, quick steps’.
I chose to cease my position as Chairman of the Group as of the end
of the 2014 annual general meeting. It is with considerable emotion
that I look back over the last 50 years and think of all the employees
with whom I have worked. I wish to thank them for the confidence they
showed me throughout those many years of both difficulty and success.
I also wish to thank the staff representatives with whom I have enjoyed
constructive relations of the highest quality, and the members of the
Board of Directors I have been honored to chair for 30 years. My thanks
also go to our shareholders, for their confidence and loyalty.
In March the Board of Directors adopted my proposal to appoint
Mr. Guy Sidos Chairman, in addition to his responsibilities as CEO, as of
the end of the AGM. I have every confidence that at the head of the Vicat
Group he will ensure the success of future development and economic
performance.
VICAT 2013 ANNUAL REPORT 3
THE VICAT GROUP IN 2013
The economic and political environment affecting the eleven countries
in which Vicat performs business delayed realization of the Group’s
potential in 2013.
Contrasting results across countries in 2013
The performance of subsidiaries in Switzerland, Turkey, Mauritania, and
Kazakhstan was remarkable. In France, at the price of reductions in
investment and recruitment, the operational efficiency of our subsidiaries
restricted the impact of a governmental policy which has proved to be
dissuasive for construction, and attenuated the consequences of recent
tax measures, the net cost of which for the Group exceeds eight million
euros nonetheless. In Senegal, Mali, and India, competitive pressure
on selling prices was not completely offset by cost reductions. In the
United States, although economic recovery is brisk, the starting point
was way down low. And lastly, political restlessness in Egypt prompted
an insecurity which affected the operation of the plant up to the end of
the year, after which normal conditions resumed.
2013 consolidated accounts affected by exchange-rate effects
The appreciation of the euro against other currencies was detrimental
to the Group’s operational profitability in 2013. However, our profitability
remained practically stable at constant exchange rates. This stability
demonstrates the validity of the Group’s strategy for development
in cement production, our core business, which represents close to
77 % of our operational profitability, and our strategy for geographical
diversification which helps compensate underperformance in one
country with the stronger performance of another.
2013 was a pivotal year for Vicat
Though bumpy, 2013 was also a pivotal year for Vicat: the Group
possesses modern facilities capable of producing 30 million tons of
cement per year as of now; integration into ready-mixed concrete and
aggregate is coherent; other businesses – major works, precasting,
transport, paper, and construction chemicals – are all making positive
contributions to our results; and at the end of a cycle of substantial
investment, the Group’s balance sheet is sound and its level of debt
is dropping. Our ongoing research drive has produced cements with
interesting new properties.
These results were achieved through the quality and commitment of
the men and women serving the Group. I wish to thank them all most
sincerely.
2014 anchored in the future
With the strong benefits of the value of the workforce and their
commitment to customer service, the quality of its offering, and the
expediency of its strategy, the Group is tackling 2014 with confidence.
In its continued drive forward, in 2014 the Vicat Group will pursue
further reductions in debt, improvements to industrial and commercial
efficiency, and promotion of innovations resulting from its R&D initiatives.
2014 will see the Vicat Group draw the benefits of its past investments
and face the future serenely.
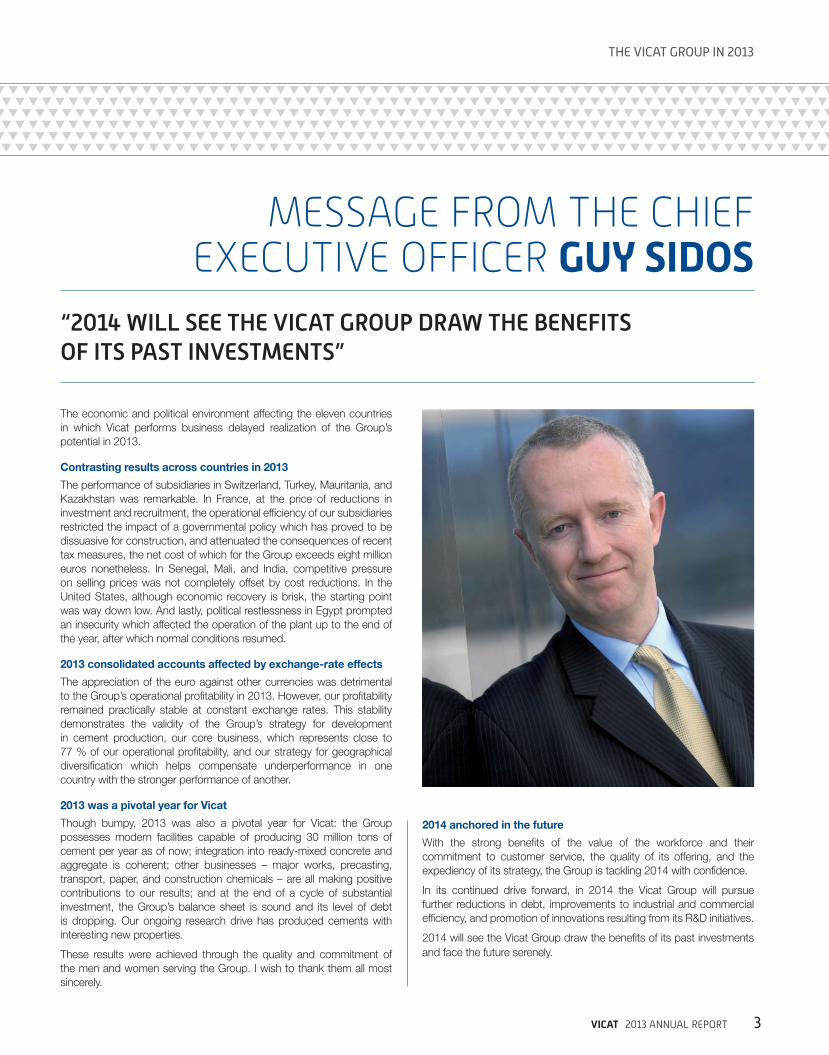
“2014 WILL SEE THE VICAT GROUP DRAW THE BENEFITS OF ITS PAST INVESTMENTS”
MESSAGE FROM THE CHIEF EXECUTIVE OFFICER GUY SIDOS
VICAT 2013 ANNUAL REPORT4
STRATEGIC FOCUSES
CONTROLLED GROWTH
The Group’s long-term priority is to achieve controlled expansion
across all business lines, through a finely balanced combination of
strong organic growth underpinned by a policy of targeted growth
by acquisition.
Internal growth is driven by industrial investment for modernizing
production capacity to meet market and customer demand and
by research and innovation for expanding our product range and
enhancing product quality.
The external growth policy is selective. Its aims are to tackle new
markets with attractive growth potential and to consolidate the
Group’s presence on its current markets through vertical integration.
This growth policy can be applied to existing businesses if the
business opportunity matches the development objective the Group
has set, or to the construction of new (greenfield) cement plants on
markets with strong growth. This was the case for Kazakhstan and
India.
This growth remains in all respects consistent with the size of the
Group and its financial and operational capacity to absorb the
investment. The purpose of growth is to create value for shareholders
and, through its profitability, allow the Group to expand even more.
BUSINESS-SPECIFIC DEVELOPMENT: EXPERTISE AND INNOVATION SERVING CUSTOMERS
The Group focuses primarily on its historical area of expertise,
cement, and expands into the ready-mixed concrete and aggregate
markets through vertical integration in order to secure access to
cement consumption markets.
Cement, the Group’s core business, underpins profitability. Cement
is a bulk product of a heavy industry for which quality is an essential
criterion.
Development of the ready-mixed concrete business is a function
of the maturity of markets and the degree to which construction
contractors integrate industrial concrete production. The objective is
to establish a network of concrete batching plants around cement
plants and near consumption centers, by building new plants or
acquiring existing companies active in this market.
The Group’s presence in the aggregate sector is intended to
provide a global response to its customers’ construction materials
requirements and to provide secure supplies of aggregate for
development of the ready-mixed concrete business.
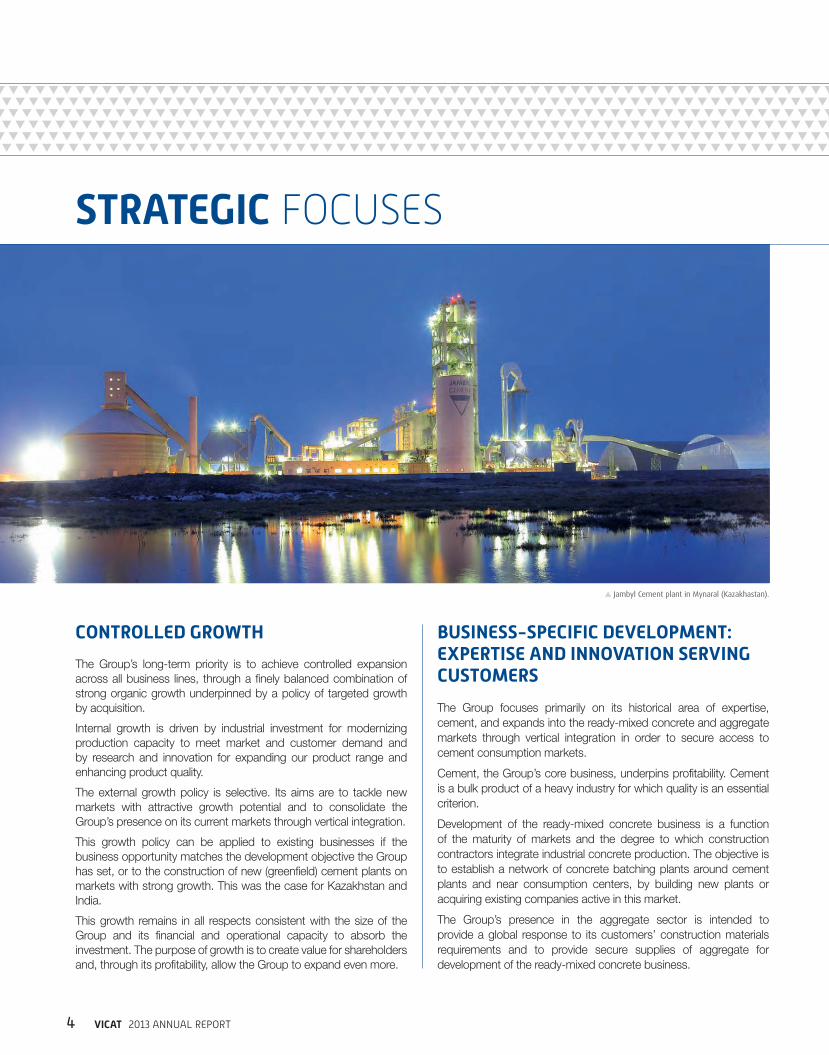
Jambyl Cement plant in Mynaral (Kazakhastan).

VICAT 2013 ANNUAL REPORT 5
Concrete privacy panels for gardens, manufactured by Creabeton Matériaux (Switzerland).
THE VICAT GROUP IN 2013
IMPLEMENTATION OF THE GROUP’S STRATEGY
The well-balanced strategy adopted by the Group in the past
has enabled it to stand firm in today’s ongoing unfavorable
macroeconomic climate.
New cement plants were successfully built in Kazakhstan and India
as a result of a sound financial situation, with levels of gearing and
leverage among the lowest in the industry.
The Group is now aiming to gradually increase the utilization rate of
its production facilities to benefit from a volume effect, without any
additional investment. Achieving this objective, which will generate
free cash flow, will help reduce the debt to which the Group
committed in 2013.
With a stronger financial position and a larger Group, further
external growth operations can be envisaged, subject to the
two consequences of contributing to growth and profitability
and extending the coverage of risk.
It expands in the Aggregate business through acquisitions and
capital investment aimed at both increasing the capacity of existing
facilities and opening up new quarries and other installations.
The Group also has a number of complementary businesses on
some markets, such as precast concrete products in Switzerland,
transport in France, and bag production in France and in India,
through which it supports its product offering and strengthens its
regional positioning.
BALANCED GEOGRAPHICAL DEVELOPMENT
The Group currently operates in eleven countries. It generates 63 %
of its sales outside France: nearly 19 % in the rest of Europe, 10 %
in the United States, and 34 % in emerging countries (Egypt, Mali,
Mauritania, Senegal, Turkey, Kazakhstan, and India).
The percentage of Group sales generated outside France, and
especially in emerging economies, is expected to keep growing in
the years ahead as a result of the increased production capacities of
existing plants and the increased utilization rate of the new production
facilities built in recent years.
The Group’s strategy is designed to diversify its geographical
exposure and to spread risk judiciously through a combination of
investment in developed countries, which generate a steadier stream
of cash flow, and in emerging countries which, while offering greater
potential for long-term growth, may be exposed to stronger market
fluctuations.
63 % Share of sales generated outside France
34 % Share of sales generated in emerging economies

VICAT 2013 ANNUAL REPORT6
DEVELOPMENT & INNOVATION
PRIORITY FOR CONSTRUCTIVE SOLUTIONS AND PROCESSES
All product design, development, and follow-up research
operations at Vicat are concentrated within the Louis Vicat
technical center in L’Isle d’Abeau, near Lyon.
The center, which opened in 1993, is located in the heart of the
Rhône-Alpes region, close to the Group’s historic facilities in Grenoble
and to the emblematic Montalieu cement plant. It is staffed by some
90 scientists and technicians working in three laboratories:
5 the materials and microstructures lab which analyses materials;
5 the Sigma Béton lab which checks aggregate and formulates and
checks concrete mixes;
5 the laboratory for formulating industrial products for the building
industry, which develops mixes for finishing products.
The main R&D topics are aimed at anticipating or meeting the
demands of customers and the evolution of building standards.
The Group regularly files for patents to protect the development of
products derived from its R&D drive.
Research and development expenditure amounted to
6,401,000 euros in 2013 (note 4 in appendix to consolidated
accounts).
RESEARCH INTO PROCESSES
Improving the energy efficiency of cement plants and replacing
fossil fuels with substitute fuels are means of implementing a
circular economy and reducing CO2 emissions through increased
use of biomass fuels. In 2013, the use of substitute fuels saved
the equivalent of 430,000 metric tons of coal. Close cooperation
between R&D teams and plant operation teams meant the change of
energy type was made without any negative effect on the quality of
the cements produced.
More recently, new lines of research have been engaged. They
concern the development of new cements which, with equivalent
mechanical properties, will result in lower CO2 emissions. This
issue, which is fundamental for the future of the industry, is part of
the Group’s ambition to contribute towards collective environmental
action. It mobilizes considerable human resources in the fields of
crystallography, heat effects, and admixtures. Equipment using the
very latest technologies has been made available for this research,
including diffractometers, X-ray fluorescence spectrometry, and field-
emission scanning electron microscopy. This research has already
led to industrial production of a new cement, Alpenat®, in the first
half of 2013. The cement is currently subject to further testing by
the Cement and Concrete R&D teams which now form part of the
new R&D Department set up in order to accelerate marketing of new
products.
CONSTRUCTIVE SOLUTIONS
New concretes are regularly being developed to meet the expectations
of customers in construction and civil engineering. Today’s concretes
have seen several technological breaks from the past, including self-
consolidating concretes whose hyperfluidity allows them to flow
smoothly into complex formwork. The development of high, then very-
high-performance concretes (HPC and VHPC) and, more recently,
ultra-high-performance fiber-reinforced concrete (UHPFRC) has
multiplied the strength of the material tenfold (200 MPa compressive
strength). These concretes meet the construction requirements for
tall buildings and other structures with increasingly high demands,
while giving practically free rein to architectural creativity. Preparation of fused beads for X-ray fluorescence examination in the materials
and microstructures laboratory at the Louis Vicat technical center in L’Isle d’Abeau (France).
VICAT 2013 ANNUAL REPORT 7
THE VICAT GROUP IN 2013
Changes to thermal design codes are taken into account. Research
in respect of this aims to determine very precisely how concrete
contributes to the development of new constructive solutions for
greater energy efficiency in buildings. Codes for calculating the
thermal inertia of concrete are being developed under a joint research
program with the French solar energy institute and atomic energy
commission (INES/CEA) in Chambéry. The concrete research and
development laboratory is also working on structural concrete with
inherently insulating properties which will dispense with the need for
independent insulation.
5 An offering for eco-construction based on natural cement (quick-
setting natural cement from the Chartreuse mountain range) and
bio-sourced materials like hempcrete is now available on the
market.
5 The analysis capabilities of the Louis Vicat technical center make it
possible to diagnose the disorders of concretes used in the 19th and
20th centuries and to propose remedial solutions. As a member of
the Cercle des Partenaires du Patrimoine (heritage partners circle)
of the French Ministry of Culture and Communication, Vicat takes
part in research operations related to the restoration of old buildings.
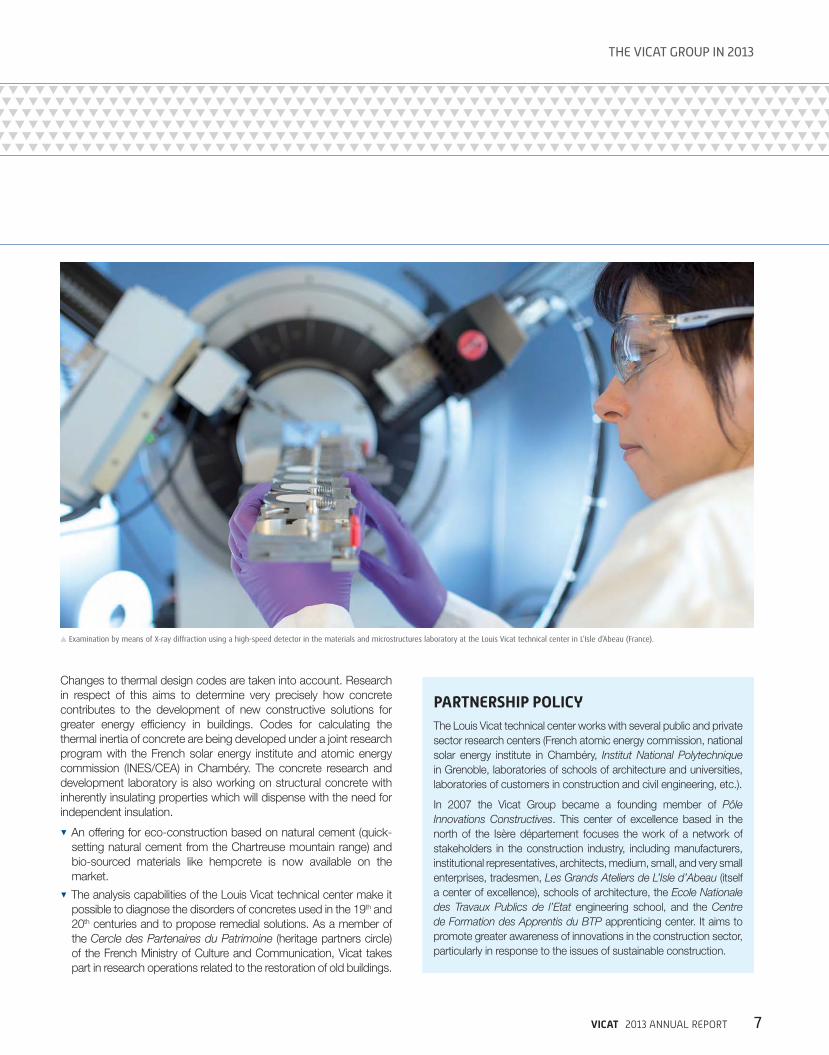
Examination by means of X-ray diffraction using a high-speed detector in the materials and microstructures laboratory at the Louis Vicat technical center in L’Isle d’Abeau (France).
PARTNERSHIP POLICYThe Louis Vicat technical center works with several public and private
sector research centers (French atomic energy commission, national
solar energy institute in Chambéry, Institut National Polytechnique
in Grenoble, laboratories of schools of architecture and universities,
laboratories of customers in construction and civil engineering, etc.).
In 2007 the Vicat Group became a founding member of Pôle
Innovations Constructives. This center of excellence based in the
north of the Isère département focuses the work of a network of
stakeholders in the construction industry, including manufacturers,
institutional representatives, architects, medium, small, and very small
enterprises, tradesmen, Les Grands Ateliers de L’Isle d’Abeau (itself
a center of excellence), schools of architecture, the Ecole Nationale
des Travaux Publics de l’Etat engineering school, and the Centre
de Formation des Apprentis du BTP apprenticing center. It aims to
promote greater awareness of innovations in the construction sector,
particularly in response to the issues of sustainable construction.

VICAT 2013 ANNUAL REPORT8
GOVERNANCE & SHAREHOLDERS
5 MANAGEMENT
Jacques Merceron-VicatChairman
Guy SidosChief Executive Officer
Raoul de ParisotChief Operating Officer
Philippe ChiorraSenior Executive Vice President, Chief Legal Officer
Éric HolardSenior Executive Vice President
Jean-Pierre SouchetSenior Executive Vice President, Chief Financial Officer
Bernard TitzSenior Executive Vice President, General Secretary
Christophe BérengerDirector, Human Resources
Éric BourdonDirector, Performance and Investment
Pierre-Olivier BoyerDirector, Strategic Partnerships
Gilbert NattaDirector, Business Development
Dominique ReniéChief Technology Officer
5 BOARD OF DIRECTORS
AS OF DECEMBER 31, 2013
Jacques Merceron-Vicat,Chairman
Pierre BreuilXavier ChalandonRaynald DreyfusJacques Le MercierLouis Merceron-VicatBruno SalmonSophie SidosGuy SidosP&E Managementrepresented by Paul Vanfrachem
5 AUDITORS
Incumbents
KPMG AuditWolff & Associés SASAlternates
Cabinet ConstantinExponens Conseil et Expertise
OWNERSHIP STRUCTURE
The Company’s share capital amounts to 179,600,000 euros, consisting of 44,900,000
shares with par value of 4 euros each.
OWNERSHIP OF SHARE CAPITAL AS OF DECEMBER 31, 2013
60.6 %FAMILY SHAREHOLDERS
1.9 %TREASURY
SHARES
37.6 %PUBLIC
(INCLUDING EMPLOYEES)
Bamako shopping center built with concrete (Mali).
DIVIDENDBased on results in 2013, and confident of the Group’s ability to sustain its ongoing
development, the Board of Directors has decided to propose that the Annual General
Meeting of shareholders on May 6, 2014 vote to maintain the same dividend, i.e. 1.50
euros per share.
(In euros) 2013 2012 2011
Earnings per share 2.68 2.87 3.64
Dividend per share 1.50 1.50 1.50

VICAT 2013 ANNUAL REPORT 9
THE VICAT GROUP IN 2013
STOCK MARKET & FINANCIAL INFORMATION
5 SHAREHOLDER INFORMATION
Shareholder and investor relations:
Tel.: + 33 1 58 86 86 14
Fax: + 33 1 58 86 87 88
E-mail: [email protected]
Websites: www.vicat.fr, www.vicat.com
Symbol: VCT
ISIN code: FR0000031775
Sicovam: 03177
Bloomberg: VCT.PA
Reuters: VCTP.PA
5 FINANCIAL REPORTING CALENDAR
April 28, 2014
(posted after close)
Q1 2014 sales
May 6, 2014
Annual General Meeting
August 4, 2014
(posted after close)
H1 2014 sales and earnings
November 4, 2014
(posted after close)
9M 2014 sales
STOCK MARKET INFORMATION
Vicat has been included in the SBF 120 index of the Paris Bourse since March 21, 2011.
Vicat shares have qualified for trading under the Service du Règlement Différé (SRD)
deferred settlement market since February 26, 2008.
SHARE PRICE TREND
2011 2012 2013
30
35
40
45
50
55
60
65
(in euros)
FINANCIAL REPORTING
Vicat is dedicated to maintaining close communication with shareholders, transparency
and ease of access to information at all times. The Group undertakes to make information
on its business, strategy, results, and objectives available to the public at regular intervals.
The Group’s communication program includes:
5 publication of AMF-compliant information on the Company’s websites (www.vicat.fr and
www.vicat.com);
5 quarterly, half-yearly, and yearly press releases in addition to any others regarding any
significant information on the life and development of the Group;
5 an annual report;
5 a Registration Document;
5 a dedicated website: www.vicat.fr (also www.vicat.com); “Financial Information” section.
Vicat also participates in many conferences and other events aimed at facilitating and
promoting closer direct contact between the Group and members of the financial
community.

VICAT 2013 ANNUAL REPORT10
CORPORATE SOCIAL RESPONSIBILITYThe Group has made corporate social responsibility an integral part of its overall strategy. Details of its CSR initiatives are given on pages 125 to 146 of this report, in compliance with French regulations. Corporate social responsibility comprises a social component applicable within the Group (role as a socially responsible employer), a social and economic component applicable outside the Group (role in economic and social development in our business locations), and an environmental component that is intimately linked to the Group’s industrial strategy.
ROLE AS A SOCIALLY RESPONSIBLE EMPLOYER
The Group takes care to ensure that its employees
enjoy attractive working conditions and career
development possibilities on a permanent basis.
Workplace health and safety are therefore at the heart
of its concerns. The results for 2013 in this respect
are blatantly unsatisfactory, being below those of
2012. They have induced deployment of a new
workplace health and safety action plan to put things
back on the tracks of the continuous improvement
observed in this respect for more than ten years.
Training is the other focus of the human resources
policy which must enable the Group to contribute
to the raising of employee skill levels, without which
there could be no social progress.
Dredger at the Jassans aggregate quarry (France).
Fondation Sococim’s assistance for job creation helped 84 women of the Médinatoul Mounawara development association (Senegal).
EMPLOYEES WORKPLACE ACCIDENT SEVERITY
RATE
EMPLOYEES RECEIVING TRAINING
7,656 0.48 4,451

VICAT 2013 ANNUAL REPORT 11
CORPORATE SOCIAL RESPONSIBILITY
ROLE IN ECONOMIC AND SOCIAL DEVELOPMENT IN OUR BUSINESS LOCATIONS
In 2013 the Group furthered its efforts to boost the
development of local employment in its business
locations. This involved substantial assistance
to schools and institutes of higher education, as
occurred in Senegal (Rufisque media center),
Turkey (Konya school of fine arts), and Egypt
(El Arish university). It also involved support for the
development of small and very small businesses,
through the aliZé Savoie initiative in France or the
Sococim Foundation in Senegal.
THE ENVIRONMENT: A PRIORITY AT THE HUB OF “SUSTAINABLE CONSTRUCTION” STRATEGY
Sheep are being used to keep the grass down at the Pérouges quarry (France).
QUARRIES WITH RESTORATION PLANS
RATE OF FUEL SUBSTITUTION
RECYCLING RATE OF WATER USED IN THE AGGREGATE
BUSINESS
83 % 20.3 % 65 %
The leading field for environmental action in which
the Vicat Group is engaged is its quarries, for which
landscaping is given special attention, whether
during quarrying operations or afterwards, when the
quarries are restored. As the many prizes the Group
has won for such projects testify, its quarries today
are sites of conservation and growing biodiversity.
Repurposing of waste from human activities as
alternative fuels or raw materials is another field
in which for many years now the Group has built
up substantial experience. Recycling of waste is
continuing to grow as a result of technological
investments. Year on year, this approach, which
contributes to a circular economy, helps reduce
the amount of fossil fuels consumed for every ton
of cement produced.
And in 2013, as in the past, the Group continued to reduce the level of emissions
associated with the operation of its cement plants.
12 VICAT 2013 ANNUAL REPORT
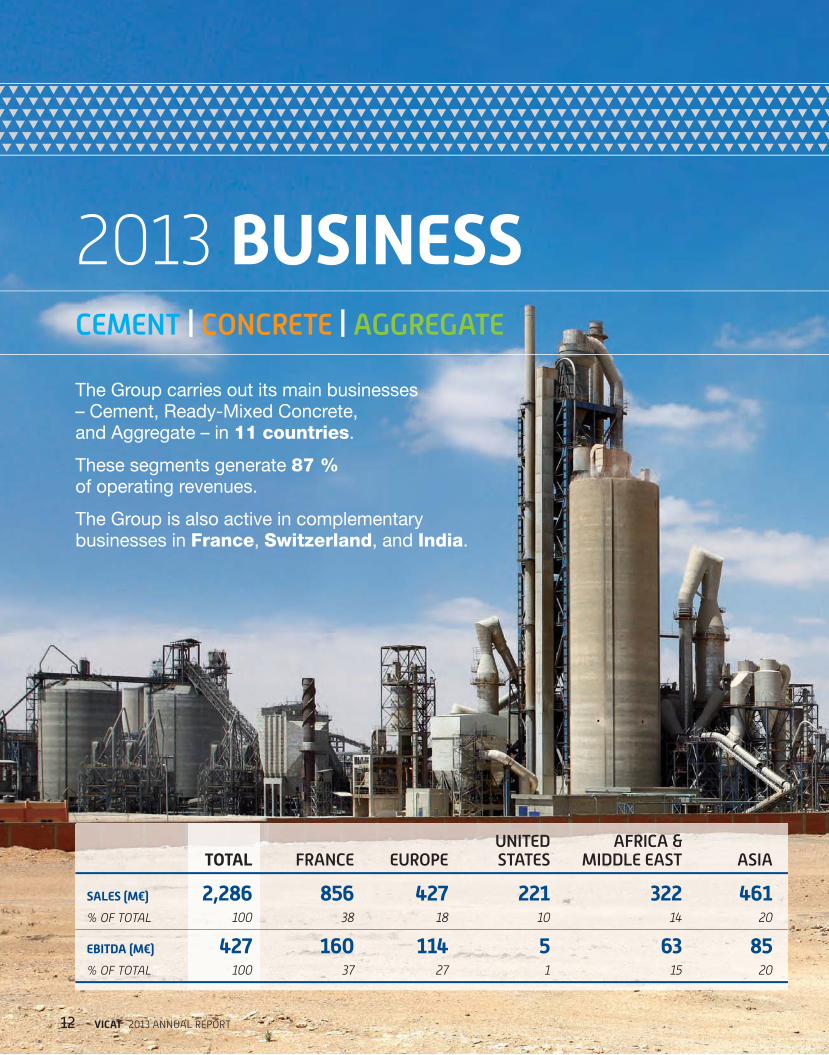
The Group carries out its main businesses – Cement, Ready-Mixed Concrete, and Aggregate – in 11 countries.
These segments generate 87 % of operating revenues.
The Group is also active in complementary businesses in France, Switzerland, and India.
CEMENT | CONCRETE | AGGREGATE
2013 BUSINESS
TOTAL FRANCE EUROPEUNITED STATES
AFRICA & MIDDLE EAST ASIA
SALES (M€) 2,286 856 427 221 322 461% OF TOTAL 100 38 18 10 14 20
EBITDA (M€) 427 160 114 5 63 85% OF TOTAL 100 37 27 1 15 20

13VICAT 2013 ANNUAL REPORT
2013 BUSINESS
Sinai Cement plant in El Arish (Egypt).

VICAT 2013 ANNUAL REPORT14
SALES
€ 856 MEMPLOYEES
2,522BREAKDOWN OF SALES BY BUSINESS LINE
35 %CEMENT
42 %CONCRETE & AGGREGATE
23 %OTHER PRODUCTS & SERVICES
FRANCE
“Cube Orange” building in the Confluence district of Lyon, France (architects Jakob + MacFarlane).
VICAT 2013 ANNUAL REPORT 15
2013 BUSINESS/FRANCE
CEMENT
MARKET CONDITIONSThere were 294,000 new housing starts in 2013, some 10,000 units
less than the year before (- 3.2 %). Apart from the south-west of the
country (Aquitaine), all regions suffered the decline, the drop being
particularly severe in the south-east (Provence-Alpes-Côte d’Azur),
with regression of 14 %.
At the same time the number of new building permits dropped
throughout the year; at the end of December their numbers were the
same as in 2009, the lowest figure since the start of the current crisis.
Despite the approach of an electoral year, which generally induces an
increase in the amount of public works engaged, sales in the sector
did not rise above the level of 2012.
CEMENT CONSUMPTION
Thousands of metric tons 2013 2012 Change
Domestic production 17,334 18,009 - 3.7 %
Imports 1,871 1,964 - 4.7 %
TOTAL 19,205 19,973 - 3.8 %
After a drop of 6.7 % in 2012, cement volume sales fell 3.8 % in
2013. Nation-wide consumption stood at 19.2 million metric tons,
the lowest level since 1998.
The year was marked by contrasts in weather, with a very rainy first
quarter and an exceptionally mild December. Proportionally, the
drop in cement imports was marginally greater than the total market
decline.
GROUP BUSINESS
SALES VOLUME
Thousands of metric tons 2013 2012 Change
Domestic 2,674 2,780 - 3.8 %
Exports 213 245 - 13.1 %
TOTAL 2,887 3,025 - 4.6 %
Vicat sales on the domestic market fell in the same proportions as
the drop nation-wide. This result was achieved due to sound levels
of Group business in the Rhône Alpes region, compensating a lower
level of sales in the Provence-Alpes-Cote d’Azur region where the
property crisis was particularly severe.
A variety of market pressures and an unfavorable product mix meant
average selling prices increased only very moderately.
PLANT OPERATIONUnfavorable weather conditions through to May and shrinking sales
meant clinker production was down 9 % in the first half, though the
drop for the year as a whole was limited to 3.7 % as a result of more
buoyant sales in the second half. The percentage of substitute fuels
burned increased across all plants.
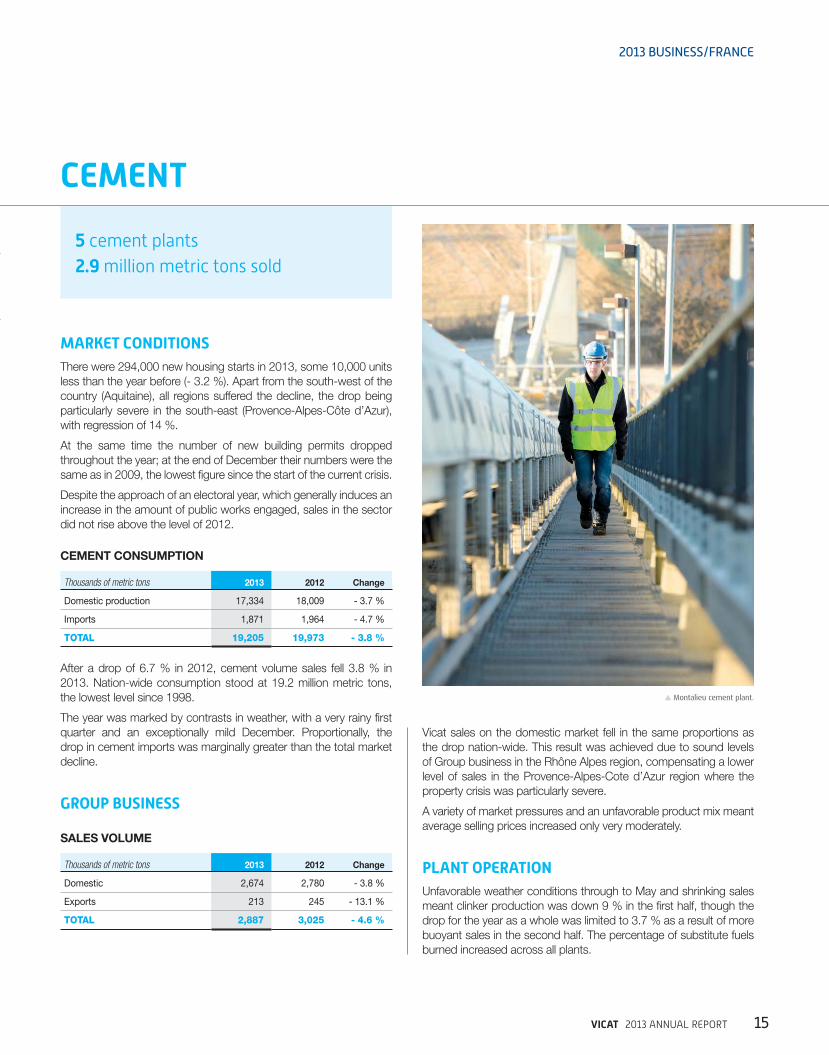
Montalieu cement plant.
5 cement plants2.9 million metric tons sold
VICAT 2013 ANNUAL REPORT16
The Cement division cash cost remained the same as in 2012
despite a lower denominator. The cost of energy was lower than in
2012, the rise in electric power expenditure being compensated by
a drop in fuel costs.
CAPITAL EXPENDITUREAt the Montalieu facility, work is progressing on the installations at
the new Mépieu limestone quarry. Opening of the quarry and of the
6-km-long overland conveyor is programmed for 2014.
At Saint Égrève, work has started on the adaptations required for
producing Alpenat® clinker in 2014.
MARKET CONDITIONSThe ready-mixed concrete market ended the year at over 38.6 million
cubic meters sold, down close to 2 % on 2012. The drop was slower
in the second half.
Sales varied significantly across different regions. The Lorraine and
Provence regions, in particular, saw greater shrinkage, while the
Rhône-Alpes, Limousin, Ile-de-France, Nord-Pas-de-Calais, and
Auvergne regions showed better resistance.
The year as a whole confirmed the first-half trend for aggregate, with
a rise of 1.5 % in 2013 compared to 2012; the total sold amounted
to 366 million metric tons, with a rise in the amount of igneous
aggregate as a result of the high level of activity in public works.
GROUP BUSINESS
SALES VOLUME
2013 2012 Change
Concrete (thousands of cubic meters) 3,072 3,071 =
Aggregate (thousands of metric tons) 11,058 10,474 + 5.6 %
NUMBER OF FACILITIES
2013 2012 Change
Batching plants 143 147 - 4
Aggregate quarries 42 42 =
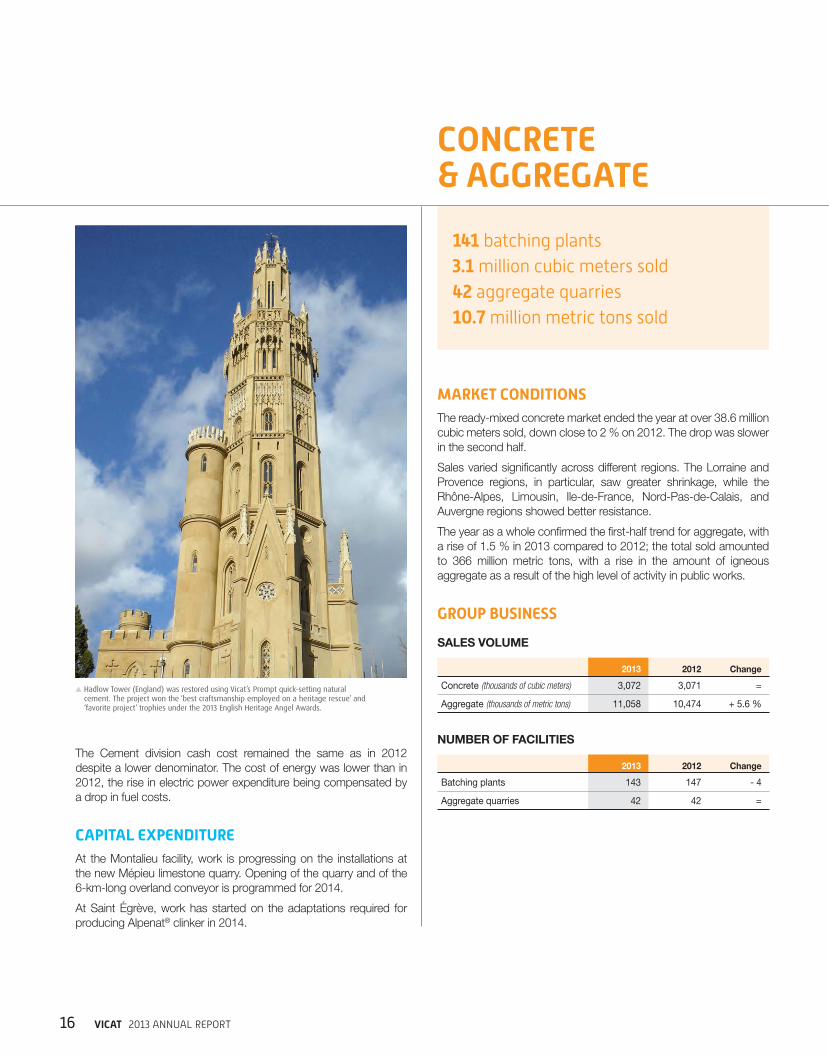
Hadlow Tower (England) was restored using Vicat’s Prompt quick-setting natural cement. The project won the ‘best craftsmanship employed on a heritage rescue’ and ‘favorite project’ trophies under the 2013 English Heritage Angel Awards.
CONCRETE & AGGREGATE
141 batching plants3.1 million cubic meters sold42 aggregate quarries10.7 million metric tons sold
VICAT 2013 ANNUAL REPORT 17
2013 BUSINESS/FRANCE
The Béton Vicat concrete business managed to maintain the same
volume of sales as in 2012, despite confronting stiffer competition in
the second half than in the first. This competition meant price rises
could not keep pace with the rising cost of raw materials.
Béton Vicat continued its rationalization of product offering based on
four ranges (Vivaperf®, Défiperf®, Stylperf®, and Flexiperf®) in support
of its policy of development of concretes with high value-added.
Sales of these concretes progressed 5 % in 2013.
The Aggregate division recorded volume sales up 5.6 % in 2013
relative to 2012. Business in the Rhône-Alpes region was the cause
of most of this progress: there were large earthworks projects in
Upper Savoy and brisk construction business in the Gex area. The
pricing policy and work of sales teams enabled selling prices to hold
their ground in 2013.
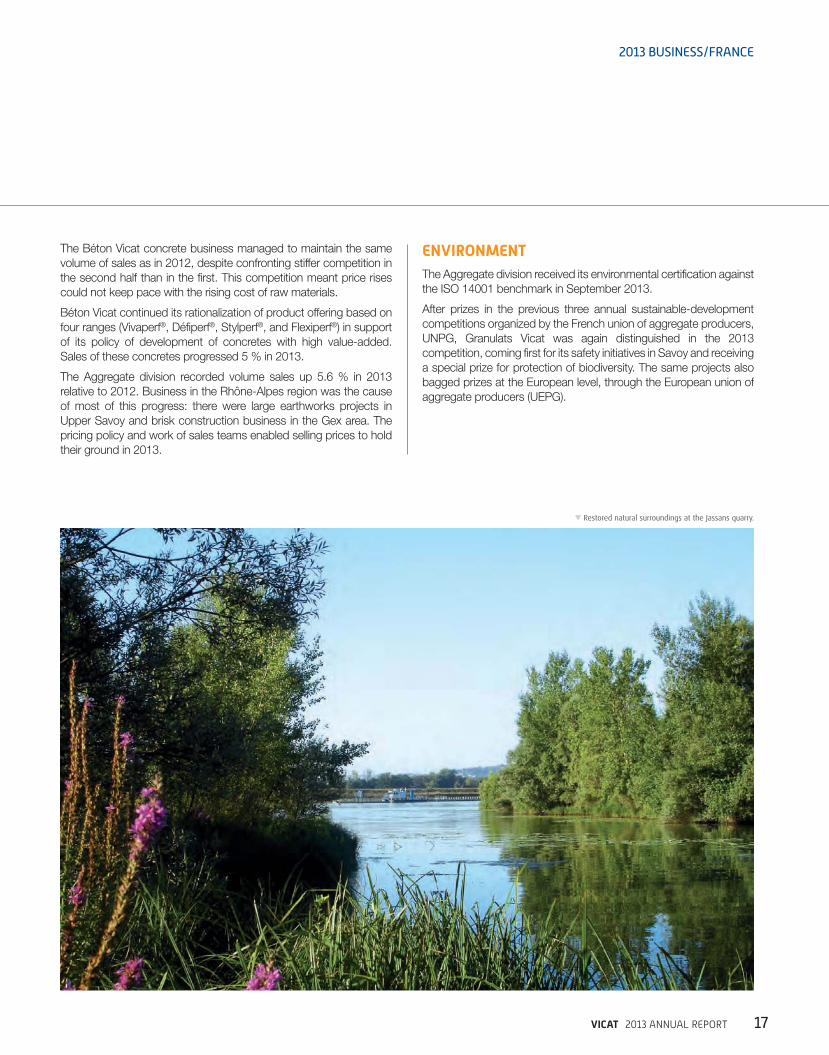
ENVIRONMENTThe Aggregate division received its environmental certification against
the ISO 14001 benchmark in September 2013.
After prizes in the previous three annual sustainable-development
competitions organized by the French union of aggregate producers,
UNPG, Granulats Vicat was again distinguished in the 2013
competition, coming first for its safety initiatives in Savoy and receiving
a special prize for protection of biodiversity. The same projects also
bagged prizes at the European level, through the European union of
aggregate producers (UEPG).
Restored natural surroundings at the Jassans quarry.

VICAT 2013 ANNUAL REPORT18
OTHER PRODUCTS & SERVICES
PAPETERIES DE VIZILLEPRINTING & WRITING PAPERS
MARKET CONDITIONS
Demand dropped again in 2013. In France production of
paperboard was down slightly: papers for graphic applications
were hit hardest, while the packaging sector held up better.
Selling prices took a downward slide on the publishing and
check markets and held fast for special papers, an expanding
business sector for Papeteries de Vizille.
MARKET CONDITIONS
In 2013 there was reduced demand for industrial kraft bags on
most markets (- 5.1 % in France, - 1.5 % in Europe). In France
all sectors are down on 2012.
GROUP BUSINESS
The year ended saw consolidation in the development of sales of
new, growing products which now account for 40 % of the total
tonnage sold (22 % in 2012). The new products are essentially on the
food-packaging, high-security, and special industrial paper markets.
Their sales compensated the drop on historic markets in 2013.
In terms of geographical presence, the Company is continuing to
expand: in 2013 exports represented 47 % of its sales.
The new biomass boiler is now operational. In June biomass fuels
accounted for 75 % of the steam it generated, thus meeting the
objective and making the expected reductions in production costs.
Construction of the new biological treatment plant was completed in
December 2013. Commissioning is scheduled for early 2014.
SALES VOLUMES
2013 2012 Change
Printing & Writing (thousands of metric tons) 20,876 21,954 - 4.9 %
Bags (thousands) 64,027 60,442 + 6 %
SALES (millions of euros) 39.4 39.8 - 1.0 %
PAPETERIES DE VIZILLE BAGS
Building in Cannes La Bocca (France) designed by Wilmotte & Associés, with VPI coating.
GROUP BUSINESS
Despite these figures, Papeteries de Vizille recorded 6 % growth in
volume sales compared to 2012. This progress is in large part the
result of growth in sales to over 30 new customers, particularly in the
foodstuffs and animal feed sectors.

VICAT 2013 ANNUAL REPORT 19
2013 BUSINESS/FRANCE
SATM & SUBSIDIARIES
BREAKDOWN OF SALES (BY SEGMENT)
(Millions of euros) 2013 2012 Change
Transport 85.5 81.6 + 4.8 %
Major Projects 5.3 17.9 - 70.4 %
TOTAL 90.8 99.6 - 8.8 %
MAJOR PROJECTS
The business of the Major Projects division declined significantly
in both sales and volume terms in 2013 as a result of both the
completion of some large projects and bad weather at the start of
the year which hampered progress on all the projects under way.
TRANSPORT
Business in the road freight sector fell 1.6 % relative to 2012, and the
switch to 44-tonners caused a price drop of 2 % on average.
SATM stood up well and sales increased 4.8 % relative to 2013,
largely because of:
5 an increase in petrofuel haulage (tank trucks);
5 good winter business (intensive snow-clearing and steady salt
haulage);
5 sustained multimodal and contaminated-soil transport business;
5 new contracts won for site dump-truck business.
VPI BUSINESS
Sales
(Millions of euros) 2013 2012 Change
Building 47.7 47.5 + 0.5 %
Home improvement 21.9 21.8 + 0.5 %
Civil engineering 4.5 2.7 + 67.0 %
TOTAL 74.1 72.0 + 3.0 %
Despite this market downturn VPI performed well, increasing both
the volume of sales (3 %) and the average selling price (1.5 %).
With the support of a commercial action plan aimed at building
supply retailers, the building business increased its market share in
value-added product ranges, particularly tiling adhesives and ETICS
external insulation systems.
VICAT PRODUITS INDUSTRIELS(construction chemicals)
MARKET CONDITIONS
In 2013 the premixed mortar market suffered from serious
deterioration in the new-build market (- 6.5 %) and from a
slowdown in the renovation/improvement market (- 1 %). This
trend was aggravated by poor weather in the first four months.
Stade des Alpes stadium in Grenoble (France) built with Vicat concrete.
VICAT 2013 ANNUAL REPORT20
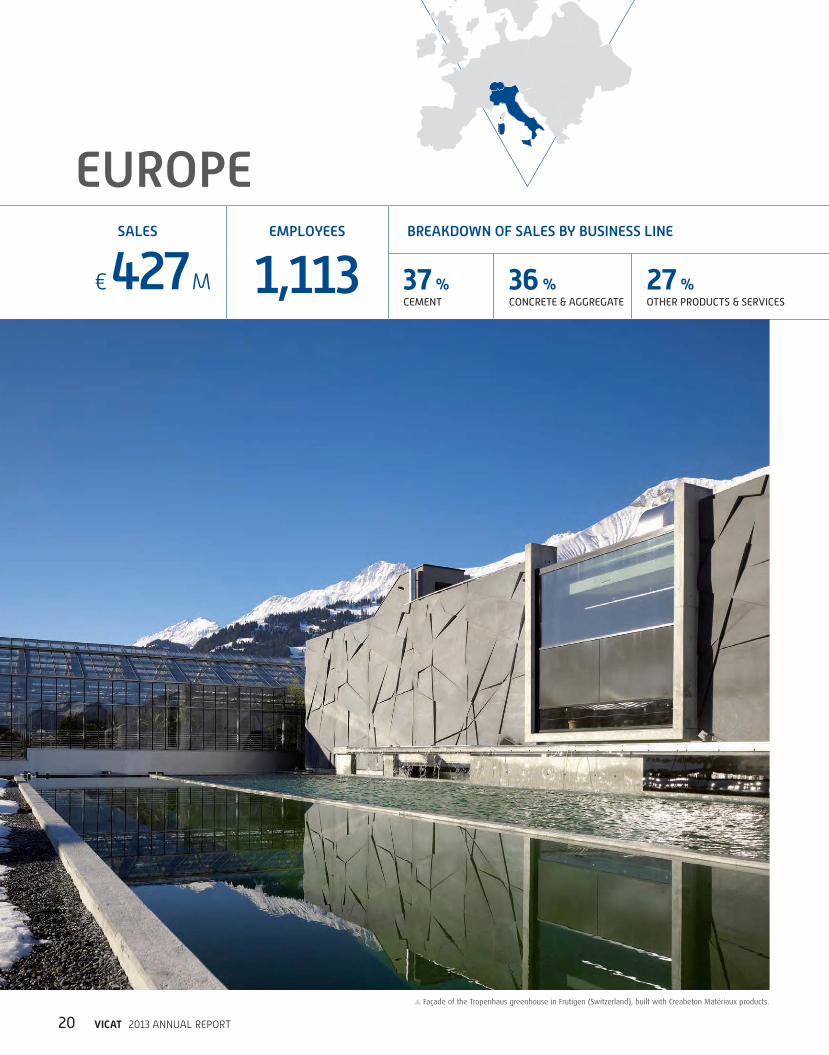
EUROPESALES
€ 427 MEMPLOYEES
1,113BREAKDOWN OF SALES BY BUSINESS LINE
37 %CEMENT
36 %CONCRETE & AGGREGATE
27 %OTHER PRODUCTS & SERVICES
Façade of the Tropenhaus greenhouse in Frutigen (Switzerland), built with Creabeton Matériaux products.

VICAT 2013 ANNUAL REPORT 21
2013 BUSINESS/EUROPE
1 cement plant1.0 million metric tons sold
MARKET CONDITIONSThe construction sector saw continued growth in 2013 and business
remained brisk. This positive trend was felt equally in the building
sector and in public works since population growth and sound public
finances resulted in more infrastructure work.
CEMENT CONSUMPTION
Thousands of metric tons 2013 2012 Change
Domestic production 4,564 4,395 + 3.8 %
Imports 568 542 + 4.9 %
TOTAL 5,132 4,937 + 5.2 %
After a slight drop in 2012, cement consumption climbed again and
even broke the symbolic threshold of 5 million metric tons.
GROUP BUSINESS
SALES VOLUME
Thousands of metric tons 2013 2012 Change
TOTAL 1,002 891 + 12.4 %
Vigier passed the mark of one million metric tons sold in one year
as a result of favorable economic conditions combined with a great
many projects under way close to the cement plant. The average
selling price is down slightly as a combined result of competition and
large bulk deliveries to projects.
PLANT OPERATIONThe plant set new production records for the sixth year running.
Technical ratios were encouraging, with a rise in average kiln output
and a slight improvement in thermal efficiency. The rate of use of
substitute fuels rose slightly, to 70 %, in part because of the activity
of subsidiary Altola, still the market leader in repurposing of liquid
substitute fuels.
SWITZERLAND | CEMENT
Control-room operator at the Reuchenette plant.
Reuchenette cement plant (Switzerland).
VICAT 2013 ANNUAL REPORT22
MARKET CONDITIONSAfter a drop in 2012, demand for ready-mixed concrete rebounded.
It is still at a high level, even if volumes are subject to severe
competition. Quite logically, the aggregate business benefitted from
the vigor of the ready-mixed concrete sector. Demand for aggregate
for non-concrete uses was also steady.
GROUP BUSINESS
VOLUMES SOLD
2013 2012 Change
Concrete (thousands of cubic meters) 876 728 + 20.3 %
Aggregate (thousands of metric tons) 3,337 2,843 + 17.4 %
NUMBER OF FACILITIES
2013 2012 Change
Batching plants 21 22 - 1
Aggregate quarries 20 21 - 1
Vigier benefitted from the strong demand generated by large projects
in regions served by its ready-mixed concrete and aggregate
network. Concrete selling prices remained stable.
CAPITAL EXPENDITUREThe new Wimmis aggregate facility came into operation in November.
Replacing four installations, the new plant will reduce operating costs
and enhance quality.
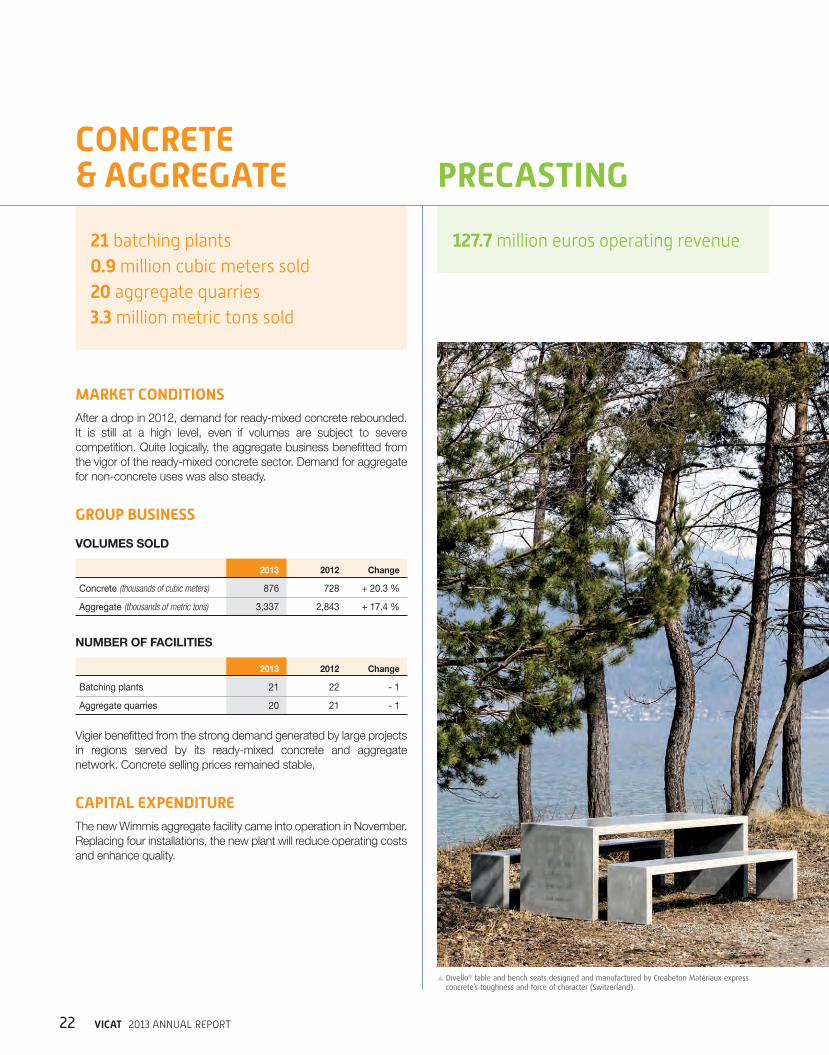
CONCRETE & AGGREGATE PRECASTING
21 batching plants0.9 million cubic meters sold20 aggregate quarries3.3 million metric tons sold
127.7 million euros operating revenue
Divello® table and bench seats designed and manufactured by Creabeton Matériaux express concrete’s toughness and force of character (Switzerland).

VICAT 2013 ANNUAL REPORT 23
2013 BUSINESS/EUROPE
1 milling plant2 terminals0.2 million metric tons sold
MARKET CONDITIONSThe precasting business remained vibrant. There is still a high level
of investment in road and rail infrastructures, but calls for tenders are
toughly contested, affecting prices in the industry.
GROUP BUSINESS
2013 2012 Change
Volume of sales (thousands of metric tons) 424 415 + 2.0 %
Sales (millions of euros) 127.7 124.9 + 2.2 %
High demand in the railways sector offset the decline in sales of
conventional precast concrete products.
As a result of high demand for conventional rail ties, the Müntschemier
plant worked on Sundays. Employee mobilization meant supply kept
up with requirements.
Vigier is expecting there to be a rise in demand for concrete rail ties
due to a large track renovation program and the trend for timber
ties to be replaced by concrete ties which are cheaper and longer
lasting. Consequently the production capacity of the rail-tie plant is
being increased; the works should be completed in the first quarter
of 2014.
MARKET CONDITIONSActivity in the residential and industrial construction sectors dropped
considerably relative to 2012. The public-works sector also remained
quiet: work on the Lyon-Turin rail line is progressing very slowly. The
only other large projects in view are those for the 2015 Exhibition in
Milan.
CEMENT CONSUMPTION
Thousands of metric tons 2013 2012 Change
TOTAL 20,900 24,457 - 14.5 %
The market suffered another substantial decline, on top of a difficult
year in 2012.
GROUP BUSINESS
SALES VOLUME
Thousands of metric tons 2013 2012 Change
TOTAL 238 319 - 25.4 %
In tough market conditions, the rocky financial situation of many
customers led CCS to limit exposure to payment risk by refusing or
reducing deliveries in some cases. This choice explains part of the
reduction in sales volume. The drop in domestic sales was partially
compensated by a growth in exports to Corsica. CCS also decided
to focus on protecting profit margin, and raised selling prices
appreciably.
ITALY | CEMENT

VICAT 2013 ANNUAL REPORT24
SALES
€ 221 MEMPLOYEES
1,023BREAKDOWN OF SALES BY BUSINESS LINE
38 %CEMENT
62 %CONCRETE & AGGREGATE
UNITED STATES
Lebec cement plant, California.

VICAT 2013 ANNUAL REPORT 25
2 cement plants1.5 million metric tons sold
CEMENT
MARKET CONDITIONSAt the national level, 2013 construction expenditure was again
appreciably up on 2012. This rise is a result of a 16 % growth in
residential construction and practical stagnancy of expenditure in the
non-residential sector.
Construction expenditure for public works diminished slightly relative
to 2012.
CEMENT CONSUMPTION
Thousands of metric tons 2013 2012 Change
Southeast 6,148 6,013 + 2.2 %
California 8,224 7,407 + 11.0 %
US TOTAL 79,582 76,470 + 4.1 %
GROUP BUSINESS
SALES VOLUME
Thousands of metric tons 2013 2012 Change
TOTAL 1,525 1,458 + 4.6 %
In the Southeast, despite poor weather in the first half of the year,
cement sales increased on the Group’s historic markets. In California,
sales volumes were substantially up on 2012 (+ 11 %) due not only
to the work of concrete subsidiaries but also to direct sales (freeway
projects). Price hikes in the early part of the year were applied to
large numbers of customers in the Southeast and, to a lesser extent
however, in California.
PLANT OPERATIONWith sustained demand for higher volumes, the Lebec plant improved
its utilization rate in 2013. Plant operation at Ragland remained
stable. Work on measures to cut production costs continued in all
fields:
5 variable costs for Ragland are down on 2012 as a result of savings
made on fuel purchasing, the efforts put into improving thermal
efficiency, increased use of alternative fuels, and reductions on the
purchase costs of electric power and raw materials;
5 at Lebec the effect of higher petroleum-coke and power prices
was restricted by a rise in the fuel substitution rate and the work
devoted to the electrical efficiency of the cement mills.
MARKET CONDITIONSAs for the cement business, ready-mixed concrete benefitted from
recovery in the residential sector and, to a lesser extent, in non-
residential projects. Public works, on the other hand, slowed down.
GROUP BUSINESS
2013 2012 Change
Concrete (thousands of cubic meters) 1,925 1,658 + 16 %
Number of batching plants 47 44 + 3
Buoyed by recovery in the residential sector, and despite poor
weather in the Southeast in the first half, volumes sold in the
Southeast and California were up 13.8 % and 17 % respectively,
compared to last year, but with local variations.
In Alabama, Kirkpatrick was poised to grasp emerging projects
while still benefitting from volume recovery in the south and center of
Alabama. Walker too made further progress, in part due to recovery
of the residential market in Atlanta.
Volumes sold in Los Angeles also flourished. The residential sector
is improving in some areas (Orange County for example). Price rises
were possible in the first half of the year.
44 batching plants1.7 million cubic meters sold
CONCRETE
2013 BUSINESS/UNITED STATES

VICAT 2013 ANNUAL REPORT26
SALES
€ 322 MEMPLOYEES
1,118BREAKDOWN OF SALES BY BUSINESS LINE
94 %CEMENT
6 %CONCRETE & AGGREGATE
In the quarries of the Sococim Industries plant, jatropha nuts are harvested for use as biofuel (Senegal).
AFRICA & MIDDLE EAST
VICAT 2013 ANNUAL REPORT 27
2013 BUSINESS/AFRICA & MIDDLE EAST
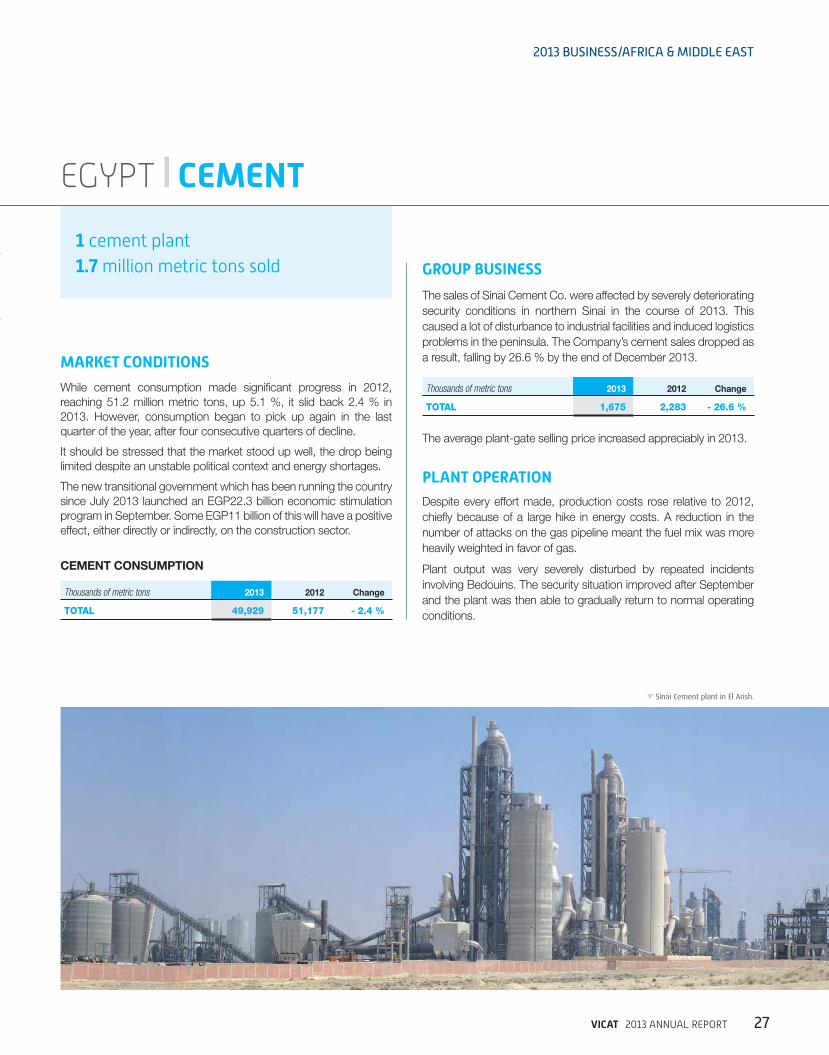
Sinai Cement plant in El Arish.
EGYPT | CEMENT
1 cement plant1.7 million metric tons sold
MARKET CONDITIONS
While cement consumption made significant progress in 2012,
reaching 51.2 million metric tons, up 5.1 %, it slid back 2.4 % in
2013. However, consumption began to pick up again in the last
quarter of the year, after four consecutive quarters of decline.
It should be stressed that the market stood up well, the drop being
limited despite an unstable political context and energy shortages.
The new transitional government which has been running the country
since July 2013 launched an EGP22.3 billion economic stimulation
program in September. Some EGP11 billion of this will have a positive
effect, either directly or indirectly, on the construction sector.
CEMENT CONSUMPTION
Thousands of metric tons 2013 2012 Change
TOTAL 49,929 51,177 - 2.4 %
GROUP BUSINESS
The sales of Sinai Cement Co. were affected by severely deteriorating
security conditions in northern Sinai in the course of 2013. This
caused a lot of disturbance to industrial facilities and induced logistics
problems in the peninsula. The Company’s cement sales dropped as
a result, falling by 26.6 % by the end of December 2013.
Thousands of metric tons 2013 2012 Change
TOTAL 1,675 2,283 - 26.6 %
The average plant-gate selling price increased appreciably in 2013.
PLANT OPERATIONDespite every effort made, production costs rose relative to 2012,
chiefly because of a large hike in energy costs. A reduction in the
number of attacks on the gas pipeline meant the fuel mix was more
heavily weighted in favor of gas.
Plant output was very severely disturbed by repeated incidents
involving Bedouins. The security situation improved after September
and the plant was then able to gradually return to normal operating
conditions.
VICAT 2013 ANNUAL REPORT28
SENEGAL | CEMENT
MARKET CONDITIONSThe construction sector reported appreciable growth in 2013 as a
result of continued work at Blaise Diagne International Airport (BDIA),
work on the BDIA-Mbour freeway, and projects financed by the
Millennium Challenge Account.
After strong growth in the agricultural sector in 2012, 2013 saw
buying power increase in rural communities, which stimulated
building.
Cement consumption on the West African subregional market
Thousands of metric tons 2013 2012 Change
Subregion 6,850* 6,400 + 7 %
Senegal 2,730 2,520 + 8.3 %
* Burkina Faso, Gambia, Guinea, Mali, Mauritania, Senegal.
GROUP BUSINESS
SALES VOLUME
Thousands of metric tons 2013 2012 Change
TOTAL 2,556 2,680 - 5 %
Sales were down 124,000 metric tons in 2013, i.e. a drop of 5 %
relative to 2012. This reduction includes sound progress in Senegal
and Mali and a fall in export volumes shipped by sea, which is less
profitable. Stiff competition on the domestic market caused a drop in
the average selling price.
PLANT OPERATIONClinker production in 2013 was up 2 % on 2012 while cement
production fell back by 123,000 metric tons, especially because of
disturbance to the electric power supply in the first half.
Other events marking the year included:
5 conversion of a raw-meal crusher into a cement mill at the end of
the first quarter;
5 installation of a new secondary-fuel feed line, with a resultant
increase in the substitution rate.
CAPITAL EXPENDITURECapital expenditure in 2013 was restricted to projects for enhancing
human safety and increasing the reliability of production lines in
order to achieve better performance, which is a guarantee of cost
efficiency on a competitive market.
1 cement plant2.7 million metric tons sold
2 aggregate quarries2.4 million metric tons sold
MARKET CONDITIONSThe market situation was highly varied, with sound construction
business in the first quarter but a drop in the public-works sector
due to the decline in major works carried out for the Senegalese
government. This decline started in the second half of 2012. In the
second half of 2013 the situation reversed, with a substantial drop in
sales for construction and an appreciable rise in demand for public
works when work resumed on old projects and got under way on
new ones.
GROUP BUSINESS
EVOLUTION OF BUSINESS
2013 2012 Change
Volume sold (thousands of metric tons) 2,370 2,624 - 9.7 %
Number of aggregate quarries 2 2 =
Amplified by a long and intense rainy season, this situation induced
shrinkage in the volumes sold. There was, however, a significant rise
in sales in November and December 2013.
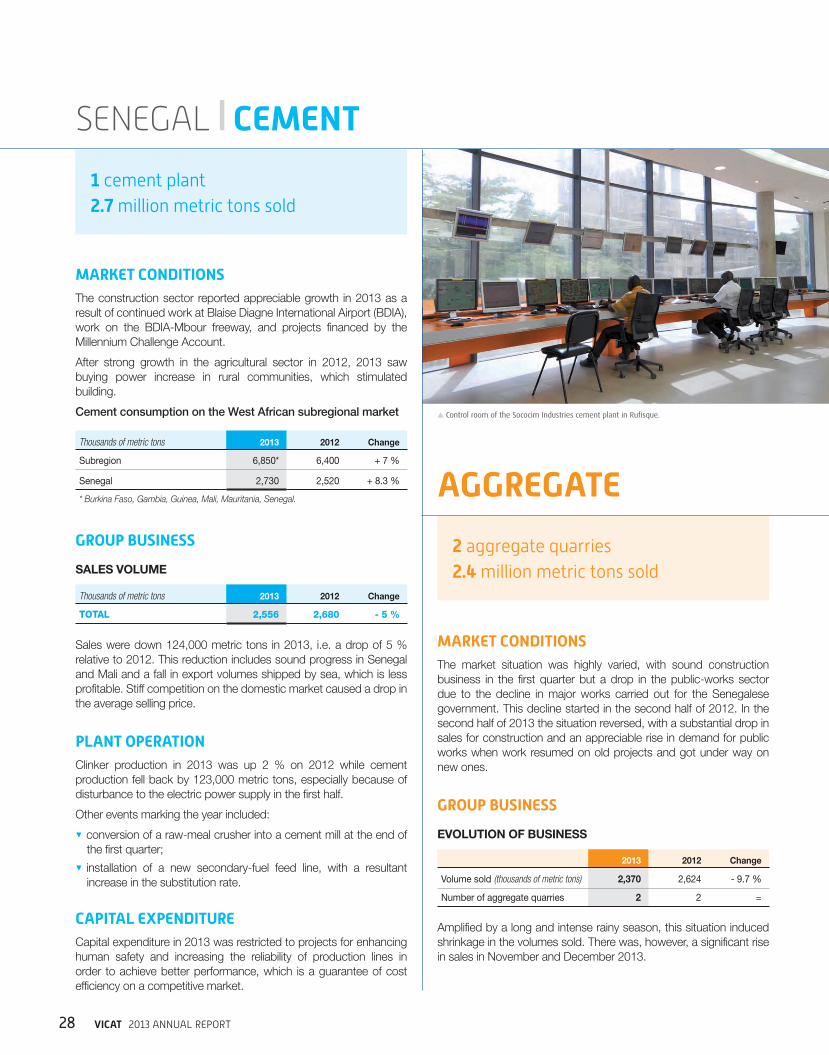
Control room of the Sococim Industries cement plant in Rufisque.
AGGREGATE
VICAT 2013 ANNUAL REPORT 29
MALI | CEMENT MAURITANIA | CEMENT
MARKET CONDITIONSIn a context which called for French then multinational military
intervention, the market was not very lively in 2013; volumes increased
slightly and prices dropped due to more intense competition.
CEMENT CONSUMPTION
Thousands of metric tons 2013 2012 Change
TOTAL 1,600 1,550 + 3 %
GROUP BUSINESS
SALES VOLUME
Thousands of metric tons 2013 2012 Change
TOTAL 639 597 + 7 %
The Group’s sales in Mali made appreciable progress throughout the
year, following competitive adjustment of selling prices.
MARKET CONDITIONSBusiness in construction and public works was steady in 2013
because of work on the new airport and extension of the harbor in
Nouakchott, together with a number of State-financed road projects
for which BSA Ciment supplied cement.
CEMENT CONSUMPTION
Thousands of metric tons 2013 2012 Change
TOTAL 820 697 + 17.6 %
Cement consumption rose substantially in 2013, chiefly in Nouakchott
and, to a lesser extent, in the northern mining region.
GROUP BUSINESS
SALES VOLUME
Thousands of metric tons 2013 2012 Change
TOTAL 280 211 + 32.7 %
On this thriving market BSA Ciment was able to unbridle its full
production capacity to meet the rise in consumption.
PLANT OPERATIONBSA Ciment increased the utilization rate of its cement mill.
0.6 million metric tons sold1 milling plant0.3 million metric tons sold
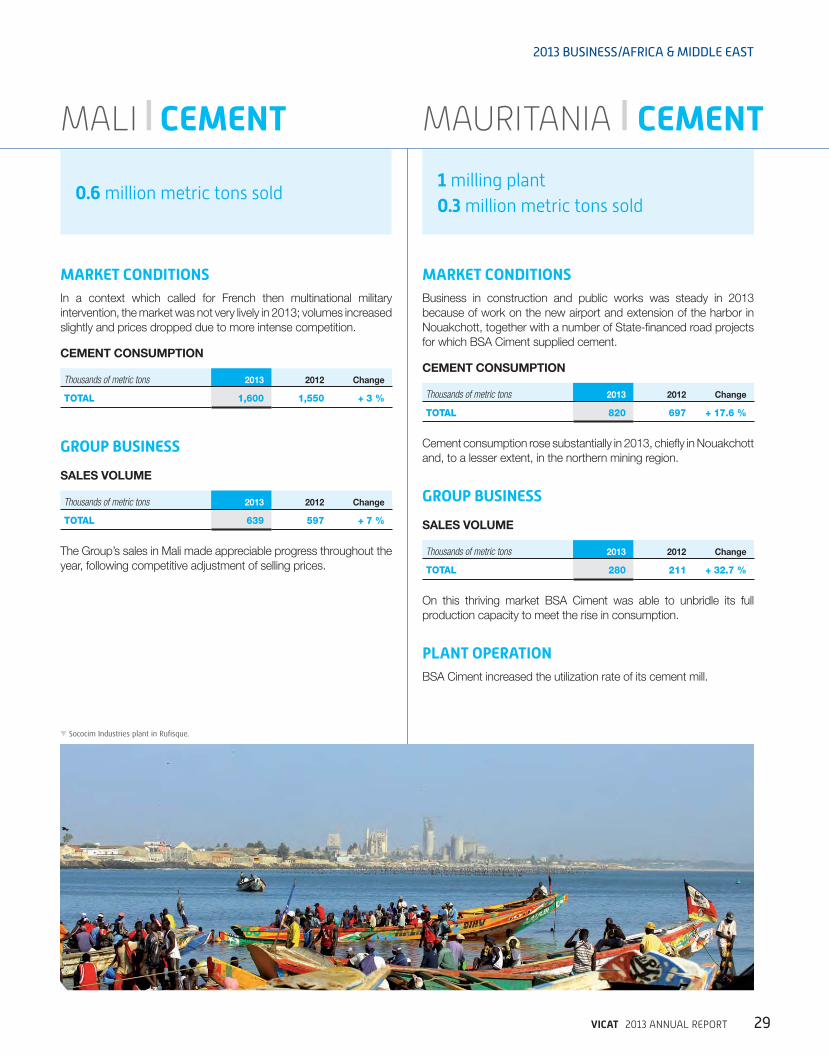
Sococim Industries plant in Rufisque.
2013 BUSINESS/AFRICA & MIDDLE EAST

VICAT 2013 ANNUAL REPORT30
SALES
€ 461 MEMPLOYEES
1,881BREAKDOWN OF SALES BY BUSINESS LINE
72 %CEMENT
20 %CONCRETE & AGGREGATE
8 %OTHER PRODUCTS & SERVICES
ASIA
Bharathi Cement plant in Andhra Pradesh (India).
VICAT 2013 ANNUAL REPORT 31
2013 BUSINESS/ASIA
TURKEY | CEMENT
MARKET CONDITIONSBenefitting from exceptional weather for the season, cement
consumption was very brisk in the first quarter of 2013. For the rest of
the year demand was sustained by the private housing construction
sector and major infrastructure projects in all regions. At 11.9 million
metric tons, exports in 2013 were comparable to 2012 figures.
CEMENT CONSUMPTION
Thousands of metric tons 2013 2012 Change
Marmara 13,707 12,568 + 9.1 %
Aegean 5,310 4,862 + 9.2 %
Mediterranean 10,592 9,762 + 8.5 %
Black Sea 8,460 7,798 + 8.5 %
Central Anatolia 10,640 9,898 + 7.5 %
Eastern Anatolia 5,191 4,761 + 9.0 %
Southern Anatolia 5,856 5,519 + 6.1 %
Others 1,900 1,800 + 5.6 %
TOTAL 61,656 56,968 + 8.2 %
GROUP BUSINESSThe volume of cement sales rose in 2013:
5 domestic cement sales were up 7.3 %, with similar rises for both
plants. The year benefitted from an excellent first quarter in which
the weather was exceptionally mild for the time of year;
5 exports declined substantially, Company strategy being to favor
the domestic market.
SALES VOLUME
Thousands of metric tons 2013 2012 Change
TOTAL 3,606 3,461 + 4.2 %
Domestic selling prices increased appreciably in 2013, with
comparable increases – higher than the inflation rate – for both the
Ba ta and Konya plants.
PLANT OPERATIONBoth plants further increased their consumption of secondary
fuels, and even further increases are envisaged as a result of better
selection of waste. At both plants, the work put into using substitute
raw materials is also producing positive results.
CAPITAL EXPENDITUREAt Ba ta a new clinker press came on line in August. It raised the
production capacity of the process line and lowered the specific
power consumption by 10 %.
A contract for construction of a 150,000 ton clinker silo at each plant
was concluded in August. The silos are to be ready for use in the last
quarter of 2014.
2 cement plants3.6 million metric tons sold
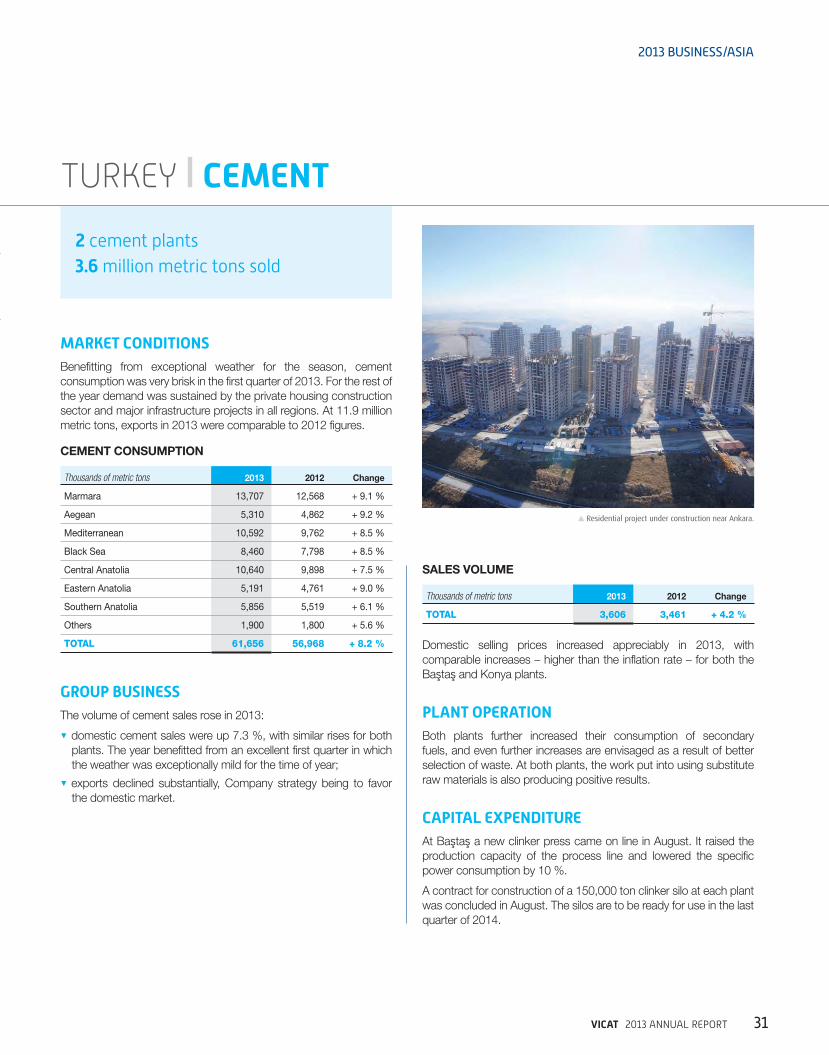
Residential project under construction near Ankara.

VICAT 2013 ANNUAL REPORT32
MARKET CONDITIONSThe volume of ready-mixed concrete sold nationwide increased by
close to 10 % in 2013, in line with the progress of cement sales.
This rise was accompanied by more intense competition, with an
increase in the number of concrete companies and batching plants.
READY-MIXED CONCRETE MARKET
2013
(estimate) 2012 Change
Production (in thousands of cubic meters) 102,000 93,050 + 9.6 %
Number of batching plants 1,080 980 + 10.2 %
Data provided by Turkish ready-mixed concrete association (THBB).
Aggregate consumption can be estimated to have been around
320 million metric tons in 2013, which represents an increase
comparable to that of cement and concrete. Aggregate was used
chiefly for ready-mixed concrete and precasting, with a smaller
quantity (20 to 25 %) for road building and asphalt.
After a strong rise in 2012, aggregate sales on the Ankara market in
2013 remained comparable to the figures of the year before, at a little
over 20 million metric tons.
GROUP BUSINESS
SALES VOLUMES
2013 2012 Change
Concrete (thousands of cubic meters) 2,651 2,447 + 8.4 %
Aggregate (thousands of metric tons) 5,891 5,428 + 8.5 %
NUMBER OF FACILITIES
2013 2012 Change
Batching plants 33 33 =
Aggregate quarries 7 7 =
In 2013 the Group’s concrete sales rose in keeping with the national
market, as a whole, but with variations from region to region. The
Ankara catchment continued to benefit from large housing projects
while the southern and Mediterranean regions continued to suffer
from strong competitive pressure. Selling prices rose much in parallel
with general inflation and the increase in cement prices.
Seven aggregate quarries were operational in 2013: four in the
Ankara region, one in Konya, and two in the Mediterranean area. The
volumes of aggregate sold were up appreciably (8.5 %), boosted by
demand for the large Ankara projects.
CONCRETE & AGGREGATE
33 batching plants2.4 million cubic meters sold7 aggregate quarries5.4 million metric tons sold
Tamta aggregate quarry in Karaomerler.
VICAT 2013 ANNUAL REPORT 33
2013 BUSINESS/ASIA
KAZAKHSTAN | CEMENT
MARKET CONDITIONSConstruction business was good in 2013. It was affected positively
by the economy and by favorable weather throughout the year.
Private initiative in housing construction is limited, but the government
has implemented support initiatives in the sector. The construction
industry is chiefly driven by public expenditure and investment in
infrastructure.
CEMENT CONSUMPTION
Thousands of metric tons 2013 2012 Change
Domestic production 6,496 6,151 + 5.6 %
Imports 1,574 908 + 73.3 %
TOTAL 8,070 7,059 + 14.3 %
Cement consumption grew substantially in 2013. A large part of the
increase in demand was met by imports.
GROUP BUSINESSJambyl Cement’s presence on the market was improved, and the
total volume sold increased 5 % on 2012. The Company maintained
its commercial positioning and expanded its regional presence. The
average selling price increased appreciably, sufficient to cover the
rise in production costs.
SALES VOLUME
Thousands of metric tons 2013 2012 Change
TOTAL 1,028 981 + 4.8 %
1 cement plant1.0 million metric tons sold
PLANT OPERATIONClinker production was more regular in 2013 and the kiln attained a
good level of reliability. Average output was further increased after
the maintenance shutdown at the end of the year. The kiln’s thermal
consumption was improved. Maintenance operations enhanced the
reliability of the cement mills.
CAPITAL EXPENDITUREThe year’s capital expenditure was chiefly directed at improving the
reliability of the plant. Investment was kept low.
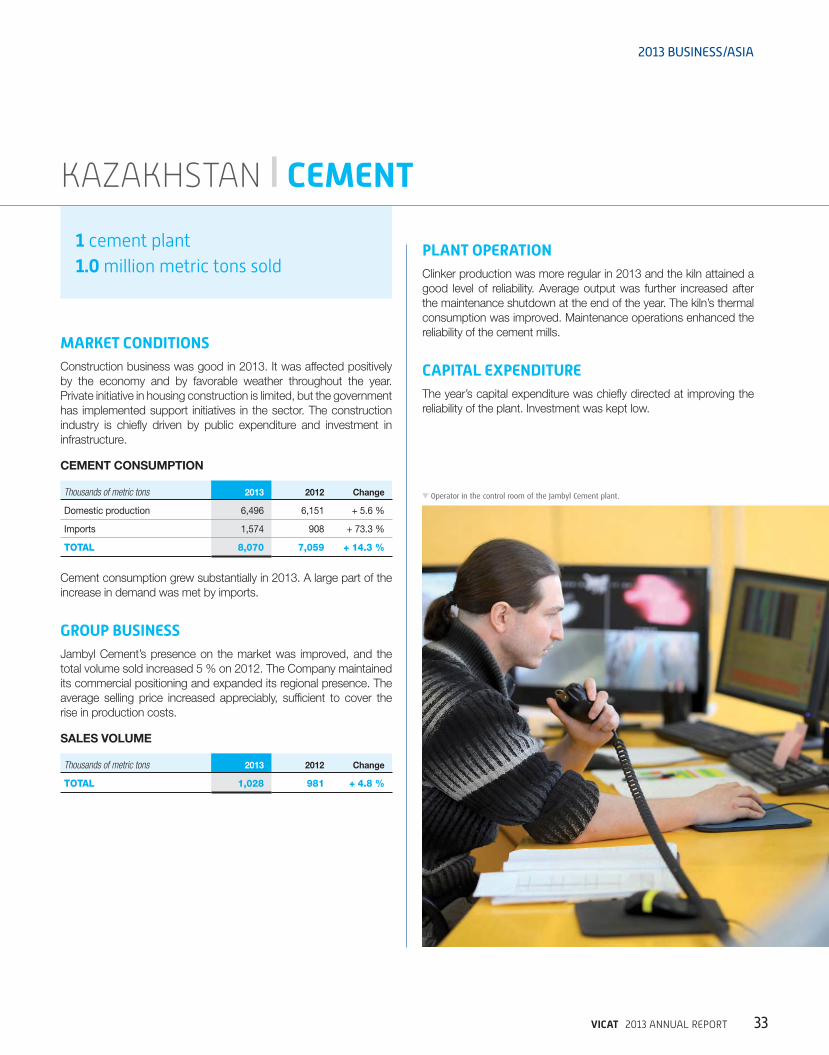
Operator in the control room of the Jambyl Cement plant.
VICAT 2013 ANNUAL REPORT34
INDIA | CEMENT
MARKET CONDITIONSThe slowdown of growth in India had consequences on the
housing sector, though it remains the highest consumer of cement.
Additionally, in the prelude to elections in 2014, most of the central
government’s infrastructure expenditure was halted to improve
budget results.
What is more, in the summer of 2013 India went through a period
of intense exchange-rate pressure which resulted in devaluation of
the rupee by about 20 % relative to hard currencies. The effect of
these tensions on the cost of imported goods and on interest rates
weighed on investments. On top of these economic causes came
problems of availability of sand and water in several regions.
CEMENT CONSUMPTION
Thousands of metric tons 2013 2012 Change
Southern India & Maharashtra 90.5 94.9 - 4.6 %
Cement consumption in India’s southern states (Andhra Pradesh,
Tamil Nadu, Karnataka, Kerala, and Goa) and in the State of
Maharashtra is estimated to have been 90.5 million metric tons in
2013, which is down 4.6 % on 2012. However the last quarter of
2013 was up 4.6 % on the same period in 2012.
GROUP BUSINESSThe products of both of the Group’s cement companies in India are
marketed under the brand name ‘Bharathi Cement’. Vicat Sagar
Cement Private Ltd (VSCPL) started marketing its products in
January 2013, ramping up production throughout the year.
SALES VOLUME
Thousands of metric tons 2013 2012 Change
TOTAL 3,235 2,538 + 27.5 %
2 cement plants3.2 million metric tons sold
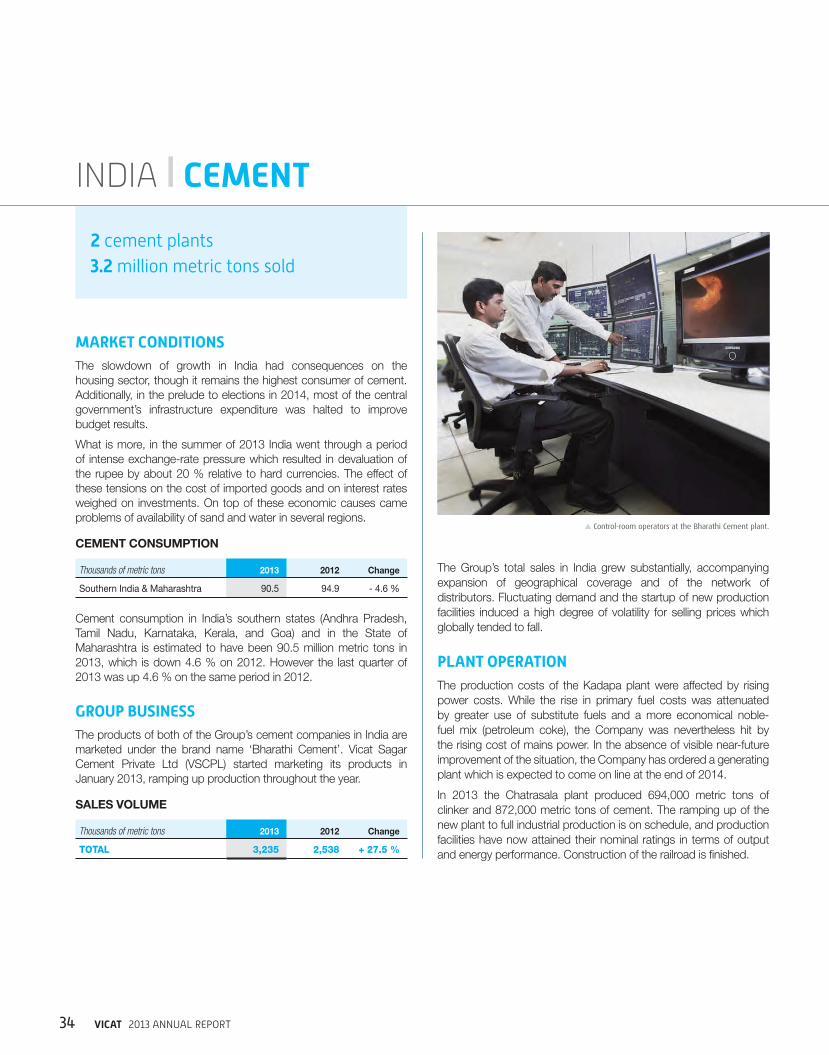
Control-room operators at the Bharathi Cement plant.
The Group’s total sales in India grew substantially, accompanying
expansion of geographical coverage and of the network of
distributors. Fluctuating demand and the startup of new production
facilities induced a high degree of volatility for selling prices which
globally tended to fall.
PLANT OPERATIONThe production costs of the Kadapa plant were affected by rising
power costs. While the rise in primary fuel costs was attenuated
by greater use of substitute fuels and a more economical noble-
fuel mix (petroleum coke), the Company was nevertheless hit by
the rising cost of mains power. In the absence of visible near-future
improvement of the situation, the Company has ordered a generating
plant which is expected to come on line at the end of 2014.
In 2013 the Chatrasala plant produced 694,000 metric tons of
clinker and 872,000 metric tons of cement. The ramping up of the
new plant to full industrial production is on schedule, and production
facilities have now attained their nominal ratings in terms of output
and energy performance. Construction of the railroad is finished.
VICAT 2013 ANNUAL REPORT 35
2013 BUSINESS/ASIA
GROUP BUSINESSMines & Rock (a wholly-owned subsidiary of Bharathi Cement)
operates an aggregate quarry about 50 km from Bangalore, in the
State of Karnataka, and sells its output in the outskirts of northern
Bangalore. Its business boomed in 2013, with a sales volume up
32 % to 561 thousand metric tons. The proportion of sand, a product
with high value-added, continued to grow, and now represents the
larger share of sales. Selling prices rose appreciably in 2013.
AGGREGATE
1 aggregate quarry0.6 million metric tons sold
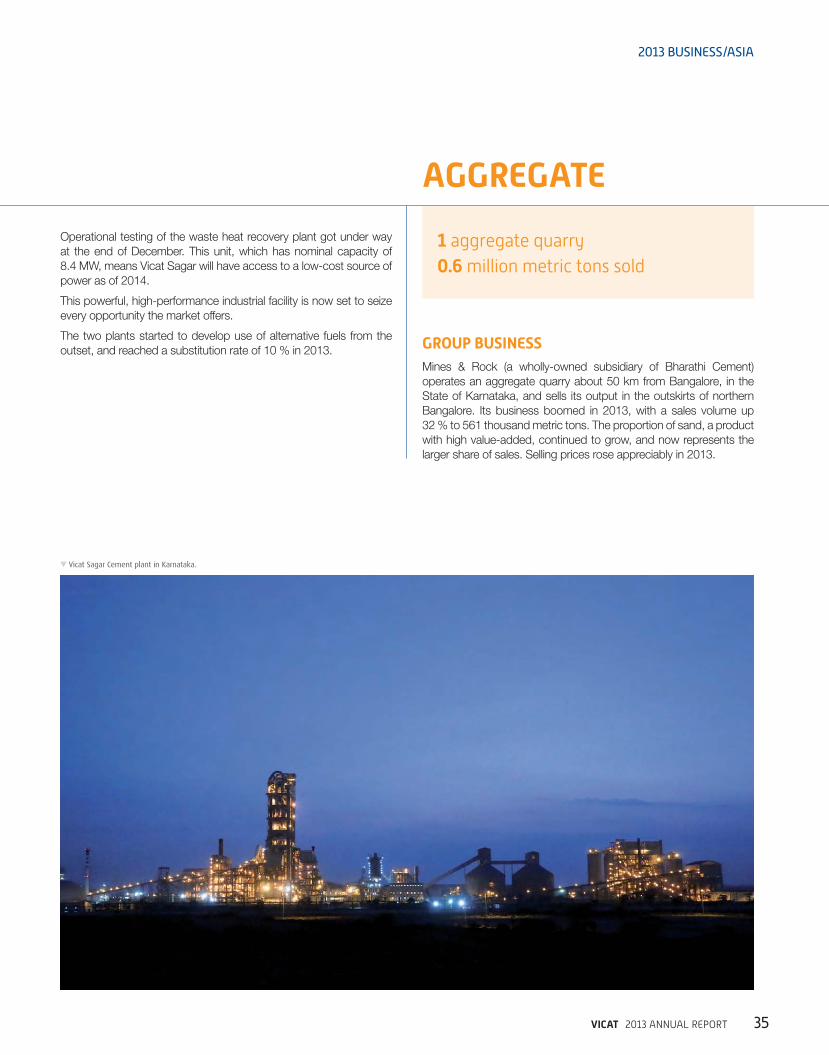
Vicat Sagar Cement plant in Karnataka.
Operational testing of the waste heat recovery plant got under way
at the end of December. This unit, which has nominal capacity of
8.4 MW, means Vicat Sagar will have access to a low-cost source of
power as of 2014.
This powerful, high-performance industrial facility is now set to seize
every opportunity the market offers.
The two plants started to develop use of alternative fuels from the
outset, and reached a substitution rate of 10 % in 2013.

VICAT 2013 ANNUAL REPORT36
Lebec cement plant in Californie (USA).

VICAT 2013 ANNUAL REPORT 37
THE VICAT GROUP IN 2013
FINANCIAL REPORT
COMMENTS ON RESULTS AND FINANCIAL POSITION 38
CONSOLIDATED FINANCIAL STATEMENTS AS OF DECEMBER 31, 2013 50
STATUTORY FINANCIAL STATEMENTS AS OF DECEMBER 31, 2013 105
ENVIRONMENTAL AND SOCIAL RESPONSIBILITY 125
LEGAL INFORMATION 149
1
2
3
4
5

VICAT 2013 ANNUAL REPORT38
1COMMENTS ON RESULTS AND FINANCIAL POSITION
1.1. CHANGE IN CONSOLIDATED SALES 39
1.2. CHANGE IN OPERATING PROFITABILITY 41
1.3. CHANGE IN FINANCIAL STRUCTURE 47
1.4. OUTLOOK AND OBJECTIVES 49

VICAT 2013 ANNUAL REPORT 39
COMMENTS ON RESULTS AND FINANCIAL POSITION
1
1
1
1
1
1
1
1
1.1. CHANGE IN CONSOLIDATED SALES
1.1. CHANGE IN CONSOLIDATED SALES
Consolidated sales for the year ended December 31, 2013 amounted to
€2,286 million, almost stable (- 0.3 %) and representing an increase of
2.9 % at constant consolidation scope and exchange rates compared
to the same period in 2012.
It should be noted that the exchange rate change was particularly
unfavorable this year, with a negative impact of €78 million on annual
sales.
The change in consolidated sales for the financial year 2013 by activity, compared to 2012 is as follows:
(in millions of Euros, except %) 2013 2012 Variation Change (%)
Of which
exchange rate
effect
Change in consolidation
scopeInternal growth
Cement 1,110 1,156 (46) - 4.0 % (56) - 10
Concrete and Aggregates 876 826 50 + 6.1 % (19) 6 64
Other Products & Services 300 310 (10) - 3.4 % (3) - (7)
TOTAL 2,286 2,292 (6) - 0.3 % (78) 6 66
During 2013, consolidated sales for the Cement business rose by 0.9 %
at constant consolidation scope and exchange rates. The declines
recorded in France and the West Africa and Middle East region were
offset by the ramp up of the Group's activity in India, dynamic growth
in Turkey, Switzerland and Kazakhstan, and the continued recovery in
the United States.
Consolidated sales in the Concrete & Aggregates business were up
7.7 % at constant consolidation scope and exchange rates.
Other Products & Services fell by 2.4 % at constant consolidation scope
and exchange rates.
The distribution of the Group’s operating sales by business (before inter-
sector eliminations) is as follows:
(as a percentage) 2013 2012
Cement 50.6 52.3
Concrete and Aggregates 34.2 32.5
Other Products & Services 15.2 15.2
TOTAL 100.0 100.0
Taking the year as a whole, the breakdown of operational sales among
the Group’s different activities shows that the Cement business share
of Group operational sales dropped to 50.6 % from 52.3 % in 2012,
as a result of a greater exchange rate effect than on the Concrete
and Aggregates business, bearing in mind the respective locations of
operations. The Concrete and Aggregates business grew to 34.2 % of
operational sales against 32.5 % in 2012, as a result of dynamic growth
in the United States, Switzerland and Turkey. Lastly, Other Products &
Services held steady at 15.2 % of operational sales as at December 31,
2013.
The share of the Group’s core businesses, namely Cement, Concrete
and Aggregates, remained more or less stable at nearly 85 % of
operational sales before eliminations.
The growth in volumes in the main businesses is as follows:
2013 2012 Growth
Cement (in thousand tonnes) 18,050 17,894 + 0.9 %
Concrete (in thousand m3) 8,525 7,928 + 7.5 %
Aggregates (in thousand tonnes) 22,773 21,516 + 5.8 %
Overall, sales growth reflects:
W higher volumes of cement sold, related to:
• sustained growth in Turkey, which benefited from very favorable
weather in the first half of the year and from a dynamic
macroeconomic environment throughout the year,
• increasing Group market share in India, in particular with the
commercial launch of Vicat Sagar Cement in the course of the
second quarter,
• a strong business rebound in the United States, supported by an
improving macroeconomic environment,
• the positive growth of Jambyl Cement in Kazakhstan,
• and lastly, solid growth of the business in Switzerland, which has
benefited from a continued positive sector's environment ;
VICAT 2013 ANNUAL REPORT40
1 COMMENTS ON RESULTS AND FINANCIAL POSITION
1.1. CHANGE IN CONSOLIDATED SALES
W these effects were partially offset by:
• economic and industry environment that remained difficult in France
and Italy, coupled with bad weather conditions in the first quarter
and fewer working days in France,
• disruptions in production and sales in Egypt stemming from a
difficult security situation, with some improvements nonetheless
at the end of the year,
• increased pressure on prices in India as a result of a difficult
macroeconomic environment and more competition,
• a slight fall in operations in West Africa as a result of lower prices
recorded in Senegal and lower export volumes, in spite of solid
domestic markets in Senegal and Mali.
Per business line:
W operational sales in the Cement business were up 1.2 % at constant
consolidation scope and exchange rates. This growth stemmed from
higher volumes in India, Turkey, Switzerland, Kazakhstan and the
United States. Volumes fell slightly in West Africa and dropped in
France, Egypt and Italy. Higher prices recorded in the United States,
Turkey, Kazakhstan, Egypt and Italy allowed to compensate for
declines in Senegal and especially India, which was hit by heightened
competitive pressure. Overall, prices held steady in France, in spite
of an unfavorable product mix at the end of the year;
W operational sales in the Concrete & Aggregates business grew by
6.8 % at constant consolidation scope and exchange rates. This
performance resulted from a steady increase in sales volumes of
cement across all regions apart from France, and of aggregates,
except in Senegal;
W operational sales in Other Products & Services grew by 1.6 % at
constant consolidation scope and exchange rates.
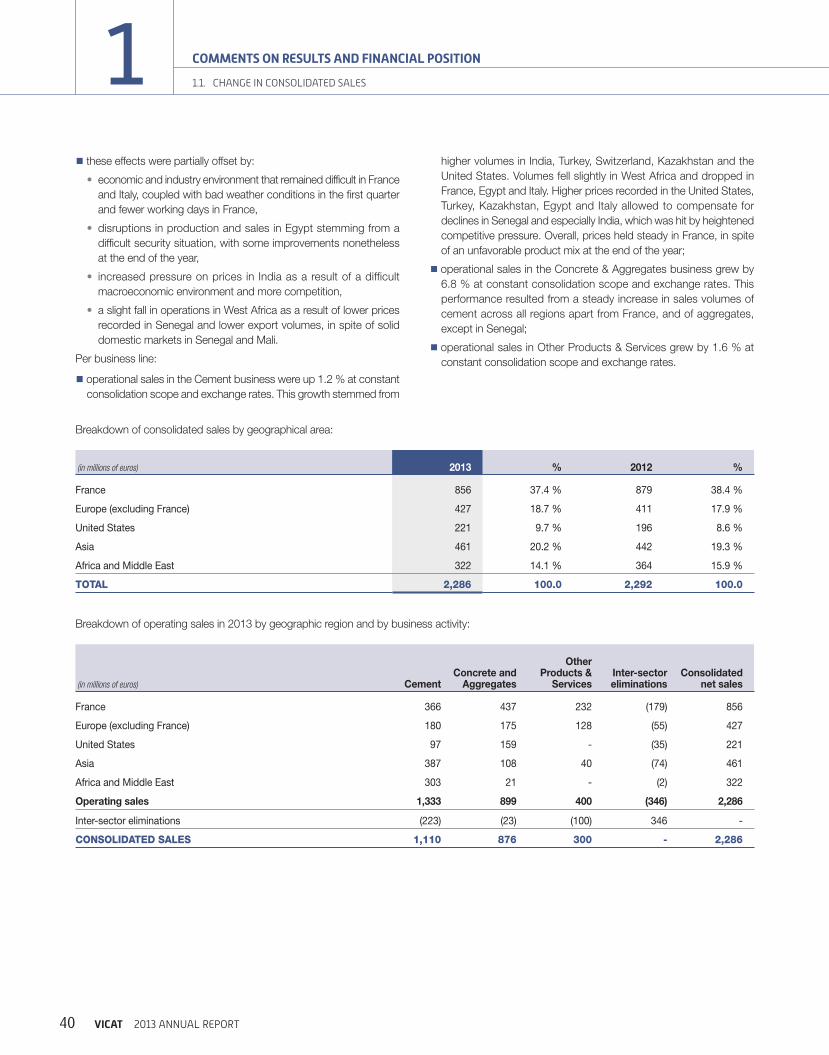
Breakdown of consolidated sales by geographical area:
(in millions of euros) 2013 % 2012 %
France 856 37.4 % 879 38.4 %
Europe (excluding France) 427 18.7 % 411 17.9 %
United States 221 9.7 % 196 8.6 %
Asia 461 20.2 % 442 19.3 %
Africa and Middle East 322 14.1 % 364 15.9 %
TOTAL 2,286 100.0 2,292 100.0
Breakdown of operating sales in 2013 by geographic region and by business activity:
(in millions of euros) CementConcrete and
Aggregates
Other Products &
ServicesInter-sector eliminations
Consolidated net sales
France 366 437 232 (179) 856
Europe (excluding France) 180 175 128 (55) 427
United States 97 159 - (35) 221
Asia 387 108 40 (74) 461
Africa and Middle East 303 21 - (2) 322
Operating sales 1,333 899 400 (346) 2,286
Inter-sector eliminations (223) (23) (100) 346 -
CONSOLIDATED SALES 1,110 876 300 - 2,286
VICAT 2013 ANNUAL REPORT 41
COMMENTS ON RESULTS AND FINANCIAL POSITION
1
1
1
1
1
1
1
1
1.2. CHANGE IN OPERATING PROFITABILITY
1.2. CHANGE IN OPERATING PROFITABILITY
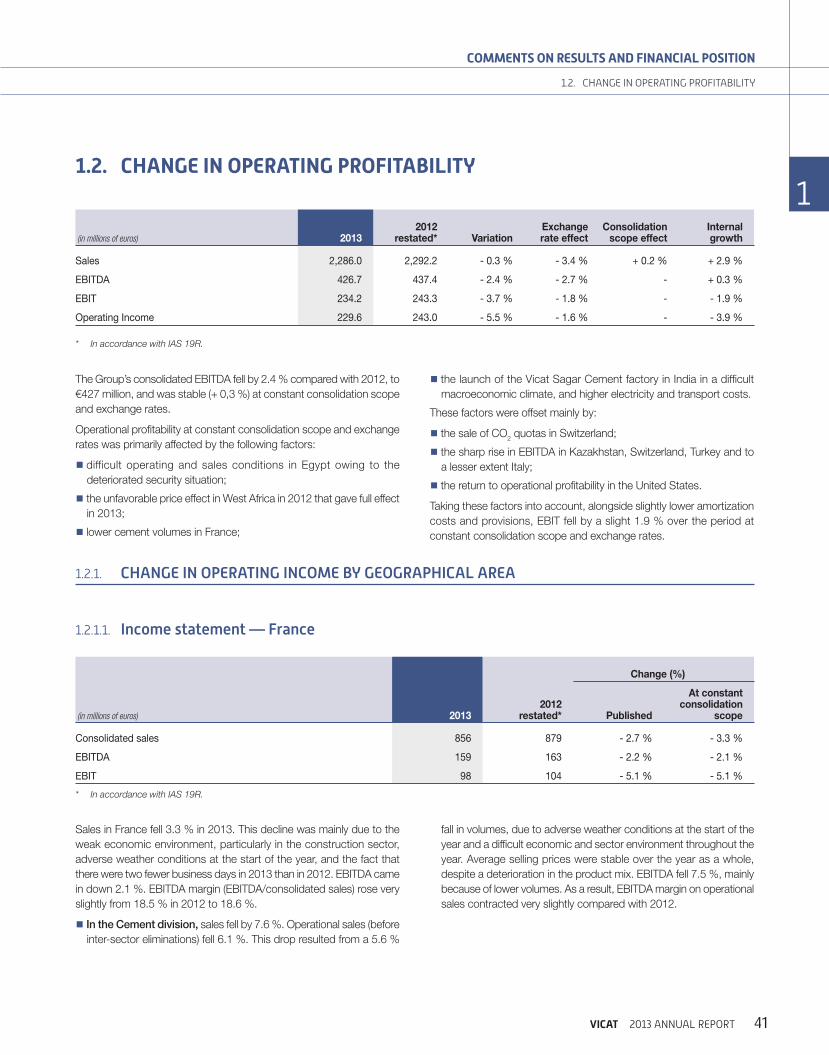
(in millions of euros) 20132012
restated* VariationExchange rate effect
Consolidation scope effect
Internal growth
Sales 2,286.0 2,292.2 - 0.3 % - 3.4 % + 0.2 % + 2.9 %
EBITDA 426.7 437.4 - 2.4 % - 2.7 % - + 0.3 %
EBIT 234.2 243.3 - 3.7 % - 1.8 % - - 1.9 %
Operating Income 229.6 243.0 - 5.5 % - 1.6 % - - 3.9 %
* In accordance with IAS 19R.
The Group’s consolidated EBITDA fell by 2.4 % compared with 2012, to
€427 million, and was stable (+ 0,3 %) at constant consolidation scope
and exchange rates.
Operational profitability at constant consolidation scope and exchange
rates was primarily affected by the following factors:
W difficult operating and sales conditions in Egypt owing to the
deteriorated security situation;
W the unfavorable price effect in West Africa in 2012 that gave full effect
in 2013;
W lower cement volumes in France;
W the launch of the Vicat Sagar Cement factory in India in a difficult
macroeconomic climate, and higher electricity and transport costs.
These factors were offset mainly by:
W the sale of CO2 quotas in Switzerland;
W the sharp rise in EBITDA in Kazakhstan, Switzerland, Turkey and to
a lesser extent Italy;
W the return to operational profitability in the United States.
Taking these factors into account, alongside slightly lower amortization
costs and provisions, EBIT fell by a slight 1.9 % over the period at
constant consolidation scope and exchange rates.
1.2.1. CHANGE IN OPERATING INCOME BY GEOGRAPHICAL AREA
1.2.1.1. Income statement — France
(in millions of euros) 20132012
restated*
Change (%)
Published
At constant consolidation
scope
Consolidated sales 856 879 - 2.7 % - 3.3 %
EBITDA 159 163 - 2.2 % - 2.1 %
EBIT 98 104 - 5.1 % - 5.1 %
* In accordance with IAS 19R.
Sales in France fell 3.3 % in 2013. This decline was mainly due to the
weak economic environment, particularly in the construction sector,
adverse weather conditions at the start of the year, and the fact that
there were two fewer business days in 2013 than in 2012. EBITDA came
in down 2.1 %. EBITDA margin (EBITDA/consolidated sales) rose very
slightly from 18.5 % in 2012 to 18.6 %.
W In the Cement division, sales fell by 7.6 %. Operational sales (before
inter-sector eliminations) fell 6.1 %. This drop resulted from a 5.6 %
fall in volumes, due to adverse weather conditions at the start of the
year and a difficult economic and sector environment throughout the
year. Average selling prices were stable over the year as a whole,
despite a deterioration in the product mix. EBITDA fell 7.5 %, mainly
because of lower volumes. As a result, EBITDA margin on operational
sales contracted very slightly compared with 2012.

VICAT 2013 ANNUAL REPORT42
1 COMMENTS ON RESULTS AND FINANCIAL POSITION
1.2. CHANGE IN OPERATING PROFITABILITY
W Sales in the Concrete & Aggregates division rose by 0.5 %.
Concrete volumes fell by around 1 %, while aggregates volumes
rose 5 %. Average selling prices were slightly higher in concrete, but
fell in the aggregates business. In 2013 as a whole, the division's
EBITDA in France rose 19.2 %, resulting in a much higher EBITDA
margin on operational sales than in 2012.
W In the Other Products & Services division, consolidated sales
decreased by 5.6 %. Despite lower business levels, EBITDA was
near-flat (- 1.0 %) and EBITDA margin on operational sales rose
slightly.
1.2.1.2. Income statement — Europe (excl. France)
(in millions of euros) 20132012
restated*
Change (%)
Published
At constant consolidation
scope and exchange rates
Consolidated sales 427 411 + 4.0 % + 6.0 %
EBITDA 114 105 + 9.0 % + 11.2 %
EBIT 85 76 + 12.4 % + 14.7 %
* In accordance with IAS 19R.
In Europe ex-France, sales rose by 6.0 %. EBITDA in this geographical
region increased by 11.2 %, with EBITDA margin rising in both
Switzerland and Italy.
In Switzerland, sales totalled €407 million, representing a solid increase
in a market that remained buoyant throughout the year. EBITDA also
rose 10.3 %. EBITDA margin (EBITDA/consolidated sales) came in at
27.2 %, up from 26.5 % in 2012.
W In Cement, consolidated sales amounted to €113 million, with firm
volume growth but a slight fall in selling prices. EBITDA in the Swiss
cement business rose 12.0 % (after taking into account the proceeds
from selling CO2 quotas) relative to 2012.
W In the Concrete & Aggregates business, sales rose by 13.1 % in
2013. Selling prices rose slightly in concrete but fell in aggregates due
to a small adverse shift in the product mix. On this basis, EBITDA in
the Swiss concrete and aggregates business rose 12.4 % in 2013.
EBITDA margin on operational sales was stable relative to 2012.
W The Other Products & Services division posted a 2.2 % increase
in sales. EBITDA rose 1.8 % relative to 2012.
In Italy, sales fell 18.1 % in 2013, due to very tough macroeconomic
and sector conditions. The increase in selling prices failed to offset the
impact of the 25 % drop in volumes. However, the targeted commercial
policy resulted in a 53.2 % increase in EBITDA relative to 2012. As a
result, EBITDA margin on operational sales also rose sharply in 2013.
1.2.1.3. Income statement — United States
(in millions of euros) 20132012
restated*
Change (%)
Published
At constant consolidation
scope and exchange rates
Consolidated sales 221 196 + 12.6 % + 16.5 %
EBITDA 5 (5) NC NC
EBIT (17) (36) + 51.6 % + 49.9 %
* In accordance with IAS 19R.
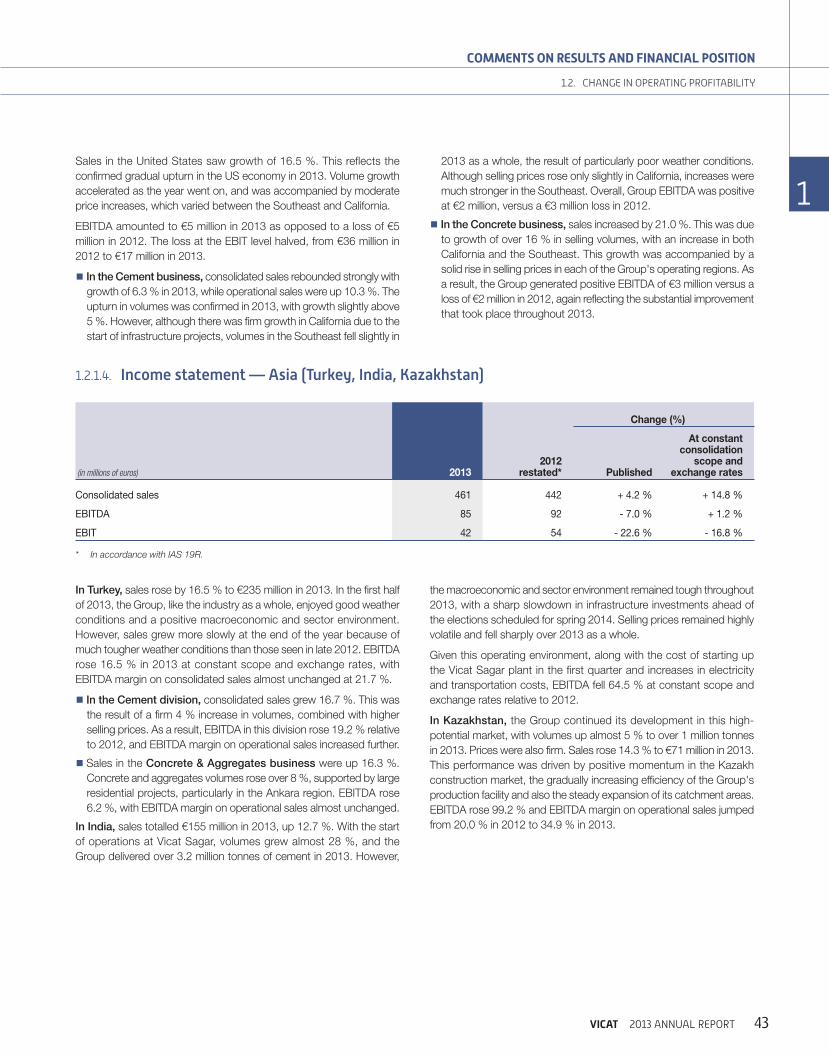
VICAT 2013 ANNUAL REPORT 43
COMMENTS ON RESULTS AND FINANCIAL POSITION
1
1
1
1
1
1
1
1
1.2. CHANGE IN OPERATING PROFITABILITY
Sales in the United States saw growth of 16.5 %. This reflects the
confirmed gradual upturn in the US economy in 2013. Volume growth
accelerated as the year went on, and was accompanied by moderate
price increases, which varied between the Southeast and California.
EBITDA amounted to €5 million in 2013 as opposed to a loss of €5
million in 2012. The loss at the EBIT level halved, from €36 million in
2012 to €17 million in 2013.
W In the Cement business, consolidated sales rebounded strongly with
growth of 6.3 % in 2013, while operational sales were up 10.3 %. The
upturn in volumes was confirmed in 2013, with growth slightly above
5 %. However, although there was firm growth in California due to the
start of infrastructure projects, volumes in the Southeast fell slightly in
2013 as a whole, the result of particularly poor weather conditions.
Although selling prices rose only slightly in California, increases were
much stronger in the Southeast. Overall, Group EBITDA was positive
at €2 million, versus a €3 million loss in 2012.
W In the Concrete business, sales increased by 21.0 %. This was due
to growth of over 16 % in selling volumes, with an increase in both
California and the Southeast. This growth was accompanied by a
solid rise in selling prices in each of the Group's operating regions. As
a result, the Group generated positive EBITDA of €3 million versus a
loss of €2 million in 2012, again reflecting the substantial improvement
that took place throughout 2013.
1.2.1.4. Income statement — Asia (Turkey, India, Kazakhstan)
(in millions of euros) 20132012
restated*
Change (%)
Published
At constant consolidation
scope and exchange rates
Consolidated sales 461 442 + 4.2 % + 14.8 %
EBITDA 85 92 - 7.0 % + 1.2 %
EBIT 42 54 - 22.6 % - 16.8 %
* In accordance with IAS 19R .
In Turkey, sales rose by 16.5 % to €235 million in 2013. In the first half
of 2013, the Group, like the industry as a whole, enjoyed good weather
conditions and a positive macroeconomic and sector environment.
However, sales grew more slowly at the end of the year because of
much tougher weather conditions than those seen in late 2012. EBITDA
rose 16.5 % in 2013 at constant scope and exchange rates, with
EBITDA margin on consolidated sales almost unchanged at 21.7 %.
W In the Cement division, consolidated sales grew 16.7 %. This was
the result of a firm 4 % increase in volumes, combined with higher
selling prices. As a result, EBITDA in this division rose 19.2 % relative
to 2012, and EBITDA margin on operational sales increased further.
W Sales in the Concrete & Aggregates business were up 16.3 %.
Concrete and aggregates volumes rose over 8 %, supported by large
residential projects, particularly in the Ankara region. EBITDA rose
6.2 %, with EBITDA margin on operational sales almost unchanged.
In India, sales totalled €155 million in 2013, up 12.7 %. With the start
of operations at Vicat Sagar, volumes grew almost 28 %, and the
Group delivered over 3.2 million tonnes of cement in 2013. However,
the macroeconomic and sector environment remained tough throughout
2013, with a sharp slowdown in infrastructure investments ahead of
the elections scheduled for spring 2014. Selling prices remained highly
volatile and fell sharply over 2013 as a whole.
Given this operating environment, along with the cost of starting up
the Vicat Sagar plant in the first quarter and increases in electricity
and transportation costs, EBITDA fell 64.5 % at constant scope and
exchange rates relative to 2012.
In Kazakhstan, the Group continued its development in this high-
potential market, with volumes up almost 5 % to over 1 million tonnes
in 2013. Prices were also firm. Sales rose 14.3 % to €71 million in 2013.
This performance was driven by positive momentum in the Kazakh
construction market, the gradually increasing efficiency of the Group's
production facility and also the steady expansion of its catchment areas.
EBITDA rose 99.2 % and EBITDA margin on operational sales jumped
from 20.0 % in 2012 to 34.9 % in 2013.

VICAT 2013 ANNUAL REPORT44
1 COMMENTS ON RESULTS AND FINANCIAL POSITION
1.2. CHANGE IN OPERATING PROFITABILITY
1.2.1.5. Income statement — Africa and Middle East
(in millions of euros) 20132012
restated*
Change (%)
Published
At constant consolidation
scope and exchange rates
Consolidated sales 322 364 - 11.6 % - 7.6 %
EBITDA 63 83 - 24.9 % - 22.6 %
EBIT 26 46 - 42.7 % - 42.5 %
* In accordance with IAS 19R.
In Africa and the Middle East, consolidated sales fell by 7.6 % at
constant scope and exchange rates. EBITDA came to €63 million in
2013 compared with €83 million in 2012.
In Egypt, consolidated sales were down 14.1 %, due to a 27 % drop in
volumes. This decline was partly offset by an increase in average selling
prices in 2013 as a whole. Group business levels were again affected
by the difficult security situation in 2013, which hampered the plant's
operations and made it harder to sell its production. As a result, Group
EBITDA fell 46.3 % relative to 2012.
In West Africa, sales fell by 4.7 % year-on-year. Cement volumes were
down 2.1 %. Although selling prices gradually stabilised in Senegal on a
sequential basis, they were lower than in 2012. Vicat's EBITDA for the
region was down 13.4 % compared with 2012.
1.2.2. CHANGE IN OPERATING PROFITABILITY PER BUSINESS
The following paragraphs show the breakdown of operating income by business, as well as an analysis of the change between 2013 and 2012.
1.2.2.1. Change in operating income in the Cement business
(in millions of euros) 20132012
restated* VariationOrganic change
Operational sales 1,333 1,377 - 3.2 % + 1.2 %
Inter-sector eliminations (223) (221)
Contribution to consolidated sales 1,110 1,156 - 4.0 % + 0.9 %
EBITDA 314 336 - 6.5 % - 3.5 %
EBIT 179 202 - 11.4 % - 9.6 %
* In accordance with IAS 19R.
Consolidated sales in the Cement division fell 4.0 %, but rose 0.9 %
at constant scope and exchange rates. Movements in average selling
prices differed between the Group's regions. They were flat overall in
France and rose significantly in Turkey, Kazakhstan, Egypt, the United
States and Italy, making up for the decline seen in India and West
Africa. This overall stability in selling prices was accompanied by a
0.9 % increase in volumes. Lower volumes in France, Egypt, West
Africa and Italy were fully offset by the build-up of Vicat's business in
India and Kazakhstan, firm momentum in Turkey and Switzerland, and
the confirmed upturn in the United States.
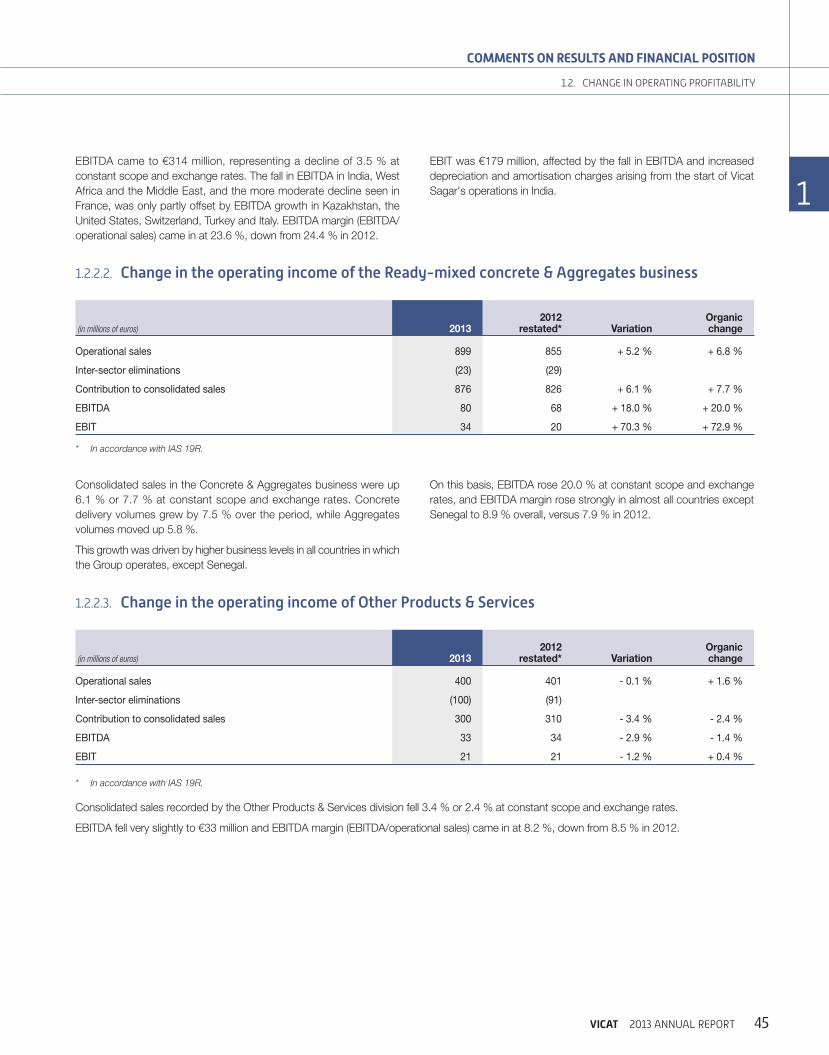
VICAT 2013 ANNUAL REPORT 45
COMMENTS ON RESULTS AND FINANCIAL POSITION
1
1
1
1
1
1
1
1
1.2. CHANGE IN OPERATING PROFITABILITY
EBITDA came to €314 million, representing a decline of 3.5 % at
constant scope and exchange rates. The fall in EBITDA in India, West
Africa and the Middle East, and the more moderate decline seen in
France, was only partly offset by EBITDA growth in Kazakhstan, the
United States, Switzerland, Turkey and Italy. EBITDA margin (EBITDA/
operational sales) came in at 23.6 %, down from 24.4 % in 2012.
EBIT was €179 million, affected by the fall in EBITDA and increased
depreciation and amortisation charges arising from the start of Vicat
Sagar's operations in India.
1.2.2.2. Change in the operating income of the Ready-mixed concrete & Aggregates business
(in millions of euros) 20132012
restated* VariationOrganic change
Operational sales 899 855 + 5.2 % + 6.8 %
Inter-sector eliminations (23) (29)
Contribution to consolidated sales 876 826 + 6.1 % + 7.7 %
EBITDA 80 68 + 18.0 % + 20.0 %
EBIT 34 20 + 70.3 % + 72.9 %
* In accordance with IAS 19R.
Consolidated sales in the Concrete & Aggregates business were up
6.1 % or 7.7 % at constant scope and exchange rates. Concrete
delivery volumes grew by 7.5 % over the period, while Aggregates
volumes moved up 5.8 %.
This growth was driven by higher business levels in all countries in which
the Group operates, except Senegal.
On this basis, EBITDA rose 20.0 % at constant scope and exchange
rates, and EBITDA margin rose strongly in almost all countries except
Senegal to 8.9 % overall, versus 7.9 % in 2012.
1.2.2.3. Change in the operating income of Other Products & Services
(in millions of euros) 20132012
restated* VariationOrganic change
Operational sales 400 401 - 0.1 % + 1.6 %
Inter-sector eliminations (100) (91)
Contribution to consolidated sales 300 310 - 3.4 % - 2.4 %
EBITDA 33 34 - 2.9 % - 1.4 %
EBIT 21 21 - 1.2 % + 0.4 %
* In accordance with IAS 19R.
Consolidated sales recorded by the Other Products & Services division fell 3.4 % or 2.4 % at constant scope and exchange rates.
EBITDA fell very slightly to €33 million and EBITDA margin (EBITDA/operational sales) came in at 8.2 %, down from 8.5 % in 2012.

VICAT 2013 ANNUAL REPORT46
1 COMMENTS ON RESULTS AND FINANCIAL POSITION
1.2. CHANGE IN OPERATING PROFITABILITY
1.2.3. CHANGE IN FINANCIAL INCOME
(in millions of euros) 20132012
restated* Change
Cost of net financial debt (44.0) (34.4) - 27.7 %
Other financial income and expenses (9.0) (4.4) - 109.5 %
Net financial income (53.0) (38.8) - 36.8 %
* In accordance with IAS 19R.
1.2.4. CHANGE IN TAXES
(In millions of euros) 20132012
restated* Change
Current taxes (74.5) (72.4) - 3.0 %
Deferred tax 17.3 12.9 + 33.9 %
TOTAL TAXES (57.2) (59.5) + 3.7 %
* In accordance with IAS 19R.
The 3.7 % decline in income tax expenses stemmed from a 13.6 %
decrease in current profit (loss) before income tax and an increase in the
Group’s average tax rate to 32.4 %, against 29.1 % at December 31,
2012.
This increase in the average tax rate resulted from a 6 point increase in
the average income tax rate levied on French businesses, resulting in:
W the increase from 36 % to 38 % (€1.2 million) in the rate applicable
in France;
W the 85 % limit on the deductibility of financial expenses in France
(impact of €0.9 million);
W the additional tax on dividends paid (3 %) implemented in France this
year (impact of €2 million);
W higher deductions at source resulting from higher dividends paid in
France and shared charges and expenses on these dividends.
1.2.5. CHANGE IN CONSOLIDATED NET INCOME
Consolidated net income fell by 14.7 % to €123 million at constant
consolidation scope and exchange rates, including a Group share
of €120.3 million, down 4.5 % at constant consolidation scope and
exchange rates.
The €14.2 million increase in overall financial expenses to €53.0 million
is primarily due to higher net financial debt cost resulting from the end
of the financial expenses capitalization period following the launch of
Vicat Sagar Cement and Gulbarga Power in India, partially offset by
lower financial expenses in France as a result of a reduction in the
debt of the parent company. Moreover, other net financial income and
expenses recorded both the increase in discounting expenses (IAS 19R)
and negative changes in fair value of financial instruments (IAS 39).

VICAT 2013 ANNUAL REPORT 47
COMMENTS ON RESULTS AND FINANCIAL POSITION
1
1
1
1
1
1
1
1
1.3. CHANGE IN FINANCIAL STRUCTURE
1.3. CHANGE IN FINANCIAL STRUCTURE
At December 31, 2013, the Group had a solid financial structure with significant shareholders’ equity and net debt reduced by €80 million. Net debt
excluding a put option and including financial instruments was €1,065 million.
On this basis, the Group’s gearing and leverage at December 31, 2013 improved and were 46.5 % and 2.49xEBITDA, respectively.
(in millions of euros) 2013 2012 (revised) Change
Gross financial debt 1,307 1,382 - 75
Cash and cash equivalents (242) (237) + 5
Net financial debt (excluding put option) 1,065 1,145 - 80
Consolidated shareholders’ equity 2,292 2,415 - 123
Gearing 46.5 % 47.4 % - 0.9pt
EBITDA (in millions of euros) 426.7 437.4 - 10.7
Leverage x2.49 x2.62 0.13pt
The medium and long-term loan agreements contain specific covenants,
especially as regards compliance with financial ratios. Considering the
small number of companies concerned (essentially Vicat SA, the Group’s
parent company), the net debt level and the liquidity of the Group’s
balance sheet, the existence of these covenants does not constitute
a risk for the Group’s financial position. As at December 31, 2013, the
Group is compliant with all ratios required by covenants included in
financing agreements.
As at December 31, 2013, the Group had €326 million in unused
confirmed lines of credit that have not been allocated to the hedging of
liquidity risk on commercial paper (€416 million as at December 31, 2012).
The Group also has a €300 million commercial paper issue program.
As at December 31, 2013, commercial paper issued by the Group
amounted to €290 million. Commercial paper consists of short-term
debt instruments backed by confirmed lines of credit for the amount
issued and classified as medium-term borrowings in the consolidated
balance sheet.
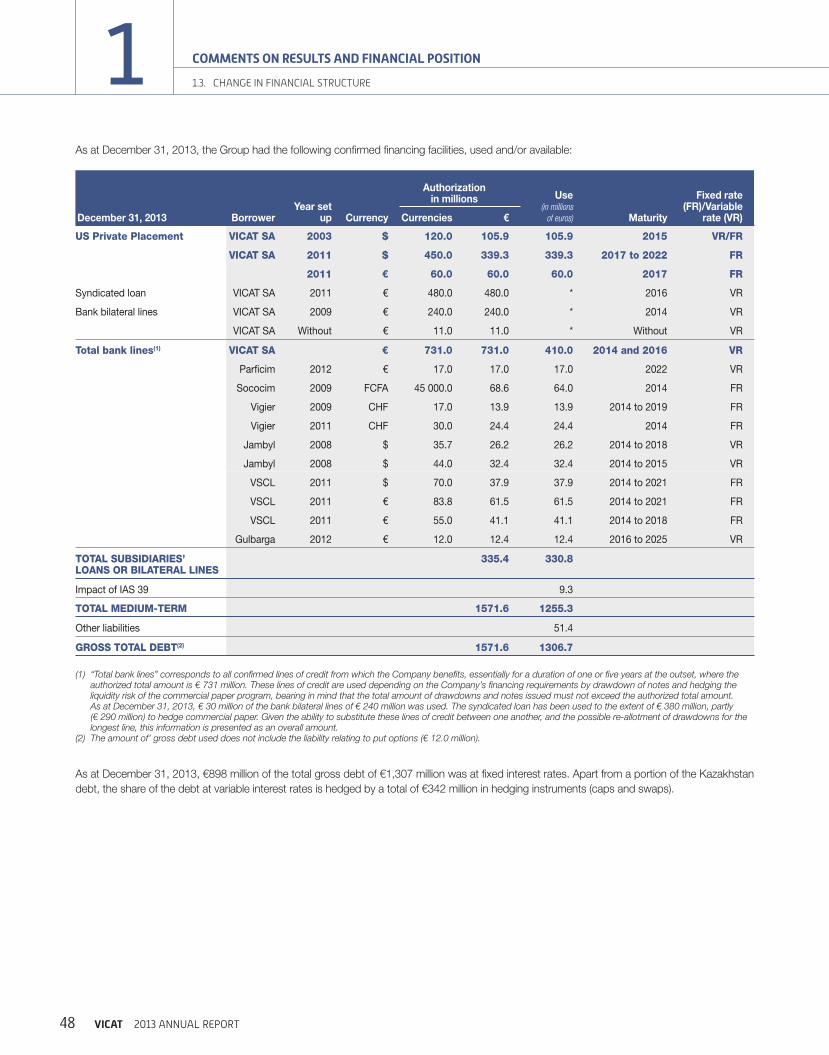
VICAT 2013 ANNUAL REPORT48
1 COMMENTS ON RESULTS AND FINANCIAL POSITION
1.3. CHANGE IN FINANCIAL STRUCTURE
As at December 31, 2013, the Group had the following confirmed financing facilities, used and/or available:
December 31, 2013 BorrowerYear set
up Currency
Authorization in millions Use
(in millions
of euros) Maturity
Fixed rate (FR)/Variable
rate (VR)Currencies €
US Private Placement VICAT SA 2003 $ 120.0 105.9 105.9 2015 VR/FR
VICAT SA 2011 $ 450.0 339.3 339.3 2017 to 2022 FR
2011 € 60.0 60.0 60.0 2017 FR
Syndicated loan VICAT SA 2011 € 480.0 480.0 * 2016 VR
Bank bilateral lines VICAT SA 2009 € 240.0 240.0 * 2014 VR
VICAT SA Without € 11.0 11.0 * Without VR
Total bank lines(1) VICAT SA € 731.0 731.0 410.0 2014 and 2016 VR
Parficim 2012 € 17.0 17.0 17.0 2022 VR
Sococim 2009 FCFA 45 000.0 68.6 64.0 2014 FR
Vigier 2009 CHF 17.0 13.9 13.9 2014 to 2019 FR
Vigier 2011 CHF 30.0 24.4 24.4 2014 FR
Jambyl 2008 $ 35.7 26.2 26.2 2014 to 2018 VR
Jambyl 2008 $ 44.0 32.4 32.4 2014 to 2015 VR
VSCL 2011 $ 70.0 37.9 37.9 2014 to 2021 FR
VSCL 2011 € 83.8 61.5 61.5 2014 to 2021 FR
VSCL 2011 € 55.0 41.1 41.1 2014 to 2018 FR
Gulbarga 2012 € 12.0 12.4 12.4 2016 to 2025 VR
TOTAL SUBSIDIARIES’ LOANS OR BILATERAL LINES
335.4 330.8
Impact of IAS 39 9.3
TOTAL MEDIUM-TERM 1571.6 1255.3
Other liabilities 51.4
GROSS TOTAL DEBT(2) 1571.6 1306.7
(1) “Total bank lines” corresponds to all confirmed lines of credit from which the Company benefits, essentially for a duration of one or five years at the outset, where the authorized total amount is € 731 million. These lines of credit are used depending on the Company’s financing requirements by drawdown of notes and hedging the liquidity risk of the commercial paper program, bearing in mind that the total amount of drawdowns and notes issued must not exceed the authorized total amount. As at December 31, 2013, € 30 million of the bank bilateral lines of € 240 million was used. The syndicated loan has been used to the extent of € 380 million, partly (€ 290 million) to hedge commercial paper. Given the ability to substitute these lines of credit between one another, and the possible re-allotment of drawdowns for the longest line, this information is presented as an overall amount.
(2) The amount of’ gross debt used does not include the liability relating to put options (€ 12.0 million).
As at December 31, 2013, €898 million of the total gross debt of €1,307 million was at fixed interest rates. Apart from a portion of the Kazakhstan
debt, the share of the debt at variable interest rates is hedged by a total of €342 million in hedging instruments (caps and swaps).

VICAT 2013 ANNUAL REPORT 49
COMMENTS ON RESULTS AND FINANCIAL POSITION
1
1
1
1
1
1
1
1
1.4. OUTLOOK AND OBJECTIVES
1.4. OUTLOOK AND OBJECTIVES
1.4.1. THE GROUP’S BUSINESS PROSPECTS IN ITS MARKETS
For a discussion of the salient facts for its various markets, the Group
refers readers to the information reported when its 2013 results were
published.
With respect to 2014, the Group would like to give the following
assessments of the different markets in which it operates:
W i n France, the Group forecasts that its sector will slowly stabilize
in 2014, given the current low levels of consumption and a
macroeconomic situation that is expected to improve only very
gradually. Consequently, the Group anticipates slightly lower volumes
in a pricing environment that should remain relatively favorable;
W i n Switzerland, volumes will suffer from an unfavorable basis of
comparison, following a particularly strong showing in 2013, in a
context of expected price stabilization;
W i n Italy, given a macroeconomic environment still likely to be affected
by the economic crisis, volumes are expected to be down once again,
but should gradually begin to decline less steeply. However, given the
first signs of consolidation in this market and the Group’s selective
business approach, selling prices should remain strong;
W i n the United States, volumes are expected to ramp up once again,
in line with the pace of macroeconomic recovery in the country, with
strongly higher selling prices from the second quarter of the year;
W i n Turkey, which is entering a year of local and presidential elections,
the Group’s performance is expected to benefit from continuing
favorable industry trends, but amid a macroeconomic environment
driven by foreign exchange volatility and higher interest rates. In
addition, volumes in 2014 are expected to suffer early in the year from
an unfavorable basis of comparison owing to the strong deviation
from seasonal weather patterns in the first half of 2013. In this context,
the Group expects continuing improvement in performance in this
country, but at a slower pace than in the past;
W i n Egypt, affected by a situation that still offers very limited visibility, the
gradual restoration of security should allow the Group’s business to
return to growth, accompanied by improvements in performance. The
Group is confident of positive developments in the Egyptian market
in the medium and long term;
W i n West Africa, the market is expected to remain broadly positive
in terms of consumption. Price movements may be affected by the
possible arrival of a new competitor, among other factors. In the
medium term, the Group remains confident in its ability to take full
advantage of its modern production facilities, its knowledge of the
Senegalese market, and its export capacities across the entire region;
W i n India, the low level of infrastructure investment is expected to
continue to shape the market environment in the short term, in
anticipation of elections scheduled to be held in April 2014. Against
this backdrop, prices will remain very volatile and probably still under
pressure ahead of a gradual recovery in investments expected during
the second half of 2014. In the medium and long term, the Group
remains very confident in its ability to take full advantage of the quality
of its production facilities and its positions in a market still offering
particularly attractive growth potential;
W i n Kazakhstan, buoyed by its strong geographic position and highly
efficient production facilities, the Group is well placed to take full
advantage of a market expected to remain strong in terms of both
volumes and prices.
1.4.2. GROUP OBJECTIVES
In the context described above, and with the industrial and commercial
start-up of its Vicat Sagar Cement greenfield plant in India in May 2013 ,
the Vicat Group has completed its ambitious investment program which
has enabled it to significantly strengthen its geographical diversification,
while at the same time paving the way for long-term profitable growth.
The Group now intends to take advantage of its strong market positions,
the quality of its industrial plant, and its strict control of costs to effectively
maximize its generation of cash flow and reduce its debt level, before
embarking on a new phase in its international growth strategy.

50 VICAT 2013 ANNUAL REPORT
2CONSOLIDATED FINANCIAL STATEMENTS AS OF DECEMBER 31, 2013
CONSOLIDATED STATEMENT OF FINANCIAL POSITION AT DECEMBER 31, 2013 51
CONSOLIDATED INCOME STATEMENT FOR THE YEAR ENDED ON DECEMBER 31, 2013 52
CONSOLIDATED STATEMENT OF COMPREHENSIVE INCOME FOR THE YEAR ENDED DECEMBER 31, 2013 53
CONSOLIDATED CASH FLOW STATEMENT FOR THE YEAR ENDED DECEMBER 31, 2013 54
STATEMENT OF CHANGES IN CONSOLIDATED EQUITY FOR THE YEAR ENDED DECEMBER 31, 2013 55
NOTES TO THE CONSOLIDATED FINANCIAL STATEMENTS 56
STATUTORY AUDITORS’ REPORT ON THE CONSOLIDATED FINANCIAL STATEMENTS 103

51VICAT 2013 ANNUAL REPORT
CONSOLIDATED FINANCIAL STATEMENTS AS OF DECEMBER 31, 2013
2
2
2
2
2
2
2
CONSOLIDATED STATEMENT OF FINANCIAL POSITION AT DECEMBER 31, 2013
CONSOLIDATED STATEMENT OF FINANCIAL POSITION AT DECEMBER 31, 2013
(in thousands of euros) Notes December 31, 2013 December 31, 2012*
ASSETS
Non-current assetsGoodwill 3 946,569 995,320
Other intangible assets 4 100,103 100,417
Tangible assets 5 2,102,012 2,271,210
Investment properties 7 19,107 19,557
Investments in associated companies 8 38,213 37,731
Deferred tax assets 25 101,671 89,162
Receivables and other non-current financial assets 9 133,738 100,332
TOTAL NON-CURRENT ASSETS 3,441,413 3,613,729
Current assetsInventories and work-in-progress 10 359,712 381,893
Trade and other receivables 11 348,309 354,877
Current tax assets 29,866 29,455
Other receivables and related accounts 11 127,963 146,458
Cash and cash equivalents 12 241,907 237,344
TOTAL CURRENT ASSETS 1,107,757 1,150,027
TOTAL ASSETS 4,549,170 4,763,756
LIABILITIES AND SHAREHOLDERS’ EQUITY
Shareholders’ equityShare capital 13 179,600 179,600
Additional paid-in capital 11,207 11,207
Consolidated reserves 1,818,942 1,890,004
Shareholders’ equity 2,009,749 2,080,811
Minority interests 282,216 334,036
SHAREHOLDERS’ EQUITY AND MINORITY INTERESTS 2,291,965 2,414,847
Non-current liabilitiesProvisions for pensions and other post-employment benefits 14 87,584 120,951
Other provisions 15 77,208 84,334
Financial debts and put options 16 1,201,953 1,197,703
Deferred tax liabilities 25 215,751 216,180
Other non-current liabilities 10,394 26,557
TOTAL NON-CURRENT LIABILITIES 1,592,890 1,645,725
Current liabilitiesProvisions 15 12,494 9,967
Financial debts and put options at less than one year 16 172,604 232,352
Trade and other accounts payable 276,633 260,189
Current taxes payable 25,354 27,751
Other liabilities 18 177,230 172,925
TOTAL CURRENT LIABILITIES 664,315 703,184
TOTAL LIABILITIES 2,257,205 2,348,909
TOTAL EQUITY AND LIABILITIES 4,549,170 4,763,756
* As the revised version of IAS 19, which is mandatory for annual periods beginning on or after January 1, 2013, must also be applied retrospectively, the financial statements for the year ended December 31, 2012 were restated in compliance with the new standard for comparative purposes. The impacts of these restatements are reflected in note 35.
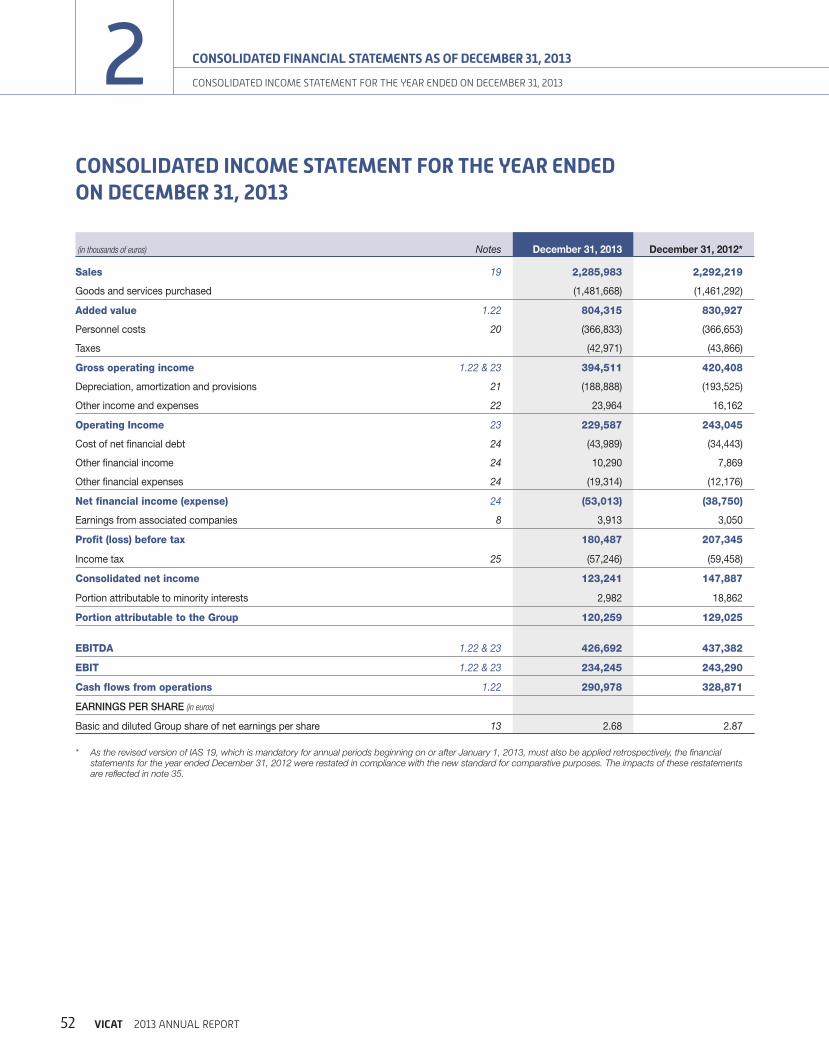
52 VICAT 2013 ANNUAL REPORT
2 CONSOLIDATED FINANCIAL STATEMENTS AS OF DECEMBER 31, 2013
CONSOLIDATED INCOME STATEMENT FOR THE YEAR ENDED ON DECEMBER 31, 2013
CONSOLIDATED INCOME STATEMENT FOR THE YEAR ENDED ON DECEMBER 31, 2013
(in thousands of euros) Notes December 31, 2013 December 31, 2012*
Sales 19 2,285,983 2,292,219
Goods and services purchased (1,481,668) (1,461,292)
Added value 1.22 804,315 830,927
Personnel costs 20 (366,833) (366,653)
Taxes (42,971) (43,866)
Gross operating income 1.22 & 23 394,511 420,408
Depreciation, amortization and provisions 21 (188,888) (193,525)
Other income and expenses 22 23,964 16,162
Operating Income 23 229,587 243,045
Cost of net financial debt 24 (43,989) (34,443)
Other financial income 24 10,290 7,869
Other financial expenses 24 (19,314) (12,176)
Net financial income (expense) 24 (53,013) (38,750)
Earnings from associated companies 8 3,913 3,050
Profit (loss) before tax 180,487 207,345
Income tax 25 (57,246) (59,458)
Consolidated net income 123,241 147,887
Portion attributable to minority interests 2,982 18,862
Portion attributable to the Group 120,259 129,025
EBITDA 1.22 & 23 426,692 437,382
EBIT 1.22 & 23 234,245 243,290
Cash flows from operations 1.22 290,978 328,871
EARNINGS PER SHARE (in euros)
Basic and diluted Group share of net earnings per share 13 2.68 2.87
* As the revised version of IAS 19, which is mandatory for annual periods beginning on or after January 1, 2013, must also be applied retrospectively, the financial statements for the year ended December 31, 2012 were restated in compliance with the new standard for comparative purposes. The impacts of these restatements are reflected in note 35.

53VICAT 2013 ANNUAL REPORT
CONSOLIDATED FINANCIAL STATEMENTS AS OF DECEMBER 31, 2013
2
2
2
2
2
2
2
CONSOLIDATED STATEMENT OF COMPREHENSIVE INCOME FOR THE YEAR ENDED DECEMBER 31, 2013
CONSOLIDATED STATEMENT OF COMPREHENSIVE INCOME FOR THE YEAR ENDED DECEMBER 31, 2013
(in thousands of euros)
December 31, 2013
December 31, 2012*
Consolidated net income 123,241 147,887
Other comprehensive income
Items not recycled to profit or loss:
Remeasurement of the net defined benefit liability 41,470 (25,093)
Tax on non-recycled items (11,729) 6,015
Items recycled to profit or loss:
Net income from change in translation differences (198,311) (47,708)
Cash flow hedge instruments (5,256) (22,972)
Tax on recycled items 2,131 8,897
Other comprehensive income (after tax) (171,695) (80,861)
TOTAL COMPREHENSIVE INCOME (48,454) 67,026
Portion attributable to minority interests (37,357) 3,670
Portion attributable to the Group (11,097) 63,356
* As the revised version of IAS 19, which is mandatory for annual periods beginning on or after January 1, 2013, must also be applied retrospectively, the financial statements for the year ended December 31, 2012 were restated in compliance with the new standard for comparative purposes. The impacts of these restatements are discussed in note 35.

54 VICAT 2013 ANNUAL REPORT
2 CONSOLIDATED FINANCIAL STATEMENTS AS OF DECEMBER 31, 2013
CONSOLIDATED CASH FLOW STATEMENT FOR THE YEAR ENDED DECEMBER 31, 2013
CONSOLIDATED CASH FLOW STATEMENT FOR THE YEAR ENDED DECEMBER 31, 2013
(in thousands of euros) NotesDecember 31,
2013December 31,
2012*
CASH FLOWS FROM OPERATING ACTIVITIES
Consolidated net income 123,241 147,887
Earnings from associated companies (3,913) (3,051)
Dividends received from associated companies 335 1,582
Elimination of non-cash and non-operating items:
- depreciation, amortization and provisions 191,784 199,767
- deferred taxes (17,282) (12,743)
- net (gain) loss from disposal of assets (4,964) (2,918)
- unrealized fair value gains and losses 986 (1,619)
- other 793 (34)
Cash flows from operating activities 1.22 290,980 328,871
Change in working capital requirement 45,526 (21,412)
Net cash flows from operating activities(1) 27 336,506 307,459
CASH FLOWS FROM INVESTING ACTIVITIES
Outflows linked to acquisitions of non-current assets:
- property, plant and equipment and intangible assets (175,589) (268,963)
- financial investments (9,814) (4,203)
Inflows linked to disposals of non-current assets:
- property, plant and equipment and intangible assets 9,875 7,625
- financial investments 5,137 3,429
Impact of changes in consolidation scope (8,793) (10,646)
Net cash flows from investing activities 28 (179,184) (272,758)
CASH FLOWS FROM FINANCING ACTIVITIES
Dividends paid (79,877) (87,993)
Increases in share capital 3,870
Proceeds from borrowings 102,905 108,334
Repayments of borrowings (155,183) (177,197)
Acquisitions of treasury shares (12,162) (10,472)
Disposals or allocations of treasury shares 16,645 14,165
Net cash flows from financing activities (127,672) (149,293)
Impact of changes in foreign exchange rates (28,917) (4,342)
Change in cash position 733 (118,934)
Net cash and cash equivalents – opening balance 29 225,079 344,013
Net cash and cash equivalents – closing balance 29 225,812 225,079
* As the revised version of IAS 19, which is mandatory for annual periods beginning on or after January 1, 2013, must also be applied retrospectively, the financial statements for the year ended December 31, 2012 were restated in compliance with the new standard for comparative purposes. The impacts of these restatements are discussed in note 35.
(1) Of which cash flows from income tax: € (69,812) thousand in 2013 and € (59,982) thousand in 2012. Of which cash flows from interest paid and received: € (43,036) thousand in 2013 and € (30,434) thousand in 2012.

55VICAT 2013 ANNUAL REPORT
CONSOLIDATED FINANCIAL STATEMENTS AS OF DECEMBER 31, 2013
2
2
2
2
2
2
2
STATEMENT OF CHANGES IN CONSOLIDATED EQUITY FOR THE YEAR ENDED DECEMBER 31, 2013
STATEMENT OF CHANGES IN CONSOLIDATED EQUITY FOR THE YEAR ENDED DECEMBER 31, 2013
(in thousands of euros)
Share capital
Additional paid-in capital
Treasury shares
Consolidated reserves
Translation reserves
Shareholders’ equity
Minority interests
Shareholders’ equity and
minority interests
AS OF JANUARY 1, 2012* 179,600 11,207 (83,890) 2,049,524 (76,052) 2,080,389 349,011 2,429,400
Consolidated net income 129,025 129,025 18,862 147,887
Other comprehensive income (33,825) (31,844) (65,669) (15,192) (80,861)
Total comprehensive income* 95,200 (31,844) 63,356 3,670 67,026
Dividends paid (66,039) (66,039) (22,124) (88,163)
Net change in treasury shares 5,209 (994) 4,215 4,215
Changes in consolidation scope and additional acquisitions (749) (749) (154) (903)
Increase in share capital (666) (666) 4,239 3,573
Other changes 305 305 (606) (301)
AS AT DECEMBER 31, 2012* 179,600 11,207 (78,681) 2,076,581 (107,896) 2,080,811 334,036 2,414,847
Consolidated net income 120,259 120,259 2,982 123,241
Other comprehensive income 23,613 (154,969) (131,356) (40,339) (171,695)
Total comprehensive income 143,872 (154,969) (11,097) (37,357) (48,454)
Dividends paid (66,016) (66,016) (14,056) (80,072)
Net change in treasury shares 4,736 (166) 4,570 4,570
Changes in consolidation scope and additional acquisitions (51) (51)
Increase in share capital
Other changes 1,481 1,481 (356) 1,125
AT DECEMBER 31, 2013 179,600 11,207 (73,945) 2,155,752 (262,865) 2,009,749 282,216 2,291,965
* As the revised version of IAS 19, which is mandatory for annual periods beginning on or after January 1, 2013, must also be applied retrospectively, the financial statements for the year ended December 31, 2012 were restated in compliance with the new standard for comparative purposes. The impacts of these restatements are discussed in note 35.
Group translation differences as at December 31, 2013 are broken down by currency as follows (in thousands of euros):
US dollar: (16,345)
Swiss franc: 125,205
Turkish new lira: (128,282)
Egyptian pound: (53,588)
Kazakh tenge: (35,355)
Mauritanian ouguiya: (4,128)
Indian rupee: (150,372)
(262,865)

56 VICAT 2013 ANNUAL REPORT
2 CONSOLIDATED FINANCIAL STATEMENTS AS OF DECEMBER 31, 2013
NOTES TO THE CONSOLIDATED FINANCIAL STATEMENTS
NOTES TO THE CONSOLIDATED FINANCIAL STATEMENTS
NOTE 1 ACCOUNTING POLICIES AND MEASUREMENT METHODS 57
NOTE 2 CHANGES IN CONSOLIDATION SCOPE AND OTHER SIGNIFICANT EVENTS 65
NOTE 3 GOODWILL 65
NOTE 4 OTHER INTANGIBLE ASSETS 66
NOTE 5 PROPERTY, PLANT AND EQUIPMENT 68
NOTE 6 FINANCE AND OPERATING LEASES 69
NOTE 7 INVESTMENT PROPERTIES 69
NOTE 8 INVESTMENTS IN ASSOCIATED COMPANIES 70
NOTE 9 RECEIVABLES AND OTHER NON-CURRENT ASSETS 70
NOTE 10 INVENTORIES AND WORK-IN-PROGRESS 71
NOTE 11 RECEIVABLES 71
NOTE 12 CASH AND CASH EQUIVALENTS 72
NOTE 13 SHARE CAPITAL 72
NOTE 14 EMPLOYEE BENEFITS 72
NOTE 15 OTHER PROVISIONS 76
NOTE 16 FINANCIAL DEBTS AND PUT OPTIONS 77
NOTE 17 FINANCIAL INSTRUMENTS 80
NOTE 18 OTHER LIABILITIES 82
NOTE 19 SALES 82
NOTE 20 PERSONNEL COSTS AND NUMBER OF EMPLOYEES 83
NOTE 21 DEPRECIATION, AMORTIZATION AND PROVISIONS 83
NOTE 22 OTHER INCOME AND EXPENSES 84
NOTE 23 FINANCIAL PERFORMANCE INDICATORS 84
NOTE 24 FINANCIAL INCOME/(EXPENSE) 85
NOTE 25 INCOME TAX 85
NOTE 26 SEGMENT INFORMATION 88
NOTE 27 NET CASH FLOWS FROM OPERATING ACTIVITIES 90
NOTE 28 NET CASH FLOWS FROM INVESTING ACTIVITIES 90
NOTE 29 ANALYSIS OF NET CASH BALANCES 91
NOTE 30 COMPENSATION OF EXECUTIVES 91
NOTE 31 TRANSACTIONS WITH RELATED COMPANIES 91
NOTE 32 FEES PAID TO THE STATUTORY AUDITORS 92
NOTE 33 SUBSEQUENT EVENTS 92
NOTE 34 LIST OF MAIN CONSOLIDATED COMPANIES AS AT DECEMBER 31, 2013 93
NOTE 35 APPLICATION OF IAS 19 (REVISED) 97

57VICAT 2013 ANNUAL REPORT
CONSOLIDATED FINANCIAL STATEMENTS AS OF DECEMBER 31, 2013
2
2
2
2
2
2
2
NOTES TO THE CONSOLIDATED FINANCIAL STATEMENTS
NOTE 1 ACCOUNTING POLICIES AND MEASUREMENT METHODS
1.1. Statement of compliance
In compliance with European Regulation (EC) 1606/2002 issued by
the European Parliament on July 19, 2002 on the enforcement of
International Accounting Standards, Vicat’s consolidated financial
statements have been prepared since January 1, 2005 in accordance
with International Financial Reporting Standards (IFRS) as adopted by
the European Union. The Vicat Group has adopted those standards in
force on December 31, 2013 for its benchmark accounting policies.
Standards and interpretations published by the IASB but not yet in
effect as at December 31, 2013 were not applied ahead of schedule
in the Group’s consolidated financial statements at the closing date.
This mainly involves amendments to IFRS 10 “Consolidated Financial
Statements”, IFRS 11 “Joint arrangements” and IFRS 12 “Disclosure
of Interests in Other Entities” and their impact on IAS 27 “Separate
Financial Statements” and IAS 28 “Investments in Associated and Joint
Ventures”. These revised standards are applicable to the Group and
have been assessed in order to determine their potential impact on
the financial statements. The Group does not anticipate any material
impact resulting from the application of these standards to the financial
statements.
The consolidated financial statements for the year ended December 31,
2013 present comparative data for the previous year prepared under
these same IFRSs. The accounting policies and methods applied in
the financial statements for the year ended December 31, 2013 are
consistant with those applied for the annual financial statements in 2012,
with the exception of the revised version of IAS 19 “Employee Benefits”,
which is mandatory for annual periods beginning on or after January 1,
2013 and must also be applied retrospectively.
The main consequences of applying this revised standard are as follows:
W the Group’s net employee commitments are fully recognized at each
closing date. The option to apply the corridor method has been
eliminated, and it is no longer possible to amortize actuarial gains and
losses or past service costs resulting from changes in pension plans
over the average remaining service life of the employees concerned;
W actuarial gains and losses and past service costs for which
provisions were not set aside as at December 31, 2011 were offset
in consolidated reserves for their amount net of tax as at January 1,
2012;
W actuarial gains and losses arising after January 1, 2012 are recognized
under “Other comprehensive income” and are not recycled to profit
or loss;
W effects of changes in pension plans on or after January 1, 2012 are
fully recorded in the income statement for the period in which they
occurred, under “Other income and expenses”;
W the expected return on pension plan assets is measured using the
same rate as the discount rate for employee benefit liabilities.
Due to the retrospective application of IAS 19 (revised), the financial
statements for the year ended December 31, 2012 were restated in line
with the new standard for comparative purposes. Detailed impacts of
the first application of IAS 19 (revised) is provided in note 35.
IFRS 13 “Fair Value Measurement”, which is also mandatory for annual
periods beginning on or after January 1, 2013, defines fair value, sets
out a framework for measuring fair value, and specifies the information
on fair value measurement to be disclosed in the notes to financial
statements. The application of this standard did not give rise to any
change in the fair value hierarchy at December 31, 2013 compared
with the categorization used at December 31, 2012, nor in the methods
used to measure the fair value of financial instruments according to
these categories.
The other standards that are mandatory for annual periods beginning
on or after January 1, 2013 have no impact on the 2013 consolidated
financial statements.
These financial statements were finalized and approved by the Board of
Directors in its meeting of March 7, 2014 and will be submitted to the
General Shareholders’ Meeting of May 6, 2014 for approval.
1.2. Basis of preparation of financial statements
The financial statements are presented in thousands of euros.
The consolidated statement of comprehensive income is presented
by type in two separate statements: the income statement and the
statement of other comprehensive income.
The consolidated statement of financial position segregates current and
non-current asset and liability accounts and splits them according to
their maturity (divided, generally speaking, into maturities of less than
and more than one year).
The statement of cash flows is presented according to the indirect
method.
The financial statements are prepared using the historical cost method,
except for the following assets and liabilities, which are recognized at
fair value: derivatives, assets held for trading, assets available for sale,
and the portion of assets and liabilities covered by hedging transactions.
The accounting policies and measurement methods described
hereinafter have been applied on a permanent basis to all of the financial
years presented in the consolidated financial statements.
The establishment of consolidated financial statements under
IFRS requires the Group’s management to make a number of
estimates and assumptions, which have a direct impact on the financial
statements. These estimates are based on the going concern principle
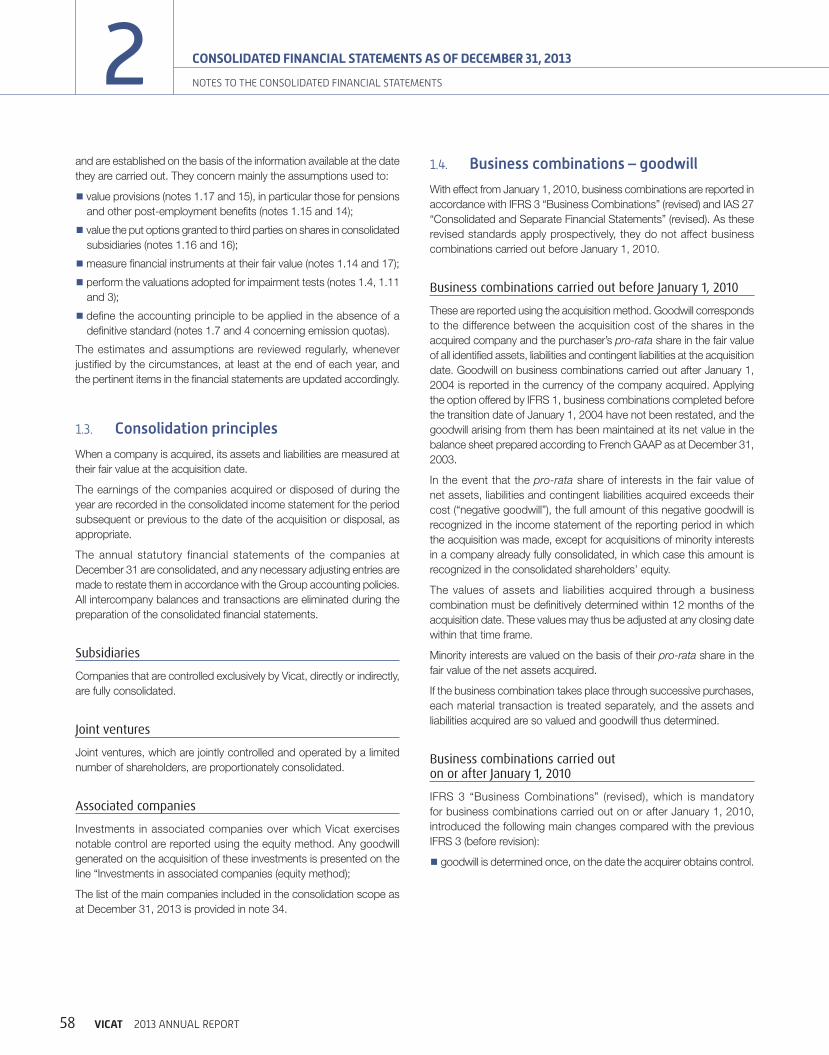
58 VICAT 2013 ANNUAL REPORT
2 CONSOLIDATED FINANCIAL STATEMENTS AS OF DECEMBER 31, 2013
NOTES TO THE CONSOLIDATED FINANCIAL STATEMENTS
and are established on the basis of the information available at the date
they are carried out. They concern mainly the assumptions used to:
W value provisions (notes 1.17 and 15), in particular those for pensions
and other post-employment benefits (notes 1.15 and 14);
W value the put options granted to third parties on shares in consolidated
subsidiaries (notes 1.16 and 16);
Wmeasure financial instruments at their fair value (notes 1.14 and 17);
W perform the valuations adopted for impairment tests (notes 1.4, 1.11
and 3);
W define the accounting principle to be applied in the absence of a
definitive standard (notes 1.7 and 4 concerning emission quotas).
The estimates and assumptions are reviewed regularly, whenever
justified by the circumstances, at least at the end of each year, and
the pertinent items in the financial statements are updated accordingly.
1.3. Consolidation principles
When a company is acquired, its assets and liabilities are measured at
their fair value at the acquisition date.
The earnings of the companies acquired or disposed of during the
year are recorded in the consolidated income statement for the period
subsequent or previous to the date of the acquisition or disposal, as
appropriate.
The annual statutory financial statements of the companies at
December 31 are consolidated, and any necessary adjusting entries are
made to restate them in accordance with the Group accounting policies.
All intercompany balances and transactions are eliminated during the
preparation of the consolidated financial statements.
Subsidiaries
Companies that are controlled exclusively by Vicat, directly or indirectly,
are fully consolidated.
Joint ventures
Joint ventures, which are jointly controlled and operated by a limited
number of shareholders, are proportionately consolidated.
Associated companies
Investments in associated companies over which Vicat exercises
notable control are reported using the equity method. Any goodwill
generated on the acquisition of these investments is presented on the
line “Investments in associated companies (equity method);
The list of the main companies included in the consolidation scope as
at December 31, 2013 is provided in note 34.
1.4. Business combinations – goodwill
With effect from January 1, 2010, business combinations are reported in
accordance with IFRS 3 “Business Combinations” (revised) and IAS 27
“Consolidated and Separate Financial Statements” (revised). As these
revised standards apply prospectively, they do not affect business
combinations carried out before January 1, 2010.
Business combinations carried out before January 1, 2010
These are reported using the acquisition method. Goodwill corresponds
to the difference between the acquisition cost of the shares in the
acquired company and the purchaser’s pro-rata share in the fair value
of all identified assets, liabilities and contingent liabilities at the acquisition
date. Goodwill on business combinations carried out after January 1,
2004 is reported in the currency of the company acquired. Applying
the option offered by IFRS 1, business combinations completed before
the transition date of January 1, 2004 have not been restated, and the
goodwill arising from them has been maintained at its net value in the
balance sheet prepared according to French GAAP as at December 31,
2003.
In the event that the pro-rata share of interests in the fair value of
net assets, liabilities and contingent liabilities acquired exceeds their
cost (“negative goodwill”), the full amount of this negative goodwill is
recognized in the income statement of the reporting period in which
the acquisition was made, except for acquisitions of minority interests
in a company already fully consolidated, in which case this amount is
recognized in the consolidated shareholders’ equity.
The values of assets and liabilities acquired through a business
combination must be definitively determined within 12 months of the
acquisition date. These values may thus be adjusted at any closing date
within that time frame.
Minority interests are valued on the basis of their pro-rata share in the
fair value of the net assets acquired.
If the business combination takes place through successive purchases,
each material transaction is treated separately, and the assets and
liabilities acquired are so valued and goodwill thus determined.
Business combinations carried out on or after January 1, 2010
IFRS 3 “Business Combinations” (revised), which is mandatory
for business combinations carried out on or after January 1, 2010,
introduced the following main changes compared with the previous
IFRS 3 (before revision):
W goodwill is determined once, on the date the acquirer obtains control.

59VICAT 2013 ANNUAL REPORT
CONSOLIDATED FINANCIAL STATEMENTS AS OF DECEMBER 31, 2013
2
2
2
2
2
2
2
NOTES TO THE CONSOLIDATED FINANCIAL STATEMENTS
The Group then has the option, in the case of each business
combination, upon obtaining control, to value the minority interests:
• either at their pro-rata share in the identifiable net assets of the
company acquired (“partial” goodwill option),
• or at their fair value (“full” goodwill option).
Measurement of minority interests at fair value has the effect of
increasing the goodwill by the amount attributable to such minority
interests, resulting in the recognition of a “full” goodwill;
W any adjustment in the acquisition price at fair value from the date
of acquisition is to be reported, with any subsequent adjustment
occurring after the 12-month appropriation period from the date of
acquisition to be recorded in the income statement;
W the costs associated with the business combination are to be
recognized in the expenses for the period in which they were incurred;
W in the case of combinations carried out in stages, upon obtaining
control the previous holding in the company acquired is to be revalued
at fair value on the date of acquisition and any gain or loss which
results is to be recorded in the income statement.
In compliance with IAS 36 (see note 1.11), at the end of each year, and
in the event of any evidence of impairment, goodwill is subjected to an
impairment test, consisting of a comparison of its net carrying cost with
its value in use as calculated on a discounted projected cash flow basis.
When the latter is below carrying cost, an impairment loss is recognized
for the corresponding loss of value.
1.5. Foreign currencies
Transactions in foreign currencies
Transactions in foreign currencies are translated into the operating
currency at the exchange rates in effect on the transaction dates. At
the end of the year, all monetary assets and liabilities denominated
in foreign currencies are translated into the operating currency at the
year-end exchange rates, and the resulting exchange rate differences
are recorded in the income statement.
Translation of financial statements of foreign companies
All assets and liabilities of Group companies denominated in foreign
currencies that are not hedged are translated into euros at the year-end
exchange rates, while income and expense and cash flow statement
items are translated at average exchange rates for the year. The ensuing
translation differences are recorded directly in shareholders’ equity.
In the event of a later sale, the cumulative amount of translation
differences relating to the net investment sold and denominated in
foreign currency is recorded in the income statement. Applying the
option offered by IFRS 1, translation differences accumulated before
the transition date were zeroed out by allocating them to consolidated
reserves at that date. They will not be recorded in the income statement
in the event of a later sale of these investments denominated in foreign
currency.
The following foreign exchange rates were used:
Closing rate Average rate
2013 2012 2013 2012
US dollar (USD) 1.3791 1.3194 1.3303 1.2856
Swiss franc (CHF) 1.2276 1.2072 1.2308 1.2053
Egyptian pound (EGP) 9.5597 8.3928 9.1296 7.8159
Turkish new lira (TRL) 2.9605 2.3551 2.5357 2.3145
Kazakh tenge (KZT) 211.8400 199.2200 202.1500 191.8700
Mauritanian ouguiya (MRO) 400.5829 400.3785 396.1750 385.5700
Indian rupee (INR) 85.3660 72.5600 77.8751 68.6295
1.6. Other intangible assets
Intangible assets (mainly patents, rights and software) are recorded
in the consolidated statement of financial position at historical cost
less accumulated amortization and any impairment losses. This cost
includes acquisition or production costs and all other directly attributable
costs incurred for the acquisition or production of the asset and for its
commissioning.
Assets with finite lives are amortized on a straight-line basis over their
useful lives (generally not exceeding 15 years).
Research costs are recognized as expenses in the period in which they
are incurred. Development costs meeting the criteria defined by IAS 38
are capitalized.
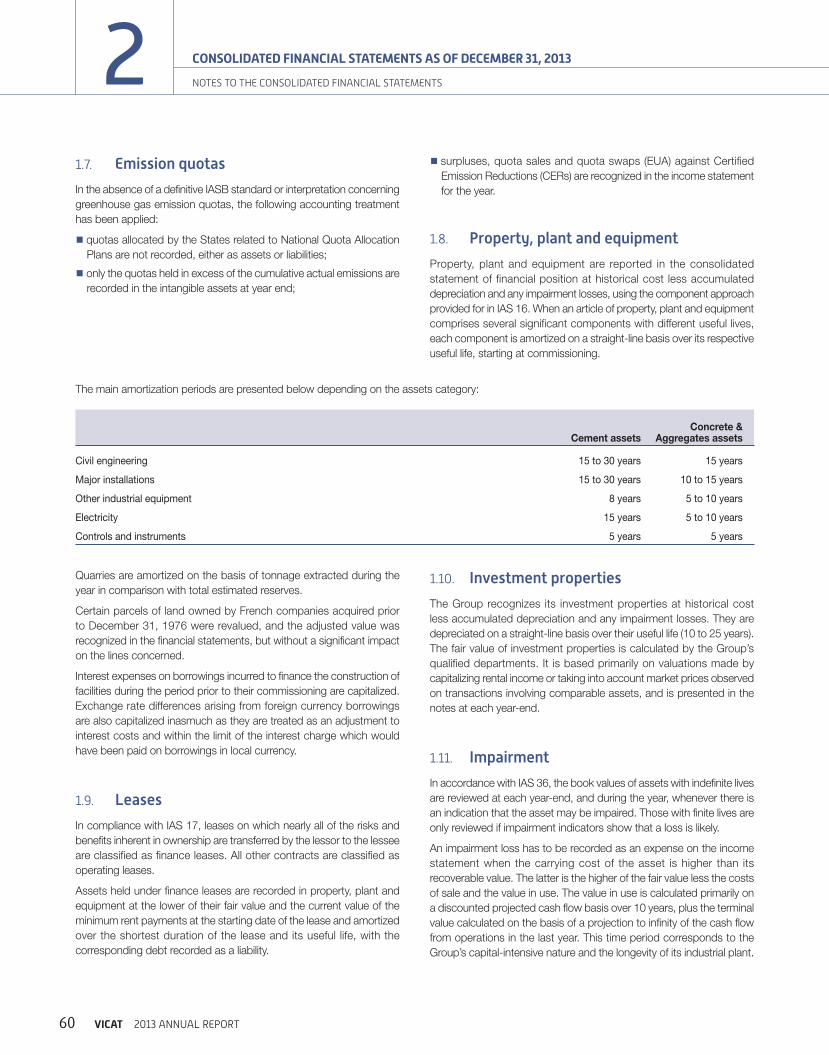
60 VICAT 2013 ANNUAL REPORT
2 CONSOLIDATED FINANCIAL STATEMENTS AS OF DECEMBER 31, 2013
NOTES TO THE CONSOLIDATED FINANCIAL STATEMENTS
1.7. Emission quotas
In the absence of a definitive IASB standard or interpretation concerning
greenhouse gas emission quotas, the following accounting treatment
has been applied:
W quotas allocated by the States related to National Quota Allocation
Plans are not recorded, either as assets or liabilities;
W only the quotas held in excess of the cumulative actual emissions are
recorded in the intangible assets at year end;
W surpluses, quota sales and quota swaps (EUA) against Certified
Emission Reductions (CERs) are recognized in the income statement
for the year.
1.8. Property, plant and equipment
Property, plant and equipment are reported in the consolidated
statement of financial position at historical cost less accumulated
depreciation and any impairment losses, using the component approach
provided for in IAS 16. When an article of property, plant and equipment
comprises several significant components with different useful lives,
each component is amortized on a straight-line basis over its respective
useful life, starting at commissioning.
The main amortization periods are presented below depending on the assets category:
Cement assetsConcrete &
Aggregates assets
Civil engineering 15 to 30 years 15 years
Major installations 15 to 30 years 10 to 15 years
Other industrial equipment 8 years 5 to 10 years
Electricity 15 years 5 to 10 years
Controls and instruments 5 years 5 years
Quarries are amortized on the basis of tonnage extracted during the
year in comparison with total estimated reserves.
Certain parcels of land owned by French companies acquired prior
to December 31, 1976 were revalued, and the adjusted value was
recognized in the financial statements, but without a significant impact
on the lines concerned.
Interest expenses on borrowings incurred to finance the construction of
facilities during the period prior to their commissioning are capitalized.
Exchange rate differences arising from foreign currency borrowings
are also capitalized inasmuch as they are treated as an adjustment to
interest costs and within the limit of the interest charge which would
have been paid on borrowings in local currency.
1.9. Leases
In compliance with IAS 17, leases on which nearly all of the risks and
benefits inherent in ownership are transferred by the lessor to the lessee
are classified as finance leases. All other contracts are classified as
operating leases.
Assets held under finance leases are recorded in property, plant and
equipment at the lower of their fair value and the current value of the
minimum rent payments at the starting date of the lease and amortized
over the shortest duration of the lease and its useful life, with the
corresponding debt recorded as a liability.
1.10. Investment properties
The Group recognizes its investment properties at historical cost
less accumulated depreciation and any impairment losses. They are
depreciated on a straight-line basis over their useful life (10 to 25 years).
The fair value of investment properties is calculated by the Group’s
qualified departments. It is based primarily on valuations made by
capitalizing rental income or taking into account market prices observed
on transactions involving comparable assets, and is presented in the
notes at each year-end.
1.11. Impairment
In accordance with IAS 36, the book values of assets with indefinite lives
are reviewed at each year-end, and during the year, whenever there is
an indication that the asset may be impaired. Those with finite lives are
only reviewed if impairment indicators show that a loss is likely.
An impairment loss has to be recorded as an expense on the income
statement when the carrying cost of the asset is higher than its
recoverable value. The latter is the higher of the fair value less the costs
of sale and the value in use. The value in use is calculated primarily on
a discounted projected cash flow basis over 10 years, plus the terminal
value calculated on the basis of a projection to infinity of the cash flow
from operations in the last year. This time period corresponds to the
Group’s capital-intensive nature and the longevity of its industrial plant.

61VICAT 2013 ANNUAL REPORT
CONSOLIDATED FINANCIAL STATEMENTS AS OF DECEMBER 31, 2013
2
2
2
2
2
2
2
NOTES TO THE CONSOLIDATED FINANCIAL STATEMENTS
The projected cash flows are calculated on the basis of the following
components that have been inflated and then discounted:
W the EBITDA from the Long-Term Plan over the first 5 years, then
projected to year 10;
W the sustaining capital expenditure;
W and the change in the working capital requirement.
The assumptions used in calculating impairment tests are derived from
forecasts made by operational staff reflecting as closely as possible their
knowledge of the market, the commercial position of the businesses,
and the performance of the industrial plant. Such forecasts include the
impact of foreseeable developments in cement consumption based
on macroeconomic and industry sector data, changes likely to affect
the competitive position, technical improvements in the manufacturing
process, and expected developments in the cost of the main production
factors contributing to the cost price of the products.
In the case of countries subject to social tensions and security concerns,
the assumptions used also include the potential improvement resulting
from the progressive and partial easing of some of these tensions and
concerns, based on recent data and an examination of the effect of
these tensions on current business conditions.
Projected cash flows are discounted at the weighted average capital
cost (WACC) before tax, in accordance with IAS 36 requirements. This
calculation is made per country, taking into account the cost of risk-free
long-term money, market risk weighted by a sector volatility factor, and
a country premium reflecting the specific risks of the market in which
the concerned cash generating unit in question operates.
If it is not possible to estimate the fair value of an isolated asset, it
is assessed at the level of the cash generating unit that the asset is
part of (defined by IAS 36 as the smallest identifiable group of assets
that generates cash inflows that are largely independent of the cash
inflows from other assets or groups of assets) insofar as the industrial
installations, products and markets form a coherent whole. The analysis
was thus carried out for each geographical area/market/business, and
the cash generating units were determined depending on the existence
or not of vertical integration between the Group’s activities in the area
concerned.
The value of the assets thus tested, at least annually using this method
for each cash generating unit comprises the intangible and tangible
non-current assets and the Working Capital Requirement.
These impairment tests are sensitive to the assumptions held for each
cash generating unit, mainly in terms of:
W the discount rate as previously defined;
W the inflation rate, which must reflect sales prices and expected future
costs;
W the growth rate to infinity.
Tests are conducted at each year-end on the sensitivity to an increase or
decrease of one point in the discount rate applied, in order to assess the
effect on the value of goodwill and other intangible and tangible assets
included in the Group’s consolidated financial statements. Moreover, the
discount rate includes a country risk premium and an industry sector
risk premium reflecting the cyclical nature of certain factors inherent
in the business sector, enabling an understanding of the volatility of
certain elements of production costs, which are sensitive in particular
to energy costs.
Recognized impairments can be reversed and are recovered in the
event of a decrease, except for those corresponding to goodwill, which
are definitive.
1.12. Inventories
Inventories are valued using the weighted average unit cost method, at
the lower of purchase price or production cost, and net market value
(sales price less completion and sales costs).
The gross value of goods and supplies includes both the purchase price
and all related costs.
Manufactured goods are valued at production cost, including the cost
of goods sold, direct and indirect production costs and the depreciation
on all consolidated fixed assets used in the production process.
In the case of inventories of manufactured products and work in
progress, the cost includes an appropriate share of fixed costs based
on the standard conditions of use of the production plant.
Inventory depreciations are recorded when necessary to take into
account any probable losses identified at year-end.
1.13. Cash and cash equivalents
Cash and cash equivalents include both cash and short-term
investments of less than three months that do not present any risk of
a change in of value. The latter are marked to market at the end of the
period. Net cash, the change in which is presented in the statement
of cash flows, consists of cash and cash equivalents less any bank
overdrafts.

62 VICAT 2013 ANNUAL REPORT
2 CONSOLIDATED FINANCIAL STATEMENTS AS OF DECEMBER 31, 2013
NOTES TO THE CONSOLIDATED FINANCIAL STATEMENTS
1.14. Financial instruments
Financial assets
The Group classifies its non-derivative financial assets, when they are
first entered in the financial statements, in one of the following four
categories of financial instruments in accordance with IAS 39, depending
on the reasons for which they were originally acquired:
W long-term loans and receivables, financial assets not quoted on
an active market, the payment of which is determined or can be
determined; these are valued at their amortized cost;
W assets available for sale, which include in particular, in accordance
with the standard, investments in non-consolidated affiliates; these
are valued at the lower of their carrying value and their fair value less
the cost of sale as at the end of the period;
W financial assets valued at their fair value by the income, since they
are held for transaction purposes (acquired and held with a view to
being resold in the short term);
W investments held to term, including securities quoted on an active
market associated with defined payments at fixed dates; the Group
does not own such assets at the year-end of the reporting periods
in question.
All acquisitions and disposals of financial assets are reported at the
transaction date. Financial assets are reviewed at the end of each year
in order to identify any evidence of impairment.
Financial liabilities
The Group classifies its non-derivative financial assets, when they are
first entered in the financial statements, as financial liabilities valued at
amortized cost. These comprise mainly borrowings, other financings,
bank overdrafts, etc. The Group does not have financial liabilities at fair
value through the income statement.
Treasury shares
In compliance with IAS 32, Vicat’s treasury shares are recognized net
of shareholders’ equity.
Derivatives and hedging
The Group uses hedging instruments to reduce its exposure to
changes in interest and foreign currency exchange rates resulting from
its business, financing and investment operations. These hedging
transactions use financial derivatives. The Group uses interest rate
swaps and caps to manage its exposure to interest rate risks. Forward
FX contracts and currency swaps are used to hedge exchange rate
risks.
The Group uses derivatives solely for financial hedging purposes and
no instrument is held for speculative ends. Under IAS 39, however,
certain derivatives used are not, not yet or no longer, eligible for hedge
accounting at the closing date.
Financial derivatives are valued at their fair value in the balance
sheet. Except for the cases detailed below, the change in fair value
of derivatives is recorded as an offset in the income statement of
the financial statement (“Change in fair value of financial assets and
liabilities”). The fair values of derivatives are estimated by means of the
following valuation models:
W the market value of interest rate swaps, exchange rate swaps and
forward purchase/sale transactions is calculated by discounting the
future cash flows on the basis of the “zero coupon” interest rate
curves applicable at the end of the preceding reporting periods,
restated if applicable to reflect accrued interest not yet payable;
W interest rate options are revalued on the basis of the Black and
Scholes model incorporating the market parameters as at year-end.
Derivative instruments may be designated as hedging instruments,
depending on the type of hedging relationship:
W fair value hedging is hedging against exposure to changes in the fair
value of a booked asset or liability, or of an identified part of that asset
or liability, attributable to a particular risk, in particular interest and
exchange rate risks, which would affect the net income presented;
W cash flow hedging is hedging against exposure to changes in cash
flow attributable to a particular risk, associated with a booked asset or
liability or with a planned transaction (e.g. expected sale or purchase
or “highly probable” future transaction), which would affect the net
income presented.
Hedge accounting for an asset/liability/firm commitment or cash flow
is applicable if:
W the hedging relationship is formally designated and documented at
its date of inception;
W the effectiveness of the hedging relationship is demonstrated at
the inception and then by the regular assessment and correlation
between the changes in the market value of the hedging instrument
and that of the hedged item. The ineffective portion of the hedging
instrument is always recognized in the income statement.
The application of hedge accounting results as follows:
W in the event of a documented fair value hedging relationship, the
change in the fair value of the hedging derivative is recognized in the
income statement as an offset to the change in the fair value of the
underlying financial instrument hedged. Income is affected solely by
the ineffective portion of the hedging instrument;

63VICAT 2013 ANNUAL REPORT
CONSOLIDATED FINANCIAL STATEMENTS AS OF DECEMBER 31, 2013
2
2
2
2
2
2
2
NOTES TO THE CONSOLIDATED FINANCIAL STATEMENTS
W in the event of a documented cash flow hedging relationship, the
change in the fair value of the effective portion of the hedging
derivative is recorded initially in shareholders’ equity, and that of the
ineffective portion is recognized directly in the income statement.
The accumulated changes in the fair value of the hedging instrument
previously recorded in shareholders’ equity are transferred to the
income statement at the same rate as the hedged cash flows.
1.15. Employee benefits
The Group recognizes the entire amount of its commitments relating to
post-employment benefits in accordance with IAS 19 (revised).
Regulations, standard practices and agreements in force in countries
where the Group’s consolidated companies have operations provide
for various types of post-employment benefits: lump-sum payments on
retirement, supplemental pension benefits, guaranteed supplemental
pension benefits specifically for executives, etc., and other long-term
benefits (such as medical cover, etc.).
Defined contribution plans are those for which the Group’s commitment
is limited only to the payment of contributions, recognized as expenses
when they are incurred.
Defined benefit plans include all post-employment benefit programs,
other than those under defined contribution plans, and represent a
future liability for the Group. The corresponding liabilities are calculated
on an actuarial basis (wage inflation, mortality, employee turnover, etc.)
using the projected unit credit method, in accordance with the clauses
provided for in the collective bargaining agreements and with standard
practices.
Dedicated financial assets, which are mainly equities and bonds, are
used to cover all or a part of these liabilities, principally in the United
States and Switzerland. The net position of each pension plan is fully
provided for in the statement of financial position less, where applicable,
the fair value of these invested assets, within the limit of the asset ceiling
cap. Any surplus (in the case of overfunded pension plans) is only
recognized in the statement of financial position to the extent that it
represents a future economic benefit that will be effectively available to
the Group, within the limits defined by the standard.
Actuarial variances arise due to changes in actuarial assumptions and/or
variances observed between these assumptions and the actual figures.
Actuarial gains and losses on post-employment benefits are recognized
under “Other comprehensive income” and are not recycled to profit or
loss.
The Group has chosen to apply the IFRS 1 option and to zero the
actuarial variances linked to employee benefits not yet recognized on
the transition balance sheet by allocating them to shareholders’ equity.
1.16. Put options granted on shares in consolidated subsidiaries
Under IAS 27 and IAS 32, put options granted to minority third parties
in fully consolidated subsidiaries are reported in the financial liabilities
at the present value of their estimated price with an offset in the form of
a reduction in the corresponding minority interests.
The difference between the value of the option and the amount of the
minority interests is recognized:
W in goodwill, in the case of options issued before January 1, 2010;
W as a reduction in the Group shareholders’ equity (options issued after
January 1, 2010).
The liability is estimated based on the contract information available
(price, formula, etc.) and any other factor relevant to its valuation. Its
value is reviewed at each year-end and the subsequent changes in the
liability are recognized:
W either as an offset to goodwill (options granted before January 1,
2010);
W or as an offset to the Group shareholders’ equity (options issued after
January 1, 2010).
No impact is reported in the income statement other than the impact
of the annual discounting of the liability recognized in the financial
income; the income share of the Group is calculated on the basis of
the percentage held in the subsidiaries in question, without taking into
account the percentage holding attached to the put options.
1.17. Provisions
In accordance with IAS 37, a provision is recognized when the Group
has a current commitment, whether statutory or implicit, resulting from
a significant event prior to the closing date which would lead to a use
of resources without offset after the closing date, which can be reliably
estimated.
These include, notably, provisions for site reinstatement, which are set
aside progressively as quarries are used and include the projected costs
related to the Group’s obligation to reinstate such sites.
In accordance with IAS 37, provisions whose maturities are longer than
one year are discounted when the impact is significant. The effects of
this discounting are recorded under net financial income.
1.18. Sales
In accordance with IAS 18, sales are reported at the fair value of the
consideration received or due, net of commercial discounts and rebates
and after deduction of excise duties collected by the Group under its
business activities. Sales figures include transport and handling costs
invoiced to customers.

64 VICAT 2013 ANNUAL REPORT
2 CONSOLIDATED FINANCIAL STATEMENTS AS OF DECEMBER 31, 2013
NOTES TO THE CONSOLIDATED FINANCIAL STATEMENTS
Sales are recorded at the time of transfer of the risk and significant
benefits associated with ownership to the purchaser, which generally
corresponds to the date of transfer of ownership of the product or
performance of the service.
1.19. Other income and expenses
Other income and expenses are those arising from the Group’s operating
activities that are not received or incurred as part of the direct production
process or sales activity. These other income and expenses consist
mainly of insurance payments, patent royalties, surplus greenhouse
gas emission rights, and certain charges relating to losses or claims.
1.20. Income taxes
Deferred taxes are calculated at the tax rates passed or virtually passed
at the year-end and expected to apply to the period when assets are
sold or liabilities are settled.
Deferred taxes are calculated, based on an analysis of the balance
sheet, on timing differences identified in the Group’s subsidiaries and
joint ventures between the values recognized in the consolidated
statement of financial position and the values of assets and liabilities
for tax purposes.
Deferred taxes are recognized for all timing differences, including those
on restatement of finance leases, except when the timing difference
results from goodwill.
Deferred tax assets and liabilities are netted out at the level of each
company. When the net amount represents a receivable, a deferred
tax asset is recognized if it is probable that the company will generate
future taxable income against which to allocate the deferred tax assets.
1.21. Segment information
In accordance with IFRS 8 “Operating Segments”, the segment
information provided in note 26 is based on information taken from
the internal reporting. This information is used internally by the Group
Management, responsible for implementing the strategy defined by the
Chairman of the Board of Directors for measuring the Group’s operating
performance and for allocating capital expenditure and resources to
business segments and geographical areas.
The operating segments defined pursuant to IFRS 8 comprise the three
segments in which the Vicat Group operates: Cement, Concrete &
Aggregates, and Other Products & Services.
The management indicators presented were adapted in order to be
consistent with those used by the Group Management, while complying
with IFRS 8 disclosure requirements: operating and consolidated sales,
EBITDA and EBIT (see note 1.22), total non-current assets, net capital
employed (see note 26), industrial investments, depreciation and
amortization, and number of employees.
The management indicators used for internal reporting are identical for
all the operating segments and geographical areas defined above and
are determined in accordance with the IFRS principles applied by the
Group in its consolidated financial statements.
1.22. Financial indicators
The following financial performance indicators are used by the Group,
as by other industrial players and notably in the building materials sector,
and presented with the income statement:
Added value: the value of production less the cost of goods and
services purchased.
Gross operating income: added value less personnel costs, taxes
and duties (except income taxes and deferred taxes), plus grants and
subsidies.
EBITDA (Earnings Before Interest, Tax, Depreciation and Amortization):
gross operating profit plus other ordinary income and expenses.
EBIT (Earnings Before Interest and Tax): EBITDA less depreciation,
amortization and operating provisions.
Cash flows from operations: net income before adjusting for non-
cash charges (mainly depreciation, amortization and provisions, deferred
taxes, gains or losses on asset disposals and changes in fair value).
1.23. Seasonality
Demand in the Cement, Ready-mixed Concrete and Aggregates
businesses is seasonal and tends to decrease in winter in temperate
countries and during the rainy season in tropical countries. The Group
therefore generally records lower sales in the first and fourth quarters,
i.e. the winter season in its main markets in Western Europe and North
America. In the second and third quarters, in contrast, sales are higher,
due to the summer season being more favorable for construction work.
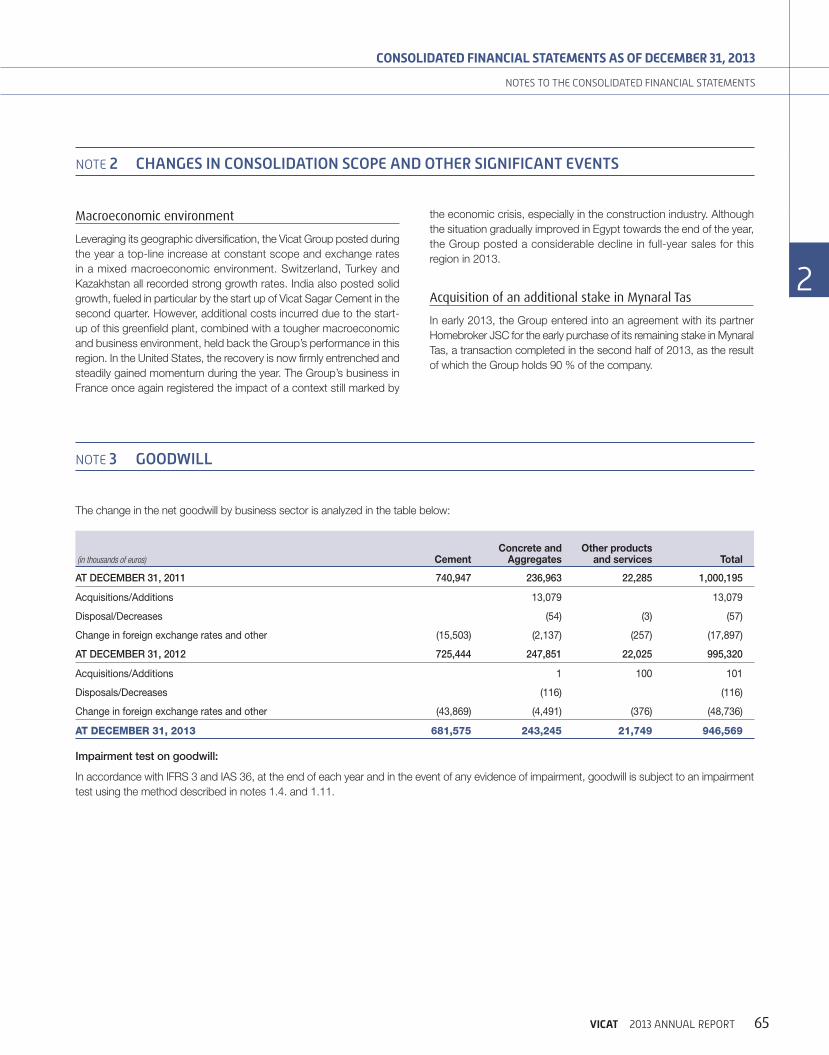
65VICAT 2013 ANNUAL REPORT
CONSOLIDATED FINANCIAL STATEMENTS AS OF DECEMBER 31, 2013
2
2
2
2
2
2
2
NOTES TO THE CONSOLIDATED FINANCIAL STATEMENTS
NOTE 3 GOODWILL
The change in the net goodwill by business sector is analyzed in the table below:
(in thousands of euros) CementConcrete and
AggregatesOther products
and services Total
AT DECEMBER 31, 2011 740,947 236,963 22,285 1,000,195
Acquisitions/Additions 13,079 13,079
Disposal/Decreases (54) (3) (57)
Change in foreign exchange rates and other (15,503) (2,137) (257) (17,897)
AT DECEMBER 31, 2012 725,444 247,851 22,025 995,320
Acquisitions/Additions 1 100 101
Disposals/Decreases (116) (116)
Change in foreign exchange rates and other (43,869) (4,491) (376) (48,736)
AT DECEMBER 31, 2013 681,575 243,245 21,749 946,569
Impairment test on goodwill:
In accordance with IFRS 3 and IAS 36, at the end of each year and in the event of any evidence of impairment, goodwill is subject to an impairment
test using the method described in notes 1.4. and 1.11.
NOTE 2 CHANGES IN CONSOLIDATION SCOPE AND OTHER SIGNIFICANT EVENTS
Macroeconomic environment
Leveraging its geographic diversification, the Vicat Group posted during
the year a top-line increase at constant scope and exchange rates
in a mixed macroeconomic environment. Switzerland, Turkey and
Kazakhstan all recorded strong growth rates. India also posted solid
growth, fueled in particular by the start up of Vicat Sagar Cement in the
second quarter. However, additional costs incurred due to the start-
up of this greenfield plant, combined with a tougher macroeconomic
and business environment, held back the Group’s performance in this
region. In the United States, the recovery is now firmly entrenched and
steadily gained momentum during the year. The Group’s business in
France once again registered the impact of a context still marked by
the economic crisis, especially in the construction industry. Although
the situation gradually improved in Egypt towards the end of the year,
the Group posted a considerable decline in full-year sales for this
region in 2013.
Acquisition of an additional stake in Mynaral Tas
In early 2013, the Group entered into an agreement with its partner
Homebroker JSC for the early purchase of its remaining stake in Mynaral
Tas, a transaction completed in the second half of 2013, as the result
of which the Group holds 90 % of the company.

66 VICAT 2013 ANNUAL REPORT
2 CONSOLIDATED FINANCIAL STATEMENTS AS OF DECEMBER 31, 2013
NOTES TO THE CONSOLIDATED FINANCIAL STATEMENTS
Goodwill is distributed as follows by cash generating unit (CGU):
Goodwill (in thousands of euros)
Discount rate used for the impairment tests
(in %)
Impairment which would result from a change of + 1 %
in the discount rate
December 31, 2013
December 31, 2012
December 31, 2013
December 31, 2012
December 31, 2013
December 31, 2012
India CGU 219,734 256,690 9.33 8.31 - -
West Africa Cement CGU 150,455 151,005 10.92 9.57 - -
France-Italy CGU 164,029 163,178 7.82 6.95 - -
Switzerland CGU 132,875 133,915 8.64 7.63 - -
Other CGUs total 279,476 290,532 9.08 to 11.72 7.89 to 10.40 9,046 622
TOTAL 946,569 995,320 9,046 622
The impairment tests carried out in 2013 and 2012 did not result in the recognition of any impairment with respect to goodwill.
A 1 % increase in the discount rate would have the effect of generating a recoverable value for a CGU slightly lower than the net book value.
NOTE 4 OTHER INTANGIBLE ASSETS
Gross value(in thousands of euros)
Concessions, patents and
similar rights SoftwareOther intangible
assets
Intangible assets in progress Total
AT DECEMBER 31, 2011 83,729 18,723 49,766 1,089 153,307
Acquisitions 3,920 2,025 1,548 3,978 11,471
Disposals (1,597) (171) (1,102) (2,870)
Changes in consolidation scope 2 2
Change in foreign exchange rates (1,449) (37) 18 (2) (1,470)
Other movements 818 34 (907) (91) (146)
AT DECEMBER 31, 2012 85,421 20,576 49,323 4,974 160,294
Acquisitions 2,147 6,651 1,449 580 10,827
Disposals (14) (14)
Changes in consolidation scope 0
Change in foreign exchange rates (2,606) (343) (2,782) (12) (5,743)
Other movements 4,460 242 (1,548) 3,154
AT DECEMBER 31, 2013 84,962 31,344 48,218 3,994 168,518

67VICAT 2013 ANNUAL REPORT
CONSOLIDATED FINANCIAL STATEMENTS AS OF DECEMBER 31, 2013
2
2
2
2
2
2
2
NOTES TO THE CONSOLIDATED FINANCIAL STATEMENTS
Depreciation and impairment(in thousands of euros)
Concessions, patents and
similar rights SoftwareOther intangible
assetsIntangible assets
in progress Total
AT DECEMBER 31, 2011 (17,509) (14,165) (20,844) 0 (52,518)
Increase (2,855) (1,667) (5,288) (9,810)
Decrease 998 171 1,087 2,256
Changes in consolidation scope (1) 89 5 93
Change in foreign exchange rates 256 3 (124) 135
Other movements 11 (3) (41) (33)
AT DECEMBER 31, 2012 (19,100) (15,572) (25,205) 0 (59,877)
Increase (2,535) (3,361) (4,966) (10,862)
Decrease 6 6
Changes in consolidation scope 0
Change in foreign exchange rates 569 178 1,606 2,353
Other movements (74) (20) 59 (35)
AT DECEMBER 31, 2013 (21,140) (18,775) (28,500) 0 (68,415)
Net book value at December 31, 2012 66,321 5,004 24,118 4,974 100,417
NET BOOK VALUE AT DECEMBER 31, 2013 63,822 12,569 19,718 3,994 100,103
No development costs were capitalized in 2013 and 2012.
Research and development costs recognized as expenses in 2013
amounted to € 6,401 thousand (€ 7,037 thousand in 2012).
With regard to greenhouse gas emission quotas, only the quotas held
at year-end in excess of the cumulative actual emissions were recorded
in other intangible assets at € 9,198 thousand (€ 11,290 thousand
as at December 31, 2012), corresponding to 1,957 thousand tons
(1,503 thousand tons as at December 31, 2012).
Recording of surpluses and quota swaps (EUA) against Certified
Emission Reductions (CERs) were recognized in the income statement
for the year at € 10,820 thousand (€ 5,661 thousand as at December 31,
2012).

68 VICAT 2013 ANNUAL REPORT
2 CONSOLIDATED FINANCIAL STATEMENTS AS OF DECEMBER 31, 2013
NOTES TO THE CONSOLIDATED FINANCIAL STATEMENTS
Gross value(in thousands of euros) Land & buildings
Industrial equipment
Other property plant
& equipment
Fixed assets work-in-
progress and advances/down
payments Total
AT DECEMBER 31, 2011 983,523 2,608,121 193,030 220,371 4,005,045
Acquisitions 34,097 36,004 8,748 193,412 272,261
Disposals (6,264) (29,264) (21,687) (14) (57,229)
Changes in consolidation scope 1,305 3,085 958 187 5,535
Change in foreign exchange rates (7,944) (22,964) (817) (13,706) (45,431)
Other movements 20,387 60,651 4,006 (87,139) (2,095)
AT DECEMBER 31, 2012 1,025,104 2,655,633 184,238 313,111 4,178,086
Acquisitions 16,409 39,850 9,157 97,501 162,917
Disposals (7,091) (17,495) (5,934) (76) (30,596)
Changes in consolidation scope 0
Change in foreign exchange rates (50,508) (150,576) (5,227) (24,854) (231,165)
Other movements 67,685 189,095 (3,429) (257,013) (3,662)
AT DECEMBER 31, 2013 1,051,599 2,716,507 178,805 128,669 4,075,580
Depreciation and impairment(in thousands of euros) Land & buildings
Industrial equipment
Other property plant
& equipment
Fixed assets work-in-
progress and advances/down
payments Total
AT DECEMBER 31, 2011 (357,255) (1,309,805) (119,520) 0 (1,786,580)
Increase (30,096) (138,846) (11,716) (180,658)
Decrease 6,039 28,634 18,937 53,610
Changes in consolidation scope (300) (311) (436) (1,047)
Change in foreign exchange rates 1,328 5,357 (195) 6,490
Other movements (402) (4,052) 5,763 1,309
AT DECEMBER 31, 2012 (380,686) (1,419,023) (107,167) 0 (1,906,876)
Increase (32,324) (135,905) (10,249) (58) (178,536)
Decrease 4,926 17,231 4,411 26,568
Changes in consolidation scope 0
Change in foreign exchange rates 11,491 66,637 2,398 5 80,531
Other movements 1,840 (6,321) 9,226 4,745
AT DECEMBER 31, 2013 (394,753) (1,477,381) (101,381) (53) (1,973,568)
Net book value at December 31, 2012 644,418 1,236,610 77,071 313,111 2,271,210
NET BOOK VALUE AT DECEMBER 31, 2013 656,846 1,239,126 77,424 128,616 2,102,012
Fixed assets work-in-progress amounted to € 118 million as at December 31, 2013 (€ 296 million as at December 31, 2012) and advances/
down payments on plant, property and equipment represented € 11 million as at December 31, 2013 (€ 17 million as at December 31, 2012).
NOTE 5 PROPERTY, PLANT AND EQUIPMENT
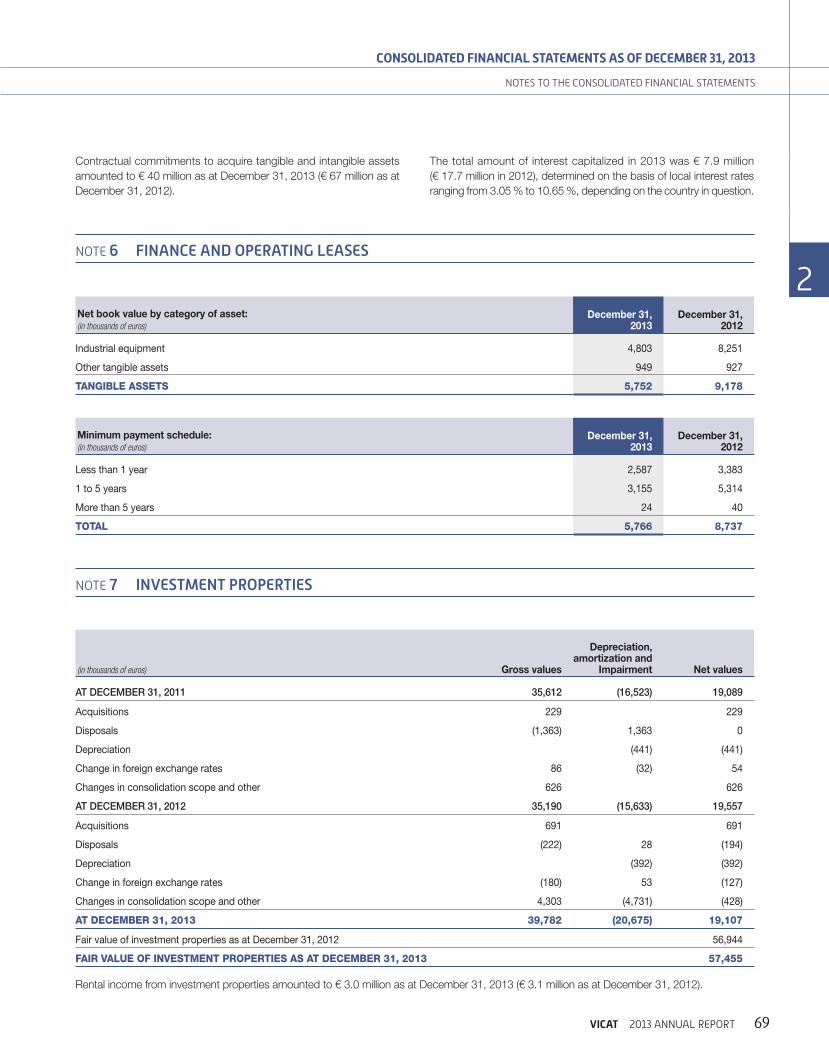
69VICAT 2013 ANNUAL REPORT
CONSOLIDATED FINANCIAL STATEMENTS AS OF DECEMBER 31, 2013
2
2
2
2
2
2
2
NOTES TO THE CONSOLIDATED FINANCIAL STATEMENTS
NOTE 6 FINANCE AND OPERATING LEASES
Net book value by category of asset:(in thousands of euros)
December 31, 2013
December 31, 2012
Industrial equipment 4,803 8,251
Other tangible assets 949 927
TANGIBLE ASSETS 5,752 9,178
Minimum payment schedule:(in thousands of euros)
December 31, 2013
December 31, 2012
Less than 1 year 2,587 3,383
1 to 5 years 3,155 5,314
More than 5 years 24 40
TOTAL 5,766 8,737
NOTE 7 INVESTMENT PROPERTIES
(in thousands of euros) Gross values
Depreciation, amortization and
Impairment Net values
AT DECEMBER 31, 2011 35,612 (16,523) 19,089
Acquisitions 229 229
Disposals (1,363) 1,363 0
Depreciation (441) (441)
Change in foreign exchange rates 86 (32) 54
Changes in consolidation scope and other 626 626
AT DECEMBER 31, 2012 35,190 (15,633) 19,557
Acquisitions 691 691
Disposals (222) 28 (194)
Depreciation (392) (392)
Change in foreign exchange rates (180) 53 (127)
Changes in consolidation scope and other 4,303 (4,731) (428)
AT DECEMBER 31, 2013 39,782 (20,675) 19,107
Fair value of investment properties as at December 31, 2012 56,944
FAIR VALUE OF INVESTMENT PROPERTIES AS AT DECEMBER 31, 2013 57,455
Rental income from investment properties amounted to € 3.0 million as at December 31, 2013 (€ 3.1 million as at December 31, 2012).
Contractual commitments to acquire tangible and intangible assets
amounted to € 40 million as at December 31, 2013 (€ 67 million as at
December 31, 2012).
The total amount of interest capitalized in 2013 was € 7.9 million
(€ 17.7 million in 2012), determined on the basis of local interest rates
ranging from 3.05 % to 10.65 %, depending on the country in question.

70 VICAT 2013 ANNUAL REPORT
2 CONSOLIDATED FINANCIAL STATEMENTS AS OF DECEMBER 31, 2013
NOTES TO THE CONSOLIDATED FINANCIAL STATEMENTS
NOTE 8 INVESTMENTS IN ASSOCIATED COMPANIES
Change in investments in associated companies:(in thousands of euros)
December 31, 2013
December 31, 2012
AT JANUARY 1 37,731 37,900
Earnings from associated companies 3,913 3,050
Dividends received from investments in associated companies (336) (1,582)
Changes in consolidation scope - -
Change in foreign exchange rates and other (3,095) (1,637)
AT DECEMBER 31 38,213 37,731
NOTE 9 RECEIVABLES AND OTHER NON-CURRENT ASSETS
(in thousands of euros) Gross values Impairment Net values
AS AT DECEMBER 31, 2011* 111,323 (2,658) 108,665
Acquisitions/Additions 3,627 (421) 3,206
Disposals/Decreases (4,651) 334 (4,317)
Changes in consolidation scope 69 69
Change in foreign exchange rates (2,549) (39) (2,588)
Others (4,703) (4,703)
AS AT DECEMBER 31, 2012* 103,116 (2,784) 100,332
Acquisitions/Additions 12,852 (1,222) 11,630
Disposals/Decreases (4,426) 915 (3,511)
Changes in consolidation scope 0
Change in foreign exchange rates (9,347) 73 (9,274)
Change recorded in other comprehensive income 15,710 15,710
Others 18,851 18,851
AT DECEMBER 31, 2013 136,756 (3,018) 133,738
Including:
- investments in affiliated companies 32,764 (2,051) 30,713
- long term investments 1,482 (464) 1,018
- loans and receivables 44,275 (503) 43,772
- employee benefit plan assets 8,149 8,149
- financial instruments 50,086 50,086
AT DECEMBER 31, 2013 136,756 (3,018) 133,738
* As the revised version of IAS 19, which is mandatory for annual periods beginning on or after January 1, 2013, must also be applied retrospectively, the financial statements for the year ended December 31, 2012 were restated in compliance with the new standard for comparative purposes. The impacts of these restatements are reflected in note 35.

71VICAT 2013 ANNUAL REPORT
CONSOLIDATED FINANCIAL STATEMENTS AS OF DECEMBER 31, 2013
2
2
2
2
2
2
2
NOTES TO THE CONSOLIDATED FINANCIAL STATEMENTS
NOTE 10 INVENTORIES AND WORK-IN-PROGRESS
(in thousands of euros)
December 31, 2013 December 31, 2012
Gross Provisions Net Gross Provisions Net
Raw materials and consumables 246,924 (12,241) 234,683 270,765 (10,362) 260,403
Work-in-progress, finished goods and goods for sale 127,871 (2,842) 125,029 124,673 (3,183) 121,490
TOTAL 374,795 (15,083) 359,712 395,438 (13,545) 381,893
NOTE 11 RECEIVABLES
(in thousands of euros)
Trade and other
receivables
Provisions Trade
and other receivables
Trade and other
receivables Net
Others Receivables
tax
Receivables social
security-related
Others receivables
Provisions Other
receivables and related
accounts
Total Others
Receivables Net
AT DECEMBER 31, 2011 366,891 (16,897) 349,994 66,846 2,760 76,319 (1,068) 144,857
Increases (3,453) (3,453) (685) (685)
Uses 3,911 3,911 31 31
Change in foreign exchange rates (369) (29) (398) (1,903) (27) (1,351) (3,281)
Changes in consolidation scope 3,238 (171) 3,067 211 448 659
Other movements 1,777 (21) 1,756 2,559 957 1,361 4,877
AT DECEMBER 31, 2012 371,537 (16,660) 354,877 67,713 3,690 76,777 (1,722) 146,458
Increases (6,272) (6,272) (817) (817)
Uses 4,186 4,186 27 27
Change in foreign exchange rates (15,876) 993 (14,883) (3,563) (95) (4,274) (7,932)
Changes in consolidation scope (6,220) (6,220) 0
Other movements 16,621 16,621 (14,654) 735 4,146 (9,773)
AT DECEMBER 31, 2013 366,062 (17,753) 348,309 49,496 4,330 76,649 (2,512) 127,963
of which matured as at 12/31/2013:
- for less than 3 months 62,838 (1,236) 61,602 3,290 1,592 1,450 6,332
- for more than 3 months 32,393 (5,750) 26,643 835 2 250 (79) 1,008
of which not matured as at 12/31/2013:
- less than one year 266,461 (7,627) 258,834 34,642 2,723 60,029 (1,279) 96,115
- more than one year 4,370 (3,140) 1,230 10,729 13 14,920 (1,154) 24,508

72 VICAT 2013 ANNUAL REPORT
2 CONSOLIDATED FINANCIAL STATEMENTS AS OF DECEMBER 31, 2013
NOTES TO THE CONSOLIDATED FINANCIAL STATEMENTS
NOTE 12 CASH AND CASH EQUIVALENTS
(in thousands of euros)
December 31, 2013
December 31, 2012
Cash 79,089 46,413
Marketable securities and term deposits < 3 months 162,818 190,931
CASH AND CASH EQUIVALENTS 241,907 237,344
NOTE 14 EMPLOYEE BENEFITS
(in thousands of euros) 2013 2012*
Pension plans and termination benefits (TB) 43,670 68,036
Other post-employment benefits 43,914 52,915
Total pension and other post-employment benefit provisions 87,584 120,951
Plan assets (see note 9) (8,149)
NET LIABILITIES 79,435 120,951
* As the revised version of IAS 19, which is mandatory for annual periods beginning on or after January 1, 2013, must also be applied retrospectively, the financial statements for the year ended December 31, 2012 were restated in compliance with the new standard for comparative purposes. The impacts of these restatements are reflected in note 35.
NOTE 13 SHARE CAPITAL
Vicat share capital is composed of 44,900,000 fully paid-up ordinary
shares with a nominal value of € 4 each, including 846,027 treasury
shares (937,060 as at December 31, 2012) acquired under the share
buy-back programs approved by the Ordinary General Meetings, and
through Heidelberg Cement’s disposal of its 35 % stake in Vicat in 2007.
These are registered shares or bearer shares, at the shareholder’s
option. Voting rights attached to shares are proportional to the share
of the capital which they represent and each share gives the right to
one vote, except in the case of fully paid-up shares registered for at
least 4 years in the name of the same shareholder, to which two votes
are assigned.
The dividend paid in 2013 in respect of 2012 amounted to € 1.50 per
share, amounting to a total of € 67,350 thousand, compared with € 1.50
per share paid in 2012 in respect of 2011 and amounting to a total of
€ 67,350 thousand. The dividend proposed by the Board of Directors
to the Ordinary General Meeting for 2013 amounts to € 1.50 per share,
totaling € 67,350 thousand.
In the absence of any dilutive instrument, diluted earnings per share are
identical to basic earnings per share, and are obtained by dividing the
Group’s net income by the weighted average number of Vicat ordinary
shares outstanding during the year.
Since January 4, 2010, for a period of 12 months renewable by tacit
agreement, Vicat has engaged Natixis Securities to implement a liquidity
agreement in accordance with the AMAFI (French financial markets
professional association) code of ethics of September 20, 2008.
The following amounts were allocated to the liquidity agreement for its
implementation: 20,000 Vicat shares and € 3 million in cash.
As at December 31, 2013, the liquidity account is composed of 22,115
Vicat shares and € 2,687 thousand in cash.
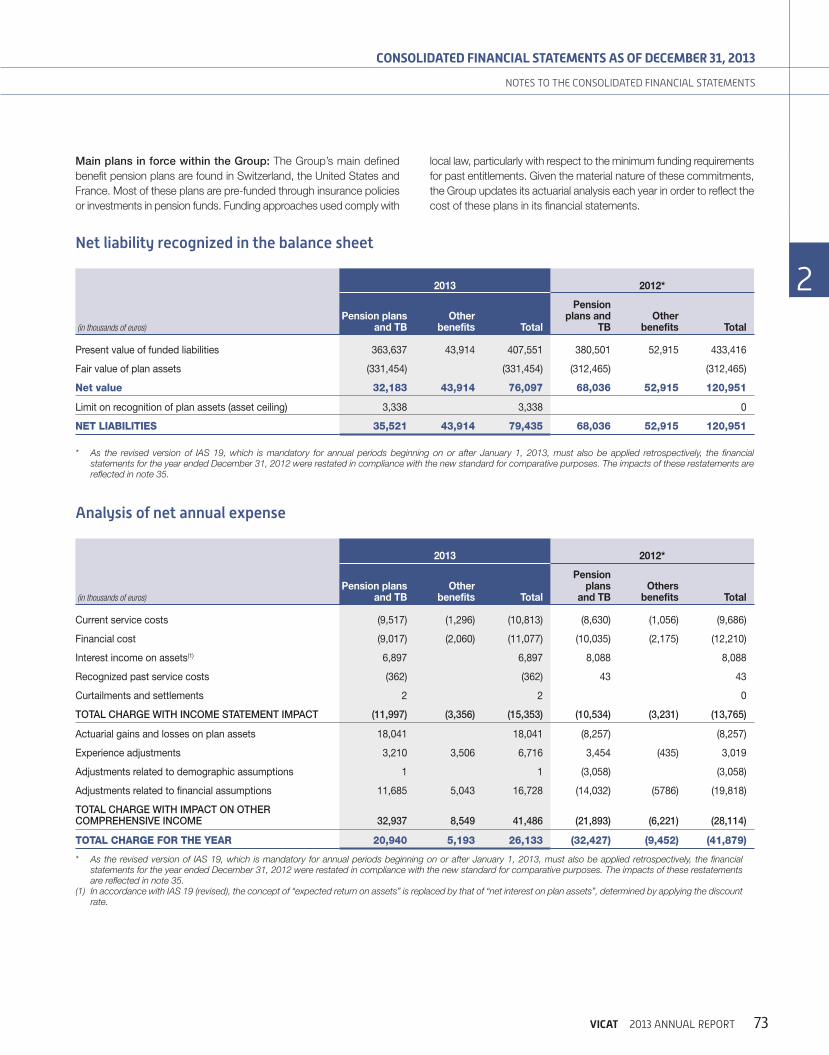
73VICAT 2013 ANNUAL REPORT
CONSOLIDATED FINANCIAL STATEMENTS AS OF DECEMBER 31, 2013
2
2
2
2
2
2
2
NOTES TO THE CONSOLIDATED FINANCIAL STATEMENTS
Main plans in force within the Group: The Group’s main defined
benefit pension plans are found in Switzerland, the United States and
France. Most of these plans are pre-funded through insurance policies
or investments in pension funds. Funding approaches used comply with
local law, particularly with respect to the minimum funding requirements
for past entitlements. Given the material nature of these commitments,
the Group updates its actuarial analysis each year in order to reflect the
cost of these plans in its financial statements.
Net liability recognized in the balance sheet
(in thousands of euros)
2013 2012*
Pension plans and TB
Other benefits Total
Pension plans and
TBOther
benefits Total
Present value of funded liabilities 363,637 43,914 407,551 380,501 52,915 433,416
Fair value of plan assets (331,454) (331,454) (312,465) (312,465)
Net value 32,183 43,914 76,097 68,036 52,915 120,951
Limit on recognition of plan assets (asset ceiling) 3,338 3,338 0
NET LIABILITIES 35,521 43,914 79,435 68,036 52,915 120,951
* As the revised version of IAS 19, which is mandatory for annual periods beginning on or after January 1, 2013, must also be applied retrospectively, the financial statements for the year ended December 31, 2012 were restated in compliance with the new standard for comparative purposes. The impacts of these restatements are reflected in note 35.
Analysis of net annual expense
(in thousands of euros)
2013 2012*
Pension plans and TB
Other benefits Total
Pension plans
and TBOthers
benefits Total
Current service costs (9,517) (1,296) (10,813) (8,630) (1,056) (9,686)
Financial cost (9,017) (2,060) (11,077) (10,035) (2,175) (12,210)
Interest income on assets(1) 6,897 6,897 8,088 8,088
Recognized past service costs (362) (362) 43 43
Curtailments and settlements 2 2 0
TOTAL CHARGE WITH INCOME STATEMENT IMPACT (11,997) (3,356) (15,353) (10,534) (3,231) (13,765)
Actuarial gains and losses on plan assets 18,041 18,041 (8,257) (8,257)
Experience adjustments 3,210 3,506 6,716 3,454 (435) 3,019
Adjustments related to demographic assumptions 1 1 (3,058) (3,058)
Adjustments related to financial assumptions 11,685 5,043 16,728 (14,032) (5786) (19,818)
TOTAL CHARGE WITH IMPACT ON OTHER COMPREHENSIVE INCOME 32,937 8,549 41,486 (21,893) (6,221) (28,114)
TOTAL CHARGE FOR THE YEAR 20,940 5,193 26,133 (32,427) (9,452) (41,879)
* As the revised version of IAS 19, which is mandatory for annual periods beginning on or after January 1, 2013, must also be applied retrospectively, the financial statements for the year ended December 31, 2012 were restated in compliance with the new standard for comparative purposes. The impacts of these restatements are reflected in note 35.
(1) In accordance with IAS 19 (revised), the concept of “expected return on assets” is replaced by that of “net interest on plan assets”, determined by applying the discount rate.
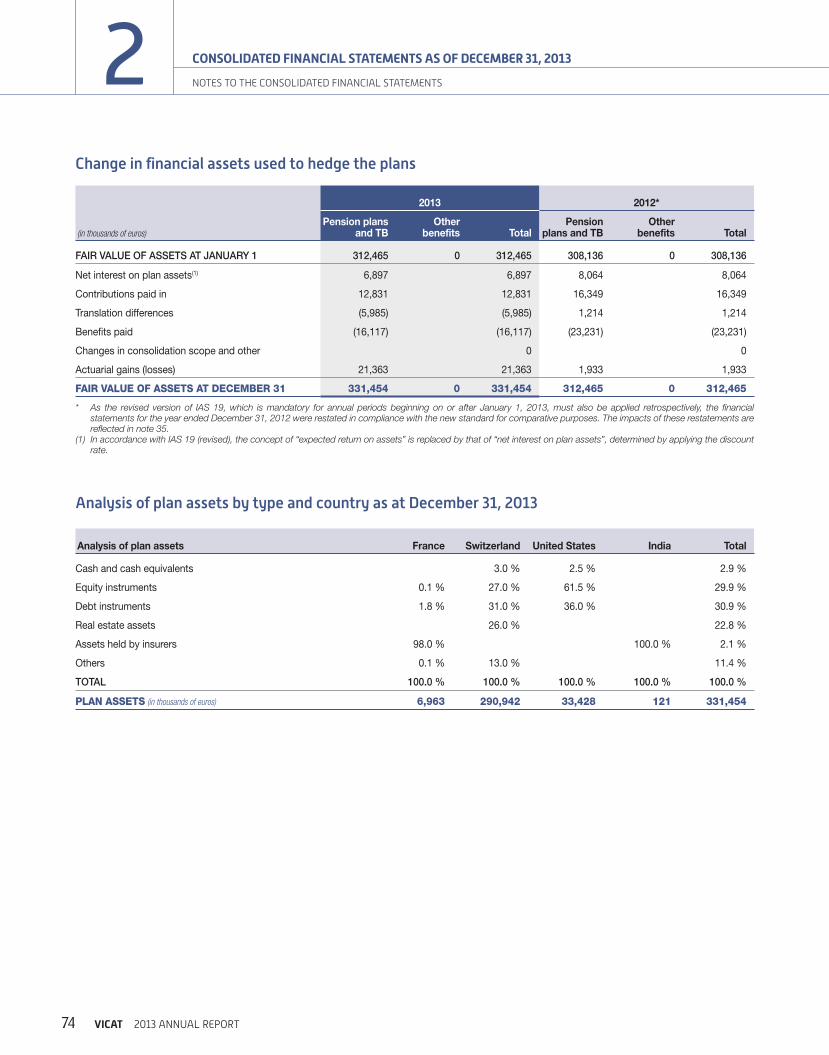
74 VICAT 2013 ANNUAL REPORT
2 CONSOLIDATED FINANCIAL STATEMENTS AS OF DECEMBER 31, 2013
NOTES TO THE CONSOLIDATED FINANCIAL STATEMENTS
Change in financial assets used to hedge the plans
(in thousands of euros)
2013 2012*
Pension plans and TB
Other benefits Total
Pension plans and TB
Other benefits Total
FAIR VALUE OF ASSETS AT JANUARY 1 312,465 0 312,465 308,136 0 308,136
Net interest on plan assets(1) 6,897 6,897 8,064 8,064
Contributions paid in 12,831 12,831 16,349 16,349
Translation differences (5,985) (5,985) 1,214 1,214
Benefits paid (16,117) (16,117) (23,231) (23,231)
Changes in consolidation scope and other 0 0
Actuarial gains (losses) 21,363 21,363 1,933 1,933
FAIR VALUE OF ASSETS AT DECEMBER 31 331,454 0 331,454 312,465 0 312,465
* As the revised version of IAS 19, which is mandatory for annual periods beginning on or after January 1, 2013, must also be applied retrospectively, the financial statements for the year ended December 31, 2012 were restated in compliance with the new standard for comparative purposes. The impacts of these restatements are reflected in note 35.
(1 ) In accordance with IAS 19 (revised), the concept of “expected return on assets” is replaced by that of “net interest on plan assets”, determined by applying the discount rate.
Analysis of plan assets by type and country as at December 31, 2013
Analysis of plan assets France Switzerland United States India Total
Cash and cash equivalents 3.0 % 2.5 % 2.9 %
Equity instruments 0.1 % 27.0 % 61.5 % 29.9 %
Debt instruments 1.8 % 31.0 % 36.0 % 30.9 %
Real estate assets 26.0 % 22.8 %
Assets held by insurers 98.0 % 100.0 % 2.1 %
Others 0.1 % 13.0 % 11.4 %
TOTAL 100.0 % 100.0 % 100.0 % 100.0 % 100.0 %
PLAN ASSETS (in thousands of euros) 6,963 290,942 33,428 121 331,454
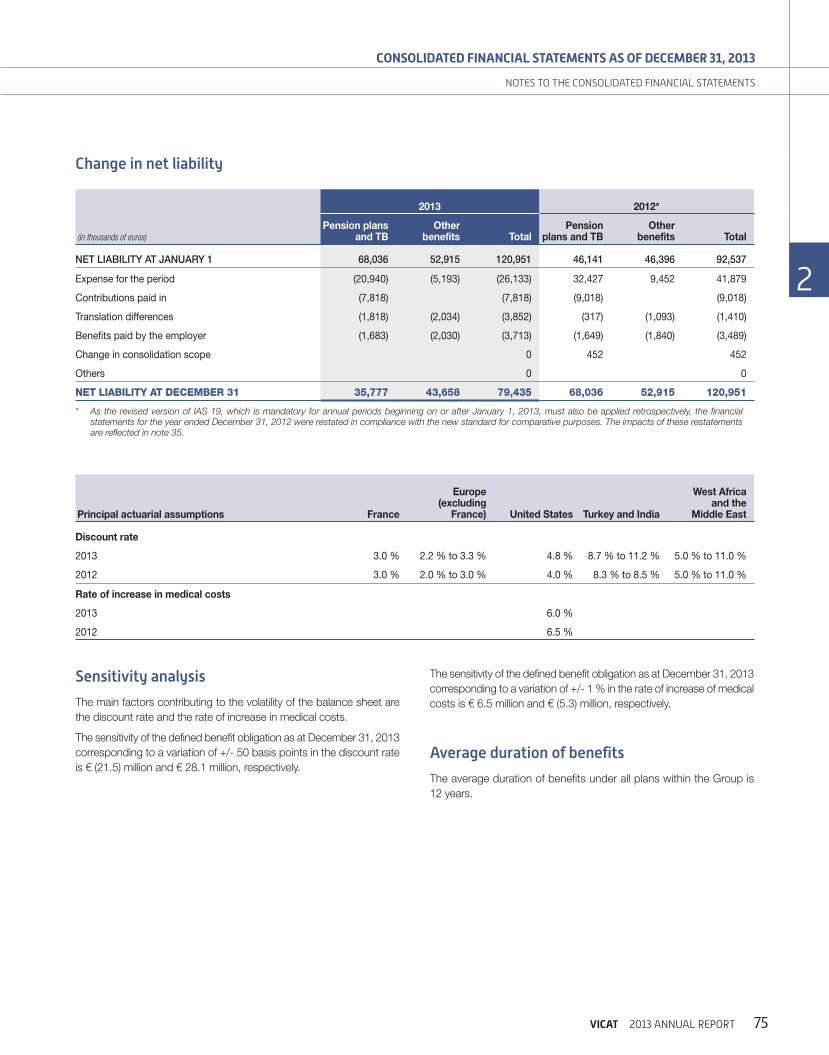
75VICAT 2013 ANNUAL REPORT
CONSOLIDATED FINANCIAL STATEMENTS AS OF DECEMBER 31, 2013
2
2
2
2
2
2
2
NOTES TO THE CONSOLIDATED FINANCIAL STATEMENTS
Change in net liability
(in thousands of euros)
2013 2012*
Pension plans and TB
Other benefits Total
Pension plans and TB
Other benefits Total
NET LIABILITY AT JANUARY 1 68,036 52,915 120,951 46,141 46,396 92,537
Expense for the period (20,940) (5,193) (26,133) 32,427 9,452 41,879
Contributions paid in (7,818) (7,818) (9,018) (9,018)
Translation differences (1,818) (2,034) (3,852) (317) (1,093) (1,410)
Benefits paid by the employer (1,683) (2,030) (3,713) (1,649) (1,840) (3,489)
Change in consolidation scope 0 452 452
Others 0 0
NET LIABILITY AT DECEMBER 31 35,777 43,658 79,435 68,036 52,915 120,951
* As the revised version of IAS 19, which is mandatory for annual periods beginning on or after January 1, 2013, must also be applied retrospectively, the financial statements for the year ended December 31, 2012 were restated in compliance with the new standard for comparative purposes. The impacts of these restatements are reflected in note 35.
Principal actuarial assumptions France
Europe (excluding
France) United States Turkey and India
West Africa and the
Middle East
Discount rate
2013 3.0 % 2.2 % to 3.3 % 4.8 % 8.7 % to 11.2 % 5.0 % to 11.0 %
2012 3.0 % 2.0 % to 3.0 % 4.0 % 8.3 % to 8.5 % 5.0 % to 11.0 %
Rate of increase in medical costs
2013 6.0 %
2012 6.5 %
Sensitivity analysis
The main factors contributing to the volatility of the balance sheet are
the discount rate and the rate of increase in medical costs.
The sensitivity of the defined benefit obligation as at December 31, 2013
corresponding to a variation of +/- 50 basis points in the discount rate
is € (21.5) million and € 28.1 million, respectively.
The sensitivity of the defined benefit obligation as at December 31, 2013
corresponding to a variation of +/- 1 % in the rate of increase of medical
costs is € 6.5 million and € (5.3) million, respectively.
Average duration of benefits
The average duration of benefits under all plans within the Group is
12 years.

76 VICAT 2013 ANNUAL REPORT
2 CONSOLIDATED FINANCIAL STATEMENTS AS OF DECEMBER 31, 2013
NOTES TO THE CONSOLIDATED FINANCIAL STATEMENTS
NOTE 15 OTHER PROVISIONS
(in thousands of euros)
Restoration of sites Demolitions
Other risks(1)
Other expenses Total
AT DECEMBER 31, 2011 38,897 1,089 34,104 15,192 89,281
Increases 4,414 9 7,842 5,434 17,699
Uses (2,066) (6,985) (1,922) (10,973)
Reversal of unused provisions (700) (126) (826)
Change in foreign exchange rates 142 8 (398) (248)
Changes in consolidation scope 6 6
Other movements (497) (1) (142) (640)
AT DECEMBER 31, 2012 40,891 1,106 33,869 18,436 94,301
Increases 2,908 45 9,517 2,968 15,438
Uses (2,620) (8,443) (790) (11,853)
Reversal of unused provisions (362) (5,441) (464) (6,267)
Change in foreign exchange rates (565) (18) (1,258) (54) (1,895)
Changes in consolidation scope 0
Other movements (1) (19) (2) (22)
AT DECEMBER 31, 2013 40,251 1,133 28,225 20,094 89,702
of which less than one year 22 10,821 1,651 12,494
of which more than one year 40,229 1,133 17,404 18,443 77,208
Impact (net of charges incurred) in the 2013 income statement:(in thousands of euros) Allocations
Reversals of unused provisions
Operating income 12,608 (2,407)
Non-operating income (expense) 2,830 (3,860)
(1) As at December 31, 2013, other risks included:• an amount of € 5.1 million (€ 9.8 million as at December 31, 2012) corresponding to the current estimate of gross expected costs for repair of damage that occurred in
2006 following deliveries of concrete mixtures and concrete made in 2004 whose sulfate content exceeded applicable standards. This amount corresponds to the current estimate of the Group’s pro-rata share of liability for repair of identified damages before the residual insurance indemnity of € 1.8 million recognized in non-current assets on the balance sheet as at December 31, 2013 (€ 4 million as at December 31, 2012 – note 9);
• an amount of € 7.3 million (€ 9.1 million as at December 31, 2012) corresponding to the estimated amount of the deductible at year-end relating to claims in the United States in the context of workplace accidents and which will be covered by the Group;
• the remaining amount of other provisions amounting to about € 15.8 million as at December 31, 2013 (€ 15.0 million as at December 31, 2012) corresponds to the sum of other provisions that, taken individually, are not material.

77VICAT 2013 ANNUAL REPORT
CONSOLIDATED FINANCIAL STATEMENTS AS OF DECEMBER 31, 2013
2
2
2
2
2
2
2
NOTES TO THE CONSOLIDATED FINANCIAL STATEMENTS
NOTE 16 FINANCIAL DEBTS AND PUT OPTIONS
Financial liabilities as at December 31, 2013 break down as follows:
(in thousands of euros)
December 31, 2013
December 31, 2012
Financial debts at more than 1 year 1,189,972 1,186,327
Put options at more than 1 year 11,981 11,376
Debts and put options at more than 1 year 1,201,953 1,197,703
Financial instrument assets at more than 1 year(1) (50,086) (28,688)
TOTAL FINANCIAL DEBTS NET OF FINANCIAL INSTRUMENT ASSETS AT MORE THAN 1 YEAR 1,151,867 1,169,015
Financial debts at less than 1 year 172,604 224,015
Put options at less than 1 year 0 8,337
Debts and put options at less than 1 year 172,604 232,352
Financial instrument assets at less than 1 year(1) (5,886) (39)
TOTAL FINANCIAL DEBTS NET OF FINANCIAL INSTRUMENT ASSETS AT LESS THAN 1 YEAR 166,718 232,313
Total financial debts net of financial instrument assets(1) 1,306,604 1,381,615
Total put options 11,981 19,713
TOTAL FINANCIAL DEBTS NET OF FINANCIAL INSTRUMENT ASSETS 1,318,585 1,401,328
(1) As at December 31, 2013, financial instrument assets (€ 56.0 million) are presented under non-current assets (see note 9) for the part at more than 1 year (€ 50.0 million) and under other receivables for the part at less than 1 year (€ 6.0 million). They totaled € 28.7 million as at December 31, 2012.

78 VICAT 2013 ANNUAL REPORT
2 CONSOLIDATED FINANCIAL STATEMENTS AS OF DECEMBER 31, 2013
NOTES TO THE CONSOLIDATED FINANCIAL STATEMENTS
16.1. Debts
Analysis of debts by category and maturityDecember 31, 2013
(in thousands of euros) Total 2014 2015 2016 2017 2018More than
5 years
Bank loans and borrowings 1,256,391 126,321 151,296 445,082 167,226 30,727 335,739
of which financial instrument assets (55,973) (5,887) (8,422) (8,422) (8,422) (8,422) (16,398)
of which financial instrument liabilities 51,727 707 21,060 3,978 25,982
Other borrowings and financial debts 20,002 13,400 5,695 89 126 216 476
Debts on fixed assets under finance leases 5,541 2,327 1,763 1,031 340 20 60
Current bank lines and overdrafts 24,670 24,670
DEBTS 1,306,604 166,718 158,754 446,202 167,692 30,963 336,275
of which commercial paper 290,000 290,000
Financial debts at less than one year are mainly comprised of bank overdrafts, as well as the Sococim Industries bilateral credit lines and a tranche
of the Jambyl Cement, Vicat Sagar Cement Limited and Vigier Holding loans.
December 31, 2012
(in thousands of euros) Total 2013 2014 2015 2016 2017More than
5 years
Bank loans and borrowings 1,328,973 184,038 73,825 157,112 377,231 171,004 365,763
of which financial instrument assets (28,727) (39) (468) (28,220)
of which financial instrument liabilities 32,972 15,462 387 10,713 6,410
Other borrowings and financial debts 20,410 13,437 5,706 638 84 121 424
Debts on fixed assets under finance leases 8,837 3,108 2,794 1,643 959 267 66
Current bank lines and overdrafts 23,395 23,395
DEBTS 1,381,615 223,978 82,325 159,393 378,274 171,392 366,253
of which commercial paper 283,000 283,000

79VICAT 2013 ANNUAL REPORT
CONSOLIDATED FINANCIAL STATEMENTS AS OF DECEMBER 31, 2013
2
2
2
2
2
2
2
NOTES TO THE CONSOLIDATED FINANCIAL STATEMENTS
16.2. Put options granted to the minority shareholders on shares in consolidated subsidiaries
Agreements have been concluded in the past between Vicat, Vigier
Holding, the International Finance Corporation and Home Broker JSC
(formerly KazKommerts Invest), in order to arrange their relationship
within the company Mynaral Tas, under which the Group granted put
options to its partners on their stakes in Mynaral Tas.
In the case of Homebroker JSC, the Group entered into an agreement in
early 2013 with this partner for the early buy-back of its residual holding
in Mynaral Tas, a transaction completed in the second half of 2013, as
the result of which the Group holds 90 % of the company.
The put option granted to the International Finance Corporation is
exercisable at the earliest in December 2013. Reporting this option
resulted in the recognition of a liability of € 12 million at more than one
year as at December 31, 2013 (€ 11.4 million as at December 31, 2012).
This liability corresponds to the present value of the exercise price for
the option granted to the International Finance Corporation.
Analysis of loans and debts (currency and interest rate)By currency (net of currency swaps)
(in thousands of euros)
December 31, 2013
December 31, 2012
Euro 754,337 854,697
US Dollar 164,337 203,735
Turkish new lira 1,257 1,373
CFA franc 71,874 60,334
Swiss franc 64,637 47,321
Mauritanian Ouguiya 1 6
Indian rupee 220,625 214,149
Kazakh tenge 29,536
TOTAL 1,306,604 1,381,615
By interest rate
(in thousands of euros)
December 31, 2013
December 31, 2012
Fixed rate 898,361 974,629
Floating rate 408,243 406,986
TOTAL 1,306,604 1,381,615
The average interest rate for gross debt as at December 31, 2013 was 4.42 %. It was 4.44 % as at December 31, 2012.
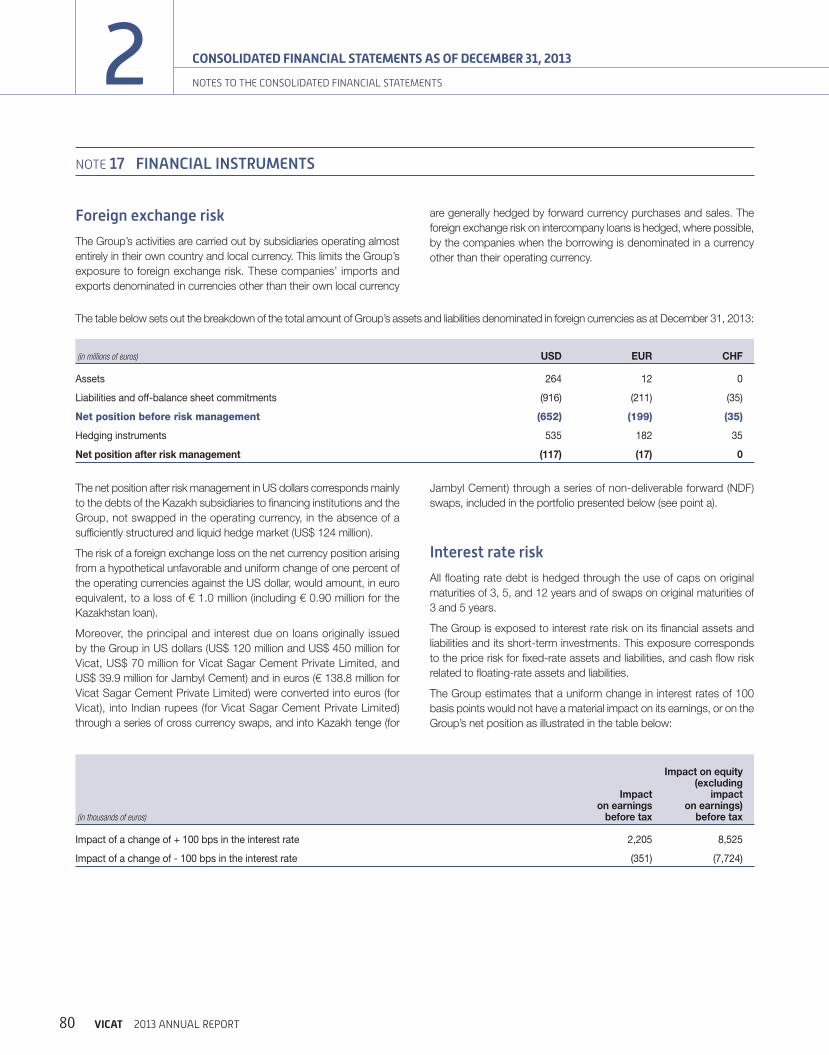
80 VICAT 2013 ANNUAL REPORT
2 CONSOLIDATED FINANCIAL STATEMENTS AS OF DECEMBER 31, 2013
NOTES TO THE CONSOLIDATED FINANCIAL STATEMENTS
NOTE 17 FINANCIAL INSTRUMENTS
(in thousands of euros)
Impact on earnings
before tax
Impact on equity (excluding
impact on earnings)
before tax
Impact of a change of + 100 bps in the interest rate 2,205 8,525
Impact of a change of - 100 bps in the interest rate (351) (7,724)
Foreign exchange risk
The Group’s activities are carried out by subsidiaries operating almost
entirely in their own country and local currency. This limits the Group’s
exposure to foreign exchange risk. These companies’ imports and
exports denominated in currencies other than their own local currency
are generally hedged by forward currency purchases and sales. The
foreign exchange risk on intercompany loans is hedged, where possible,
by the companies when the borrowing is denominated in a currency
other than their operating currency.
The table below sets out the breakdown of the total amount of Group’s assets and liabilities denominated in foreign currencies as at December 31, 2013:
(in millions of euros) USD EUR CHF
Assets 264 12 0
Liabilities and off-balance sheet commitments (916) (211) (35)
Net position before risk management (652) (199) (35)
Hedging instruments 535 182 35
Net position after risk management (117) (17) 0
The net position after risk management in US dollars corresponds mainly
to the debts of the Kazakh subsidiaries to financing institutions and the
Group, not swapped in the operating currency, in the absence of a
sufficiently structured and liquid hedge market (US$ 124 million).
The risk of a foreign exchange loss on the net currency position arising
from a hypothetical unfavorable and uniform change of one percent of
the operating currencies against the US dollar, would amount, in euro
equivalent, to a loss of € 1.0 million (including € 0.90 million for the
Kazakhstan loan).
Moreover, the principal and interest due on loans originally issued
by the Group in US dollars (US$ 120 million and US$ 450 million for
Vicat, US$ 70 million for Vicat Sagar Cement Private Limited, and
US$ 39.9 million for Jambyl Cement) and in euros (€ 138.8 million for
Vicat Sagar Cement Private Limited) were converted into euros (for
Vicat), into Indian rupees (for Vicat Sagar Cement Private Limited)
through a series of cross currency swaps, and into Kazakh tenge (for
Jambyl Cement) through a series of non-deliverable forward (NDF)
swaps, included in the portfolio presented below (see point a).
Interest rate risk
All floating rate debt is hedged through the use of caps on original
maturities of 3, 5, and 12 years and of swaps on original maturities of
3 and 5 years.
The Group is exposed to interest rate risk on its financial assets and
liabilities and its short-term investments. This exposure corresponds
to the price risk for fixed-rate assets and liabilities, and cash flow risk
related to floating-rate assets and liabilities.
The Group estimates that a uniform change in interest rates of 100
basis points would not have a material impact on its earnings, or on the
Group’s net position as illustrated in the table below:

81VICAT 2013 ANNUAL REPORT
CONSOLIDATED FINANCIAL STATEMENTS AS OF DECEMBER 31, 2013
2
2
2
2
2
2
2
NOTES TO THE CONSOLIDATED FINANCIAL STATEMENTS
Liquidity risk
As at December 31, 2013, the Group had € 326 million in unused
confirmed lines of credit that have not been allocated to the hedging
of liquidity risk on commercial paper (€ 416 million as at December 31,
2012).
The Group also has a € 300 million commercial paper issue program.
As at December 31, 2013, commercial paper issued by the Group
amounted to € 290 million. Commercial paper consists of short-term
debt instruments backed by confirmed lines of credit in the amounts
issued and classified as medium-term borrowings in the consolidated
balance sheet.
Unused confirmed lines of credit are used to cover the risk of the Group
finding itself unable to issue its commercial paper through market
transactions. As at December 31, 2013, these lines matched the short
term notes they covered, at € 290 million.
Some medium-term or long-term loan agreements contain specific
covenants especially as regards compliance with financial ratios,
reported each half year, which can lead to an anticipated repayment
(acceleration clause) in the event of non-compliance. These covenants
are based on a profitability ratio (leverage: net debt/consolidated
EBITDA) and on a capital structure ratio (gearing: net debt/consolidated
equity) of the Group or its subsidiaries concerned. For the purposes
of calculating these covenants, the net debt is determined excluding
put options granted to minority shareholders. Furthermore, the margin
applied to some financing operations depends on the level reached on
one of these ratios.
Considering the small number of companies concerned, essentially
Vicat SA, the parent company of the Group, the low level of gearing
(46.45 %) and leverage (2.5x), and the liquidity of the Group’s balance
sheet, the existence of these covenants does not constitute a risk for
the Group’s financial position. As at December 31, 2013, the Group is
compliant with all ratios required by covenants included in financing
agreements.
Analysis of the portfolio of derivatives as at December 31, 2013:
(in thousands of currency units)
Nominal value
(currency)
Nominal value
(in euros)
Market value
(in euros)
Current maturity
< 1 year (in euros)
< 1 year (in euros)
< 1 year (in euros)
FAIR VALUE HEDGES (a)
Composite instruments
- Cross currency swap $ fixed/€ floating $ 60,000 43,507 (6,552)(1) (6,552)
CASH FLOW HEDGES (a)
Composite instruments
- Cross currency swap $ fixed/€ fixed $ 60,000 43,507 (9,822)(1) (9,822)
- Cross currency swap $ fixed/€ fixed $ 450,000 326,300 (29,960)(1) (3,978) (25,982)
- Interest rate swap € floating/€ fixed € 150,000 150,000 (4,283)(1) (4,283)
- Cross currency swap $ floating/INR fixed $ 70,000 50,758 14,771(1) 985 7,878 5,908
- Cross currency swap € floating/INR fixed € 138,765 138,765 40,755(1) 4,754 25,809 10,192
OTHER DERIVATIVES
Interest rate instruments
- Euro Caps € 170,000 170,000 (407) (6) (401)
- Dollar US Caps $ 15,000 10,877 (23) (23)
- Dollar US Swaps $ 15,000 10,877 (44) (44)
FOREIGN EXCHANGE INSTRUMENTS (a)
Hedging for foreign exchange risk on intra-group loans
- VAT $ $ 178,000 129,070 (9) (9)
- VAT CHF Chf 35,000 28,511 17 17
- AAT € € 38,114 38,114 430 131 299
- NDF KZT/$ $ 39,861 28,904 (630) (630)
TOTAL 4,243
(1) The difference between the value of the liability at the hedged rate and at amortized cost rose by € 14.6 million.

82 VICAT 2013 ANNUAL REPORT
2 CONSOLIDATED FINANCIAL STATEMENTS AS OF DECEMBER 31, 2013
NOTES TO THE CONSOLIDATED FINANCIAL STATEMENTS
In accordance with IFRS 13, counterparty risks were taken into account.
This mainly relates to derivatives (cross currency swaps) intended to
hedge the foreign exchange risk of debts in currencies other than the
Group’s operating currency, notably in US dollars and Indian rupees.
The impact of the credit value adjustment (CVA, or the Group’s exposure
in the event of counterparty default) and of the debit value adjustment
(DVA, or the counterparty’s exposure in the event of Group default)
on the measurement of derivatives was determined by assuming an
exposure at default calculated using the add-on method, a 40 % loss
given default, and a probability of default based on the credit ratings
of banks or the estimated credit rating of the Group. The impact on
fair value was not material and was not included in the market value of
financial instruments as presented above.
In application of IFRS 7, the breakdown of financial instruments valued at fair value by hierarchical level of fair value in the consolidated statement of
financial position is as follows as at December 31, 2013:
(in millions of euros)
December 31, 2013
Level 1: instruments quoted on an active market 4.4
Level 2: valuation based on observable market information 4.2 See above
Level 3: valuation based on non-observable market information 30.7 Note 9
The application of IFRS 13 did not give rise to any modification in the
fair value hierarchy from that used as at December 31, 2012 or in the
methods used to measure financial instruments in Levels 2 and 3, and
in particular derivatives classified as Level 2 instruments, for which the
measurement of fair value relies on observable market data.
NOTE 18 OTHER LIABILITIES
(in thousands of euros) 2013 2012
Employee liabilities 62,049 60,043
Tax liabilities 25,879 34,137
Other liabilities and accruals 89,302 78,745
TOTAL 177,230 172,925
NOTE 19 SALES
(in thousands of euros) 2013 2012
Sales of goods 1,944,039 1,974,425
Sales of services 341,944 317,794
SALES 2,285,983 2,292,219
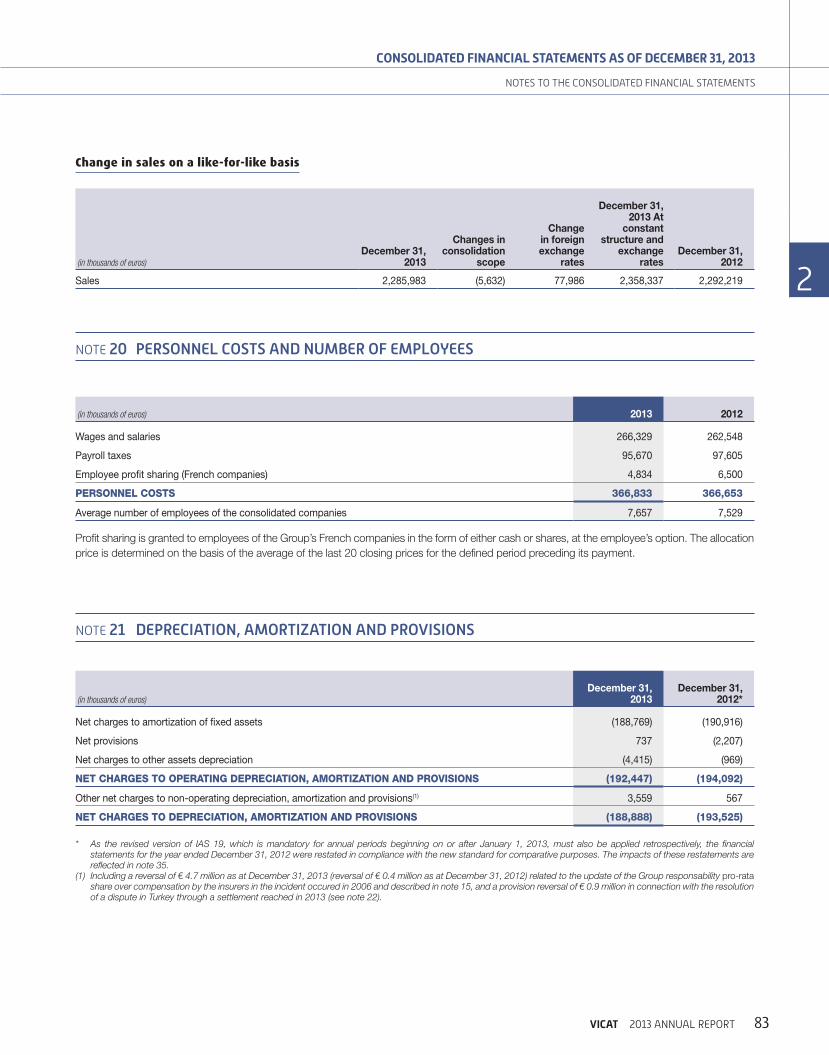
83VICAT 2013 ANNUAL REPORT
CONSOLIDATED FINANCIAL STATEMENTS AS OF DECEMBER 31, 2013
2
2
2
2
2
2
2
NOTES TO THE CONSOLIDATED FINANCIAL STATEMENTS
Change in sales on a like-for-like basis
(in thousands of euros)
December 31, 2013
Changes in consolidation
scope
Change in foreign exchange
rates
December 31, 2013 At
constant structure and
exchange rates
December 31, 2012
Sales 2,285,983 (5,632) 77,986 2,358,337 2,292,219
NOTE 20 PERSONNEL COSTS AND NUMBER OF EMPLOYEES
(in thousands of euros) 2013 2012
Wages and salaries 266,329 262,548
Payroll taxes 95,670 97,605
Employee profit sharing (French companies) 4,834 6,500
PERSONNEL COSTS 366,833 366,653
Average number of employees of the consolidated companies 7,657 7,529
Profit sharing is granted to employees of the Group’s French companies in the form of either cash or shares, at the employee’s option. The allocation
price is determined on the basis of the average of the last 20 closing prices for the defined period preceding its payment.
NOTE 21 DEPRECIATION, AMORTIZATION AND PROVISIONS
(in thousands of euros)
December 31, 2013
December 31, 2012*
Net charges to amortization of fixed assets (188,769) (190,916)
Net provisions 737 (2,207)
Net charges to other assets depreciation (4,415) (969)
NET CHARGES TO OPERATING DEPRECIATION, AMORTIZATION AND PROVISIONS (192,447) (194,092)
Other net charges to non-operating depreciation, amortization and provisions(1) 3,559 567
NET CHARGES TO DEPRECIATION, AMORTIZATION AND PROVISIONS (188,888) (193,525)
* As the revised version of IAS 19, which is mandatory for annual periods beginning on or after January 1, 2013, must also be applied retrospectively, the financial statements for the year ended December 31, 2012 were restated in compliance with the new standard for comparative purposes. The impacts of these restatements are reflected in note 35.
(1) Including a reversal of € 4.7 million as at December 31, 2013 (reversal of € 0.4 million as at December 31, 2012) related to the update of the Group responsability pro-rata share over compensation by the insurers in the incident occured in 2006 and described in note 15, and a provision reversal of € 0.9 million in connection with the resolution of a dispute in Turkey through a settlement reached in 2013 (see note 22).
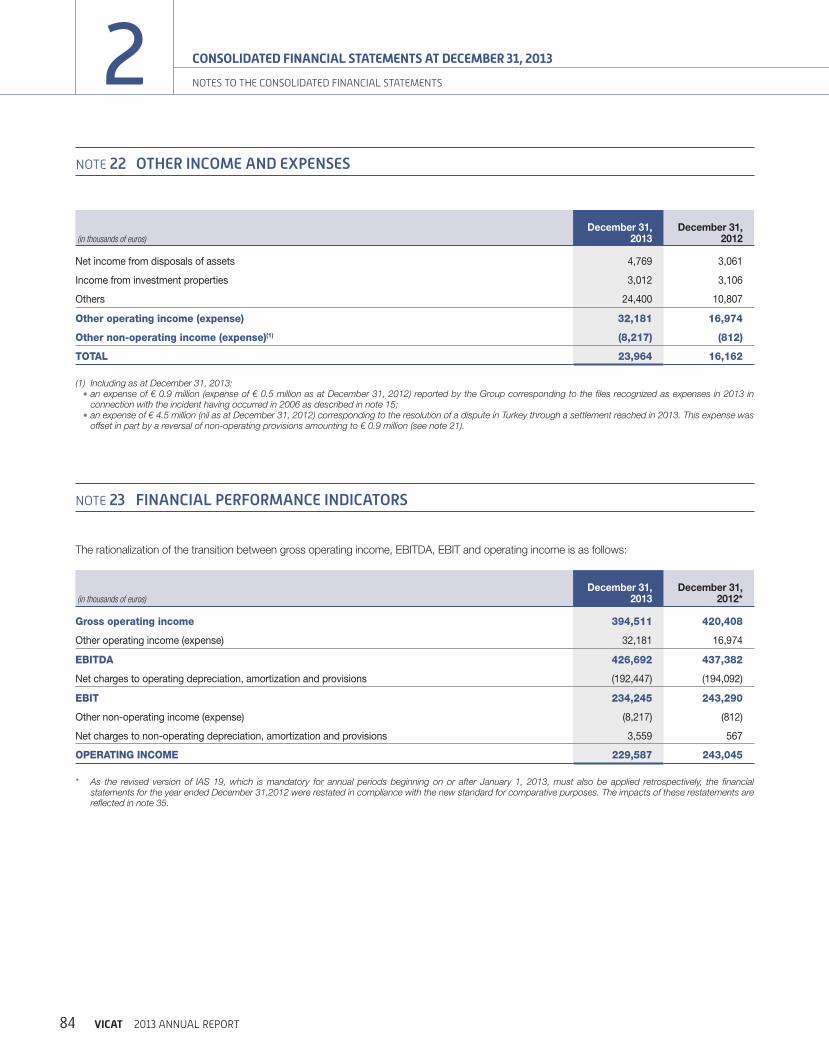
84 VICAT 2013 ANNUAL REPORT
2 CONSOLIDATED FINANCIAL STATEMENTS AT DECEMBER 31, 2013
NOTES TO THE CONSOLIDATED FINANCIAL STATEMENTS
(in thousands of euros)
December 31, 2013
December 31, 2012
Net income from disposals of assets 4,769 3,061
Income from investment properties 3,012 3,106
Others 24,400 10,807
Other operating income (expense) 32,181 16,974
Other non-operating income (expense)(1) (8,217) (812)
TOTAL 23,964 16,162
(1) Including as at December 31, 2013:• an expense of € 0.9 million (expense of € 0.5 million as at December 31, 2012) reported by the Group corresponding to the files recognized as expenses in 2013 in
connection with the incident having occurred in 2006 as described in note 15;• an expense of € 4.5 million (nil as at December 31, 2012) corresponding to the resolution of a dispute in Turkey through a settlement reached in 2013. This expense was
offset in part by a reversal of non-operating provisions amounting to € 0.9 million (see note 21).
NOTE 23 FINANCIAL PERFORMANCE INDICATORS
The rationalization of the transition between gross operating income, EBITDA, EBIT and operating income is as follows:
(in thousands of euros)
December 31, 2013
December 31, 2012*
Gross operating income 394,511 420,408
Other operating income (expense) 32,181 16,974
EBITDA 426,692 437,382
Net charges to operating depreciation, amortization and provisions (192,447) (194,092)
EBIT 234,245 243,290
Other non-operating income (expense) (8,217) (812)
Net charges to non-operating depreciation, amortization and provisions 3,559 567
OPERATING INCOME 229,587 243,045
* As the revised version of IAS 19, which is mandatory for annual periods beginning on or after January 1, 2013, must also be applied retrospectively, the financial statements for the year ended December 31,2012 were restated in compliance with the new standard for comparative purposes. The impacts of these restatements are reflected in note 35.
NOTE 22 OTHER INCOME AND EXPENSES

85VICAT 2013 ANNUAL REPORT
CONSOLIDATED FINANCIAL STATEMENTS AT DECEMBER 31, 2013
2
2
2
2
2
2
2
NOTES TO THE CONSOLIDATED FINANCIAL STATEMENTS
NOTE 24 FINANCIAL INCOME/(EXPENSE)
(in thousands of euros)
December 31, 2013
December 31, 2012*
Interest income from financing and cash management activities 16,434 18,504
Interest expense from financing and cash management activities (60,423) (52,947)
Cost of net borrowings and financial liabilities (43,989) (34,443)
Dividends 1,997 2,213
Foreign exchange gains 7,730 3,702
Fair value adjustments to financial assets and liabilities - 1,619
Net income from disposal of financial assets 195 -
Write-back of impairment of financial assets 368 335
Other income - -
Other financial income 10,290 7,869
Foreign exchange losses (11,745) (6,836)
Fair value adjustments to financial assets and liabilities (986) -
Impairment on financial assets (1,485) (1,063)
Net income from disposal of financial assets - (142)
Discounting expenses (4,860) (4,096)
Other expenses (238) (39)
Other financial expenses (19,314) (12,176)
NET FINANCIAL INCOME (EXPENSE) (53,013) (38,750)
* As the revised version of IAS 19, which is mandatory for annual periods beginning on or after January 1, 2013, must also be applied retrospectively, the financial statements for the year ended December 31,2012 were restated in compliance with the new standard for comparative purposes. The impacts of these restatements are reflected in note 35.
NOTE 25 INCOME TAX
Income tax expense
Analysis of income tax expense
(in thousands of euros)
December 31, 2013
December 31, 2012*
Current taxes (74,528) (72,364)
Deferred tax 17,282 12,906
TOTAL (57,246) (59,458)
* As the revised version of IAS 19, which is mandatory for annual periods beginning on or after January 1, 2013, must also be applied retrospectively, the financial statements for the year ended December 31,2012 were restated in compliance with the new standard for comparative purposes. The impacts of these restatements are reflected in note 35.
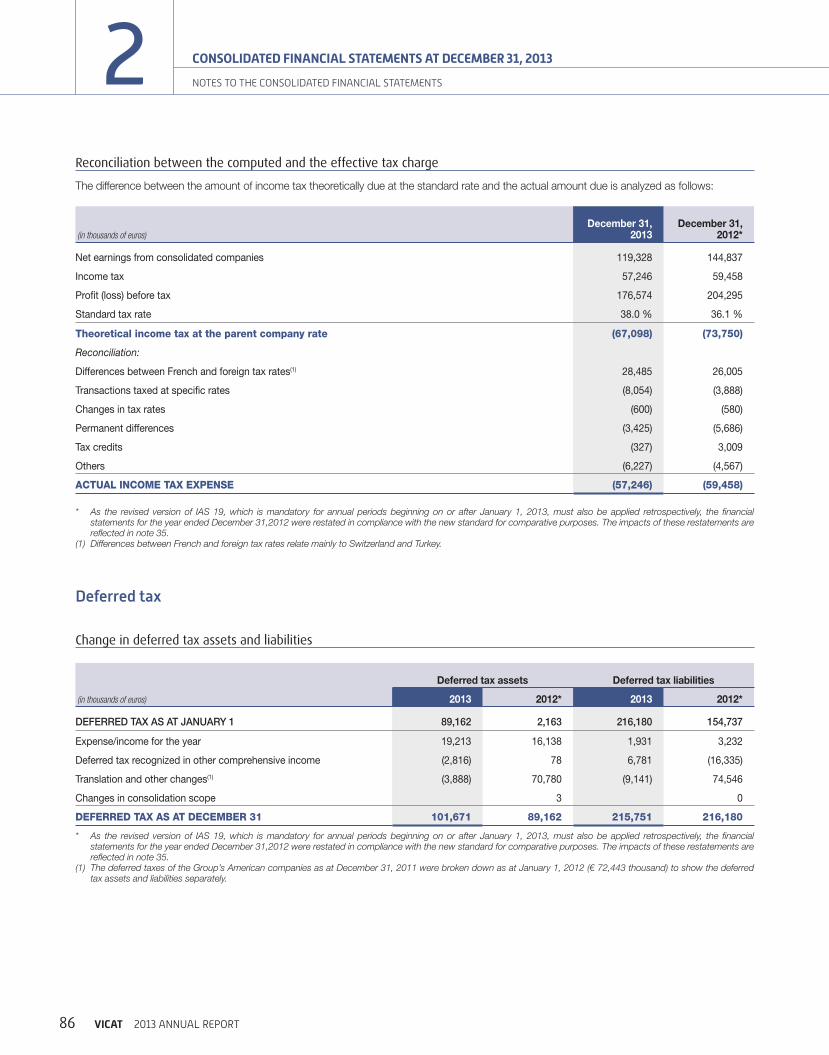
86 VICAT 2013 ANNUAL REPORT
2 CONSOLIDATED FINANCIAL STATEMENTS AT DECEMBER 31, 2013
NOTES TO THE CONSOLIDATED FINANCIAL STATEMENTS
Reconciliation between the computed and the effective tax charge
The difference between the amount of income tax theoretically due at the standard rate and the actual amount due is analyzed as follows:
(in thousands of euros)
December 31, 2013
December 31, 2012*
Net earnings from consolidated companies 119,328 144,837
Income tax 57,246 59,458
Profit (loss) before tax 176,574 204,295
Standard tax rate 38.0 % 36.1 %
Theoretical income tax at the parent company rate (67,098) (73,750)
Reconciliation:
Differences between French and foreign tax rates(1) 28,485 26,005
Transactions taxed at specific rates (8,054) (3,888)
Changes in tax rates (600) (580)
Permanent differences (3,425) (5,686)
Tax credits (327) 3,009
Others (6,227) (4,567)
ACTUAL INCOME TAX EXPENSE (57,246) (59,458)
* As the revised version of IAS 19, which is mandatory for annual periods beginning on or after January 1, 2013, must also be applied retrospectively, the financial statements for the year ended December 31,2012 were restated in compliance with the new standard for comparative purposes. The impacts of these restatements are reflected in note 35.
(1) Differences between French and foreign tax rates relate mainly to Switzerland and Turkey.
Deferred tax
Change in deferred tax assets and liabilities
(in thousands of euros)
Deferred tax assets Deferred tax liabilities
2013 2012* 2013 2012*
DEFERRED TAX AS AT JANUARY 1 89,162 2,163 216,180 154,737
Expense/income for the year 19,213 16,138 1,931 3,232
Deferred tax recognized in other comprehensive income (2,816) 78 6,781 (16,335)
Translation and other changes(1) (3,888) 70,780 (9,141) 74,546
Changes in consolidation scope 3 0
DEFERRED TAX AS AT DECEMBER 31 101,671 89,162 215,751 216,180
* As the revised version of IAS 19, which is mandatory for annual periods beginning on or after January 1, 2013, must also be applied retrospectively, the financial statements for the year ended December 31,2012 were restated in compliance with the new standard for comparative purposes. The impacts of these restatements are reflected in note 35.
(1) The deferred taxes of the Group’s American companies as at December 31, 2011 were broken down as at January 1, 2012 (€ 72,443 thousand) to show the deferred tax assets and liabilities separately.

87VICAT 2013 ANNUAL REPORT
CONSOLIDATED FINANCIAL STATEMENTS AT DECEMBER 31, 2013
2
2
2
2
2
2
2
NOTES TO THE CONSOLIDATED FINANCIAL STATEMENTS
Analysis of net deferred tax (expense)/income by principal category of timing difference
(in thousands of euros) 2013 2012*
Fixed assets and finance leases 2,143 3,367
Financial instruments 448 (350)
Pensions and other post-employment benefits 1,434 1,649
Accelerated depreciation, regulated provisions and other (10,837) (3,674)
Other timing differences, tax loss carry-forwards and miscellaneous 24,094 11,914
NET DEFERRED TAX (EXPENSE)/INCOME 17,282 12,906
Source of deferred tax assets and liabilities
(in thousands of euros) 2013 2012*
Fixed assets and finance leases 132,383 141,924
Financial instruments (5,277) (1,764)
Pensions (29,044) (38,517)
Other provisions for contingencies and charges 11,316 13,356
Accelerated depreciation and regulated provisions 72,362 60,721
Other timing differences, tax loss carry-forwards and miscellaneous (67,660) (48,702)
Net deferred tax assets and liabilities 114,080 127,018
Deferred tax assets(1) (101,671) (89,162)
Deferred tax liabilities 215,751 216,180
NET BALANCE 114,080 127,018
* As the revised version of IAS 19, which is mandatory for annual periods beginning on or after January 1, 2013, must also be applied retrospectively, the
financial statements for the year ended December 31,2012 were restated in compliance with the new standard for comparative purposes. The impacts of
these restatements are reflected in note 35.
(1) The deferred tax assets mainly originate from the tax losses carried forward by subsidiaries based in the United States, with periods of limitation ranging from
2024 to 2032.
Deferred tax assets not recognized in the financial statements
Deferred tax assets not recognized in the financial statements as at
December 31, 2013, owing either to their planned recognition during
the exemption periods enjoyed by the entities concerned or to the
probability of their not being recovered, amounted to € 6.5 million
(€ 8.3 million as at December 31, 2012). These relate essentially to a
company benefiting from a tax exemption scheme for a period of ten
years with effect from January 1, 2011.
Tax dispute in Senegal
Sococim Industries was notified of a tax reassessment under a tax
introduced by the 2012 Senegalese Finance Act entitled Contribution
Spéciale sur les Produits des Mines et Carrières “CSMC” (special levy on
products from mines and quarries). The company disputes the legality
of this tax and its applicability in accordance with the mining agreement
it entered into with the government of Senegal. As a result, no provision
has been recognized in respect of this reassessment, and the company
has provided financial guaranties amounting to € 7.5 million as at
December 31, 2013.
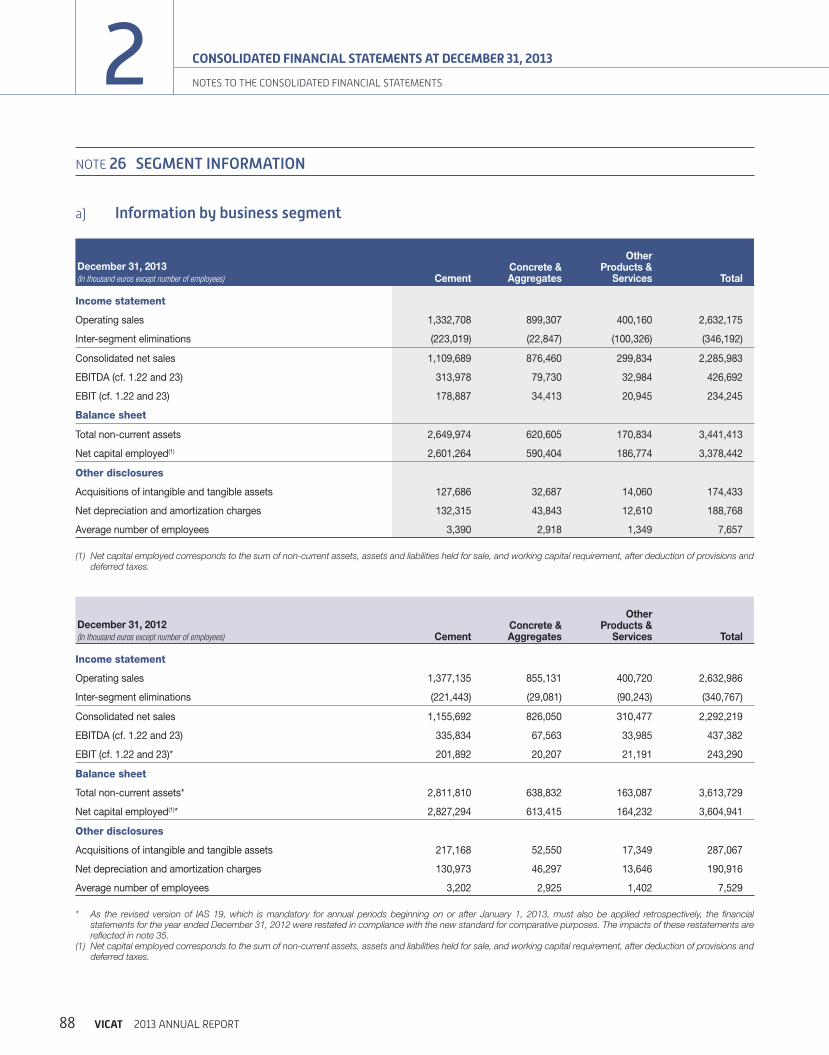
88 VICAT 2013 ANNUAL REPORT
2 CONSOLIDATED FINANCIAL STATEMENTS AT DECEMBER 31, 2013
NOTES TO THE CONSOLIDATED FINANCIAL STATEMENTS
NOTE 26 SEGMENT INFORMATION
a) Information by business segment
December 31, 2013(In thousand euros except number of employees) Cement
Concrete & Aggregates
Other Products &
Services Total
Income statement
Operating sales 1,332,708 899,307 400,160 2,632,175
Inter-segment eliminations (223,019) (22,847) (100,326) (346,192)
Consolidated net sales 1,109,689 876,460 299,834 2,285,983
EBITDA (cf. 1.22 and 23) 313,978 79,730 32,984 426,692
EBIT (cf. 1.22 and 23) 178,887 34,413 20,945 234,245
Balance sheet
Total non-current assets 2,649,974 620,605 170,834 3,441,413
Net capital employed(1) 2,601,264 590,404 186,774 3,378,442
Other disclosures
Acquisitions of intangible and tangible assets 127,686 32,687 14,060 174,433
Net depreciation and amortization charges 132,315 43,843 12,610 188,768
Average number of employees 3,390 2,918 1,349 7,657
(1) Net capital employed corresponds to the sum of non-current assets, assets and liabilities held for sale, and working capital requirement, after deduction of provisions and deferred taxes.
December 31, 2012(In thousand euros except number of employees) Cement
Concrete & Aggregates
Other Products &
Services Total
Income statement
Operating sales 1,377,135 855,131 400,720 2,632,986
Inter-segment eliminations (221,443) (29,081) (90,243) (340,767)
Consolidated net sales 1,155,692 826,050 310,477 2,292,219
EBITDA (cf. 1.22 and 23) 335,834 67,563 33,985 437,382
EBIT (cf. 1.22 and 23)* 201,892 20,207 21,191 243,290
Balance sheet
Total non-current assets* 2,811,810 638,832 163,087 3,613,729
Net capital employed(1)* 2,827,294 613,415 164,232 3,604,941
Other disclosures
Acquisitions of intangible and tangible assets 217,168 52,550 17,349 287,067
Net depreciation and amortization charges 130,973 46,297 13,646 190,916
Average number of employees 3,202 2,925 1,402 7,529
* As the revised version of IAS 19, which is mandatory for annual periods beginning on or after January 1, 2013, must also be applied retrospectively, the financial statements for the year ended December 31, 2012 were restated in compliance with the new standard for comparative purposes. The impacts of these restatements are reflected in note 35.
(1) Net capital employed corresponds to the sum of non-current assets, assets and liabilities held for sale, and working capital requirement, after deduction of provisions and deferred taxes.

89VICAT 2013 ANNUAL REPORT
CONSOLIDATED FINANCIAL STATEMENTS AT DECEMBER 31, 2013
2
2
2
2
2
2
2
NOTES TO THE CONSOLIDATED FINANCIAL STATEMENTS
b) Geographical sectors
Information relating to geographical areas is presented according to the geographical location of the entities concerned.
December 31, 2013(In thousand euros except number of employees) France
Europe(excluding
France)United States
Turkey, Kazakhstan
and India
West Africa and the Middle
East Total
Income statement:
Operating sales 883,443 427,050 220,828 461,401 328,630 2,321,352
Inter-country eliminations (27,639) (314) (741) (6,675) (35,369)
Consolidated net sales 855,804 426,736 220,828 460,660 321,955 2,285,983
EBITDA (cf. 1.22 and 23) 159,469 114,062 5,108 85,456 62,597 426,692
EBIT (cf. 1.22 and 23) 98,302 85,460 (17,391) 41,652 26,222 234,245
Balance sheet
Total non-current assets 649,470 557,323 419,956 1,148,962 665,702 3,441,413
Net capital employed(1) 670,118 513,724 339,305 1,154,704 700,591 3,378,442
Other disclosures:
Acquisitions of intangible and tangible assets 55,782 32,011 7,971 59,916 18,753 174,433
Net depreciation and amortization charges 58,498 28,661 24,691 42,720 34,198 188,768
Average number of employees 2,522 1,113 1,023 1,881 1,118 7,657
(1) Net capital employed corresponds to the sum of non-current assets, assets and liabilities held for sale, and working capital requirement, after deduction of provisions and deferred taxes.
December 31, 2012(In thousand euros except number of employees) France
Europe(excluding
France)United States
Turkey, Kazakhstan
and India
West Africa and the
Middle East Total
Income statement
Operating sales 906,043 410,871 196,143 442,542 368,986 2,324,585
Inter-country eliminations (26,914) (352) (416) (4,684) (32,366)
Consolidated net sales 879,129 410,519 196,143 442,126 364,302 2,292,219
EBITDA (cf. 1.22 and 23) 162,994 104,650 (5,485) 91,865 83,358 437,382
EBIT (cf. 1.22 and 23)* 103,613 76,044 (35,937) 53,795 45,775 243,290
Balance sheet
Total non-current assets* 646,856 550,967 443,915 1,268,857 703,134 3,613,729
Net capital employed(1)* 679,415 507,517 348,548 1,315,390 754,071 3,604,941
Other disclosures
Acquisitions of intangible and tangible assets 79,454 25,794 7,431 154,898 19,490 287,067
Net depreciation and amortization charges 59,814 29,337 29,063 37,265 35,437 190,916
Average number of employees 2,566 1,098 996 1,732 1,137 7,529
* As the revised version of IAS 19, which is mandatory for annual periods beginning on or after January 1, 2013, must also be applied retrospectively, the financial statements for the year ended December 31, 2012 were restated in compliance with the new standard for comparative purposes. The impacts of these restatements are reflected in note 35.
(1) Net capital employed corresponds to the sum of non-current assets, assets and liabilities held for sale, and working capital requirement, after deduction of provisions and deferred taxes.
c) Information about major customers
The Group is not overly dependent on any of its major customers and no single customer accounts for more than 10 % of sales.

90 VICAT 2013 ANNUAL REPORT
2 CONSOLIDATED FINANCIAL STATEMENTS AT DECEMBER 31, 2013
NOTES TO THE CONSOLIDATED FINANCIAL STATEMENTS
NOTE 27 NET CASH FLOWS FROM OPERATING ACTIVITIES
Net cash flows from the Group’s operating activities in 2013 came to
€ 337 million, compared with € 307 million in 2012.
This increase in cash flows from operating activities between 2012 and
2013 results from a € 37 million decrease in cash flow from operations
and a € 67 million improvement in working capital requirements
(decrease of € 46 million in 2013 and increase of € 21 million in 2012).
The components of the working capital requirement by type are as follows:
(in thousands of euros)
WCR as at December 31,
2011Change in
WCR in 2012Others
changes(1)
WCR as at December 31,
2012Change in WCR
in 2013Others
changes(1)
WCR as at December 31,
2013
Inventories 360,104 24,617 (2,828) 381,893 (4,732) (17,449) 359,712
Other WCR components 100,441 (3,205) (2,974) 94,262 (40,794) (7,440) 46,028
WCR 460,545 21,412 (5,802) 476,155 (45,526) (24,889) 405,740
(1) Exchange rate, consolidation scope and miscellaneous.
NOTE 28 NET CASH FLOWS FROM INVESTING ACTIVITIES
Net cash flows used in the Group’s investing activities in 2013 came to
€ (179) million, compared with € (273) million in 2012.
Acquisitions of intangible and tangible assets
These reflect outflows for industrial investments (€ 176 million in 2013
and € 269 million in 2012) mainly corresponding to the following:
W in 2013, the completion of the investment program for the Vicat Sagar
Cement greenfield plant in India, which started up in the first half of
2013, and the ongoing development in France of the Mépieu quarry,
but also maintenance and improvement investments in the Group’s
other operating countries;
W in 2012, the continuation of investments in India as part of the Vicat
Sagar Cement greenfield project and to a lesser extent investments
in maintenance and improvement spread across all countries.
Acquisition/disposal of shares in consolidated companies
In 2013, the acquisition and disposal of shares in consolidated
companies resulted in an overall cash outflow of € (9) million.
The main cash outflow by the Group during the year was tied to the
purchase of an additional stake in Mynaral Tas (see note 16.2).
Consolidated company share acquisitions and disposals during 2012
resulted in an overall cash outflow of € (11) million.
The main cash outflows from the Group during the year were for the
acquisition of additional holdings in companies already consolidated and
of new companies in France, in the Concrete & Aggregates segment.

91VICAT 2013 ANNUAL REPORT
CONSOLIDATED FINANCIAL STATEMENTS AT DECEMBER 31, 2013
2
2
2
2
2
2
2
NOTES TO THE CONSOLIDATED FINANCIAL STATEMENTS
NOTE 29 ANALYSIS OF NET CASH BALANCES
(in thousands of euros)
December 31, 2013 December 31, 2012
Net Net
Cash and cash equivalents (see note 6) 241,907 237,344
Bank overdrafts (16,095) (12,265)
NET CASH BALANCES 225,812 225,079
NOTE 30 COMPENSATION OF EXECUTIVES
Pursuant to the provisions of article 225.102-1 of the French Commercial
Code, and in accordance with IAS 24, we hereby inform you that
the total gross compensation paid to each company officer in 2013
was as follows: J. Merceron-Vicat: € 770,803; G. Sidos: € 771,595;
L. Merceron-Vicat: € 219,009; S. Sidos: € 34,442; R. de Parisot:
€ 522,579.
These amounts do not include any variable components and represent
the total compensation paid by Vicat SA and any companies it controls,
or is controlled by, as defined by article L. 233-16 of the French
Commercial Code.
Furthermore, no stock or stock options have been granted to the above
company officers with the exception of any income received under legal
or contractual employee profit-sharing or incentive plans.
Lastly, four of the aforementioned company officers also benefit from a
supplemental pension plan as defined in article 39 of the French General
Tax Code (CGI). The corresponding commitments (€ 7.783 million)
were all recognized in provisions in the financial statements, in the
same manner as all of the Group’s post-employment benefits as at
December 31, 2013 (note 1.15).
NOTE 31 TRANSACTIONS WITH RELATED COMPANIES
In addition to information required for related parties regarding the senior
executives, described in note 30, related parties with whom transactions
are carried out include affiliated companies and joint ventures in which
Vicat directly or indirectly holds a stake, and entities that hold a stake
in Vicat.
These related party transactions were not material in 2013 and all were
on an arm’s length basis.
These transactions have all been recorded in compliance with IAS 24
and their impact on the Group’s consolidated financial statements for
2013 and 2012 is as follows, broken down by type and by related party:
(in thousands of euros)
December 31, 2013 December 31, 2012
Sales Purchases Receivables Debts Sales Purchases Receivables Debts
Affiliated companies 540 2,169 7,278 2,178 525 1,227 7,080 999
Joint ventures 746 643 65 512 942 771 101 575
Other related parties 55 2,665 0 270 69 2,503 37 240
TOTAL 1,341 5,477 7,343 2,960 1,536 4,501 7,218 1,814

92 VICAT 2013 ANNUAL REPORT
2 CONSOLIDATED FINANCIAL STATEMENTS AT DECEMBER 31, 2013
NOTES TO THE CONSOLIDATED FINANCIAL STATEMENTS
NOTE 32 FEES PAID TO THE STATUTORY AUDITORS
Fees paid to statutory auditors and other professionals in their networks as recognized in the financial statements of Vicat SA and its proportionately
and fully consolidated subsidiaries for 2013 and 2012 are as follows:
(in thousands of euros)
KPMG Audit Wolff & associés Others
Amount (ex. VAT) % Amount (ex. VAT) % Amount (ex. VAT) %
2013 2012 2013 2012 2013 2012 2013 2012 2013 2012 2013 2012
AUDIT
Statutory auditors, certification, examination of individual and consolidated accounts 1,039 955 57 % 47 % 363 407 20 % 20 % 420 663 23 % 33 %
W VICAT SA 218 220 53 % 54 % 193 190 47 % 46 % 0 % 0 %
W Companies which are fully or proportionally consolidated 821 735 58 % 46 % 170 217 12 % 13 % 420 663 30 % 41 %
Other forms of investigation and directly related services 0 0 0 % 0 % 0 0 0 % 0 % 18 31 100 % 100 %
W VICAT SA - - - - - -
W Companies which are fully or proportionally consolidated 0 % 0 % 0 % 0 % 18 31 100 % 100 %
TOTAL AUDIT FEES 1,039 955 56 % 46 % 363 407 20 % 20 % 438 694 24 % 34 %
OTHER SERVICES
Legal, tax, employment and other matters 2 2 100 % 100 % 0 % 0 % 0 % 0 %
TOTAL OTHER SERVICES 2 2 100 % 100 % 0 0 0 % 0 % 0 0 0 % 0 %
TOTAL 1,041 957 56 % 46 % 363 407 20 % 20 % 438 694 24 % 34 %
NOTE 33 SUBSEQUENT EVENTS
On February 11, 2014, Kazakhstan’s central bank announced that, given
the capital outflows resulting from changes in monetary policy by the US
Federal Reserve, it would no longer maintain the tenge at its previous
level. The central bank confirmed that it would authorize its currency to
trade at 185 tenge per US dollar, with a range of 3 tenge on either side.
This announcement indicates a devaluation of about 19 % compared
to the tenge’s level in recent weeks.
The direct impact of this decision on the Group’s Kazakh subsidiaries
results in a foreign exchange loss of about US$ 20 million, taking into
account the net debt in US dollars of these companies and the existing
partial currency hedges.
No other post balance sheet event is likely to have a material impact on
the consolidated financial statements for the year ended December 31,
2013.

93VICAT 2013 ANNUAL REPORT
CONSOLIDATED FINANCIAL STATEMENTS AT DECEMBER 31, 2013
2
2
2
2
2
2
2
NOTES TO THE CONSOLIDATED FINANCIAL STATEMENTS
NOTE 34 LIST OF MAIN CONSOLIDATED COMPANIES AS AT DECEMBER 31, 2013
Fully consolidated: France
Company Adress Siren No.December 31, 2013
% ControlDecember 31, 2012
% Control
VICAT Tour Manhattan, 6 Place de l’Iris92095 PARIS LA DEFENSE
057 505 539 ---- ----
ALPES INFORMATIQUE 4 rue Aristide Bergès38080 L’ISLE D’ABEAU
073 502 510 99.92 99.84
ANNECY BETON CARRIERES 14 chemin des grèves74960 CRAN GEVRIER
326 020 062 50.00 50.00
LES ATELIERS DU GRANIER Lieu-dit Chapareillan38530 PONTCHARRA
305 662 504 100.00 100.00
BETON CHATILLONAIS Champ de l’Allée – ZI Nord01400 CHATILLON SUR CHALARONNE
485 069 819 100.00 100.00
BETON CONTROLE COTE D’AZUR 217 Route de Grenoble06200 NICE
071 503 569 97.12 97.12
BETON DE L’OISANS 4 rue Aristide Bergès38080 L’ISLE D’ABEAU
438 348 047 60.00 60.00
LES BETONS DU GOLFE Quartier les Plaines83480 PUGET SUR ARGENS
501 192 785 100.00 100.00
LES BETONS DU RHONE La petite Craz69720 SAINT LAURENT DE MURE
503 728 164 100.00 100.00
BETON VICAT 4 rue Aristide Bergès38080 L’ISLE D’ABEAU
309 918 464 99.99 99.92
BETON TRAVAUX Tour Manhattan, 6 Place de l’Iris92095 PARIS LA DEFENSE
070 503 198 99.98 99.98
BGIE BETON GRANULATS IDF/EST 52-56 rue Jacquard ZI77400 LAGNY SUR MARNE
344 933 338 Company merged in 2013
100.00
CONDENSIL 1327 Av. de la Houille Blanche73000 CHAMBERY
342 646 957 60.00 60.00
DELTA POMPAGE 1327 Av. de la Houille Blanche73000 CHAMBERY
316 854 363 100.00 100.00
ETABLISSEMENT ANTOINE FOURNIER 4 rue Aristide Bergès38080 L’ISLE D’ABEAU
586 550 147 100.00 100.00
GRANULATS VICAT 4 rue Aristide Bergès38080 L’ISLE D’ABEAU
768 200 255 100.00 99.87
MONACO BETON Le Palais Saint James5 avenue Princesse Alice98000 MONACO
326 MC 161 100.00 99.58
PARFICIM Tour Manhattan, 6 Place de l’Iris92095 PARIS LA DEFENSE
304 828 379 100.00 100.00
SATMA 4 rue Aristide Bergès38080 L’ISLE D’ABEAU
304 154 651 100.00 100.00
SATM 1327 Av. de la Houille Blanche73000 CHAMBERY
745 820 126 100.00 100.00
SIGMA BETON 4 rue Aristide Bergès38080 L’ISLE-D’ABEAU
343 019 428 100.00 100.00
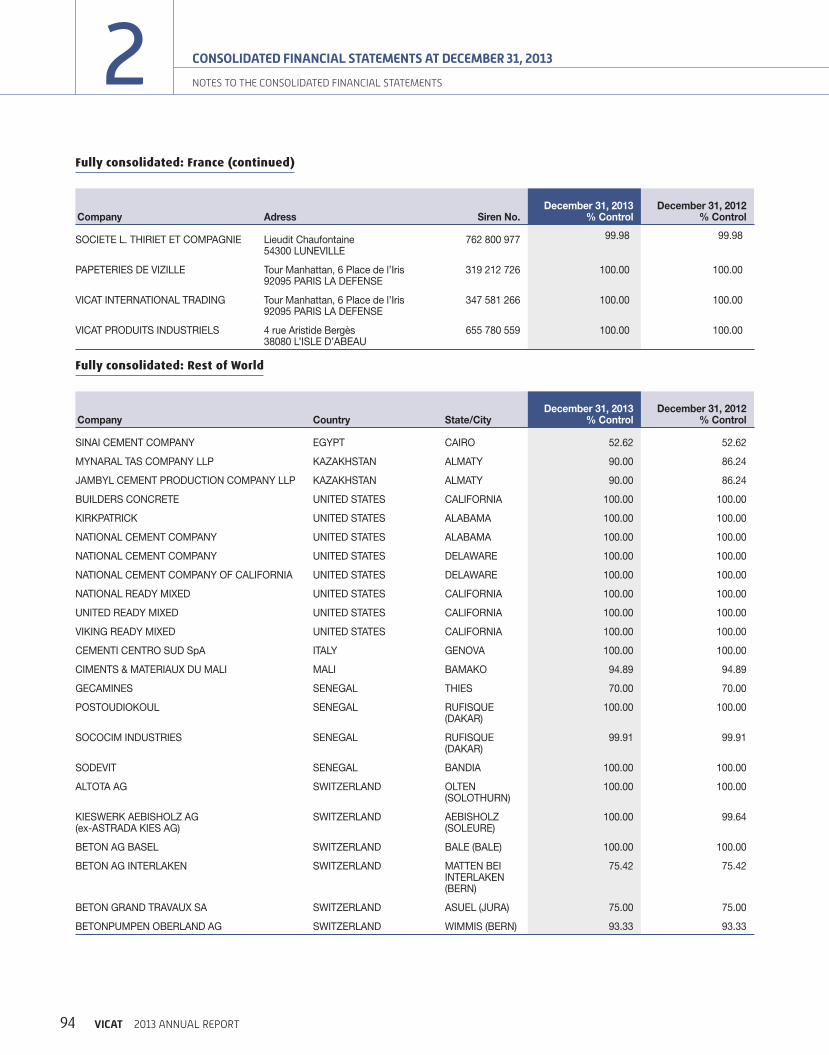
94 VICAT 2013 ANNUAL REPORT
2 CONSOLIDATED FINANCIAL STATEMENTS AT DECEMBER 31, 2013
NOTES TO THE CONSOLIDATED FINANCIAL STATEMENTS
Fully consolidated: France (continued)
Company Adress Siren No.December 31, 2013
% ControlDecember 31, 2012
% Control
SOCIETE L. THIRIET ET COMPAGNIE Lieudit Chaufontaine54300 LUNEVILLE
762 800 977 99.98 99.98
PAPETERIES DE VIZILLE Tour Manhattan, 6 Place de l’Iris92095 PARIS LA DEFENSE
319 212 726 100.00 100.00
VICAT INTERNATIONAL TRADING Tour Manhattan, 6 Place de l’Iris92095 PARIS LA DEFENSE
347 581 266 100.00 100.00
VICAT PRODUITS INDUSTRIELS 4 rue Aristide Bergès38080 L’ISLE D’ABEAU
655 780 559 100.00 100.00
Fully consolidated: Rest of World
Company Country State/CityDecember 31, 2013
% ControlDecember 31, 2012
% Control
SINAI CEMENT COMPANY EGYPT CAIRO 52.62 52.62
MYNARAL TAS COMPANY LLP KAZAKHSTAN ALMATY 90.00 86.24
JAMBYL CEMENT PRODUCTION COMPANY LLP KAZAKHSTAN ALMATY 90.00 86.24
BUILDERS CONCRETE UNITED STATES CALIFORNIA 100.00 100.00
KIRKPATRICK UNITED STATES ALABAMA 100.00 100.00
NATIONAL CEMENT COMPANY UNITED STATES ALABAMA 100.00 100.00
NATIONAL CEMENT COMPANY UNITED STATES DELAWARE 100.00 100.00
NATIONAL CEMENT COMPANY OF CALIFORNIA UNITED STATES DELAWARE 100.00 100.00
NATIONAL READY MIXED UNITED STATES CALIFORNIA 100.00 100.00
UNITED READY MIXED UNITED STATES CALIFORNIA 100.00 100.00
VIKING READY MIXED UNITED STATES CALIFORNIA 100.00 100.00
CEMENTI CENTRO SUD SpA ITALY GENOVA 100.00 100.00
CIMENTS & MATERIAUX DU MALI MALI BAMAKO 94.89 94.89
GECAMINES SENEGAL THIES 70.00 70.00
POSTOUDIOKOUL SENEGAL RUFISQUE (DAKAR)
100.00 100.00
SOCOCIM INDUSTRIES SENEGAL RUFISQUE (DAKAR)
99.91 99.91
SODEVIT SENEGAL BANDIA 100.00 100.00
ALTOTA AG SWITZERLAND OLTEN (SOLOTHURN)
100.00 100.00
KIESWERK AEBISHOLZ AG (ex-ASTRADA KIES AG)
SWITZERLAND AEBISHOLZ (SOLEURE)
100.00 99.64
BETON AG BASEL SWITZERLAND BALE (BALE) 100.00 100.00
BETON AG INTERLAKEN SWITZERLAND MATTEN BEIINTERLAKEN (BERN)
75.42 75.42
BETON GRAND TRAVAUX SA SWITZERLAND ASUEL (JURA) 75.00 75.00
BETONPUMPEN OBERLAND AG SWITZERLAND WIMMIS (BERN) 93.33 93.33

95VICAT 2013 ANNUAL REPORT
CONSOLIDATED FINANCIAL STATEMENTS AT DECEMBER 31, 2013
2
2
2
2
2
2
2
NOTES TO THE CONSOLIDATED FINANCIAL STATEMENTS
Fully consolidated: Rest of World (continued)
Company Country State/CityDecember 31, 2013
% ControlDecember 31, 2012
% Control
CEWAG SWITZERLAND DUTINGEN (FRIBOURG)
100.00 100.00
COVIT SA SWITZERLAND SAINT-BLAISE (NEUCHATEL)
100.00 100.00
CREABETON MATERIAUX SA SWITZERLAND LYSS (BERN) 100.00 100.00
EMME KIES + BETON AG SWITZERLAND LÜTZELFLÜH (BERN)
66.66 66.66
FRISCHBETON AG ZUCHWIL SWITZERLAND ZUCHWIL (SOLOTHURN)
88.94 88.94
FRISCHBETON LANGENTHAL AG SWITZERLAND LANGENTHAL (BERN)
78.67 78.67
FRISCHBETON THUN SWITZERLAND THOUNE (BERN) 54.26 54.26
GRANDY AG SWITZERLAND LANGENDORF (SOLEURE)
100.00 100.00
KIESTAG STEINIGAND AG SWITZERLAND WIMMIS (BERN) 98.55 98.55
MATERIALBEWIRTTSCHFTUNG MITHOLZ AG SWITZERLAND KANDERGRUND (BERN)
98.55 98.55
KIESWERK NEUENDORF SWITZERLAND NEUENDORF (SOLEURE)
100.00 100.00
SABLES + GRAVIERS TUFFIERE SA SWITZERLAND HAUTERIVE (FRIBOURG)
50.00 50.00
SHB STEINBRUCH + HARTSCHOTTER BLAUSEE MITHOLZ AG
SWITZERLAND FRUTIGEN (BERN)
98.55 98.55
STEINBRUCH VORBERG AG SWITZERLAND BIEL (BERN) 60.00 60.00
VIGIER BETON JURA SA (formerly BETON FRAIS MOUTIER SA)
SWITZERLAND BELPRAHON (BERN)
90.00 90.00
VIGIER BETON KIES SEELAND AG (ex-VIBETON KIES AG)
SWITZERLAND LYSS (BERN) 100.00 100.00
VIGIER BETON MITTELLAND AG (ex-WYSS KIESWERK AG)
SWITZERLAND FELDBRUNNEN (SOLOTHURN)
100.00 100.00
VIGIER BETON ROMANDIE SA (ex-VIBETON FRIBOURG SA)
SWITZERLAND ST. URSEN (FRIBOURG)
100.00 100.00
VIGIER BETON SEELAND JURA AG (ex-VIBETON SAFNERN AG)
SWITZERLAND SAFNERN (BERN)
90.47 90.47
VIGIER CEMENT AG SWITZERLAND PERY(BERN) 100.00 100.00
VIGIER HOLDING AG SWITZERLANDDEITINGEN (SOLOTHURN) 100.00 100.00
VIGIER MANAGEMENT AG SWITZERLANDDEITINGEN (SOLOTHURN) 100.00 100.00
VIRO AG SWITZERLANDDEITINGEN (SOLOTHURN) 100.00 100.00
VITRANS AG SWITZERLAND PERY(BERN) 100.00 100.00
AKTAS TURKEY ANKARA 100.00 100.00

96 VICAT 2013 ANNUAL REPORT
2 CONSOLIDATED FINANCIAL STATEMENTS AT DECEMBER 31, 2013
NOTES TO THE CONSOLIDATED FINANCIAL STATEMENTS
Fully consolidated: Rest of World (continued)
Company Country State/CityDecember 31, 2013
% ControlDecember 31, 2012
% Control
BASTAS BASKENT CIMENTO TURKEY ANKARA 91.58 91.58
BASTAS HAZIR BETON TURKEY ANKARA 91.58 91.58
KONYA CIMENTO TURKEY KONYA 83.34 83.08
TAMTAS TURKEY ANKARA 100.00 100.00
BSA Ciment SA MAURITANIA NOUAKCHOTT 64.91 64.91
BHARATHI CEMENT INDIA HYDERABAD 51.00 51.00
VICAT SAGAR INDIA HYDERABAD 53.00 53.00
Proportionately consolidated: France
Company Address Siren No.December 31, 2013
% ControlDecember 31, 2012
% Control
CARRIERES BRESSE BOURGOGNEPort Fluvial Sud de Chalon71380 EPERVANS 655 850 055 49.95 49.95
DRAGAGES ET CARRIERESPort Fluvial sud de Chalon71380 EPERVANS 341 711 125 50.00 50.00
SABLIERES DU CENTRELes Genévriers Sud63430 LES MARTRES D’ARTIERE 480 107 457 50.00 50.00
Proportionately consolidated: Rest of World
Company Country State/CityDecember 31, 2013
% ControlDecember 31, 2012
% Control
FRISHBETON TAFERS AG SWITZERLAND Tafers (Fribourg) 49.50 49.50
Equity method: Rest of World
Company Country State/CityDecember 31, 2013
% ControlDecember 31, 2012
% Control
HYDROELECTRA SWITZERLAND AU (ST. GALLEN) 50.00 50.00
SILO TRANSPORT AG SWITZERLAND BERN (BERN) 50.00 50.00
SINAI WHITE CEMENT EGYPT CAIRO 25.40 25.40

97VICAT 2013 ANNUAL REPORT
CONSOLIDATED FINANCIAL STATEMENTS AT DECEMBER 31, 2013
2
2
2
2
2
2
2
NOTES TO THE CONSOLIDATED FINANCIAL STATEMENTS
NOTE 35 APPLICATION OF IAS 19 (REVISED)
35.1. Consolidated statement of financial position: Published information and restatements under IAS 19 (revised)
Consolidated statement of financial position
(in thousands of euros)
12/31/2011 restated
Impact of IAS 19 (revised)
12/31/2011 published
12/31/2012 restated
Impact of IAS 19 (revised)
12/31/2012 published
ASSETS
Non-current assets
Goodwill 1,000,195 1,000,195 995,320 995,320
Other intangible assets 100,789 100,789 100,417 100,417
Tangible assets 2,218,465 2,218,465 2,271,210 2,271,210
Investment properties 19,089 19,089 19,557 19,557
Investments in associated companies 37,900 37,900 37,731 37,731
Deferred tax assets 2,163 59 2,104 89,162 182 88,980
Receivables and other non-current financial assets 108,665 (8,263) 116,928 100,332 (8,320) 108,652
TOTAL NON-CURRENT ASSETS 3,487,266 (8,204) 3,495,470 3,613,729 (8,138) 3,621,867
Current assets
Inventories and work-in-progress 360,104 360,104 381,893 381,893
Trade and other receivables 349,994 349,994 354,877 354,877
Current tax assets 16,685 16,685 29,455 29,455
Other receivables and related accounts 144,930 144,930 146,458 146,458
Cash and cash equivalents 359,404 359,404 237,344 237,344
TOTAL CURRENT ASSETS 1,231,117 0 1,231,117 1,150,027 0 1,150,027
TOTAL ASSETS 4,718,383 (8,204) 4,726,587 4,763,756 (8,138) 4,771,894
This note summarizes the main impacts of the first application of the revised version of IAS 19 on equity as at January 1, 2012 and on the 2012
annual consolidated financial statements.
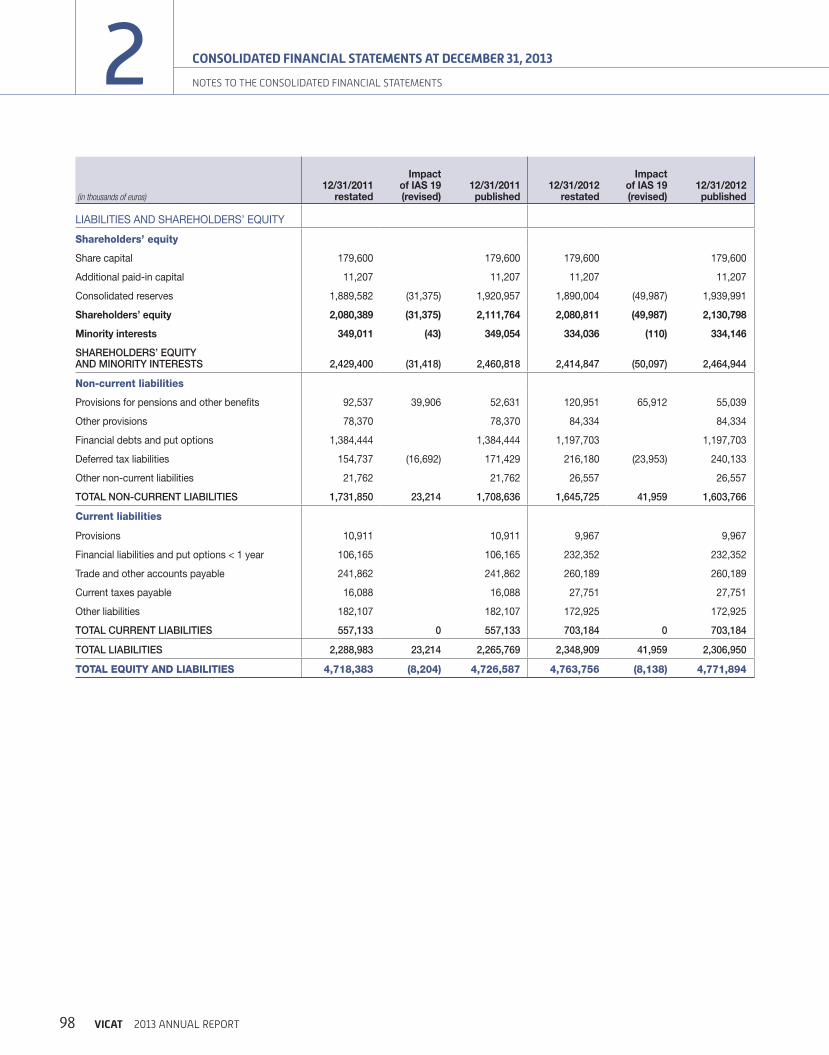
98 VICAT 2013 ANNUAL REPORT
2 CONSOLIDATED FINANCIAL STATEMENTS AT DECEMBER 31, 2013
NOTES TO THE CONSOLIDATED FINANCIAL STATEMENTS
(in thousands of euros)
12/31/2011 restated
Impact of IAS 19(revised)
12/31/2011 published
12/31/2012 restated
Impact of IAS 19(revised)
12/31/2012 published
LIABILITIES AND SHAREHOLDERS’ EQUITY
Shareholders’ equity
Share capital 179,600 179,600 179,600 179,600
Additional paid-in capital 11,207 11,207 11,207 11,207
Consolidated reserves 1,889,582 (31,375) 1,920,957 1,890,004 (49,987) 1,939,991
Shareholders’ equity 2,080,389 (31,375) 2,111,764 2,080,811 (49,987) 2,130,798
Minority interests 349,011 (43) 349,054 334,036 (110) 334,146
SHAREHOLDERS’ EQUITY AND MINORITY INTERESTS 2,429,400 (31,418) 2,460,818 2,414,847 (50,097) 2,464,944
Non-current liabilities
Provisions for pensions and other benefits 92,537 39,906 52,631 120,951 65,912 55,039
Other provisions 78,370 78,370 84,334 84,334
Financial debts and put options 1,384,444 1,384,444 1,197,703 1,197,703
Deferred tax liabilities 154,737 (16,692) 171,429 216,180 (23,953) 240,133
Other non-current liabilities 21,762 21,762 26,557 26,557
TOTAL NON-CURRENT LIABILITIES 1,731,850 23,214 1,708,636 1,645,725 41,959 1,603,766
Current liabilities
Provisions 10,911 10,911 9,967 9,967
Financial liabilities and put options < 1 year 106,165 106,165 232,352 232,352
Trade and other accounts payable 241,862 241,862 260,189 260,189
Current taxes payable 16,088 16,088 27,751 27,751
Other liabilities 182,107 182,107 172,925 172,925
TOTAL CURRENT LIABILITIES 557,133 0 557,133 703,184 0 703,184
TOTAL LIABILITIES 2,288,983 23,214 2,265,769 2,348,909 41,959 2,306,950
TOTAL EQUITY AND LIABILITIES 4,718,383 (8,204) 4,726,587 4,763,756 (8,138) 4,771,894
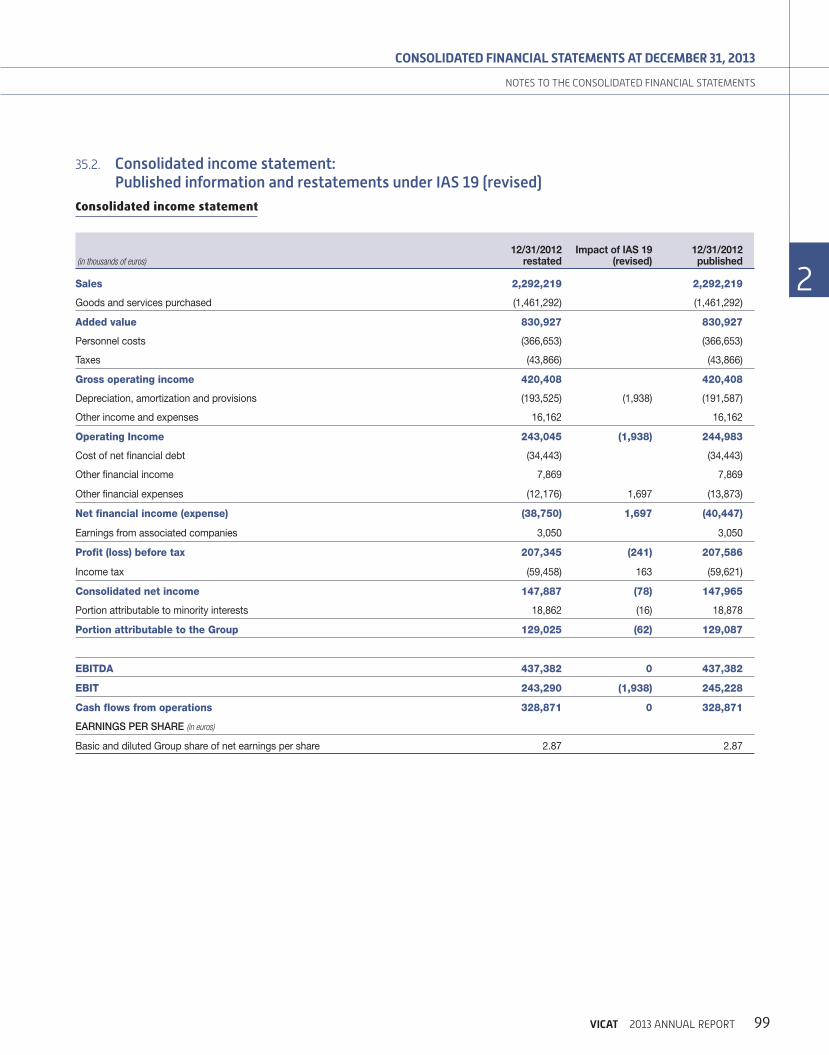
99VICAT 2013 ANNUAL REPORT
CONSOLIDATED FINANCIAL STATEMENTS AT DECEMBER 31, 2013
2
2
2
2
2
2
2
NOTES TO THE CONSOLIDATED FINANCIAL STATEMENTS
35.2. Consolidated income statement: Published information and restatements under IAS 19 (revised)
Consolidated income statement
(in thousands of euros)
12/31/2012 restated
Impact of IAS 19 (revised)
12/31/2012 published
Sales 2,292,219 2,292,219
Goods and services purchased (1,461,292) (1,461,292)
Added value 830,927 830,927
Personnel costs (366,653) (366,653)
Taxes (43,866) (43,866)
Gross operating income 420,408 420,408
Depreciation, amortization and provisions (193,525) (1,938) (191,587)
Other income and expenses 16,162 16,162
Operating Income 243,045 (1,938) 244,983
Cost of net financial debt (34,443) (34,443)
Other financial income 7,869 7,869
Other financial expenses (12,176) 1,697 (13,873)
Net financial income (expense) (38,750) 1,697 (40,447)
Earnings from associated companies 3,050 3,050
Profit (loss) before tax 207,345 (241) 207,586
Income tax (59,458) 163 (59,621)
Consolidated net income 147,887 (78) 147,965
Portion attributable to minority interests 18,862 (16) 18,878
Portion attributable to the Group 129,025 (62) 129,087
EBITDA 437,382 0 437,382
EBIT 243,290 (1,938) 245,228
Cash flows from operations 328,871 0 328,871
EARNINGS PER SHARE (in euros)
Basic and diluted Group share of net earnings per share 2.87 2.87

100 VICAT 2013 ANNUAL REPORT
2 CONSOLIDATED FINANCIAL STATEMENTS AT DECEMBER 31, 2013
NOTES TO THE CONSOLIDATED FINANCIAL STATEMENTS
35.3. Consolidated statement of comprehensive income: Published information and restatements under IAS 19 (revised)
Consolidated statement of comprehensive income
(in thousands of euros)
12/31/2012 restated
Impact of IAS 19 (revised)
12/31/2012 published
Consolidated net income 147,887 (78) 147,965
Other comprehensive income
Items not recycled to profit or loss:
Actuarial gains and losses on employee benefits (25,093) (25,093)
Tax on non-recycled items 6,015 6,015
Items recycled to profit or loss:
Net income from change in translation differences (47,708) 477 (48,185)
Cash flow hedge instruments (22,972) (22,972)
Tax on recycled items 8,897 8,897
Other comprehensive income (after tax) (80,861) (18,601) (62,260)
TOTAL COMPREHENSIVE INCOME 67,026 (18,679) 85,705
Portion attributable to minority interests 3,670 (67) 3,737
Portion attributable to the Group 63,356 (18,612) 81,968

101VICAT 2013 ANNUAL REPORT
CONSOLIDATED FINANCIAL STATEMENTS AT DECEMBER 31, 2013
2
2
2
2
2
2
2
NOTES TO THE CONSOLIDATED FINANCIAL STATEMENTS
35.4. Consolidated statement of cash flow: Published information and restatements under IAS 19 (revised)
Consolidated statement of cash flows
(in thousands of euros)
12/31/2012 restated
Impact of IAS 19 (revised)
12/31/2012 published
CASH FLOWS FROM OPERATING ACTIVITIES
Consolidated net income 147,887 (78) 147,965
Earnings from associated companies (3,051) (3,051)
Dividends received from associated companies 1,582 1,582
Elimination of non-cash and non-operating items:
- depreciation, amortization and provisions 199,767 78 199,689
- deferred taxes (12,743) (12,743)
- net (gain) loss from disposal of assets (2,918) (2,918)
- unrealized fair value gains and losses (1,619) (1,619)
- other (34) (34)
Cash flows from operating activities 328,871 0 328,871
Change in working capital requirement (21,412) (21,412)
NET CASH FLOWS FROM OPERATING ACTIVITIES 307,459 0 307,459
CASH FLOWS FROM INVESTING ACTIVITIES
Outflows linked to acquisitions of non-current assets:
- property, plant and equipment and intangible assets (268,963) (268,963)
- financial investments (4,203) (4,203)
Inflows linked to disposals of non-current assets:
- property, plant and equipment and intangible assets 7,625 7,625
- financial investments 3,429 3,429
Impact of changes in consolidation scope (10,646) (10,646)
NET CASH FLOWS FROM INVESTING ACTIVITIES (272,758) 0 (272,758)
CASH FLOWS FROM FINANCING ACTIVITIES
Dividends paid (87,993) (87,993)
Increases in share capital 3,870 3,870
Proceeds from borrowings 108,334 108,334
Repayments of borrowings (177,197) (177,197)
Acquisitions of treasury shares (10,472) (10,472)
Disposals or allocations of treasury shares 14,165 14,165
NET CASH FLOWS FROM FINANCING ACTIVITIES (149,293) 0 (149,293)
Impact of changes in foreign exchange rates (4,342) (4,342)
Change in cash position (118,934) 0 (118,934)
Net cash and cash equivalents – opening balance 344,013 344,013
Net cash and cash equivalents – closing balance 225,079 225,079

102 VICAT 2013 ANNUAL REPORT
2 CONSOLIDATED FINANCIAL STATEMENTS AT DECEMBER 31, 2013
NOTES TO THE CONSOLIDATED FINANCIAL STATEMENTS
35.5. Statement of changes in consolidated equity: Published information and restatements under IAS 19 (revised)
Statement of changes in consolidated equity
(in thousands of euros)
Share capital
Additional paid-in capital
Treasury shares
Consolidated reserves
Translation reserves
Shareholders’ equity
Minority interests
Shareholders’ equity and
minority interests
AS OF JANUARY 1, 2012 (PUBLISHED) 179,600 11,207 (83,890) 2,080,899 (76,052) 2,111,764 349,054 2,460,818
Adjustments under IAS 19 (revised), 1/1/2012 (31,375) (31,375) (43) (31,418)
As at January 1, 2012 (restated) 179,600 11,207 (83,890) 2,049,524 (76,052) 2,080,389 349,011 2,429,400
Consolidated net income 129,087 129,087 18,878 147,965
Adjustments to net income under IAS 19 (revised) (62) (62) (16) (78)
Other comprehensive income (14,798) (32,321) (47,119) (15,141) (62,260)
Adjustments to comprehensive net income under IAS 19 (revised) (19,027) 477 (18,550) (51) (18,601)
Comprehensive income (published) 114,289 (32,321) 81,968 3,737 85,705
Total adjustments to comprehensive net income under IAS 19 (revised) (19,089) 477 (18,612) (67) (18,679)
Comprehensive income (restated) 95,200 (31,844) 63,356 3,670 67,026
Dividends paid (66,039) (66,039) (22,124) (88,163)
Net change in treasury shares 5,209 (994) 4,215 4,215
Changes in consolidation scope and additional acquisitions (749) (749) (154) (903)
Increases in share capital (666) (666) 4,239 3,573
Other changes 305 305 (606) (301)
AS AT DECEMBER 31, 2012 (PUBLISHED) 179,600 11,207 (78,681) 2,127,045 (108,373) 2,130,798 334,146 2,464,944
Adjustments under IAS 19 (revised), 12/31/2012 (50,464) 477 (49,987) (110) (50,097)
AS AT DECEMBER 31, 2012 (RESTATED) 179,600 11,207 (78,681) 2,076,581 (107,896) 2,080,811 334,036 2,414,847

103VICAT 2013 ANNUAL REPORT
CONSOLIDATED FINANCIAL STATEMENTS AT DECEMBER 31, 2013
2
2
2
2
2
2
2
STATUTORY AUDITORS’ REPORT ON THE CONSOLIDATED FINANCIAL STATEMENTS
STATUTORY AUDITORS’ REPORT ON THE CONSOLIDATED FINANCIAL STATEMENTS
This is a free translation into English of the statutory auditors’ report on the consolidated financial statements issued in the French language and is
provided solely for the convenience of English-speaking users.
The statutory auditors' report includes information specifically required by French law in such reports, whether modified or not. This information
is presented below the audit opinion on the consolidated financial statements and includes an explanatory paragraph discussing the auditors'
assessments of certain significant accounting and auditing matters. These assessments were considered for the purpose of issuing an audit opinion
on the consolidated financial statements taken as a whole and not to provide separate assurance on individual account balances, transactions, or
disclosures.
This report also includes information relating to the specific verification of information relating to the Group given in the management report.
This report should be read in conjunction with, and construed in accordance with, French law and professional auditing standards applicable in France.
Year ended 31 December 2013
To the Shareholders,
In compliance with the assignment entrusted to us by the shareholders in General Meeting, we hereby report to you, for the year ended 31 December
2013, on:
W the audit of the accompanying consolidated financial statements of Vicat S.A.;
W the justification of our assessments;
W the specific verification required by law.
These consolidated financial statements have been approved by the Board of Directors. Our role is to express an opinion on these financial statements
based on our audit.
I - Opinion on the consolidated financial statements
We conducted our audit in accordance with professional standards applicable in France. Those standards require that we plan and perform the audit
to obtain reasonable assurance about whether the consolidated financial statements are free of material misstatement. An audit involves performing
procedures, using sampling techniques or other methods of selection, to obtain audit evidence about the amounts and disclosures in the financial
statements. An audit includes examining, on a test basis, evidence supporting the amounts and disclosures in the consolidated financial statements.
An audit also includes evaluating the appropriateness of accounting policies used and the reasonableness of accounting estimates made, as well as
the overall presentation of the consolidated financial statements. We believe that the audit evidence we have obtained is sufficient and appropriate
to provide a basis for our audit opinion.
In our opinion, the consolidated financial statements give a true and fair view, in accordance with IFRS as adopted by the EU, of the assets, liabilities,
and financial position of the consolidated group of entities as at 31 December 2013 and of the results of its operations for the year then ended.
Without qualifying the conclusion expressed above, we draw your attention to the mention in the note 35 to consolidated financial statements which
sets out the accounting consequences related to the first application of "revised IAS 19" on the shareholders’ equity at 1 January 2012, as well as
on the consolidated financial statement for the period ended 31 December 2012.
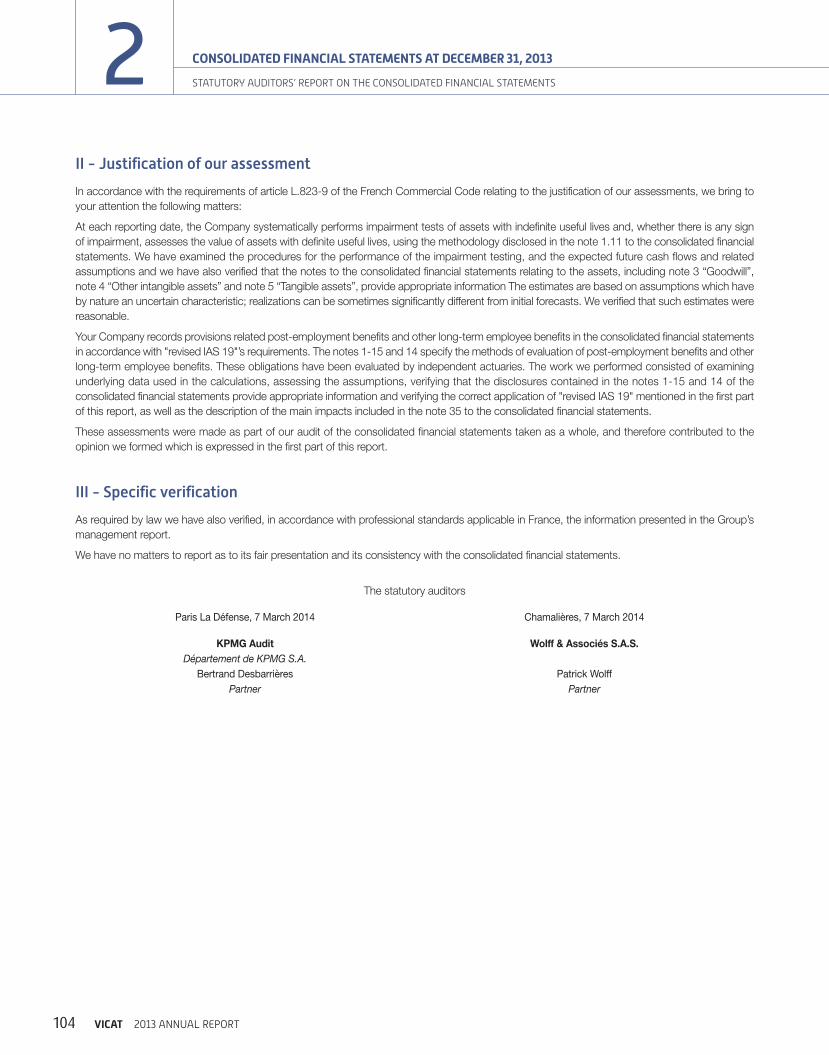
104 VICAT 2013 ANNUAL REPORT
2 CONSOLIDATED FINANCIAL STATEMENTS AT DECEMBER 31, 2013
STATUTORY AUDITORS’ REPORT ON THE CONSOLIDATED FINANCIAL STATEMENTS
II - Justification of our assessment
In accordance with the requirements of article L.823-9 of the French Commercial Code relating to the justification of our assessments, we bring to
your attention the following matters:
At each reporting date, the Company systematically performs impairment tests of assets with indefinite useful lives and, whether there is any sign
of impairment, assesses the value of assets with definite useful lives, using the methodology disclosed in the note 1.11 to the consolidated financial
statements. We have examined the procedures for the performance of the impairment testing, and the expected future cash flows and related
assumptions and we have also verified that the notes to the consolidated financial statements relating to the assets, including note 3 “Goodwill”,
note 4 “Other intangible assets” and note 5 “Tangible assets”, provide appropriate information The estimates are based on assumptions which have
by nature an uncertain characteristic; realizations can be sometimes significantly different from initial forecasts. We verified that such estimates were
reasonable.
Your Company records provisions related post-employment benefits and other long-term employee benefits in the consolidated financial statements
in accordance with "revised IAS 19"’s requirements. The notes 1-15 and 14 specify the methods of evaluation of post-employment benefits and other
long-term employee benefits. These obligations have been evaluated by independent actuaries. The work we performed consisted of examining
underlying data used in the calculations, assessing the assumptions, verifying that the disclosures contained in the notes 1-15 and 14 of the
consolidated financial statements provide appropriate information and verifying the correct application of "revised IAS 19" mentioned in the first part
of this report, as well as the description of the main impacts included in the note 35 to the consolidated financial statements.
These assessments were made as part of our audit of the consolidated financial statements taken as a whole, and therefore contributed to the
opinion we formed which is expressed in the first part of this report.
III - Specific verification
As required by law we have also verified, in accordance with professional standards applicable in France, the information presented in the Group’s
management report.
We have no matters to report as to its fair presentation and its consistency with the consolidated financial statements.
The statutory auditors
Paris La Défense, 7 March 2014 Chamalières, 7 March 2014
KPMG Audit Wolff & Associés S.A.S.
Département de KPMG S.A.
Bertrand Desbarrières Patrick Wolff
Partner Partner
105VICAT 2013 ANNUAL REPORT
3STATUTORY FINANCIAL STATEMENTS AS OF DECEMBER 31, 2013
INCOME STATEMENT 106
BALANCE SHEET AT DECEMBER 31, 2013 107
2013 FINANCIAL STATEMENTS – APPENDIX 108
SUBSIDIARIES AND AFFILIATES 119
ANALYSIS OF INCOME FOR THE YEAR 120
FINANCIAL INCOME FOR THE LAST FIVE FINANCIAL YEARS 121
STATUTORY AUDITORS’ REPORT ON THE FINANCIAL STATEMENTS 122
STATUTORY AUDITORS’ REPORT ON REGULATED AGREEMENT AND COMMITMENTS 124

106 VICAT 2013 ANNUAL REPORT
3 STATUTORY FINANCIAL STATEMENTS AS OF DECEMBER 31, 2013
INCOME STATEMENT
INCOME STATEMENT
(in thousands of euros) 2013 2012
Net sales 416,762 443,119
Production in the year 419,895 449,799
Consumption in the year (237,784) (257,249)
A dded value 182,111 192,550
Personnel costs (63,535) (63,457)
Taxes (17,986) (17,462)
Transfer of expenses and subsidies 703 320
Gross operating profit 101,293 111,951
Other income and expenses 4,949 3,075
Net amortization and provisions (25,701) (23,010)
Operating income 80,541 92,016
Financial income and expenses 165,546 108,054
Current profit 246,087 200,070
Exceptional income and expenses 2,996 (6,169)
Employee profit-sharing (3,286) (4,906)
Income taxes (21,335) (15,269)
Net income for the year 224,462 173,726
Cash flow from operations 235,431 199,257
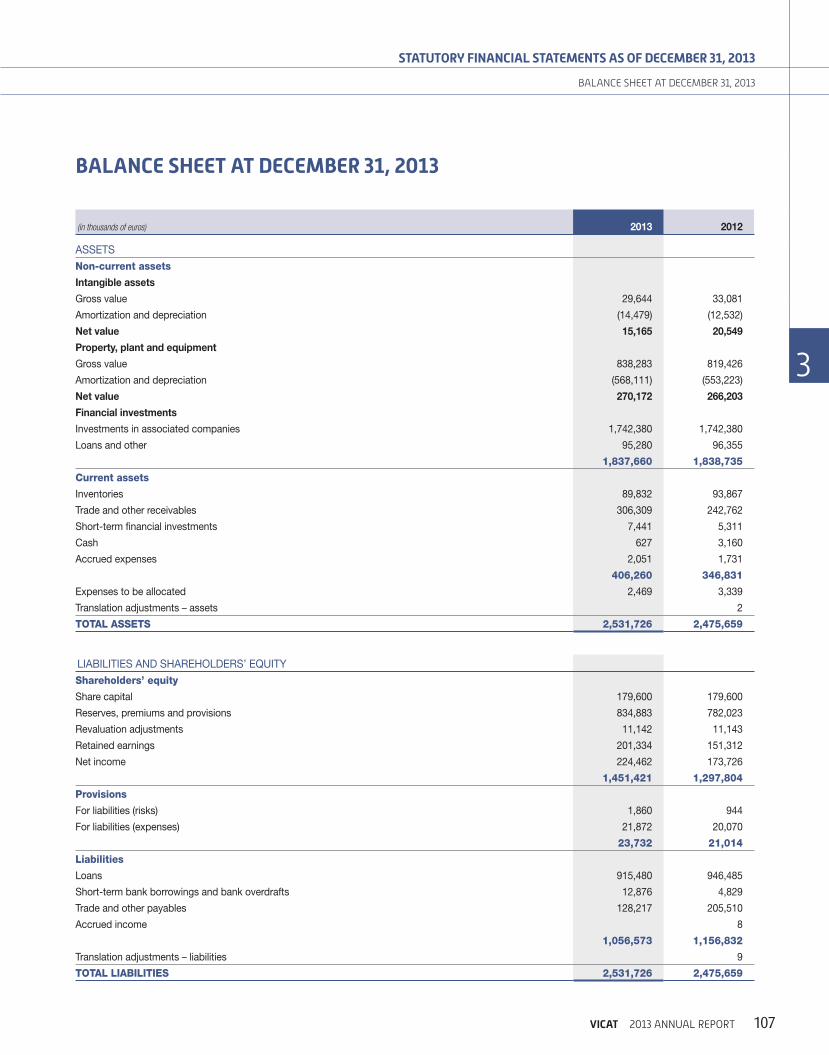
107VICAT 2013 ANNUAL REPORT
STATUTORY FINANCIAL STATEMENTS AS OF DECEMBER 31, 2013
3
3
3
3
3
3
3
BALANCE SHEET AT DECEMBER 31, 2013
BALANCE SHEET AT DECEMBER 31, 2013
(in thousands of euros) 2013 2012
ASSETS
Non-current assets
Intangible assets
Gross value 29,644 33,081
Amortization and depreciation (14,479) (12,532)
Net value 15,165 20,549
Property, plant and equipment
Gross value 838,283 819,426
Amortization and depreciation (568,111) (553,223)
Net value 270,172 266,203
Financial investments
Investments in associated companies 1,742,380 1,742,380
Loans and other 95,280 96,355
1,837,660 1,838,735
Current assets
Inventories 89,832 93,867
Trade and other receivables 306,309 242,762
Short-term financial investments 7,441 5,311
Cash 627 3,160
Accrued expenses 2,051 1,731
406,260 346,831
Expenses to be allocated 2,469 3,339
Translation adjustments – assets 2
TOTAL ASSETS 2,531,726 2,475,659
LIABILITIES AND SHAREHOLDERS’ EQUITY
Shareholders’ equity
Share capital 179,600 179,600
Reserves, premiums and provisions 834,883 782,023
Revaluation adjustments 11,142 11,143
Retained earnings 201,334 151,312
Net income 224,462 173,726
1,451,421 1,297,804
Provisions
For liabilities (risks) 1,860 944
For liabilities (expenses) 21,872 20,070
23,732 21,014
Liabilities
Loans 915,480 946,485
Short-term bank borrowings and bank overdrafts 12,876 4,829
Trade and other payables 128,217 205,510
Accrued income 8
1,056,573 1,156,832
Translation adjustments – liabilities 9
TOTAL LIABILITIES 2,531,726 2,475,659
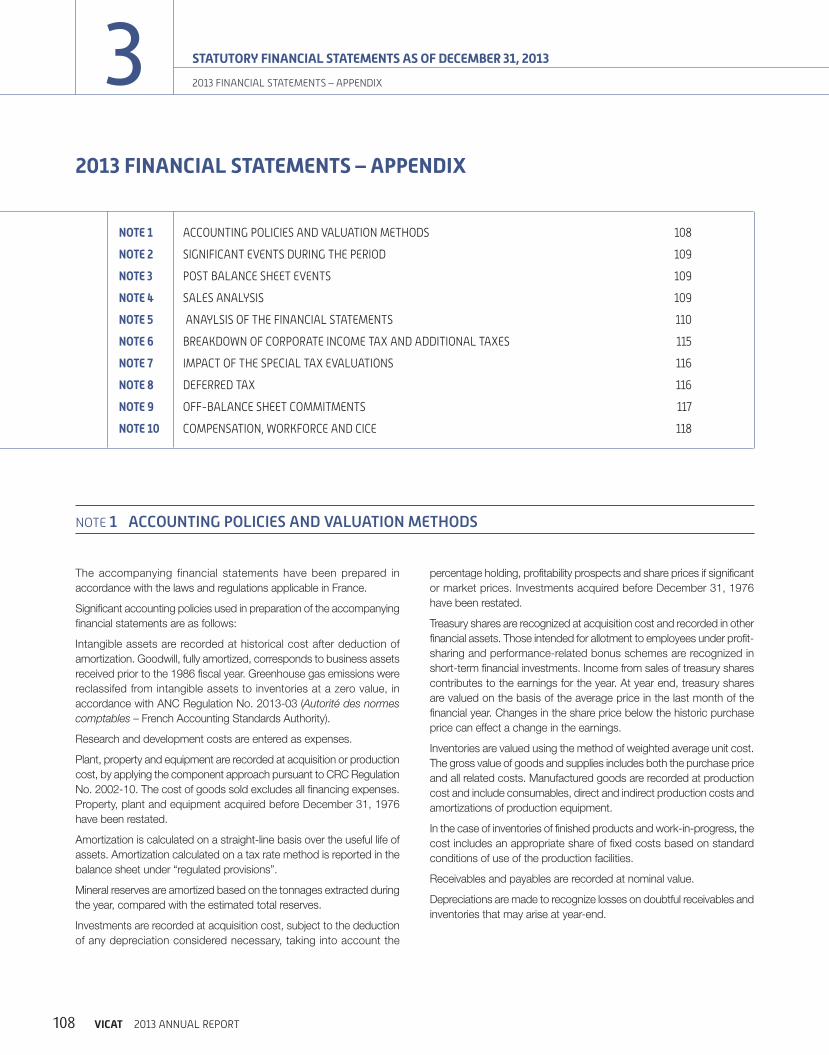
108 VICAT 2013 ANNUAL REPORT
3 STATUTORY FINANCIAL STATEMENTS AS OF DECEMBER 31, 2013
2013 FINANCIAL STATEMENTS – APPENDIX
2013 FINANCIAL STATEMENTS – APPENDIX
NOTE 1 ACCOUNTING POLICIES AND VALUATION METHODS
The accompanying financial statements have been prepared in
accordance with the laws and regulations applicable in France.
Significant accounting policies used in preparation of the accompanying
financial statements are as follows:
Intangible assets are recorded at historical cost after deduction of
amortization. Goodwill, fully amortized, corresponds to business assets
received prior to the 1986 fiscal year. Greenhouse gas emissions were
reclassifed from intangible assets to inventories at a zero value, in
accordance with ANC Regulation No. 2013-03 (Autorité des normes
comptables – French Accounting Standards Authority).
Research and development costs are entered as expenses.
Plant, property and equipment are recorded at acquisition or production
cost, by applying the component approach pursuant to CRC Regulation
No. 2002-10. The cost of goods sold excludes all financing expenses.
Property, plant and equipment acquired before December 31, 1976
have been restated.
Amortization is calculated on a straight-line basis over the useful life of
assets. Amortization calculated on a tax rate method is reported in the
balance sheet under “regulated provisions”.
Mineral reserves are amortized based on the tonnages extracted during
the year, compared with the estimated total reserves.
Investments are recorded at acquisition cost, subject to the deduction
of any depreciation considered necessary, taking into account the
percentage holding, profitability prospects and share prices if significant
or market prices. Investments acquired before December 31, 1976
have been restated.
Treasury shares are recognized at acquisition cost and recorded in other
financial assets. Those intended for allotment to employees under profit-
sharing and performance-related bonus schemes are recognized in
short-term financial investments. Income from sales of treasury shares
contributes to the earnings for the year. At year end, treasury shares
are valued on the basis of the average price in the last month of the
financial year. Changes in the share price below the historic purchase
price can effect a change in the earnings.
Inventories are valued using the method of weighted average unit cost.
The gross value of goods and supplies includes both the purchase price
and all related costs. Manufactured goods are recorded at production
cost and include consumables, direct and indirect production costs and
amortizations of production equipment.
In the case of inventories of finished products and work-in-progress, the
cost includes an appropriate share of fixed costs based on standard
conditions of use of the production facilities.
Receivables and payables are recorded at nominal value.
Depreciations are made to recognize losses on doubtful receivables and
inventories that may arise at year-end.
NOTE 1 ACCOUNTING POLICIES AND VALUATION METHODS 108
NOTE 2 SIGNIFICANT EVENTS DURING THE PERIOD 109
NOTE 3 POST BALANCE SHEET EVENTS 109
NOTE 4 SALES ANALYSIS 109
NOTE 5 ANAYLSIS OF THE FINANCIAL STATEMENTS 110
NOTE 6 BREAKDOWN OF CORPORATE INCOME TAX AND ADDITIONAL TAXES 115
NOTE 7 IMPACT OF THE SPECIAL TAX EVALUATIONS 116
NOTE 8 DEFERRED TAX 116
NOTE 9 OFF-BALANCE SHEET COMMITMENTS 117
NOTE 10 COMPENSATION, WORKFORCE AND CICE 118

109VICAT 2013 ANNUAL REPORT
STATUTORY FINANCIAL STATEMENTS AS OF DECEMBER 31, 2013
3
3
3
3
3
3
3
2013 FINANCIAL STATEMENTS – APPENDIX
Receivables and payables denominated in foreign currencies are
recorded using the exchange rates prevailing at the date of the
transaction. At year-end, these receivables and payables are valued in
the balance sheet at exchange rates in effect at year-end.
Issue expenses for borrowings are spread over the term of the
borrowings.
Differences arising from revaluation of foreign currency receivables
and payables are reported in the balance sheet under “Translation
adjustments”. Additional provisions are made for unrealized currency
losses that do not offset.
Short-term financial investments are valued at cost or at market value
if lower.
NOTE 2 SIGNIFICANT EVENTS DURING THE PERIOD
There were no significant events in 2013.
NOTE 3 POST BALANCE SHEET EVENTS
No post balance sheet event has had a material impact on the financial statements as at December 31, 2013.
NOTE 4 SALES ANALYSIS
Net sales by activity break down as follows:
(in thousands of euros) Total
Cement 383,657
Paper 33,105
TOTAL 416,762

110 VICAT 2013 ANNUAL REPORT
3 STATUTORY FINANCIAL STATEMENTS AS OF DECEMBER 31, 2013
2013 FINANCIAL STATEMENTS – APPENDIX
W The increase in intangible assets includes the implementation of
the SAP software, part of which was brought into use on July 1, 2013.
W The amount of € 11,289 thousand under the reclassification column
corresponds to the transfer of CO2 quotas from intangible assets to
inventories at a zero value, in accordance with ANC Regulation No.
2013-03.
W The main changes in tangible assets have to do with continuing
improvements to the Mépieu quarry, costing € 12,946 thousand,
and the biomass boiler at Vizille brought into use for an amount of
€ 5,457 thousand.
(in thousands of euros)
Accumulated depreciation at
beginning of year Increase Decrease Reclassification
Accumulated depreciation
at end of year
Concessions, patents, goodwill and other intangible assets 12,532 1,947 14,479
Land and improvements 17,547 1,396 (412) 18,531
Buildings and improvements 117,018 3,815 412 121,245
Plant, machinery and equipment 403,810 14,740 5,640 7,295 420,205
Other tangible assets 13,790 575 (7,295) 7,070
TOTAL 564,697 22,473 5,640 0 581,530
5.1.1. Intangible assets
The balance of quotas allocated by the French State under the National
Quota Allocation Plan, Phase Two (Plan National d’Affectation des
Quotas, or PNAQ II) for the 2008-2012 period stands at 1,517 thousand
tons. Under the new National Allocation Schedule, the quotas allocated
for 2013 represent 2,426 thousand tons.
In accordance with ANC Regulation No. 2013-03 article 1, quotas
allocated free of charge are not recorded either as assets or liabilities. As
at December 31, 2013, the quotas were reclassified under inventories
at a zero value.
Recording of quota swaps (EUA) against Certified Emission Reductions
(CERs) is recognized in the income for the year at an amount of
€ 1,051 thousand. The income from the sale and swap of quotas came
to the same amount in 2012.
Research and development costs recorded in expenses amounted to
€ 4,876 thousand. These comprise € 3,956 thousand for internal costs
(amortization, personnel and operating costs) and € 920 thousand for
work commissioned from external organizations.
NOTE 5 ANAYLSIS OF THE FINANCIAL STATEMENTS
5.1. Non-current assets
(in thousands of euros)
Gross value at beginning
of year Acquisitions Disposals Reclassification
Gross value at end
of year
Concessions, patents, goodwill and other intangible assets 33,081 7,853 (11,289) 29,645
Land and improvements 92,363 854 61 (3,164) 89,992
Buildings and improvements 162,874 3,306 3,164 169,344
Plant, machinery and equipment 524,661 15,050 5,640 9,694 543,765
Other tangible assets 17,275 714 13 (9,694) 8,282
Tangible assets in progress 22,241 4,648 26,889
Advances and payments on account 12 1 11
TOTAL 852,507 32,425 5,715 (11,289) 867,928

111VICAT 2013 ANNUAL REPORT
STATUTORY FINANCIAL STATEMENTS AS OF DECEMBER 31, 2013
3
3
3
3
3
3
3
2013 FINANCIAL STATEMENTS – APPENDIX
5.2.2. Change in shareholders’ equity
(in thousands of euros) 2013 2012
Shareholders’ equity at the beginning of year 1,297,804 1,188,044
Shareholders’ equity at the end of year 1,451,421 1,297,804
Change 153,617 109,760
Analysis of changes
Income for the year 224,462 173,726
Dividends paid(1) (66,014) (66,038)
Revaluation adjustments (1) (5)
Regulated provisions (4,830) 2,077
TOTAL 153,617 109,760
(1) Less dividends on treasury shares.
5.1.2. Tangible assets
Tangible assets in progress are mainly comprised of industrial installations
in the construction phase.
Property, plant and equipment are depreciated as follows:
W construction and civil engineering of industrial installations:
15 to 30 years;
W industrial installations: 5 to 15 years;
W vehicles: 5 to 8 years;
W sundry equipment: 5 years;
W computer equipment: 3 years.
5.1.3. Financial investments:
Financial investments decreased by € 10,923 thousand, mainly as a
result of:
W changes in other financial investments: (1,054)
W changes in the loan granted to the subsidiary Vigier 1,311
W the reclassification of treasury shares under current assets (11,180)
(10,923)
Under the liquidity agreement with Natixis, the following amounts were
recognized in the liquidity account at year-end:
W 22,115 treasury shares representing a net value of € 1,163 thousand;
W € 2,687 thousand in cash.
Under this contract, 240,762 shares were purchased during the year
for € 11,968 thousand and 270,302 shares sold for € 13,006 thousand.
At December 31, 2012, financial investments included 813,167 treasury
shares. On February 24, 2013, the Board of Directors decided to transfer
130,000 shares to “short-term financial investments” (own shares)
with a view to awarding them to employees under profit-sharing and
shareholding schemes.
Loans and other long-term investments amounted to € 117.068 thousand
and have a term of more than one year.
5.2. Shareholders’ equity
5.2.1. Share capital
Share capital amounts to € 179,600,000 and is divided into
44,900,000 shares of € 4 each, held by:
W Employees 4.45 %;
of whom are employee shareholders*: 2.04 %;
W Family, Parfininco and Soparfi 60.56 %;
W Vicat 1.88 %.
* As per article L. 225-102 of the Code de commerce (the French
Commercial Code).

112 VICAT 2013 ANNUAL REPORT
3 STATUTORY FINANCIAL STATEMENTS AS OF DECEMBER 31, 2013
2013 FINANCIAL STATEMENTS – APPENDIX
Provisions amounted to € 24 million and covered:
W the forecast costs under the French quarry reinstatement obligation
of € 4.3 million. These provisions are made for each of the quarries
based on tonnages extracted in relation to the potential deposit
and the estimated cost of the work to be performed at the end of
operations;
W other provisions for expenses which include a provision of
€ 16,1 million for tax to be repaid to subsidiaries under the Group
tax sharing agreement.
5.4. Debts
During 2013, medium and long-term debt and other bank borrowings
decreased by € 22,958 thousand.
5.2.3. Regulated provisions
(in thousands of euros)
Amount at the beginning
of yearAllocation during
the year Reversals
Amount at the end
of the year
Price increase provision 11,104 897 1,692 10,309
Special tax depreciation 91,013 6,251 7,561 89,703
Special revaluation provision 2,380 - 14 2,366
Investment provision 7,617 - 2,708 4,909
TOTAL 112,114 7,148 11,975 107,287
Maturities are as follows:
(in thousands of euros) AmountRecovered at
1 year maximum
Recovered after more than 1 year
Price increase provision 10,309 2,548 7,761
Special tax depreciation 89,703 - 89,703
Special revaluation provision 2,366 - 2,366
Investment provision 4,909 2,270 2,639
TOTAL 107,287 4,818 102,469
5.3. Provisions
(in thousands of euros)
Amount at the beginning
of year
Allocation during
the yearDecrease (with use)
Decrease (unused
provision)
Amount at the end
of the year
Provisions for quarry reinstatement 4,347 360 366 - 4,341
Provisions for disputes 149 775 92 - 832
Other provisions for expenses 16,518 2,078 37 - 18,559
TOTAL 21,014 3,213 495 - 23,732

113VICAT 2013 ANNUAL REPORT
STATUTORY FINANCIAL STATEMENTS AS OF DECEMBER 31, 2013
3
3
3
3
3
3
3
2013 FINANCIAL STATEMENTS – APPENDIX
5.4.1. Statement of maturities
(in thousands of euros) Gross amount 1 year or less 1 - 5 yearsMore than
5 years
Bank borrowings and financial liabilities(1) 915,172 0 651,067 264,105
Miscellaneous borrowings and financial liabilities 3,644 3,420 - 224
Short-term bank borrowings and bank overdrafts 9,541 9,541 - -
(1) Including commercial paper 290,000 290,000
5.4.2. Other disclosures
At December 31, 2013 the Company had € 321 million in unused
confirmed lines of credit that have not been allocated to the hedging of
liquidity risk on commercial paper (€ 396 million at December 31, 2012).
The Company also has a program for issuing commercial paper
amounting to € 300 million. At December 31, 2013, the amount of
commercial paper issued stood at € 290 million. Commercial paper
consists of short-term debt instruments backed by confirmed lines of
credit in the amounts issued and classified as medium-term borrowings
in the consolidated balance sheet.
The medium and long-term loan agreements contain specific covenants,
especially as regards compliance with financial ratios. The existence of
these covenants does not represent a risk to the company’s financial
position.
5.4.3. Risk hedging
Foreign exchange riskThe principal and interest due on a borrowing originally issued by the
Group in US Dollars were converted to Euros through a series of cross
currency swaps.
Interest rate riskThe floating rate debt is hedged through the use of financial instruments
(caps and swaps) on original maturities of 5 to 12 years amounting to
€ 320 million at December 31, 2013.
Liquidity riskUnused confirmed lines of credit are used to cover the risk of the Group
finding itself unable to issue its commercial paper through market
transactions. As at December 31, 2013 these lines matched the short
term notes they covered at € 290 million.
5.4.4. Financial instruments
As at December 31, 2013, unsettled derivative instruments were as follows:
Type(in thousands of currency units)
Nominal value(currency)
Nominal value(in euros)
Fair value(in euros)
CHF forward sales CHF 35,000 28,511 + 17(1)
USD forward sales USD 178,000 129,070 (9)(2)
Floating/fixed interest rate swaps EUR 150,000 150,000 (4,283)
Interest rate caps EUR 170,000 170,000 (407)
Cross Currency Swap USD 570,000 413,314 (46,334)(3)
(1) In parallel debt rose by € 53 thousand.(2) In parallel borrowing decreased by € 1,041 thousand.(3) In parallel debt decreased by € 30,117 thousand.
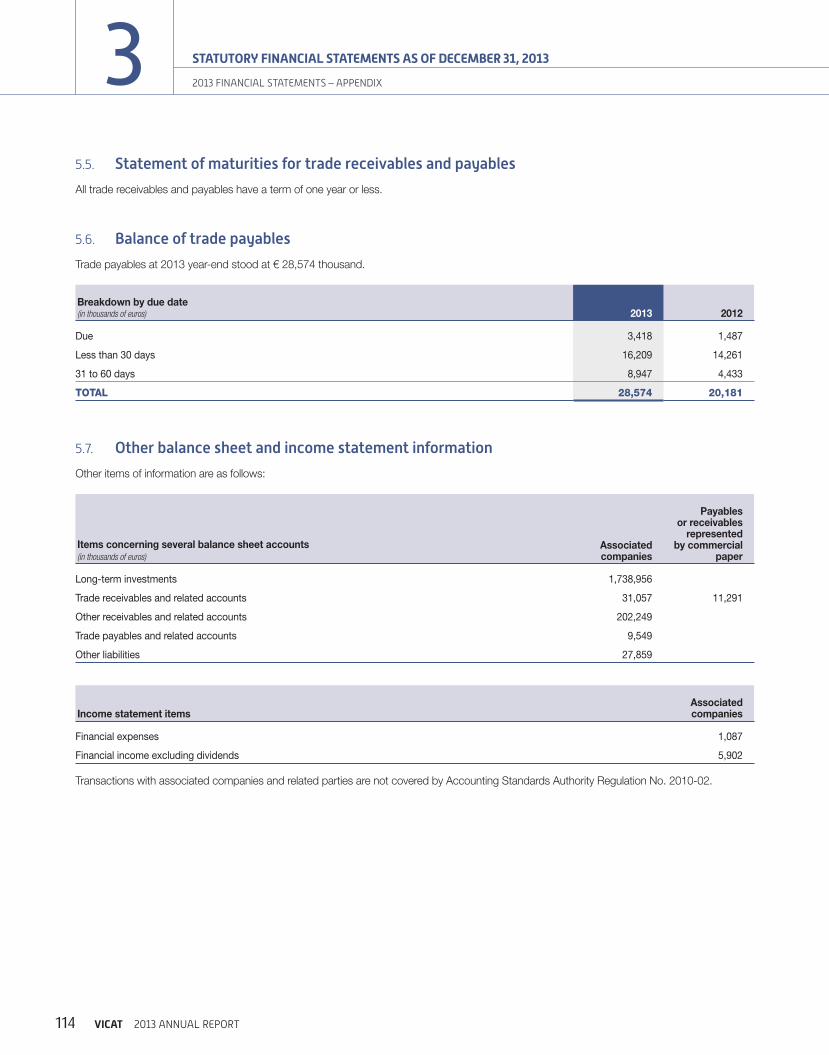
114 VICAT 2013 ANNUAL REPORT
3 STATUTORY FINANCIAL STATEMENTS AS OF DECEMBER 31, 2013
2013 FINANCIAL STATEMENTS – APPENDIX
5.5. Statement of maturities for trade receivables and payables
All trade receivables and payables have a term of one year or less.
5.6. Balance of trade payables
Trade payables at 2013 year-end stood at € 28,574 thousand.
Breakdown by due date (in thousands of euros) 2013 2012
Due 3,418 1,487
Less than 30 days 16,209 14,261
31 to 60 days 8,947 4,433
TOTAL 28,574 20,181
5.7. Other balance sheet and income statement information
Other items of information are as follows:
Items concerning several balance sheet accounts(in thousands of euros)
Associated companies
Payables or receivables
represented by commercial
paper
Long-term investments 1,738,956
Trade receivables and related accounts 31,057 11,291
Other receivables and related accounts 202,249
Trade payables and related accounts 9,549
Other liabilities 27,859
Income statement itemsAssociated companies
Financial expenses 1,087
Financial income excluding dividends 5,902
Transactions with associated companies and related parties are not covered by Accounting Standards Authority Regulation No. 2010-02.

115VICAT 2013 ANNUAL REPORT
STATUTORY FINANCIAL STATEMENTS AS OF DECEMBER 31, 2013
3
3
3
3
3
3
3
2013 FINANCIAL STATEMENTS – APPENDIX
Accrued liabilities(in thousands of euros) Amount
Bank loans and borrowings 3,335
Trade payables and related accounts 18,335
Tax and employee-related payables 16,224
Other liabilities 506
TOTAL 38,400
Accrued expenses(in thousands of euros) Amount
Operating expenses 1,868
Financial expenses 184
TOTAL 2,052
Short-term financial investments
Short-term financial investments break down as follows: 140,744
treasury shares at a net value of € 7,441 thousand acquired for the
purpose of share allotment to employees. Their market value amounted
to € 7,600 thousand at December 31, 2013.
The distribution of shares to Group employees under the profit-sharing
scheme resulted in an expense of € 770 thousand.
Net financial income
Net financial income included a net reversal of the provisions for
depreciation of treasury shares amounting to € 6,490 thousand
(compared with a reversal of € 5,265 thousand in 2012).
NOTE 6 BREAKDOWN OF CORPORATE INCOME TAX AND ADDITIONAL TAXES
Headings(in thousands of euros)
Profit (loss) before tax
Corporate income tax
Social security
contributionsExceptional
contributionsProfit (loss)
after tax
Current profit (loss) 246,087 (18,682) (805) (3,545) 223,055
Net non-operating income (expense) (and profit-sharing) (290) 1,404 54 239 (1,407)
Book profit (loss) 245,797 (17,278) (751) (3,306) 224,462

116 VICAT 2013 ANNUAL REPORT
3 STATUTORY FINANCIAL STATEMENTS AS OF DECEMBER 31, 2013
2013 FINANCIAL STATEMENTS – APPENDIX
Vicat has opted for a tax sharing regime with it as the parent company.
This option relates to 20 companies. Under the terms of the tax sharing
agreement, the subsidiaries bear a tax charge equivalent to that which
they would have borne if there had been no tax sharing. The tax saving
resulting from the tax sharing agreement is awarded to the parent
company, notwithstanding the tax due to the tax loss subsidiaries, for
which a provision is established. For 2013, this saving amounted to
€ 3,331 thousand.
The expenses covered by articles 223 quater and 39.4 of the French
General Tax Code (CGI) amounted to € 137 thousand for 2013.
Headings(in thousands of euros) Amount
Tax due on:
Price increases provisions 3,917
Special tax depreciation 34,087
Total increases 38,004
Tax paid in advance on temporarily non-deductible expenses 1,884
of which profit-sharing expenses: 1,249
Total reductions 1,884
Net deferred tax 36,120
NOTE 8 DEFERRED TAX
NOTE 7 IMPACT OF THE SPECIAL TAX EVALUATIONS
Headings(in thousands of euros) Allocations- Reversals Amounts
Income for the year 224,462
Income taxes 17,278
Exceptional contributions 3,306
Social security contributions 751
Profit (loss) before tax 245,797
Change in special tax depreciation of assets 6,251 (7,561) (1,310)
Change in investment provision - (2,708) (2,708)
Change in special revaluation provision - (14) (14)
Change in the price increase provision 897 (1,692) (795)
SUBTOTAL 7,148 (11,975) (4,827)
Income excluding special tax evaluations (before income tax) 240,970

117VICAT 2013 ANNUAL REPORT
STATUTORY FINANCIAL STATEMENTS AS OF DECEMBER 31, 2013
3
3
3
3
3
3
3
2013 FINANCIAL STATEMENTS – APPENDIX
Retirement indemnities are accrued in accordance with the terms of
in the collective labor agreements. The corresponding liabilities are
calculated using the projected unit credit method, which includes
assumptions on employee turnover, mortality and wage inflation.
Commitments are valued, including social security charges, pro-rata
to employees’ years of service.
Principal actuarial assumptions are as follows:
W discount rate: 3 %;
Wwage inflation: from 1.7 % to 3.2 %;
W inflation rate: 2 %.
NOTE 9 OFF-BALANCE SHEET COMMITMENTS
Commitments given(in thousands of euros) Amount
Pension commitments(1) 16,322
Deposits and guarantees(2) 272,542
Forward purchases of fuels 2,949
TOTAL 291,813
(1) Including an amount of € 8,217 thousand relating to the supplementary pension scheme for officers and other managers of the Company under article 39 of the French General Tax Code (CGI).
(2) Vicat has provided a guarantee to lenders on behalf of its subsidiaries Jambyl Cement Production Company LLP, Vicat Sagar Cement Private Ltd and Gulbarga for loans taken out for the construction of greenfield projects.
Commitments received(in thousands of euros) Amount
Confirmed credit lines(1) 731,000
Other commitments received
TOTAL 731,000
(1) Including € 290,000 thousand allocated to hedge the commercial paper issue program.
Vicat granted a put option to the minority shareholders of its subsidiary Mynaral Tas Company LLP. This option, exercisable by December 2013 at
the earliest, is valued at € 11,981 thousand as at December 31, 2013.

118 VICAT 2013 ANNUAL REPORT
3 STATUTORY FINANCIAL STATEMENTS AS OF DECEMBER 31, 2013
2013 FINANCIAL STATEMENTS – APPENDIX
NOTE 10 COMPENSATION, WORKFORCE AND CICE
Executive management compensation(In thousands of euros) Amount
Compensation allocated to:
- directors 275
- executive management 2,217
Workforce AverageAs at December 31,
2013
Management 203 209
Supervisors, technicians, administrative employees 374 376
Blue-collar staff 269 274
TOTAL COMPANY 846 859
Of which Paper Division 159 162
CICE (Crédit d’impôts pour la compétitivité et l’emploi – Competitiveness and Income Tax Credit)
In accordance with the recommendation of the Autorité des normes comptables (French Accounting Standards Authority), the CICE was booked in
the individual financial statements in a dedicated credit account (subdivision of account 64). The amount receivable recorded as at December 31,
2013 comes to € 650 thousand.
As the funds were not actually used in 2013, they could not be allocated.

119VICAT 2013 ANNUAL REPORT
STATUTORY FINANCIAL STATEMENTS AS OF DECEMBER 31, 2013
3
3
3
3
3
3
3
SUBSIDIARIES AND AFFILIATES
SUBSIDIARIES AND AFFILIATES
Company or groups of companies2013 financial year Capital
Reserves and retained
earnings before
appropriation of income
Ownership interests
(%)
Book value of shares owned
Loans & advances
granted by the
company and not
yet repaid
Guarantees granted
by the company
Salesex. VAT for the
financial year
ended
Profit or loss
(-) for the financial
year ended
Dividends received by Vicat
during the year Observationsgross net
Subsidiaries and affiliates whose gross value exceeds 1 % of Vicat’s capital
1) Subsidiaries(at least 50 % of the capital held by the company)
Béton Travaux92095 Paris La Défense
27,997 193,010 99.97 88,869 88,869 60,229 18,662 12,227 13,120
National Cement CompanyLos Angeles Usa
280,521(1) 68,732(1) 97.85 229,581 229,581 73,823 293,768(1) (20,269)(1)
Parficim92095 Paris La Défense
67,728 1,398,256 99.99 1,343,624 1,343,624 23,567 140,115 173,554
SATMA38081 L’isle D’abeau Cedex
3,841 6,174 100.00 7,613 7,613 20,521 731
Cap Vracs13270 Fos Sur Mer
16,540 4,086 100.00 43,004 43,004 12,916 12,595 (1,651)
2) Affiliates(10 to 50 % of the capital held by the company)
Societe Des Ciments D’abidjanCôte d’Ivoire
2,000,000(2) 22,690,091(2) 17.14 1,596 1,596 63,725,140(2) 5,339,462(2) 698 Figures for 2012
SATM38081 L’isle D’abeau
1,600 23,920 22.00 15,765 15,765 90,836 4,386 2,552
Other subsidiaries and affiliates
French subsidiaries (total)
9,746 9,682 1,919 816
Foreign subsidiaries (total)
2,687 2,687
TOTAL 1,742,485 1,742,421 172,454 190,740
(1) Figures shown in USD.(2) Figures shown in CFA Francs.

120 VICAT 2013 ANNUAL REPORT
3 STATUTORY FINANCIAL STATEMENTS AS OF DECEMBER 31, 2013
ANALYSIS OF INCOME FOR THE YEAR
ANALYSIS OF INCOME FOR THE YEAR
Net operating income amounted to: 246,088,537
Less:
W other exceptional net income and expense 2,994,765
W employee profit-sharing (3,286,753)
W tax on income (21,334,798)
Net income for 2013 amounted to: 224,461,751
Proposed distribution of income
We propose that the income to be distributed be as follows:
INCOME FOR 2013 224,461,751
Retained earnings carried forward 201,333,800
TOTAL TO BE DISTRIBUTED 425,795,551
We propose the following Income distribution:
W dividend of €1.50 per share of nominal value €4 67,350,000
W statutory reserve account
W allocation to other reserve accounts 153,445,551
Retained earnings 205,000,000
Distribution over the last three years (on a comparable basis)
Year 2010 2011 2012
Dividend distributed 1.50 1.50 1.50
NB: The dividend amounts quoted take into account all existing shares.
When payment is made, the dividends on treasury shares will be allocated to the “Retained earnings” account.
Distributed dividends are eligible for a 40 % tax allowance under the conditions laid out in article 158-3 of the French General Tax Code.

121VICAT 2013 ANNUAL REPORT
STATUTORY FINANCIAL STATEMENTS AS OF DECEMBER 31, 2013
3
3
3
3
3
3
3
FINANCIAL INCOME FOR THE LAST FIVE FINANCIAL YEARS
FINANCIAL INCOME FOR THE LAST FIVE FINANCIAL YEARS
(articles L. 225-81, L. 225-83 and L. 225-102 of the Commercial Code)
(in euros) 2009 2010 2011 2012 2013
1) Financial position at year end
Share capital 179,600,000 179,600,000 179,600,000 179,600,000 179,600,000
Number of shares issued 44,900,000 44,900,000 44,900,000 44,900,000 44,900,000
2) Total comprehensive income from actual operations
Sales before tax 448,708,588 444,001,111 484,696,600 443,118,535 416,761,872
Profit before tax, profit-sharing, amortization and provisions 186,205,363 175,735,104 211,190,319 217,389,930 261,894,956
Tax on profits 28,903,959 20,414,515 15,286,066 15,269,019 21,334,798
Employee profit share due in respect of the financial year 4,849,805 3,982,186 4,029,869 4,905,765 3,286,753
Profit after tax, amortization and provisions 124,861,843 118,026,898 152,356,641 173,726,016 224,461,751
Amount of profit distributed 67,350,000 67,350,000 67,350,000 67,350,000 67,350,000
3) Income from operations per share
Profit after tax and profit-sharing, but before amortization and provisions (based on a comparable number of shares) 3.40 3.37 4.27 4.39 5.36
Profit after tax, profit-sharing, amortization and provisions (based on a comparable number of shares) 2.78 2.63 3.39 3.87 5.00
Dividend paid for each share 1.50 1.50 1.50 1.50 1.50
4) Employees
Number of employees 848 859 862 851 859
Total wage bill (1) 40,694,345 41,518,392 43,128,593 42,541,898 43,763,690
Total amount paid in social security and other contributions(social security, charitable works, etc.) 19,044,121 19,872,426 20,442,672 20,435,968 19,496,940
(1) Excluding pre-retirement payments on termination of employment.

122 VICAT 2013 ANNUAL REPORT
3 STATUTORY FINANCIAL STATEMENTS AS OF DECEMBER 31, 2013
STATUTORY AUDITORS’ REPORT ON THE FINANCIAL STATEMENTS
STATUTORY AUDITORS’ REPORT ON THE FINANCIAL STATEMENTS
This is a free translation into English of the statutory auditors’ report on the financial statements issued in the French language and is provided
solely for the convenience of English-speaking users. The statutory auditors’ report includes information specifically required by French law in such
reports, whether modified or not. This information is presented below the opinion on the financial statements and includes an explanatory paragraph
discussing the auditors’ assessments of certain significant accounting and auditing matters. These assessments were considered for the purpose
of issuing an audit opinion on the financial statements taken as a whole and not to provide separate assurance on individual account balances,
transactions, or disclosures.
This report also includes information relating to the specific verification of information given in the management report and in the documents addressed
to shareholders.
This report should be read in conjunction with, and construed in accordance with, French law and professional auditing standards applicable in France.
Year ended 31 December 2013
To the Shareholders,
In compliance with the assignment entrusted to us by the shareholders in General Meeting, we hereby report to you, for the year ended 31 December
2013, on:
W the audit of the accompanying financial statements of Vicat S.A.;
W the justification of our assessments;
W the specific verifications and information required by law.
These financial statements have been approved by the Board of Directors. Our role is to express an opinion on these financial statements based
on our audit.
I - Opinion on the financial statements
We conducted our audit in accordance with professional standards applicable in France; those standards require that we plan and perform the audit
to obtain reasonable assurance about whether the financial statements are free of material misstatement. An audit involves performing procedures,
using sampling techniques or other methods of selection, to obtain audit evidence about the amounts and disclosures in the financial statements.
An audit also includes evaluating the appropriateness of accounting policies used and the reasonableness of accounting estimates made, as well
as the overall presentation of the financial statements. We believe that the audit evidence we have obtained is sufficient and appropriate to provide
a basis for our audit opinion.
In our opinion, the financial statements give a true and fair view of the assets and liabilities and of the financial position of the Company as at
31 December 2013 and of the results of its operations for the year then ended in accordance with French accounting principles.
Without qualifying the conclusion expressed above, we draw your attention to the mention in the notes 1 and 5.1.1 to the financial statements which
sets out the impact of change in accounting treatment concerning greenhouse gas emission quotas following the application of regulation ANC No.
2012-03 dated 4 October 2012.

123VICAT 2013 ANNUAL REPORT
STATUTORY FINANCIAL STATEMENTS AS OF DECEMBER 31, 2013
3
3
3
3
3
3
3
STATUTORY AUDITORS’ REPORT ON THE FINANCIAL STATEMENTS
II - Justification of our assessments
In accordance with the requirements of article L.823-9 of the French Commercial Code relating to the justification of our assessments, we bring to
your attention the following matters:
The note « Accounting rules and methods » discloses significant accounting rules and methods applied in the preparation of the financial statements,
and particularly relating to the assessment made by your Company on the intangibles and financial assets at the year ended 31 December 2013.
As part of our assessment of the accounting rules and principles applied by your company, we have assessed the appropriateness of the above-
mentioned accounting methods and related disclosures.
Your Company has recorded provisions for costs of quarry reinstatement and repayment of income tax to subsidiaries in according to the group tax
agreement as disclosed in the note 5.3 to the statutory financial statements. We have made our assessment on the related approach determined by
your Company, as disclosed in the financial statements, based on information available as of today, and performed appropriate testing to confirm,
based on a sample, that these methods were correctly applied. As part of our assessment, we have assessed the reasonableness of the above-
mentioned accounting estimates made by your Company.
These assessments were made as part of our audit of the financial statements, taken as a whole, and therefore contributed to the opinion we formed
which is expressed in the first part of this report.
III - Specific verifications and information
We have also performed, in accordance with professional standards applicable in France, the specific verifications required by French law.
We have no matters to report as to the fair presentation and the consistency with the financial statements of the information given in the management
report of the Board of Directors, and in the documents addressed to shareholders with respect to the financial position and the financial statements.
Concerning the information given in accordance with the requirements of article L.225-102-1 of the French Commercial Code relating to remunerations
and benefits received by the directors and any other commitments made in their favour, we have verified its consistency with the financial statements
or with the underlying information used to prepare these financial statements and, where applicable, with the information obtained by your Company
from companies controlling your Company or controlled by it. Based on this work, we attest the accuracy and fair presentation of this information.
In accordance with French law, we have verified that the required information concerning the identity of the shareholders has been properly disclosed
in the management report.
The statutory auditors
Paris La Défense, 7 March 2014 Chamalières, 7 March 2014
KPMG Audit Wolff & Associés S.A.S.
Département de KPMG S.A.
Bertrand Desbarrières Patrick Wolff
Partner Partner

124 VICAT 2013 ANNUAL REPORT
3 STATUTORY FINANCIAL STATEMENTS AS OF DECEMBER 31, 2013
STATUTORY AUDITORS’ REPORT ON REGULATED AGREEMENT AND COMMITMENTS
STATUTORY AUDITORS’ REPORT ON REGULATED AGREEMENT AND COMMITMENTS
Year ended 31 December 2013
To the Shareholders,
In our capacity as statutory auditors of your Company, we hereby report to you on the regulated agreements and commitments.
We are required to inform you, on the basis of the information provided to us, of the principal terms and conditions of the agreements and commitments
of which we were notified or which we have identified during our audit work. It is not our role to determine whether they are beneficial or appropriate or
to ascertain whether other agreements or commitments exist. It is your responsibility, under the terms of Article R.225-31 of the French Commercial
Code, to evaluate the benefits arising from these agreements and commitments prior to their approval.
In addition, it is our responsibility, if applicable, to inform you of the information specified in Article R. 225-31 of the French Commercial Code relating
to the performance during the past year of agreements and commitments already approved by the General Meeting.
We have performed the procedures we considered necessary in accordance with the professional code of practice of the National Society of
Statutory Auditors, in relation to this work. Our work consisted in verifying that the information provided to us is in agreement with the underlying
documentation from which it was extracted.
Agreements and commitments submitted to the approval by the General Meeting
We inform you that we have not been advised of any agreements or commitments authorized in 2013 to be submitted to the General Meeting for
approval as mentioned in Article L.225-38 of the French Commercial Code.
Agreements and commitments already approved by the General Meeting
In accordance with Article R.225-30 of the French Commercial Code, we have been informed of the following agreement and commitment, which
were initially approved in previous years, have been, continued in 2013:
Commitments relating to supplementary pension plans:
Purpose: Supplementary pension plan as defined in Article 39 of the French General Tax Code.
Terms and conditions: The related obligations with Cardiff concern the executive directors as well as managers whose salary exceeds 4 times the
ceiling of the level A of the social security.
The statutory auditors
Paris La Défense, 7 March 2014 Chamalières, 7 March 2014
KPMG Audit Wolff & Associés S.A.S.
Département de KPMG S.A.
Bertrand Desbarrières Patrick Wolff
Partner Partner

125VICAT 2013 ANNUAL REPORT
4ENVIRONMENTAL AND SOCIAL RESPONSIBILITY
4.1. BEING A RESPONSIBLE EMPLOYER 126
4.2. TAKING AN ACTIVE ROLE IN THE ECONOMIC AND SOCIAL DEVELOPMENT OF THE COUNTRIES IN WHICH WE OPERATE 135
4.3. BEING A PROPONENT OF STRATEGIES FOR SUSTAINABLE CONSTRUCTION 137
4.4. CROSS-REFERENCE TABLE OF WORKFORCE-RELATED, ENVIRONMENTAL AND SOCIAL INFORMATION 144
4.5. REPORT BY AN INDEPENDENT THIRD PARTY ON THE CONSOLIDATED SOCIAL, ENVIRONMENTAL AND SOCIETAL DATA 147

126 VICAT 2013 ANNUAL REPORT
4 ENVIRONMENTAL AND SOCIAL RESPONSIBILITY
4.1 BEING A RESPONSIBLE EMPLOYER
The Vicat Group has opted to present all of the workforce-related,
social and environmental information required by article 225 of France’s
Grenelle II law in its management Commentary.
In 2013, the Vicat Group created its own corporate social responsibility
(CSR) reference framework to guide all of its subsidiaries in improving
and evaluating their CSR performance on the basis of indicators relevant
for the business activities pursued (Cement/Concrete & Aggregates/
Activities, Products & Services). The CSR reporting procedure was
also reinforced during the year, through the establishment of a CSR
Coordination unit at Group level.
In order to facilitate access to the mandatory quantitative and qualitative
disclosures, a table of correspondence is included below.
An attestation of presentation relating to this information as well as
an opinion on its fairness have been provided by Grant Thornton, an
independent third party organization engaged to verify such information
included in section 4.5 below.
The Vicat Group has included in its overall strategy the significant
potential risks to its industrial operations generated by global warming
and the possible exhaustion of fossil fuel energy sources. This strategy,
known as “sustainable construction”, enables it to respond to such risks,
while at the same time supporting the development of its markets. It
also includes the social and societal commitments which the Group has
been developing for a number of years.
4.1. BEING A RESPONSIBLE EMPLOYER
4.1.1. HEALTH, SAFETY AND ACCIDENT PREVENTION
4.1.1.1. Safety indicators
Although the Vicat Group’s performance in this area in 2012 had seen continuous progress since 2006, safety indicators showed some deterioration
in 2013. However, the underlying trend remains positive. The Vicat Group’s continuous improvement in this area is ensured by General Management’s
strong mobilization around the related issues as well as the tireless efforts of all managers and their teams to promote safety.
For the Group employees 2013 2012 Variation
Number of lost-time accidents 214 190 + 12 %
Number of fatal accidents 2 1 + 100 %
Number of days lost 7,060 6,229 + 12 %
Frequency rate 14.8 13.3 + 11 %
Severity rate 0.48 0.44 + 9 %
The adverse development of these indicators in 2013 resulted in the launch of a multi-year action plan within the Vicat Group in 2014, led by General
Management, managers and employees. The linchpin of this new plan is its zero-accident goal.
For the Group employees
Cement Group
2013 2012 Variation (%)
Number of lost-time accidents 50 40 + 25 %
Number of fatal accidents 1 0 -
Frequency rate 8.9 6.5 + 37 %
Severity rate 0.24 0.25 - 4 %

127VICAT 2013 ANNUAL REPORT
ENVIRONMENTAL AND SOCIAL RESPONSIBILITY
4
4
4
4
4
4
4
4
4.1 BEING A RESPONSIBLE EMPLOYER
For the Group employees
Concrete & Aggregates, OPS (Group figures)
2013 2012 Variation (%)
Number of lost-time accidents 164 149 + 10 %
Number of fatal accidents 1 1 -
Frequency rate 18.5 18.3 + 1 %
Severity rate 0.65 0.58 + 12 %
4.1.1.2. Health and safety conditions at work
Ensuring health and safety and preventing accidents at work are two
of the Vicat Group’s guiding objectives. The related commitments
and workplace rules are set out in the Group’s safety charter, which is
communicated to all employees.
Implemented and supported by the Group’s Safety Department, this
policy is rolled out to all sites by managers, whose involvement and
prevention efforts are essential.
Considerable emphasis is placed on training and raising awareness
among all staff. By way of example, all new Vicat Group managers must
complete the Group’s “Prevention and Safety” training module as part
of their orientation process.
In 2013, several communication and awareness campaigns were
launched (working at height, road safety, etc.) Materials of varying types
are used: videos, posters in the workplace, distribution of date books
and calendars featuring related messages.
Once again in 2013, the Group organized a number of special “safety
days”. Their aim is to encourage all staff to recognize the importance
of this essential Vicat Group priority, and to raise awareness among all
teams at the Group’s sites and unify them around this common goal.
The Group disseminates a standard accident management procedure
(SECU 004) which requires that an in-depth investigation be carried
out after each accident, whether it involves Group employees,
temporary staff, or external contractors. The aim is to identify causes
and take appropriate corrective action immediately. All findings from
the investigation are then shared across the Group to prevent the
reoccurrence of a similar event.
Among other preventive measures, production and construction sites
are regularly audited by the Group’s safety specialists and trained
operational staff. These individuals work to identify potential risks and
any areas in need of improvement. They also analyze any specific
problems or functional shortcomings and develop appropriate solutions.
Year after year, more Group entities are auditing each other with a focus
on health and safety, thus sharing their experiences and best practices
while leveraging expertise across different business lines.
The implementation of the Group’s safety standards continued in
2013. These standards set out the Group’s expectations in terms of
safety for all business activities and refer to the regulatory basis for the
requirements involved.
New standards will be added in 2014, relating in particular to the use
of vehicles and motorized equipment, thus allowing for greater sharing
of best practices and safety improvements at sites.
The Group monitors compliance with basic safety guidelines, including
the wearing of personal protective equipment (hearing and respiratory
protection, etc.). This equipment is made available to all employees,
who are always trained in its proper use.
All facilities designed in recent years meet exacting requirements in
terms of safety. The opinions of experts are sought in every case, and
these individuals work closely with the safety engineers representing
the Group’s insurers, in particular.
In 2013, efforts undertaken in recent years to address psychosocial
risks, and especially stress, were expanded in scope and new measures
were introduced.
In response to the highly unsatisfactory safety results recorded in 2012
for the Precast Concrete business in Switzerland (exposed to specific
risks), an action plan was implemented in 2013 by its managers,
supported by the Group’s Safety Department. The initial results have
been significant: the frequency rate was reduced from 45.8 in 2012
to 25.1 in 2013 and the severity rate fell from 1.11 in 2012 to 0.60 in
2013. This corresponds to an improvement greater than 50 % for both
of these indicators between 2012 and 2013.
At all its sites throughout all regions of the world, the Group attaches
importance to hygienic and healthy working and living conditions.
All personnel working at the Group’s sites thus have access to drinking
water and to sanitary facilities that are consistent with requirements and
properly maintained.
Through its commitment to the health and well-being of all its employees,
the Vicat Group is building the future.
4.1.1.3. Agreements signed with trade union organizations in relation to health and safety at work
The Group works with all staff, and in particular with employee
representatives, to improve accident prevention and safety at its
sites and safeguard the health and well-being of its employees on a
permanent basis. The agreements signed bear witness to the shared
willingness and commitment of General Management, employee
representatives and trade unions to this issue.
In France, for the Cement and Paper businesses, the actions outlined
in the agreement signed in April 2012 on reducing exposure to health
risks at work were implemented in 2013. These measures have been
successful at reducing the exposure of individual employees to multiple
risk factors, by entirely eliminating the highest exposures (exposure to
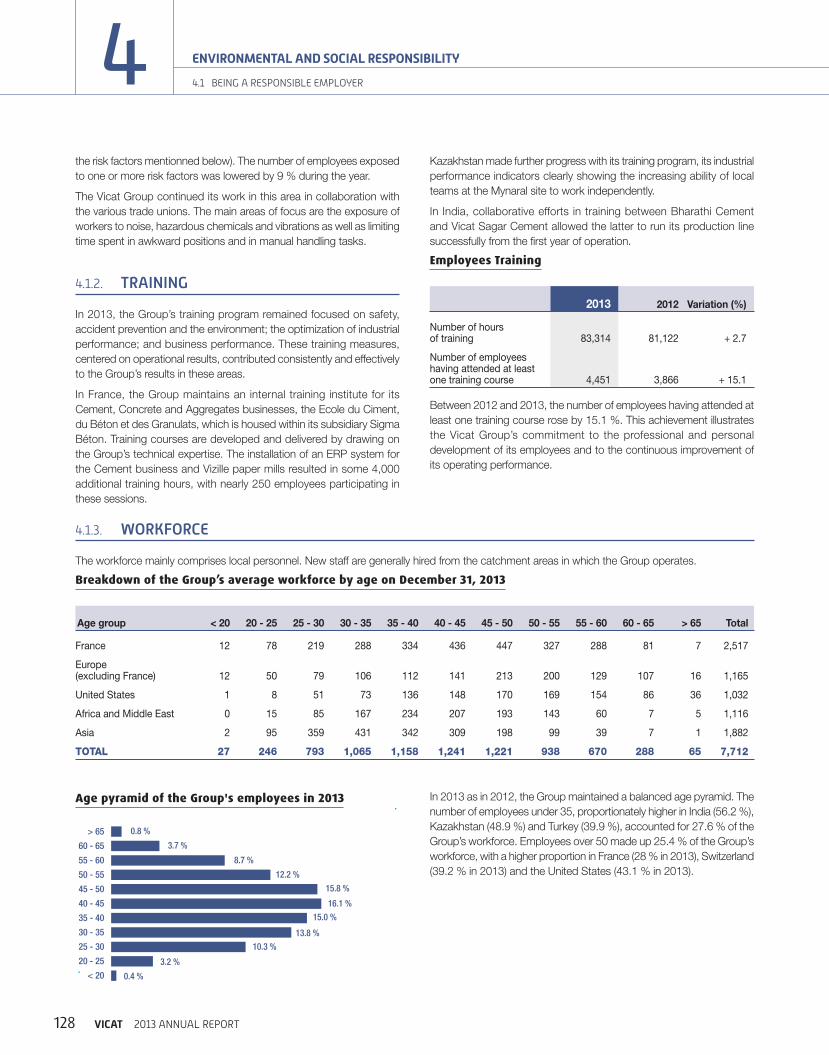
128 VICAT 2013 ANNUAL REPORT
4 ENVIRONMENTAL AND SOCIAL RESPONSIBILITY
4.1 BEING A RESPONSIBLE EMPLOYER
the risk factors mentionned below). The number of employees exposed
to one or more risk factors was lowered by 9 % during the year.
The Vicat Group continued its work in this area in collaboration with
the various trade unions. The main areas of focus are the exposure of
workers to noise, hazardous chemicals and vibrations as well as limiting
time spent in awkward positions and in manual handling tasks.
4.1.2. TRAINING
In 2013, the Group’s training program remained focused on safety,
accident prevention and the environment; the optimization of industrial
performance; and business performance. These training measures,
centered on operational results, contributed consistently and effectively
to the Group’s results in these areas.
In France, the Group maintains an internal training institute for its
Cement, Concrete and Aggregates businesses, the Ecole du Ciment,
du Béton et des Granulats, which is housed within its subsidiary Sigma
Béton. Training courses are developed and delivered by drawing on
the Group’s technical expertise. The installation of an ERP system for
the Cement business and Vizille paper mills resulted in some 4,000
additional training hours, with nearly 250 employees participating in
these sessions.
Kazakhstan made further progress with its training program, its industrial
performance indicators clearly showing the increasing ability of local
teams at the Mynaral site to work independently.
In India, collaborative efforts in training between Bharathi Cement
and Vicat Sagar Cement allowed the latter to run its production line
successfully from the first year of operation.
Employees Training
2013 2012 Variation (%)
Number of hours of training 83,314 81,122 + 2.7
Number of employees having attended at least one training course 4,451 3,866 + 15.1
Between 2012 and 2013, the number of employees having attended at
least one training course rose by 15.1 %. This achievement illustrates
the Vicat Group’s commitment to the professional and personal
development of its employees and to the continuous improvement of
its operating performance.
Age pyramid of the Group's employees in 2013
0.8 %
3.7 %
8.7 %
12.2 %
15.8 %
> 65
60 - 65
55 - 60
50 - 55
45 - 50
40 - 45
35 - 40
30 - 35
25 - 30
20 - 25
< 20
16.1 %
15.0 %
13.8 %
10.3 %
3.2 %
0.4 %
In 2013 as in 2012, the Group maintained a balanced age pyramid. The
number of employees under 35, proportionately higher in India (56.2 %),
Kazakhstan (48.9 %) and Turkey (39.9 %), accounted for 27.6 % of the
Group’s workforce. Employees over 50 made up 25.4 % of the Group’s
workforce, with a higher proportion in France (28 % in 2013), Switzerland
(39.2 % in 2013) and the United States (43.1 % in 2013).
4.1.3. WORKFORCE
The workforce mainly comprises local personnel. New staff are generally hired from the catchment areas in which the Group operates.
Breakdown of the Group’s average workforce by age on December 31, 2013
Age group < 20 20 - 25 25 - 30 30 - 35 35 - 40 40 - 45 45 - 50 50 - 55 55 - 60 60 - 65 > 65 Total
France 12 78 219 288 334 436 447 327 288 81 7 2,517
Europe (excluding France) 12 50 79 106 112 141 213 200 129 107 16 1,165
United States 1 8 51 73 136 148 170 169 154 86 36 1,032
Africa and Middle East 0 15 85 167 234 207 193 143 60 7 5 1,116
Asia 2 95 359 431 342 309 198 99 39 7 1 1,882
TOTAL 27 246 793 1,065 1,158 1,241 1,221 938 670 288 65 7,712

129VICAT 2013 ANNUAL REPORT
ENVIRONMENTAL AND SOCIAL RESPONSIBILITY
4
4
4
4
4
4
4
4
4.1 BEING A RESPONSIBLE EMPLOYER
Length of service and average age of employees within the Group
Average age Average years of service
2013 2012 2013 2012
GROUP TOTAL 42.1 41.5 9.6 9.1
of which France 42.3 42.7 12.4 12.1
There were no significant recruitment campaigns for new positions in 2013. Average length of service thus increased from 9.1 years in 2012 to 9.6
years in 2013.
The average age of employees rose from 41.5 years in 2012 to 42.1 years in 2013 due to the natural ageing of existing staff.
Breakdown of the workforce as at December 31, 2013 by category and business
(number of employees) Total
Of which
CementConcrete and
AggregatesOther Products
& Services
Executives 1,379 867 232 280
White-collar staff 2,936 1,512 933 491
Blue-collar staff 3,397 1,020 1,367 1,010
TOTAL 7,712 3,399 2,532 1,781
The breakdown of the workforce by business segment is in line with
the development of the Group’s operations, particularly in the Cement
business in India. The proportion of the workforce in the Cement
business thus increased from 43.1 % as at December 31, 2012 to
44.1 % as at December 31, 2013, while that of Concrete & Aggregates
fell from 34.0 % in 2012 to 32.8 % in 2013 due to a lower number of
employees in Turkey. Other Products & Services remained nearly stable
at 23.1 % (22.9 % in 2012).
In 2013, blue-collar staff represented 45.6 % of the total workforce,
“white-collar” staff 36.7 % and executives 17.7 %.
Breakdown of the Group’s average workforce by geographical area
(number of employees) 2013 2012 Variation
France 2,521 2,566 - 1.8 %
Europe (excluding France) 1,113 1,098 + 1.4 %
United States 1,023 996 + 2.7 %
Asia 1,881 1,732 + 8.6 %
Africa and Middle East 1,118 1,137 - 1.7 %
TOTAL 7,656 7,529 + 1.7 %

130 VICAT 2013 ANNUAL REPORT
4 ENVIRONMENTAL AND SOCIAL RESPONSIBILITY
4.1 BEING A RESPONSIBLE EMPLOYER
The 5.9 % increase in the average number of employees in the Cement
division is the result of significant new hires in India for this business
(27.3 % increase between 2012 and 2013) and the redeployment within
this business in Switzerland of nearly 60 staff from Other Products &
Services. At constant consolidation scope, the average growth rate by
business segment would be 4 % in Cement and stable in both Concrete
& Aggregates and Other Products & Services.
Breakdown of the Group's average workforce in 2013 by business (in %)
CEMENTCONCRETE AND AGGREGATESOTHER PRODUCTS & SERVICES
18 %
44 %
38 %
The Group’s workforce as at December 31, 2013 increased to 7,712
compared with 7,685 as at December 31, 2012. This 0.35 % increase
reflects the balance between recruitment of staff in India (workers for
the Vicat Sagar cement factory and the sales teams of both Vicat Sagar
and Bharathi) and the United States (recovery in business, especially for
Concrete) and staff reductions in Senegal, France and Turkey (in each
case to improve organizational effectiveness and adapt to changing
markets).
In France, the year-end workforce declined further (a 1.1 % decrease
between 2012 and 2013, versus 3.3 % between 2011 and 2012, at
constant consolidation scope). The sharpest declines between 2012
and 2013 were recorded in Concrete & Aggregates (down 2.9 %) and
Other Products & Services (down 4.8 %).
Recruitment in 2013 remained high, due mainly to recruitment for
operations in India (Bharathi and Vicat Sagar) and the United States
(Concrete business). Overall, the Group had fewer new hires in 2013
(961 staff) than in 2012 (1,058), reflecting the fact that the recruitment
campaigns linked to the commissioning of new facilities have been
completed.
Breakdown of the Group's average workforce in 2013 by geographical area (in %)
FRANCEEUROPE (EXCLUDING FRANCE) UNITED STATESASIA AFRICA AND MIDDLE EAST
33 %
15 %
14 % 13 %
25 %
The Group had an average of 7,656 employees in 2013, up from 7,529
employees in 2012, an increase of 1.7 %.
This increase reflects the Group’s growth in emerging countries.
The Turkey-Kazakhstan-India region thus saw its average number of
employees rise by 8.6 % in one year, especially due to the contribution
of India (staff increases at the Vicat Sagar plant and development of
Indian sales teams).
In the United States, the average number of employees rose by 2.7 % in
2013, mainly in the Concrete business, owing to the economic recovery.
Driven by Switzerland’s economic performance, the Group’s workforce
in this country increased by 1.4 %, mainly through the development of
the Concrete business.
In the case of the Africa and Middle East region, the 1.7 % decline
in the workforce was mainly due to staff adjustments by Senegalese
subsidiaries in the Aggregates business (3.6 % reduction between 2012
and 2013). In addition, the Cement business in Senegal reduced its
workforce by a further 2.1 % between 2012 and 2013.
In France, the average number of employees fell by 1.8 %, due to
ongoing optimization efforts focusing on the organization of the different
businesses as well as the difficult domestic economic environment.
Breakdown of the Group’s average workforce by business
(number of employees) 2013 2012 Variation
Cement 3,390 3,202 5.9 %
Concrete and Aggregates 2,917 2,925 - 0.3 %
Other Products & Services 1,349 1,402 - 3.8 %
TOTAL 7,656 7,529 1.7 %

131VICAT 2013 ANNUAL REPORT
ENVIRONMENTAL AND SOCIAL RESPONSIBILITY
4
4
4
4
4
4
4
4
4.1 BEING A RESPONSIBLE EMPLOYER
Arrivals and departures also included a significant number of jobs
associated with seasonal business, especially in France and in Turkey
in the case of drivers, and a habitually high turnover in India and
Kazakhstan. The Group’s departure rate decreased from 12.4 % in
2012 to 11.3 % in 2013, due to the continuing implementation of a
human resources policy focused on retaining staff.
Other movements resulted mainly from the replacement of natural
departures and adaptation of organizations to the economic situation
in each market.
Change in workforce at year-end by type of movement
(number of employees) Workforce
Workforce as at December 31, 2012 7,685
Natural wastage (resignation, end of contract, death) (539)
Retirement, early retirement, dismissal, other movements (397)
Changes in consolidation scope 2
Recruitment 961
WORKFORCE AS AT DECEMBER 31, 2013 7,712
Change in workforce at year-end by geographical area
(number of employees) 2013 2012 Variation
France 2,517 2,544 - 1.06 %
Switzerland and Italy 1,165 1,167 - 0.2 %
United States 1,032 1,000 + 3.2 %
Asia 1,882 1,831 + 2.8 %
Africa and Middle East 1,116 1,143 - 2.4 %
TOTAL 7,712 7,685 + 0.35 %
4.1.4. REMUNERATION
4.1.4.1. Remuneration policy
The Group’s remuneration policy is based on rewarding individual and
joint performance and securing team loyalty. It takes into account the
culture, macroeconomic conditions, employment market characteristics,
and remuneration structures specific to each country.
In France, Vicat and its French subsidiaries apply the statutory scheme
for employee profit sharing or, in some cases, operate under an
exemption. Sums received are invested in the Group savings plan (“Plan
d’Épargne Groupe”, or PEG) and in Vicat shares, as applicable.
In addition, Vicat has put in place a profit-sharing agreement. Money
paid into this arrangement can, at the employee’s discretion, be invested
in the Company’s shares under the Group Savings Plan or in other
savings plans offered by a leading financial institution.
In 2013, a Group retirement savings plan (“Plan d’Épargne Retraite
Collectif”, or PERCO) was set up by Vicat and its French subsidiaries
for their employees.
4.1.4.2. Minimum wage
In all countries where the Vicat Group operates, its companies do
not pay salaries lower than the local statutory minimum. If there is no
statutory minimum, wages paid are at least above the minimum in the
local market.
4.1.4.3. Change in personnel costs as at December 31, 2013
The Group’s personnel costs remained stable in 2013 at €366.8 million
(€366.6 million in 2012). This stability reflects the neutralization of the
negative impact of exchange rate fluctuations amounting to €8.1 million
by positive organic growth of €8.3 million. Organic growth included that
resulting from the workforce increases in India and the United States as
well as wage inflation. In 2013, the latter was due to two factors: local
currency sensitivity in emerging countries with rampant inflation and
the mechanical effect in Switzerland resulting from a high wage level.

132 VICAT 2013 ANNUAL REPORT
4 ENVIRONMENTAL AND SOCIAL RESPONSIBILITY
4.1 BEING A RESPONSIBLE EMPLOYER
(in thousands of euros) 2013 2012
Wages and salaries 266,329 262,548
Social security contributions 95,670 97,605
Employee share ownership (French companies) 4,832 6,500
PERSONNEL COSTS 366,833 366,653
4.1.5. WORK ORGANIZATION
The Vicat Group’s organization reflects its performance objectives. The
chain of command is short and the number of levels in the hierarchy
reduced to operational requirements. Management is direct and local.
Work is organized in compliance with local legislation in terms of working
and resting time as well as health and safety. The objective is to deliver
the best performance from teams at the lowest cost.
4.1.5.1. Shift working
Part of our industrial business requires shift working. The statutory
framework is systematically adhered to. In 2013, 17.5 % of the Group’s
employees were on shift work.
4.1.5.2. Part-time work
Analysis of the workforce as at December 31, 2013 by contract type/category
(number of employees) Total CementConcrete and
AggregatesOther products
& services
FULL-TIME EMPLOYEES 7,531 3,364 2,460 1,707
Executives 1,342 846 228 268
White-collar staff 2,840 1,499 895 446
Blue-collar staff 3,349 1,019 1,337 993
PART-TIME EMPLOYEES 181 35 72 74
Executives 25 9 4 12
White-collar staff 107 24 38 45
Blue-collar staff 49 2 30 17
TOTAL 7,712 3,399 2,532 1,781
Percentage of part-time employees 2.3 % 1.0 % 2.8 % 4.2 %
The Group has little need for part-time jobs. As at December 31, 2013,
the percentage of part-time employees remained stable at 2.3 % of the
workforce. As in 2012, many more part-time staff were employed in
Other Products & Services (4.1 % in 2013, 4.3 % in 2012) and Concrete
& Aggregates (2.8 % in 2013, 3.6 % in 2012) than in Cement (1.0 % in
2013, 0.8 % in 2012). Part-time staff are employed to varying degrees
in the following countries only: Switzerland (9.3 %), France (2.9 %) and
Italy (7.7 %).
4.1.5.3. Absenteeism
Absenteeism is monitored in each country in order to identify the reasons
and take appropriate action. In 2013, the Vicat Group had this situation
under control, with this indicator varying between 0.3 % and 5.7 %,
depending on the country. France had an absentee rate of 3 %.

133VICAT 2013 ANNUAL REPORT
ENVIRONMENTAL AND SOCIAL RESPONSIBILITY
4
4
4
4
4
4
4
4
4.1 BEING A RESPONSIBLE EMPLOYER
4.1.6. SOCIAL DIALOGUE
All Vicat Group companies comply with local laws relating to the
following issues: respect for freedom of association and the right to
collective bargaining; respect for the right of employees to information
and consultation.
Social dialogue works well within the various companies. Management,
which is direct, close to the workforce and always open to discussion
with staff, is a key success factor in maintaining social dialogue and a
good social atmosphere.
No significant event occurred in 2013 to endanger this dialogue or
environment, with the exception of the security situation in our Egyptian
plant in the Sinai Peninsula.
For 2013, the scope adopted for the indicator “Review of collective
bargaining agreements” is limited to France.
In all, 15 agreements were signed and 25 action plans were drawn
up. Among the most significant agreements in 2013 were that
relating to the contrat de génération (generation contract), a measure
recently introduced by the French government to promote permanent
employment of young people under the age of 26, to encourage the
retention or hiring of older employees, and to facilitate knowledge
transfers across generations within companies.
4.1.7. RESPECT FOR DIVERSITY AND EQUAL TREATMENT
4.1.7.1. Measures to promote gender equality
The low proportion of women in the salaried workforce is due in
particular to the type of activity and jobs offered by the Group.
However, gender equality remains one of the basic elements of the
Vicat Group’s human resources policy. Depending on the culture of the
country, appropriate measures are adopted to ensure equal access
to jobs and training and equal treatment in terms of remuneration and
promotion.
Such measures are employed within the limit of the constraints imposed
by our businesses. In fact, a significant proportion of jobs are not
easily accessible to female staff, owing either to working conditions
(for example the carrying of heavy loads), or to the scarcity of women
having completed the training necessary for certain jobs (in mechanical
engineering, for example).
Breakdown of the workforce as at December 31, 2013, by gender/length of service/category
(number of employees) Total
Of which
Average age
Average years of serviceExecutives
White-collar staff
Blue-collar staff
Men 6,890 1,206 2,255 3,429 40.7 9.7
Women 822 162 572 88 39.2 9.6
TOTAL 7,712 1,368 2,827 3,517 42.1 9.6
BREAKDOWN OF THE WORKFORCE AS AT DECEMBER 31, 2013, BY GENDER
WOMEN
MEN
10.7 %
89.3 %
10.4 %
89.6 %
20122013
Proportion of women as % of the workforce
2013 2012
Executives 11.8 11.9
White-collar staff 20.2 21.3
Blue-collar staff 2.5 2.5
Total Group 10.7 10.4
Of which France:
Executives 21.0 19.8
White-collar staff 25.7 26.0
Blue-collar staff 1.8 2.2
TOTAL FRANCE 17.2 17.1

134 VICAT 2013 ANNUAL REPORT
4 ENVIRONMENTAL AND SOCIAL RESPONSIBILITY
4.1 BEING A RESPONSIBLE EMPLOYER
The percentage of women employed by the Group rose from 10.4 % as
at December 31, 2012 to 10.7 % as at December 31, 2013. In France,
the percentage of women employed reached 17.2 % in 2013 (up from
17.1 % in 2012 and 16.9 % in 2011). Kazakhstan occupies the leading
position in terms of the percentage of women employed, with a female
workforce representing 23.7 % of the total.
The percentage of female executives in the Group remained relatively
stable at 11.8 % in 2013, compared with 11.9 % in 2012. The
percentage of female executives in France made further gains, reaching
21.0 % as at December 31, 2013 (compared with 19.8 % in 2012 and
18.8 % in 2011).
4.1.7.2. Measures to promote the employment and integration of disabled people
Wherever conditions allow, the Vicat Group applies a proactive policy
in relation to the employment of disabled people.
The Vicat Group's companies thus employ disabled workers directly
through contacts with specialist organizations (in France, for example,
CAP Emploi, Ohé Prométhée or AGEFIPH).
Adjustments in the workplace, either by arranging working hours
(reduction or adaptation of working hours, remote working), or by
adapting workstations (ergonomic arrangements in terms of task
content, training, etc.), are also examined and put in place.
The development of subcontracting to companies and organizations
that specifically employ the disabled (secondment of disabled workers
within Group companies, provision of services, such as maintenance
of green spaces, removal of certain types of waste, etc.) is another
solution employed.
In France, disabled employees represented 3.1 % of the workforce in
2013, up from 2.6 % in 2012. The number of beneficiaries of these
measures employed directly by the Group has increased by 30 % over
the past five years.
The Vicat Group’s operations outside France are also achieving success
with this policy, especially in Turkey and Egypt. Disabled workers account
for 2.8 % of the Group’s workforce in Turkey and 2.3 % in Egypt.
4.1.7.3. Policy aimed at combating discrimination, forced labor and child labor
Adoption of the Group’s values by its employees is one of the key factors
in the success it has achieved in its 160 years of existence. There are
four main Group values, which have forged a strong corporate culture:
W the ability of management to react and reach decisions quickly, which
has proved particularly helpful in achieving success with the Group’s
acquisitions;
W an enthusiasm for innovation, research and development and
progress, inspired by the discoveries of Louis Vicat, who invented
cement in the nineteenth century;
W the tenacity that has enabled the Group to overcome the challenges
encountered since its foundation;
W the shared feeling of belonging to the Group, providing the energy
and strong capacity for action necessary to achieve its objectives.
These values derive from the humanistic principles embodied by Louis
Vicat, the very source of the Group’s existence. United by a history
extending over more than a century and a half, employees in all countries
where the Vicat Group operates share a strong sense of belonging to
the Group. This corporate culture gives rise to respect in relations with
others, solidarity between teams, the inclination to lead by example, a
capacity to mobilize energies, and the wherewithal to take strong action
on the ground to achieve objectives.
Managers at every level of the Vicat Group are the champions of
these values, developing a direct style of management, close to their
employees. Above all, they maintain strong ties with their teams and
are closely involved in the day-to-day activities of the organization.
Managers also ensure open lines of communication at all times.
As a result, the Vicat Group is well placed to effectively combat all forms
of discrimination as well as forced labor and child labor.
All Group companies comply with anti-discrimination legislation in force
in their respective countries (all are members of the International Labour
Organization). Proof of such compliance is to be found in the audits
conducted by various local authorities, none of which revealed any failure
to observe applicable laws and regulations in 2013.
At the instigation of Group management, the Vicat Group’s entities
in India, Kazakhstan and Senegal have each put in place a code of
conduct complying with World Bank standards. Management in India is
very sensitive to child protection and has regular, unannounced monthly
audits conducted to check that no children are working on the Group’s
sites.
In 2013, no Group company was the subject of a complaint or conviction
for discrimination, forced labor or child labor.
4.1.7.4. Human Resources Policy
The objective of the human resources policy is to ensure that the
individual skills of employees or team units are in line with the Group’s
development strategy on a short-, medium- and long-term basis, against
a background of adherence to and promotion of the values on which its
culture is based. This policy aims to maintain and develop the Group’s
attractiveness for its employees, as well as securing their loyalty. On
this basis, internal promotion is favored where possible. The objective
is to offer everyone career development prospects that allow them to
realize their ambitions and their full potential. Mobility, both operational
and geographical, is one of the conditions of this progression.

135VICAT 2013 ANNUAL REPORT
ENVIRONMENTAL AND SOCIAL RESPONSIBILITY
4
4
4
4
4
4
4
4
4.2 TAKING AN ACTIVE ROLE IN THE ECONOMIC AND SOCIAL DEVELOPMENT OF THE COUNTRIES IN WHICH WE OPERATE
4.2. TAKING AN ACTIVE ROLE IN THE ECONOMIC AND SOCIAL DEVELOPMENT OF THE COUNTRIES IN WHICH WE OPERATE
The Vicat Group’s policies with respect to its employees are echoed
in its relations with local communities. Through a range of actions, the
Vicat Group demonstrates its support for education, access to culture,
the initiatives of entrepreneurs to boost local economies, and assistance
measures to promote social integration through employment.
In addition, the Vicat Group is engaged in efforts to improve health and
sanitation in local communities, and specifically for residents living near
its facilities.
The Group promotes fair business practices in relation to both
consumers and its suppliers.
4.2.1. SUPPORTING EDUCATION AND EXPANDING ACCESS TO CULTURE
Education is a priority in the Group’s commitment to communities in
the countries where it operates. This commitment stems from the belief
that, without a minimum of education, no economic, social (including
questions of health) or environmental development can occur. The
Group pursues this commitment through actions at the university level
but also with respect to primary and secondary schools. These actions
generally take the form of direct financial assistance offered either to the
institution or to specific students through scholarships. But they may
also involve donations of building materials where new buildings are
being constructed or training courses in the building trades.
The table below shows the main activities in 2013 (which extend well beyond legal requirements, such as the allocation of the apprenticeship tax
in France):
Country LevelBeneficiary institution or local community Type of support
France Higher education Catholic University of Lyon
Development of new courses and construction of a new university
Senegal EducationSchools in Rufisque and Bargny
Scholarships awarded to promising students
IndiaPrimary school/School for blind girls Chatrasala and Kherchkhed
Merit-based and other scholarships/Financial assistance
Turkey Secondary school School of fine arts in Konya Financial support
In addition to supporting schools and universities, the Vicat Group finances numerous cultural activities.
Maurice Gueye center in Senegal is a very special case in point. This
cultural center, which belongs to Sococim, houses the largest private
library in Senegal in terms of the number of books and the number of
subscribers (200). The center is also frequented by thousands of visitors
to concerts, exhibitions, film screenings or other events.
Another example in the cultural sphere in France: in Montalieu (Isère),
the Group is linked by a partnership agreement to the Maison de la
Pierre au Ciment, which, as well as housing a museum, organizes visits
and conferences on the heritage and history of building in stone and
cement concrete.
4.2.2. CONTRIBUTING TO SOCIOECONOMIC DEVELOPMENT IN THE COUNTRIES AND REGIONS WHERE THE GROUP OPERATES
4.2.2.1. Direct and indirect employment
Due to the nature of its industrial operations, the Vicat Group creates
numerous jobs both upstream and downstream of its production units.
It is estimated that in the industrialized world for every one direct job
in a cement factory, there are ten associated indirect jobs. Upstream
suppliers and also the whole construction and public works sector
downstream are all fed by a cement works.

136 VICAT 2013 ANNUAL REPORT
4 ENVIRONMENTAL AND SOCIAL RESPONSIBILITY
4.2 TAKING AN ACTIVE ROLE IN THE ECONOMIC AND SOCIAL DEVELOPMENT OF THE COUNTRIES IN WHICH WE OPERATE
In emerging countries, staff are employed on production sites in
larger numbers than in the industrialized world because there is less
outsourcing of support functions (maintenance). Such outsourcing
presupposes a certain level of qualification and independence on the
part of subcontractors.
4.2.2.2. Support for local entrepreneurs
The Vicat Group is involved in various economic development initiatives
in the countries where it operates. Two initiatives are worthy of mention:
W in France, the Group has held the chairmanship of the certification
committee for Alizé Savoie since December 2012, an initiative
supporting the economic development of micro-enterprises and
SMEs in the Savoie region. This support involves the granting of zero-
interest loans and the sharing of expertise by partner companies in the
initiative. In 2013, assistance was provided to eight new companies
with the potential to create 33.5 additional jobs. Overall, since 2006,
this initiative has supported 54 companies and has helped to create
282.5 jobs;
W in Senegal, the Fondation Sococim, which has been in operation since
the end of 2011, has supported a number of economic development
initiatives, including the following projects:
• the association for the development of Medinatoul Mounawara
(Bargny), which brings together some 80 women operating small
businesses selling fish, palm oil, couscous or other products, or
raising and selling poultry,
• Aissa Dione Tissus, an SME in Rufisque with 80 employees,
specializing in the design and production of fabrics for the home.
Its products are made from organic cotton thread.
4.2.2.3. Social integration through employment
In 2013, The Vicat Group continued its involvement in initiatives
promoting social integration through employment, in cooperation with
the relevant local services, even where these programs only involve its
business segments indirectly. This is the case in the southern French
city of Nice, where the Vicat Group is a partner in “100 chances 100
emplois” (100 opportunities, 100 jobs). The aim of this program is
to identify high-potential young people from disadvantaged urban
communities and provide them with a personalized career path towards
professional employment.
Once they have been identified by local employment services or by
the state-run Pôle Emploi job centers, the candidates meet executives
from partner companies who help them to identify their career paths,
find themselves internships or training courses, and prepare for job
interviews.
Under this program in 2013, 110 of 162 applicants identified by the local
employment services obtained positions (internships or jobs).
4.2.2.4. Conservation and use of the built heritage
The Vicat Group focuses particularly on questions of the built heritage,
going beyond the development of products and commercial solutions
for renovation or conservation.
In 2013, the Group pursued several initiatives along these lines in France:
W support for the “Geste d’or” organization which each year confers
awards on the best projects relating to the conservation and use of
the built heritage. These projects, which bring together architects
and craftsmen, are all distinguished by their excellence and quality;
W partnership with the Haute Savoie Avenir working group, which is
overseeing a rehabilitation program focusing on individual homes built
between the 1950s and the 1980s. This program will be completed
in 2015;
W sharing of skills and expertise for renovation studies of the Louis Vicat
bridge in Souillac (Lot) carried out by the Group’s concrete research
laboratories in L’Isle d’Abeau. This bridge was the first in the world
to be built using artificial cement, following its invention by Louis
Vicat in 1817. Renovation work on this bridge, supervised by the Lot
departmental authority, began as scheduled in 2013.
4.2.2.5. Sports associations
The Group is heavily involved in supporting sports clubs or associations
in countries where it operates. In France, for example, the Group
renewed its support for professional women’s football in 2013, under
a partnership with the Olympique Lyonnais women’s team. This
partnership is in keeping with the Group’s particular interest in promoting
women’s sports.
4.2.3. CONTRIBUTING TO THE IMPROVEMENT OF SANITATION FACILITIES IN LOCAL COMMUNITIES
The Vicat Group’s efforts in the area of public health for the benefit of
those living near its production sites focus in particular on India and
Senegal.
In India, the Group has worked to improve the quality of drinking water
(Ogipur water treatment plant) near the Gulbarga cement factory
(Vicat Sagar Cement), to build public lavatories, and to arrange health
information sessions in villages in the vicinity of the Group’s cement
factories (Vicat Sagar Cement and Bharathi Cement).
In Senegal, the dispensary at the Rufisque cement factory is open
free of charge to the local population, including people other than
employees and their families. Malaria and AIDS prevention programs
are also offered.
In 2013, during major water outages affecting the public network, the
Fondation Sococim organized the free distribution of drinking water.
137VICAT 2013 ANNUAL REPORT
ENVIRONMENTAL AND SOCIAL RESPONSIBILITY
4
4
4
4
4
4
4
4
4.3 BEING A PROPONENT OF STRATEGIES FOR SUSTAINABLE CONSTRUCTION
It is worth noting that the action plan drawn up in favor of stakeholders
when the Gulbarga cement factory (Vicat Sagar) was built, which goes
beyond health questions and includes initiatives to support education
and improvements in quality of life for stakeholders, is the subject of a
report to the International Finance Corporation (IFC), a member of the
World Bank Group and one of the institutions financing the project.
4.2.4. GOOD PRACTICE WITH STAKEHOLDERS
4.2.4.1. Relations with subcontractors and suppliers
The Vicat Group gives priority to local purchases wherever possible,
in order to generate economic benefits for the countries in which it
operates.
The Group complies with the rules of law in the countries where it
operates, which have all signed or ratified the United Nations Human
Rights Charter.
Nearly all of the Group’s procurement contracts now contain clauses
requiring suppliers to confirm their adherence to the main principles
of international law, in particular with regard to compliance with the
International Labor Organization’s Fundamental Conventions (non-
discrimination, non-use of forced labor or child labor).
It was on this basis that the Vicat Group drafted the first version of its
Supplier code of conduct in 2013. Audits will be organized to verify the
effectiveness of this approach.
The audit unit established in connection with the construction of a
cement factory in India continues to verify compliance by the Group’s
suppliers with the above-mentioned principles, under the supervision
of teams from the IFC.
4.2.4.2. Training in good practice
In the context of the Group’s general policy on promoting and training
in adherence to good practice, a number of training courses were
organized for the Group’s managers and executives.
4.2.5. CONSUMER HEALTH AND SAFETY
The vast majority of the products produced and sold by the Group
comply with local minimum standards. Group products are checked
under internal and external procedures.
4.3. BEING A PROPONENT OF STRATEGIES FOR SUSTAINABLE CONSTRUCTION
The energy consumed in buildings represents almost 25 % of the world’s
total energy consumption (source: Key World Energy Statistics, 2011). In
France, the final energy consumption of buildings represents 43 % of the
country’s energy consumption (source: Observatoire de l’Énergie, 2007).
In order to reduce this, all those involved in the construction sector need
to act. In France, the Vicat Group is a member of a number of working
groups involved in this issue. Its contribution consists in developing
construction materials or systems with increasingly high performance
that improve the energy efficiency of buildings or infrastructures. A study
published in January 2013 by MIT in the United States has shown that
concrete solutions for road systems enable a 3 % reduction vehicle
fuel consumption.
In addition, upstream of its products, the Group works constantly to
improve its environmental footprint in its manufacturing processes.
4.3.1. BUILDING SYSTEMS AND MATERIALS SUPPORTING SUSTAINABLE CONSTRUCTION
The Louis Vicat Technical Center at L’Isle d’Abeau (Isère), home to the
Group’s main research facilities, collaborates with a number of other
research centers in the public and private sectors (including the French
atomic energy commission (CEA), the French solar energy institute
(INES), the Grenoble Institute of Technology, research laboratories
in schools of architecture and universities, and those of the Group’s
customers in the building and public works sector). It regularly files
patents in order to develop its products by adapting them to the
energy efficiency requirements of the construction sector (buildings or
infrastructures).

138 VICAT 2013 ANNUAL REPORT
4 ENVIRONMENTAL AND SOCIAL RESPONSIBILITY
4.3 BEING A PROPONENT OF STRATEGIES FOR SUSTAINABLE CONSTRUCTION
The Vicat Group was a founding member in 2007 of Pôle Innovations
Constructives, a French construction industry excellence cluster, which
it has chaired for six years. This cluster brings together a network of
key participants in the construction sector (industrial and institutional
players, architects, SMEs/micro-enterprises, craftsmen, Les Grands
Ateliers de l’Isle d’Abeau (an association of architects, engineers and
artists), architecture schools, École Nationale des Travaux Publics de
l’État (the French national school of public works), CFA BTP (a training
center for apprentices in the building and public works sector), etc.). Its
aim is to accelerate the spread of innovations in the construction industry
in order to meet, in particular, the challenges of energy transition.
The Vicat Group also chairs ASTUS-construction, one of the building-
energy efficiency working groups set up by the French sustainable
building plan.
The Vicat Group is an active member of INDURA, an excellence cluster
in the Rhône-Alpes region, which aims to develop energy-efficient
solutions in the infrastructure field.
The Vicat Group is a partner of COMEPOS, a project that aims to
develop optimized design and construction processes for energy-
positive homes in France. Following an initial phase launched in the first
quarter of 2013 to study existing buildings already focused on becoming
energy positive and to design new homes based in particular on life
cycle assessment (LCA), the next phase will see the construction of
these homes in all French regions, covering a broad range of climates.
The energy performance of these new homes under actual conditions
of use will be monitored and validated.
Joint work carried out since 2011 by Creabeton Matériaux, a Swiss
subsidiary of the Vicat Group, and Hépia in Geneva, a graduate school
of architecture, landscape architecture, planning and engineering, has
resulted in key developments. Skyflor, a new self-supporting system
used to create ventilated green façades, is currently undergoing real-
world tests, with a pilot installation in Geneva in September 2013. This
solution is based on a structure made of high-performance concrete.
The Vicat Group joined forces with Ecobilan, PricewaterhouseCoopers
and SNBPE, the French ready-mixed concrete industry association,
to develop BETon Impacts Environnementaux (BETie), a multi-criteria
environmental impact assessment tool. This tool is used to produce the
new French environmental and public health impact certificate known as
FDES (Fiche de Déclaration Environnementale et Sanitaire), provided to
users of the Group’s products who wish to evaluate the environmental
quality of their building projects.
All technical solutions for concrete structures developed by the Vicat
Group are highly efficient. They provide comfort for end users through
thermal inertia, ensure safety due to their robustness, and guarantee
emission neutrality.
4.3.2. INTEGRATED ENVIRONMENTAL MANAGEMENT
With a view to continuous improvements relating to the environmental
impact of its production processes, the Group has established an
operational organization and general policy specifically focused
on environmental issues as an integral part of its overall production
organization and strategy.
Each manufacturing plant has an environmental manager, generally
an engineer, who ensures that measurement equipment is working
properly and that local regulations and the calendar of external checks
are followed.
The environmental manager collects data and performs the calculations
required for his operational reports and statements issued to local
authorities. He reports regularly to his head of operations who
consolidates the data collected at his level.
Some Group plants have specific certification programs based on the
ISO 14001 standard. This is the case for the cement factories at Peille
in France, Rufisque in Senegal, and Bastas in Turkey, as well as the
Vizille paper mills.
It is also true for the Aggregates business in France, which achieved
ISO 14001 certification in late December 2013.
Initiatives have also been pursued in other Group businesses, such
as Concrete in France, which has launched a proactive environmental
management program in preparation for the industry’s ready-mixed
concrete charter.
In all countries where the Group operates, its industrial sites are subject
to strict local regulations relating to areas such as authorization,
operating permits, and licenses issued by local authorities, which
conduct regular checks, similar to the procedure in France in the case
of ICPEs (Installations Classées pour la Protection de l’Environnement),
a classification assigned to facilities or projects requiring environmental
impact assessment.
Training in environmental protection is implemented across several levels
of the organization.
Environmental managers receive regular training, particularly in the
regulatory aspect of their role.
Information on environmental emissions data is available at all times
in each manufacturing plant, as it is an integral parameter for the
production program and management of the installation. It enables
operational staff to trigger corrective action, where needed, under the
Group’s policy of continuous improvement.
Targeted training programs are also delivered for operational staff. For
example, within the Concrete business in France, the environmental
objectives set by its executive committee are presented to the seven
QHSE (Quality, Health, Safety and Environment) managers in the four
geographical business areas and the indicators are monitored at
monthly meetings.
In addition, batching plant operators annually attend a week’s training
course which includes the management of environmental parameters.
Both human resources and equipment devoted to the prevention of
environmental risks and pollution enable emissions to be controlled
beyond the limits prescribed by the various legislations.
Production sites are designed and operated such as to cause the least
possible harm to the neighborhood. Noise measurements are taken
regularly on site boundaries as part of the monitoring required by local
regulations.
139VICAT 2013 ANNUAL REPORT
ENVIRONMENTAL AND SOCIAL RESPONSIBILITY
4
4
4
4
4
4
4
4
4.3 BEING A PROPONENT OF STRATEGIES FOR SUSTAINABLE CONSTRUCTION
The Group’s production processes generate very little waste, which in
the majority of cases is recycled within the plant.
Provisions for environmental matters are shown in the Group’s
consolidated financial statements (notes 1.17 and 15). As at December
31, 2013, these provisions amounted to €40.3 million.
Environment-related investments amounted to a total of €10.5 thousand
in 2013, compared with €6.0 million in 2012 and €8.8 million in 2011.
4.3.3. ENGAGING IN DIALOGUE WITH LOCAL STAKEHOLDERS LIVING NEAR THE GROUP’S INDUSTRIAL SITES
The Vicat Group takes advantage of every opportunity to engage in
constructive dialogue with local stakeholders, whether or not these
exchanges take the shape of formal consultation processes.
This dialogue thus takes on various forms, from the presentation of
projects to public meetings, to the organization of meetings to track
progress at sites, and open days to build relationships between the
sites and their local communities.
Managers of the Group’s ready-mixed concrete manufacturing plants
can refer to the practical tips included in the “How to Manage Relations
with Local Communities” guide, whose preparation benefited from the
input of experts at the Vicat Group.
Public meetings
In France, each proposed site opening gives rise to a presentation at
a public meeting as part of the public review process. Following these
exchanges with local stakeholders, the Vicat Group makes every effort
to meet their expectations and balance the interests of all parties.
Site monitoring committees
In France, several quarry sites, which are subject to authorization, have
established site monitoring committees, whose members include local
residents and associations, employees, and the operator as well as local
and regional authorities. These committees allow stakeholders to offer
feedback on the way in which the site is operated.
Open days
In 2013, to round out the initiatives mentioned above, the Vicat Group
organized open days at its sites in Montalieu (France) and Reuchenette
(Switzerland), as another means to deliver information and promote
exchanges with local residents.
In practical terms, the environmental policy applied by the Group in all of
its business processes involves actions at various levels: management
of air and water quality, relations with suppliers of raw materials, quarry
operations, safeguarding biodiversity, and the selection of energy
sources.
4.3.4. GREENHOUSE GAS EMISSIONS AND OTHER DISCHARGES INTO THE AIR
4.3.4.1. Reducing emissions into the air
In its main industrial activity, the production of clinker and cements, the
Vicat Group has always placed a great deal of importance on its filtration
systems for chimney emissions likely to impact air quality.
The Vicat Group thus ensures specific levels of dust emissions from its
cement factory kilns that are among the lowest in the industry.
In order to measure its performance in this area, the Vicat Group has
opted to compare itself against the relevant criteria developed by the
CSI (Cement Sustainability Initiative, the industry association of the World
Business Council for Sustainable Development (WBCSD)) and used
across the industry as international benchmarks, which are:
W CO2 emissions for the monitoring of greenhouse gases having a
potential impact on climate change;
W Dust emissions, which are one of the main indicators of good kiln
operation and one of the main historic impacts of cement factories;
W NOx (nitrogen oxides) and SO
x (sulfur oxides) emissions as discharges
having an impact on atmospheric acidification.
In the case of dust, NOx and SO
x discharges, the situation in 2013 was as follows:
2013
Number of kilns
assessedEmissions
Tonnes
EmissionsGrams of
particulate per tonne of
clinker 2012 figure 2011 figure
Dust 21 480 35 41 46
SOx
14 2,591 295 262 315
NOx 17 15,291 1,445 1,377 1,209
140 VICAT 2013 ANNUAL REPORT
4 ENVIRONMENTAL AND SOCIAL RESPONSIBILITY
4.3 BEING A PROPONENT OF STRATEGIES FOR SUSTAINABLE CONSTRUCTION
Dust
The start-up of modern kilns fitted with high performance filters has
enabled an improvement in the dust indicator, which is among the best
in the industry, based on available data.
SOx
In the case of SOx, the main emissions come from pyritic sulfurs in the raw
meal. The rise in this indicator in France, in 2013, is due to the operation
of two quarry seams with slightly higher sulfur content, chiefly at the
Xeuilley site and at the Montalieu site to a lesser extent. The Xeuilley site
has since been equipped with a lime injection system to better control
these emissions.
NOx
NOx emissions have increased slightly, given the relative decline in the
use of hydrocarbons and gas as energy sources, offset by greater use
of coal and coke, which tend to emit more NOx.
Other emissions into the air are not significant in the case of the cement
industry, which also produces little or no effluent and therefore has little
or no impact on water quality.
Monitoring of the air quality near the Group’s facilities
In some countries, India in particular, the quality of the ambient air in
the vicinity of the plants is monitored and not the emissions. Frequent
measurements show concentrations around the plants to be eight to
ten times lower than the standards require.
In connection with the limitation of dust emissions, two major
investments were carried out in Turkey. Two clinker storage facilities,
each with a capacity of 150,000 tonnes, were built in 2013 at the Bastas
and Konya sites.
4.3.4.2. Greenhouse gases (GHG)
Cement industry studies show that only CO2 needs to be considered
under this heading. The proportion of emissions of other gases
(methane, nitrogen protoxide, fluorinated gases, etc.) is marginal.
In the case of CO2, the emissions from the French factories are
subject to quotas under the European ETS program (Exchange Trade
System). Consequently, they are monitored precisely under surveillance
programs and have been checked annually since 2005 by an approved
independent body. Monitoring plans for the period from 2013 to 2020
were reviewed in 2013 to meet the requirements of Commission
Regulation (EU) No. 601/2012 and were approved by the competent
authority. Beginning in 2013, these emissions are to be the focus of
an audit by the independent body and no longer a simple verification.
The distribution of emissions allowances for the period 2013–2020 was
validated by the EU at the end of 2013. Apart from the five artificial-
cement factories and the Vizille paper mill, the quick-setting cement
kilns are also now affected.
As a result of these verifications in France, the Vicat Group has been able
to obtain a certificate of reasonable assurance expressing an unqualified
opinion every year since 2005.
In France, although it is not directly a member of the CSI, the Vicat Group
provides emissions data relating to its cement operations each year for
the worldwide database on the cement industry’s CO2 emissions and
energy performance launched at the initiative of the United Nations and
as part of the “Getting the Numbers Right” (GNR) program. This data is
provided via the local industry association.
In Switzerland, the Reuchenette cement works (Vigier) is a member of
the CSI and accounts for its emissions under this heading after being
audited by the industry association Cemsuisse. A new CO2 monitoring
system based on EU regulations came into force on January 1, 2013.
Lastly, surveillance and reporting systems according to United Nations
GHG protocol have been put in place in the USA. With effect from
January 1, 2013, the Lebec cement factory in California has been
subject to California Air Resources Board (CARB) regulation AB 32 on
greenhouse gas emissions.
For the Vicat Group, direct CO2 emissions (from the burning of fossil
fuels and the decarbonization of raw materials) from its cement factories
are the main indicator of performance in terms of gross CO2 emissions.
GROSS CO2 EMISSION OF THE VICAT GROUP'S
CEMENT KILNS
2011 2012 2013
11,322 11,455
819 826828
11,436
kg cross CO2 /tonne of clinckerin tonnes of CO2
In 2013, specific emissions of CO2 returned to a level just slightly lower
than that of 2011, at 826 kg CO2 per tonne of clinker. The more limited
availability of hydrocarbons and gas as energy sources, for example at
the Ragland site, had the greatest effect on this performance, since the
coal and coke used in their stead are a little less favorable with respect
to this indicator.
The use of modern kilns offering better heat balances and the
development of the use of waste and biomass as energy sources have
helped to limit this impact.
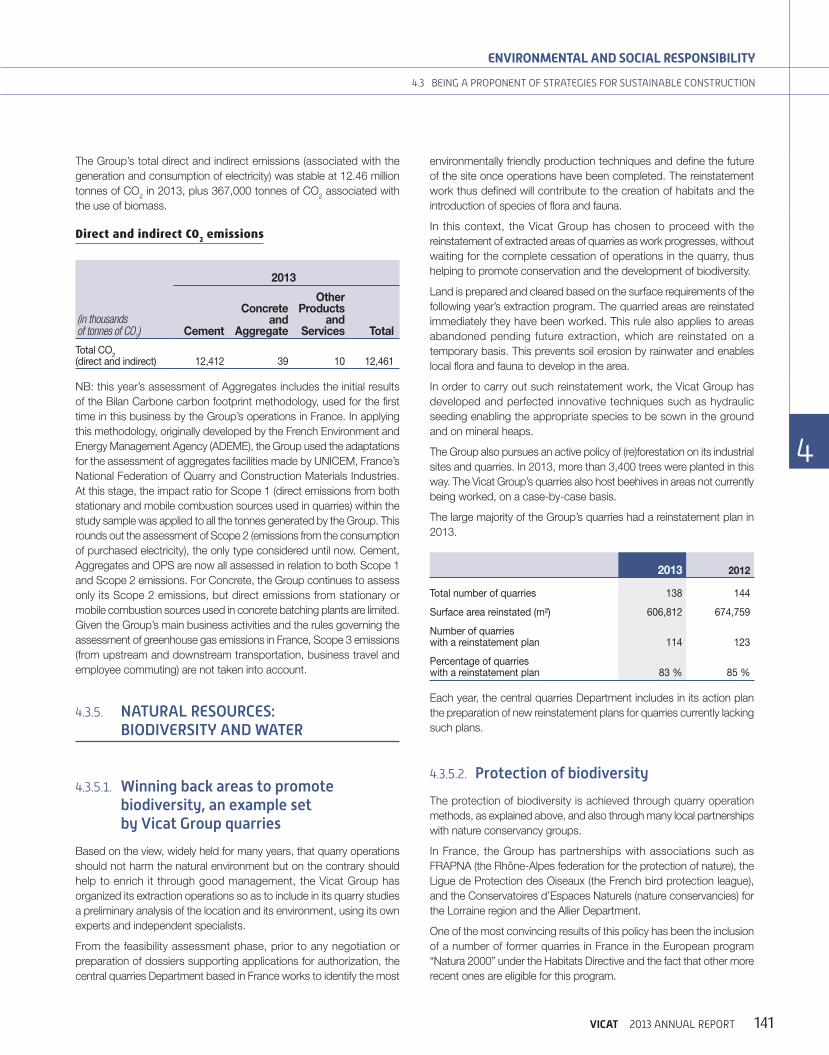
141VICAT 2013 ANNUAL REPORT
ENVIRONMENTAL AND SOCIAL RESPONSIBILITY
4
4
4
4
4
4
4
4
4.3 BEING A PROPONENT OF STRATEGIES FOR SUSTAINABLE CONSTRUCTION
The Group’s total direct and indirect emissions (associated with the
generation and consumption of electricity) was stable at 12.46 million
tonnes of CO2 in 2013, plus 367,000 tonnes of CO
2 associated with
the use of biomass.
Direct and indirect CO2 emissions
(in thousands of tonnes of CO
2)
2013
Cement
Concrete and
Aggregate
Other Products
and Services Total
Total CO2
(direct and indirect) 12,412 39 10 12,461
NB: this year’s assessment of Aggregates includes the initial results
of the Bilan Carbone carbon footprint methodology, used for the first
time in this business by the Group’s operations in France. In applying
this methodology, originally developed by the French Environment and
Energy Management Agency (ADEME), the Group used the adaptations
for the assessment of aggregates facilities made by UNICEM, France’s
National Federation of Quarry and Construction Materials Industries.
At this stage, the impact ratio for Scope 1 (direct emissions from both
stationary and mobile combustion sources used in quarries) within the
study sample was applied to all the tonnes generated by the Group. This
rounds out the assessment of Scope 2 (emissions from the consumption
of purchased electricity), the only type considered until now. Cement,
Aggregates and OPS are now all assessed in relation to both Scope 1
and Scope 2 emissions. For Concrete, the Group continues to assess
only its Scope 2 emissions, but direct emissions from stationary or
mobile combustion sources used in concrete batching plants are limited.
Given the Group’s main business activities and the rules governing the
assessment of greenhouse gas emissions in France, Scope 3 emissions
(from upstream and downstream transportation, business travel and
employee commuting) are not taken into account.
4.3.5. NATURAL RESOURCES: BIODIVERSITY AND WATER
4.3.5.1. Winning back areas to promote biodiversity, an example set by Vicat Group quarries
Based on the view, widely held for many years, that quarry operations
should not harm the natural environment but on the contrary should
help to enrich it through good management, the Vicat Group has
organized its extraction operations so as to include in its quarry studies
a preliminary analysis of the location and its environment, using its own
experts and independent specialists.
From the feasibility assessment phase, prior to any negotiation or
preparation of dossiers supporting applications for authorization, the
central quarries Department based in France works to identify the most
environmentally friendly production techniques and define the future
of the site once operations have been completed. The reinstatement
work thus defined will contribute to the creation of habitats and the
introduction of species of flora and fauna.
In this context, the Vicat Group has chosen to proceed with the
reinstatement of extracted areas of quarries as work progresses, without
waiting for the complete cessation of operations in the quarry, thus
helping to promote conservation and the development of biodiversity.
Land is prepared and cleared based on the surface requirements of the
following year’s extraction program. The quarried areas are reinstated
immediately they have been worked. This rule also applies to areas
abandoned pending future extraction, which are reinstated on a
temporary basis. This prevents soil erosion by rainwater and enables
local flora and fauna to develop in the area.
In order to carry out such reinstatement work, the Vicat Group has
developed and perfected innovative techniques such as hydraulic
seeding enabling the appropriate species to be sown in the ground
and on mineral heaps.
The Group also pursues an active policy of (re)forestation on its industrial
sites and quarries. In 2013, more than 3,400 trees were planted in this
way. The Vicat Group’s quarries also host beehives in areas not currently
being worked, on a case-by-case basis.
The large majority of the Group’s quarries had a reinstatement plan in
2013.
2013 2012
Total number of quarries 138 144
Surface area reinstated (m2) 606,812 674,759
Number of quarries with a reinstatement plan 114 123
Percentage of quarrieswith a reinstatement plan 83 % 85 %
Each year, the central quarries Department includes in its action plan
the preparation of new reinstatement plans for quarries currently lacking
such plans.
4.3.5.2. Protection of biodiversity
The protection of biodiversity is achieved through quarry operation
methods, as explained above, and also through many local partnerships
with nature conservancy groups.
In France, the Group has partnerships with associations such as
FRAPNA (the Rhône-Alpes federation for the protection of nature), the
Ligue de Protection des Oiseaux (the French bird protection league),
and the Conservatoires d’Espaces Naturels (nature conservancies) for
the Lorraine region and the Allier Department.
One of the most convincing results of this policy has been the inclusion
of a number of former quarries in France in the European program
“Natura 2000” under the Habitats Directive and the fact that other more
recent ones are eligible for this program.

142 VICAT 2013 ANNUAL REPORT
4 ENVIRONMENTAL AND SOCIAL RESPONSIBILITY
4.3 BEING A PROPONENT OF STRATEGIES FOR SUSTAINABLE CONSTRUCTION
Various local initiatives have been undertaken for the protection
of animal species, such as the creation of a refuge for bats in the
Maizières aggregates quarry in Lorraine, which was awarded the Special
Biodiversity Prize for 2013 by the European Aggregates Association. In
Isère, the partnership with the “Tichodrome” association, which runs a
hospital caring for birds and small mammals, continued in 2013.
4.3.5.3. Water management and recycling
Recycling of water is favored in order to reduce intake and discharges
into the environment. Water intake is monitored as an important indicator
of the impact of our operations.
W In cement factories, some water is used to cool the gases before
treatment in the filters. A large part of the water required is used
for cooling the bearings in rotary equipment (bearings in the kiln or
grinding mills) and the use of closed loops enables the recycling of
nearly 60 % of total water used.
W In the Concrete business, water consumption has declined to
190 liters per m3 of production, perfectly in line with international best
practice and well below the 350 liters set by French regulations as
the maximum limit. In line with its policy of optimizing management of
water resources, the Concrete business in France invested €900,000
in 2013. At constant consolidation scope, these efforts allowed for a
6 % reduction in its water intake.
It is important to note that full recycling is used at 95 % of the ready-
mixed concrete manufacturing plants; 62 % of water is recycled
in production itself, with 38 % recycled for other uses (cleaning of
facilities and vehicles).
W In the Aggregates business, recycling systems enable over 65 %
of the total water requirement for cleaning to be recovered. This ratio
exceeds 80 % in France.
The specific consumption per tonne of aggregate produced is thus
limited to 192 liters of water.
Water use, re-use and environmental discharge in 2013 (in volume and percentage)
Cement Aggregates ConcreteOther Products
and Services
Total water requirement (in thousand of m3) 20,419 10,875 2,019 1,842
Recycled (in thousand of m3) 12,084 7,089 365 280
Percentage recycled (in %) 59 65 18 15
Net intake (in thousand of m3) 8,335 3,787 1,654 1,562
Public network (in %) 8.8 25.1 50.5 4.3
Aquifers (in %) 70.1 31.6 7.0 95.7
Lakes and rivers (in %) 8.1 38.4 24.5 0
Other (in %) 13.0 4.9 18.1 0
Environmental discharges (in thousand of m3) 5,419 4 5.8 1,382
Effective consumption (in thousand of m3) 2,916 3,783 1,648 180
4.3.5.4. Management of raw materials
The main raw materials used by the Vicat Group in its businesses are
naturally occurring and extracted from the environment. This is equally
true for clinker or aggregates production and for water consumption.
The Group thus keeps precise accounts of its consumption and where
possible favors the use of alternative raw materials (Valmat) for both
clinker production (calcium, alumina or iron oxides, silica content, etc.)
and for cements (sulfo- or phosphogypsum, recycling of mineral waste
from quarries, etc.) and aggregates (use of aggregates from returns of
fresh concrete or from demolition).
In 2013, the raw material consumed in clinker production amounted to
23.2 million tonnes, including 0.4 % alternative materials.
An additional 3.39 million tonnes were used in cement production,
including 21.3 % alternative materials, accounting for 4.07 % of cement
produced.
In all, alternative materials included in the production of cement
represented 4.54 % of cement produced.
For the production of aggregates, 19.8 million tonnes of raw materials
were extracted in 2013.
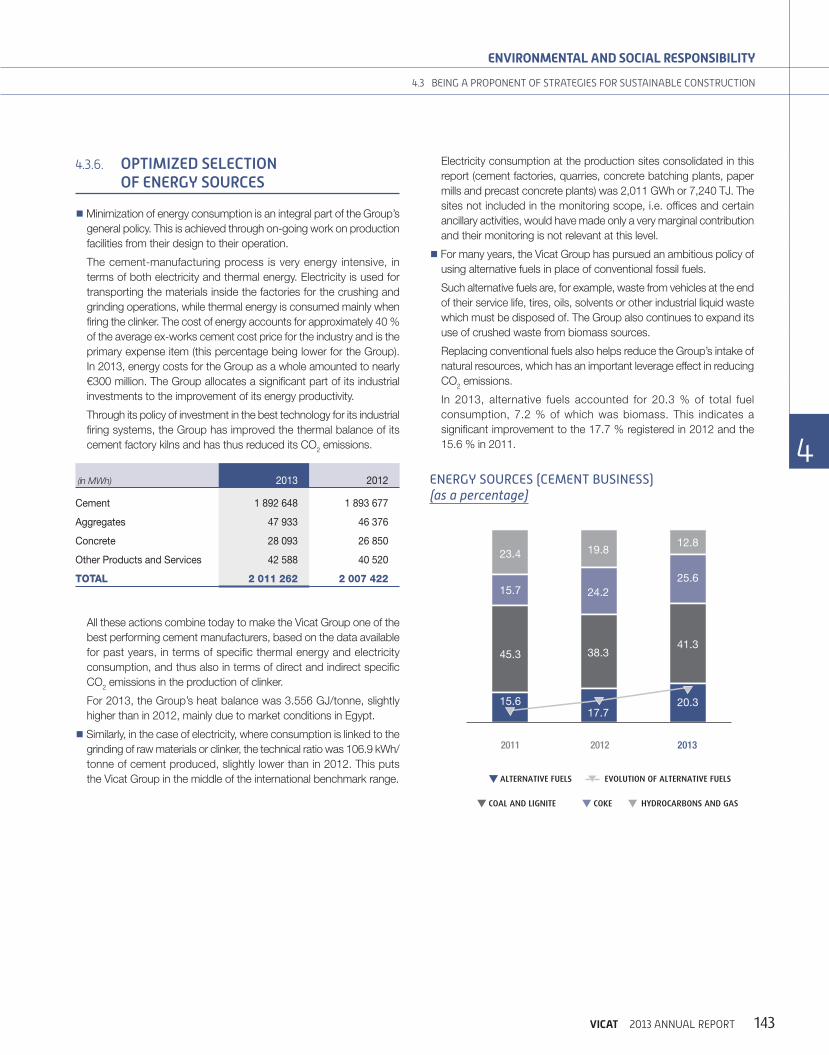
143VICAT 2013 ANNUAL REPORT
ENVIRONMENTAL AND SOCIAL RESPONSIBILITY
4
4
4
4
4
4
4
4
4.3 BEING A PROPONENT OF STRATEGIES FOR SUSTAINABLE CONSTRUCTION
4.3.6. OPTIMIZED SELECTION OF ENERGY SOURCES
WMinimization of energy consumption is an integral part of the Group’s
general policy. This is achieved through on-going work on production
facilities from their design to their operation.
The cement-manufacturing process is very energy intensive, in
terms of both electricity and thermal energy. Electricity is used for
transporting the materials inside the factories for the crushing and
grinding operations, while thermal energy is consumed mainly when
firing the clinker. The cost of energy accounts for approximately 40 %
of the average ex-works cement cost price for the industry and is the
primary expense item (this percentage being lower for the Group).
In 2013, energy costs for the Group as a whole amounted to nearly
€300 million. The Group allocates a significant part of its industrial
investments to the improvement of its energy productivity.
Through its policy of investment in the best technology for its industrial
firing systems, the Group has improved the thermal balance of its
cement factory kilns and has thus reduced its CO2 emissions.
(in MWh) 2013 2012
Cement 1 892 648 1 893 677
Aggregates 47 933 46 376
Concrete 28 093 26 850
Other Products and Services 42 588 40 520
TOTAL 2 011 262 2 007 422
All these actions combine today to make the Vicat Group one of the
best performing cement manufacturers, based on the data available
for past years, in terms of specific thermal energy and electricity
consumption, and thus also in terms of direct and indirect specific
CO2 emissions in the production of clinker.
For 2013, the Group’s heat balance was 3.556 GJ/tonne, slightly
higher than in 2012, mainly due to market conditions in Egypt.
W Similarly, in the case of electricity, where consumption is linked to the
grinding of raw materials or clinker, the technical ratio was 106.9 kWh/
tonne of cement produced, slightly lower than in 2012. This puts
the Vicat Group in the middle of the international benchmark range.
Electricity consumption at the production sites consolidated in this
report (cement factories, quarries, concrete batching plants, paper
mills and precast concrete plants) was 2,011 GWh or 7,240 TJ. The
sites not included in the monitoring scope, i.e. offices and certain
ancillary activities, would have made only a very marginal contribution
and their monitoring is not relevant at this level.
W For many years, the Vicat Group has pursued an ambitious policy of
using alternative fuels in place of conventional fossil fuels.
Such alternative fuels are, for example, waste from vehicles at the end
of their service life, tires, oils, solvents or other industrial liquid waste
which must be disposed of. The Group also continues to expand its
use of crushed waste from biomass sources.
Replacing conventional fuels also helps reduce the Group’s intake of
natural resources, which has an important leverage effect in reducing
CO2 emissions.
In 2013, alternative fuels accounted for 20.3 % of total fuel
consumption, 7.2 % of which was biomass. This indicates a
significant improvement to the 17.7 % registered in 2012 and the
15.6 % in 2011.
ENERGY SOURCES (CEMENT BUSINESS)(as a percentage)
201320122011
COAL AND LIGNITE COKE HYDROCARBONS AND GAS
0
20
40
60
80
100
15.6
23.4
15.7
45.3
17.7
19.8
24.2
38.3
20.3
12.8
25.6
41.3
EVOLUTION OF ALTERNATIVE FUELSALTERNATIVE FUELS

144 VICAT 2013 ANNUAL REPORT
4 ENVIRONMENTAL AND SOCIAL RESPONSIBILITY
4.4 CROSS-REFERENCE TABLE OF WORKFORCE-RELATED, ENVIRONMENTAL AND SOCIAL INFORMATION
4.4. CROSS-REFERENCE TABLE OF WORKFORCE-RELATED, ENVIRONMENTAL AND SOCIAL INFORMATION
Between the disclosures required by Decree No. 2012-557 of April 24, 2012 and those in the Annual Report
Social information
N°Information required by Decree No. 2012-557 of April 24, 2012
Corresponding section of
the Annual Report
a) Employment 1 Total workforce and breakdown by gender, age and geographical area 4.1.3.
2 Recruitment and lay-offs 4.1.3.
3 Remuneration and pattern of change 4.1.4.
b) Work organization 4 Organization of working hours 4.1.5.
5 Absenteeism 4.1.5.3.
c) Social relations 6 Organization of social dialogue, in particular procedures for informing and consulting employees and negotiating with them
4.1.6.
7 Review of collective agreements 4.1.6.
d) Health and safety 8 Health and safety conditions at work 4.1.1.2.
9 Review of agreements signed with trade unions or staff representatives concerning health and safety at work
4.1.1.3.
10 Workplace accidents, in particular their frequency and their severity, and occupational illnesses
4.1.1.1.
e) Training 11 Training policies implemented 4.1.2.
12 Total number of hours of training 4.1.2.
f) Equality of treatment 13 Measures to promote gender equality 4.1.7.1.
14 Measures to promote the employment and integration of disabled people
4.1.7.2.
15 Policy on the elimination of discrimination 4.1.7.3.
g) Promoting and complying with the standards set out in the International Labour Organization’s Fundamental Conventions relating to:
16 respect for freedom of association and the right to collective bargaining
4.1.7.3.
17 the elimination of discrimination in respect of employment and occupation
4.1.7.3.
18 the elimination of all forms of forced or compulsory labor 4.1.7.3.
19 the effective abolition of child labor 4.1.7.3.

145VICAT 2013 ANNUAL REPORT
ENVIRONMENTAL AND SOCIAL RESPONSIBILITY
4
4
4
4
4
4
4
4
4.4 CROSS-REFERENCE TABLE OF WORKFORCE-RELATED, ENVIRONMENTAL AND SOCIAL INFORMATION
Environmental information
N°Information required by Decree No. 2012-557 of April 24, 2012
Corresponding section of
the Annual Report
a) General environmental policy 20 The organization of te Company in order to take into account environmental issues and, if applicable, environmental assessment or certification measures
4.3.2.
21 Actions providing training and information to employees with regard to environmental protection
4.3.2.
22 The resources devoted to the prevention of environmental risks and pollution
4.3.2.
23 The amount allocated to provisions and guarantees in respect of environmental risks, provided that this information is not such as to result in serious prejudice to the Company in a current dispute
4.3.2.
b) Pollution and waste management 24 Measures to prevent, reduce or clean up discharges into the air, water or soil having a serious effect on the environment
4.3.4.1.
25 Measures to prevent, recycle and eliminate waste products 4.3.2.
26 Consideration of noise pollution and all other forms of pollution specific to an activity
4.3.2.
c) Sustainable use of resources 27 Consumption of water and supply of water in accordance with local constraints
4.3.5.3.
28 Consumption of raw materials and measures taken to improve the efficiency of their use
4.3.5.4.
29 Energy consumption, measures taken to improve energy efficiency and use of renewable energy sources
4.3.6.
30 Land use 4.3.5.1.
d) Climate change 31 Discharges of greenhouse gases 4.3.4.2.
32 Adaptation to the consequences of climate change 4.3.4.1.
e) Protection of biodiversity 33 Measures taken to preserve or increase biodiversity 4.3.5.2.

146 VICAT 2013 ANNUAL REPORT
4 ENVIRONMENTAL AND SOCIAL RESPONSIBILITY
4.4 CROSS-REFERENCE TABLE OF WORKFORCE-RELATED, ENVIRONMENTAL AND SOCIAL INFORMATION
Societal information
N°Information required by Decree No. 2012-557 of April 24, 2012
Corresponding section of
the Annual Report
a) Territorial, economic and social impact of the Company’s business
34 in terms of employment and regional development 4.2.2.
35 on neighborhood or local populations 4.2.2.4.2.3.
b) Relations with persons or organizations with an interest in the Company’s business, in particular employment organizations, teaching establishments, environmental protection organizations, consumer and neighborhood associations
36 Terms of dialogue with such persons or organizations 4.3.3.
37 Partnership or charity actions 4.2.1.
c) Subcontractors and suppliers 38 Consideration of social and environmental issues in the procurement policy
4.2.4.1.
39 The level of subcontracting and the integration of social and environmental responsibility in relations with suppliers and subcontractors
4.2.4.1.
d) Good practice 40 Action taken to prevent corruption 4.2.4.2.
41 Measures taken in favor of consumer health and safety 4.2.5.
42 Other actions taken under this heading in favor of human rights 4.2.4.1.

147VICAT 2013 ANNUAL REPORT
ENVIRONMENTAL AND SOCIAL RESPONSIBILITY
4
4
4
4
4
4
4
4
4.5 REPORT BY AN INDEPENDENT THIRD PARTY ON THE CONSOLIDATED SOCIAL, ENVIRONMENTAL AND SOCIETAL DATA
4.5. REPORT BY AN INDEPENDENT THIRD PARTY ON THE CONSOLIDATED SOCIAL, ENVIRONMENTAL AND SOCIETAL DATA
Independent verifier’s report on the review of the consolidated social, environmental and societal information published in the management report.
This is a free translation into English of the verifier’s review report issued in the French language and is provided solely for the convenience of English
speaking readers. The review report should be read in conjunction with, and construed in accordance with, French law and standards applicable
in France.
Financial year ending 31 December 2013
To the Shareholders,
In our capacity as professional accountants identified as independent verifier, for which the accreditation is recognised by the COFRAC, we hereby
report to you on the consolidated social, environmental and societal information published in the management report (hereafter the “CSR information”)
prepared for the year ended 31 December 2013, pursuant to Article L.225-102-1 of the French Commercial Code (Code du Commerce).
Management’s responsibility
The board of directors is responsible for the preparation of the management report including the CSR information in accordance with the requirements
of Article R.225-105-1 of the French Commercial Code presented as required by the company’s internal reporting guidelines (hereafter the “reporting
guidelines”) and available on request at the company’s headquarters.
Independence and quality control
Our independence is defined by regulatory requirements and by the Code of Ethics of our profession inserted in the 30 March 2012 decree specific
to the activity of accountants. Furthermore, we have implemented a quality control system to ensure compliance with the code of ethics, professional
standards and applicable laws and regulations.
Independent verifier’s responsibility
It is our role, on the basis of our work:
W to attest whether the required CSR information is presented in the management report or, if not presented, whether an appropriate explanation is
given in accordance with the third paragraph of Article R.225-105 of the French Commercial Code (Attestation of disclosure);
W to express limited assurance on the fact that, taken as a whole, the CSR information is presented fairly, in all material aspects, in accordance with
the reporting guidelines (Assurance report).
Our work was conducted by a team of 4 people during the period of December 2013 to March 2014 for duration of approximately 3 weeks. We
called upon the help of our CSR experts to complete this assignment.
1. Attestation of disclosure
We conducted our work in accordance with the professional guidelines and the legal order published on 13 may 2013 determining the methodology
according to which the independent verifier conducts his mission:
Wwe learned, based on interviews with officials of departments concerned, to the explanatory guidelines for sustainable development based on
social consequences and environmental related activities of the company and its social commitments and, where appropriate, actions or programs
that result;
Wwe compared the CSR information presented in the management report with the list set forth in Article R.225-105-1 of the French Commercial Code;
W in the event of omission of certain consolidated information, we have verified that explanations are provided in accordance with the third paragraph
of Article R.225-105-1 of the French Commercial Code;

148 VICAT 2013 ANNUAL REPORT
4 ENVIRONMENTAL AND SOCIAL RESPONSIBILITY
4.5 REPORT BY AN INDEPENDENT THIRD PARTY ON THE CONSOLIDATED SOCIAL, ENVIRONMENTAL AND SOCIETAL DATA
Wwe verified that the CSR information covered consolidated scope, i.e. the Company and its subsidiaries within the meaning of Article L.233-1 of
the French Commercial Code and the companies that it controls within the meaning of Article L.233-3 of the French Commercial Code.
Based on our work, we attest that the required Information is presented in the management report.
2. Assurance report
We conducted our work in accordance with the professional guidelines and the legal order published on 13 may 2013 determining the methodology
according to which the independent verifier conducts his mission and in accordance with the International Standard on Assurance Engagement
ISAE 3000.
We met approximately 10 times with the managers responsible for the preparation of the CSR information within the department in charge of the
process of collection of the information and where appropriate, we also met with those in charge of internal control and risk management procedures
in order to:
W assess the appropriateness of the reporting standards with respect to its relevance, completeness, neutrality, clarity and reliability by taking into
consideration, where applicable, the industry’s best practices;
W verify that the company had set up a process for the collection, compilation, processing and control to ensure the completeness and consistency
of the CSR information. We also familiarise ourselves with the internal control and risk management procedures relating to the compilation of the
CSR information.
We determined the scope of the tests according to the nature and importance of the CSR information taking into consideration the characteristics of
the company, its actions in respect to the social and environmental consequences of its activities, its direction as far as sustainability is concerned.
We also determined tests according to the industry’s best practices.
Concerning the qualitative consolidated information that we have considered the most significant (1):
W for the consolidating entity and the sites, we reviewed the related documentary sources and conducted interviews to check the qualitative information
(organisation, strategies and actions). We set up analytical procedures and verified the quantitative information using sampling techniques in order to
check the consistency of the calculations and the consolidated information in order to reconcile the data with the information in the management report;
Wwe selected sites(2) based on their activity, their contribution to consolidated indicators, their location and risk analysis. We have conducted interviews
to verify the proper application of procedures and set up tests using sampling techniques to verify the calculations performed and reconcile data
with supporting evidence.
The selected sample represents 45 % of the workforce and between 26 % and 76 % of the quantitative environmental information tested.
For the other CSR information, we have assessed its consistency in relation to our knowledge of the company.
Finally, we assessed the relevance of the explanations given in the event of total or partial absence of information.
We believe that the sampling techniques and the sample sizes that we set up by exercising our professional judgment have allowed us to formulate a
limited assurance conclusion; a higher level of assurance would have required a more extensive review. Because of the use of sampling techniques,
and because of other limits inherent to the functioning of any information system and internal control system, the risk of missing out a significant
anomaly in the CSR information cannot be totally eliminated.
Conclusion
Based on our work we did not identify any significant misstatement likely to call into question the fact that the CSR information, as a whole, has been
presented fairly, in accordance with the reporting standards.
Paris, March 8, 2014
Grant Thornton, French member of Grant Thornton International Alban Audrain, Partner , Head of Corporate Social Responsibility
(1) Workforce (number and distribution), the hiring and firing, absenteeism, accidents (frequency and gravity), the number of hours of training, air emissions (dust,
SOx, NOx), water consumption, consumption energy (electricity and fuel), land use (number and proportion career with redevelopment plan) emissions of
greenhouse gases.
(2) Sites situated in France and Turkey.
VICAT 2013 ANNUAL REPORT 149
5LEGAL INFORMATION
CHAIRMAN’S REPORT ON CORPORATE GOVERNANCE AND INTERNAL CONTROL 150
STATUTORY AUDITORS’ REPORT PREPARED IN ACCORDANCE WITH ARTICLE L.225-235 OF THE FRENCH COMMERCIAL CODE ON THE REPORT PREPARED BY THE CHAIRMAN OF THE BOARD OF DIRECTORS OF VICAT S.A. 156
TEXT OF THE RESOLUTIONS PROPOSED AT THE COMBINED GENERAL MEETING OF MAY 6, 2014 157
STATUTORY AUDITORS’ REPORT IN RELATION WITH THE SHARE CAPITAL INCREASE TO THE BENEFIT OF THE EMPLOYEES MEMBERS OF THE COMPANY’S SAVING PLAN 160

VICAT 2013 ANNUAL REPORT150
5 LEGAL INFORMATION
CHAIRMAN’S REPORT ON CORPORATE GOVERNANCE AND INTERNAL CONTROL
CHAIRMAN’S REPORT ON CORPORATE GOVERNANCE AND INTERNAL CONTROL
Dear Shareholders,
Pursuant to the provisions of article L. 225-37, paragraph 6, of the
French Commercial Code, I report herein on:
W the composition and the conditions for preparation and organization
of the work of your Board of Directors during the financial year ended
on December 31, 2013;
W the internal control and risk management procedures established
by the Company;
W the policy for remuneration of the Company’s officers;
W the scope of powers of the Chairman and of the CEO.
1. PREPARATION AND ORGANIZATION OF WORK OF THE BOARD OF DIRECTORS
Your Board of Directors met twice in the last financial year. The dates
and the agendas of the Board meetings were as follows:
Meeting of February 24, 2013:
W Presentation of the business report;
W Approval of the individual financial statements for the year ended
December 31, 2012;
W Approval of the consolidated financial statements for the year ended
December 31, 2012;
W Review of the reports of the Board of Directors’ committees (Audit
Committee and Remunerations Committee);
W Approval of the Chairman’s report on corporate governance and
internal control;
W Presentation of the 2013 budget;
W Share buy-back program;
W Allocation of treasury shares;
W Delegation of powers as stipulated by the share buy-back program;
W Reappointment of the statutory auditors;
W Reappointment of the Alternate Auditors;
W Allocation of earnings;
W Authorization for a bond issue and delegation of powers;
W Authorization to issue guarantees;
W Convening of the Ordinary General Meeting and setting of the agenda;
WMiscellaneous.
All the members of the Board, apart from P&E Management, attended
this meeting, as well as the Company’s auditors and the four Works
Council representatives.
The resolutions tabled during this meeting were all adopted unanimously.
Meeting of August 1, 2013:
W Business report;
W Analysis and approval of the individual and consolidated financial
statements as at end June 2013;
W Financial forecast at December 31, 2013;
W Benchmarking of cement companies;
W Strategy;
W Appointments;
W Approval of rules of procedure for the Board of Directors;
W Audit Committee report;
W CO2: problems and changes in regulation;
WMarketing strategy, actions and objectives, impact on sales;
W Authorization to issue guarantees and delegation of powers;
WMiscellaneous.
All the members of the Board attended this meeting, as well as the
Company’s auditors and the four Works Council representatives.
The resolutions tabled during this meeting were all adopted unanimously.
Each director had been sent, with the notice convening the Board
meetings, all the documents and information necessary to fulfill his
function. The minutes of the Board meetings were drafted at the end
of each meeting.
Composition of the Board of Directors:
The Company is managed by a Board of Directors composed of at
least five and no more than twelve members, appointed by the General
Meeting of shareholders for a term of three or six years.
At December 31, 2013, the Board of Directors comprised ten
members, the list of which can be found appended to this report. The
list moreover details the appointments held by each director in other
Group companies.
The Board of Directors consists of individuals who have industry
knowledge, specific knowledge of the Group’s businesses, technical
experience and/or management, corporate and financial experience.

VICAT 2013 ANNUAL REPORT 151
LEGAL INFORMATION
5
5
5
5
5
5
5
5
CHAIRMAN’S REPORT ON CORPORATE GOVERNANCE AND INTERNAL CONTROL
At December 31, 2013, the Board of Directors included six independent
members: Mr. Raynald Dreyfus, P&E Management (company held by Mr.
Paul Vanfrachem), Mr. Jacques Le Mercier, Mr. Pierre Breuil, Mr. Bruno
Salmon and Mr. Xavier Chalandon. Directors not maintaining any direct
or indirect relationship or not having any link of individual interest with
the Company, its subsidiaries, its shareholders or its management are
regarded as independent directors. Moreover, the Company considers
as an independent director, a person who is not bound to the Company
or to the Group by an employment contract, a contract for the provision
of services or by a situation of subordination or dependency with respect
to the Company, the Group, its management or major shareholders or
by a family tie with the majority shareholder.
Under the law of January 27, 2011 on the principle of balanced
representation of men and women on the Board of Directors, it is noted
that Mrs. Sidos Sophie is a member of the Board. In addition, the Board
is endeavoring to achieve the desirable balance in its composition in
order to meet the obligations in question within the deadlines prescribed
by-law. As such, at its meeting of March 7, 2014, the Board of Directors
will be asked to appoint Mrs. Sophie Fégueux to the Board, for a term
of three years, to replace P&E Management represented by Mr. Paul
Vanfrachem, whose mandate ends at the next General Meeting.
Operation of the Board of Directors:
At its meeting of August 1, 2013, the Board of Directors adopted rules
of applicable to all present and future directors, the purpose of which
is to fulfill legal, regulatory and statutory obligations, and to specify:
W the role of the Board;
W the composition of the Board;
W the experience and expertise of members of the Board – Training;
W the independence criteria for directors;
W the operation of the management bodies;
W the structure of meetings of the Board of Directors;
W information on members of the Board;
W the remuneration of the Board of Directors;
W the Board committees;
W the rights and obligations of directors;
W the assessment of the Board’s operation;
W changes to the rules of procedure.
The committees of the Board of Directors:
The Board of Directors has an Audit Committee and a remunerations
committee. The committees are made up of three members, all
independent directors appointed by the Board of Directors having
been proposed by the Chairman and chosen on the basis of their
competencies. Committee members are nominated for the duration of
their term as director. They can be re-elected.
The committee members can be removed at any time by the Board
of Directors, which does not have to justify its decision. A committee
member may resign his role without having to provide reasons for his
decision.
Each committee is chaired by a Chairman appointed by a majority
decision of the committee members. The Chairman of the committee
ensures its proper operation, in particular concerning the convening
and holding of meetings and the provision of information to the Board
of Directors.
Each committee appoints a secretary from among the three members
or from outside the committee and Board of Directors.
The composition of the committees is as follows:
Composition of the Audit Committee:
WMr. Raynald Dreyfus, Chairman of the committee,
WMr. Jacques Le Mercier,
WMr. Pierre Breuil.
Composition of the Remunerations Committee:
WMr. Paul Vanfrachem, Chairman of the committee,
WMr. Raynald Dreyfus,
WMr. Xavier Chalandon.
Operating details of the Committees:
Meetings:
Audit Committee: twice a year and more often at the request of the
Board of Directors.
Remunerations committee: once a year and more often at the request
of the Board of Directors.
The proposals before the committees are adopted by simple majority
of the members present, each member having one vote. The members
may not be represented by proxies at committee meetings.
The deliberations of the committees are recorded in minutes entered
in a special register. Each committee reports to the Board of Directors
on its work.
The Board of Directors may allocate remuneration or attendance fees
to committee members.
Audit Committee role:
The Audit Committee’s role consists in particular in:
W examining the annual and half-yearly financial statements both
consolidated and unconsolidated (with particular attention to the
consistency and the relevance of the accounting policies used);
VICAT 2013 ANNUAL REPORT152
5 LEGAL INFORMATION
CHAIRMAN’S REPORT ON CORPORATE GOVERNANCE AND INTERNAL CONTROL
Wmonitoring the process for preparation of the financial information;
W understanding the internal procedures for gathering and verifying the
financial information that ensure the accuracy of the consolidated
information;
Wmonitoring the effectiveness of the internal control and risk
management systems;
W examining the candidatures of the statutory auditors whose
appointment is proposed to the shareholders’ General Meeting;
W examining every year the auditors’ fees as well as their independence.
The Audit Committee met twice in 2013 with a 100 % attendance rate.
It considered the following issues:
Meeting of February 15, 2013:
W Financial calendar and financial information;
W Annual financial statements for 2012;
W Corporate Social Responsibility (CSR) regulations;
W Security audit of the modes of payment for and progress of the
HORUS project;
W Client risk management;
W Internal audit;
W Audit and auditors.
Meeting of July 26, 2013:
W Financial calendar and financial information;
W Financial statement for first half of 2013;
W Accounting and regulatory changes;
W Developments in the Horus project and developments in the
communication and network platforms;
W Risk management and mapping review;
W Internal audit.
Remunerations committee role:
The remunerations committee has the responsibility of:
W examining the remuneration of managers and employees (fixed
component, variable component, bonuses, etc.) and in particular
their amounts and allocation;
W studying the share subscription or purchase option plans and, in
particular as far as the beneficiaries are concerned, the number of
options that could be granted to them, as well as the term of the
options and the subscription price conditions and any other form
of access to the Company’s share capital in favor of directors and
employees;
W studying certain benefits in particular relating to the pension plan,
health and welfare benefit plan, disability insurance, life insurance,
education allowance, civil liability insurance for directors and senior
managers of the Group, etc.
The Audit Committee met twice in 2013 with a 100 % attendance rate.
It considered the following issues:
Meeting of February 19, 2013:
W Remuneration statistics;
W Fringe benefits.
2. INTERNAL CONTROL AND RISK MANAGEMENT PROCEDURES
Internal control in the Group centers in particular on:
W the Standards and Procedures Department responsible for issuing
or updating the accounting and financial policies to be applied within
the Group;
W financial control reporting to the Finance Department and responsible
for ensuring compliance with standards, procedures, regulations and
good practice;
Wmanagement control reporting to the General Management of the
various businesses;
W internal audit reporting to the Chief Executive Officer of the Group.
An internal control manual was issued to all the Group’s operational
managers and administration and finance teams in 2012. It sets out the
legal obligations and definitions in relation to internal control and lays
down the fundamentals and principles to be adopted in order to achieve
the best guarantee of a high standard of internal control.
Moreover, certain subsidiaries will have an employee in charge of internal
control on a full- or part-time basis.
As such, this person will be responsible for assessing and applying the
procedures in place. This person will also coordinate the follow-up on
recommendations made by external auditors and the internal audit.
Definition and objectives of internal control
According to the AMF (French Financial Market Authority) terms of
reference, which the Company has chosen to apply, internal control is
a measure used to ensure:
W compliance with laws and regulations;
W application of the instructions and directions set by General
Management;
W proper operation of Group internal processes, in particular those
serving to protect assets;
W reliability of financial information.
This system comprises a set of resources, behaviors, procedures and
actions appropriate to the Group’s characteristics that contribute to
controlling its activities, to the effectiveness of its operations and to the
efficient use of its resources.
It should also allow the Group to take into account significant risks,
whether operational, financial or compliance risks. Nonetheless, like any
management control system, it cannot provide an absolute guarantee
that these risks have been completely eliminated.

VICAT 2013 ANNUAL REPORT 153
LEGAL INFORMATION
5
5
5
5
5
5
5
5
CHAIRMAN’S REPORT ON CORPORATE GOVERNANCE AND INTERNAL CONTROL
Application scope
The scope of internal control extends to the parent company and all the
subsidiaries that it controls exclusively or jointly.
Description of the components of internal control
The internal control process is based on an internal organization that
is appropriate to each of the Group’s activities and is characterized by
the extensive senior management responsibility for operational control.
The Group specifies procedures and operating principles for its
subsidiaries, particularly in relation to the development and treatment
of accounting and financial information, and taking into account the
risks inherent in each of the businesses and markets in which the Group
operates, in compliance with the directives and common rules defined
by the Group’s management.
As far as information management tools are concerned, the Group
steers and monitors the course of its industrial (in particular supply,
production and maintenance), and commercial (sales, shipping and
credit management) activities, and converts this information into
accounting information using either integrated software packages
recognized as standard on the market, or specific applications
developed by the Group’s Information Systems Department.
In this context, the Group has been engaged since 2009 in a progressive
updating of its information systems, with a view to standardizing the
tools used, improving the security and speed of the processing of data
and transactions and facilitating the integration of new entities. This
overhaul involves the technical infrastructure on the one hand and the
transaction processes and applications supporting such processes on
the other. It led the Group to put the SAP integrated management
software system in place at Vicat SA in France. This software system has
been integrated into the Company’s entire operations. The system will
also be implemented in the Concrete & Aggregates business in 2014.
This project will be extended in the coming years to the Group’s other
French businesses and then to its international businesses.
The Company has set up a system for steering by General Management
and the business units concerned, allowing for informed and quick
decisions.
This system comprises:
W daily reports of production from the plants;
W reviews of weekly activity by the operational unit (country or subsidiary);
Wmonthly operational and financial reviews (factory performance,
industrial and commercial performance indicators) analyzed by the
Group’s financial controllers with reference to the budget and to the
previous financial year;
Wmonthly reports presenting the consolidated income statements
broken down by country and business sector, and reconciled with
the budget;
Wmonthly consolidated cash flow and indebtedness reports broken
down by country and business sector;
W regular visits by General Management to all subsidiaries, during
which the results and the progress of commercial and industrial
operations are presented, allowing them to assess the implementation
of guidelines and to facilitate information exchanges and decision-
making.
Constant improvements in decision-making structures will continue in
2014, as in 2013.
Risk analysis and management
Risk management is included in the responsibilities of the various
levels of operational management. If applicable, the various reports on
activities described above include items on risk.
Major risks are then analyzed and, if applicable, managed in conjunction
with General Management. An overview of the main risks that the Group
is exposed to is presented every year in section 6 of the Registration
Document published by the Company; in particular, this addresses:
W industrial risks including those related to industrial equipment and to
product quality defects, and those related to the environment;
Wmarket risks, in particular: foreign exchange risk, conversion risks,
liquidity risk and interest rate risks.
Internal Audit has undertaken a process of risk identification and
analysis. After identification of the risks through discussions with the
Group’s key operational and functional managers and a subsequent
analysis phase conducted in conjunction with General Management, this
study enabled a mapping of the risks to which the Group is exposed.
This risk matrix is regularly reviewed and updated if necessary.
The Internal Audit Department is attached to the Group’s General
Management and can intervene in all the Group’s activities and
subsidiaries. It works in accordance with an annual audit plan intended
to cover the main risks identified within the Company, in particular those
relating to accounting and financial information.
The audits are the subject of reports submitted to management, General
Management and the Audit Committee. They comprise overview reports
specifically targeted at Senior management, and detailed reports used
inter alia to make the operational staff concerned aware of any findings
and recommendations proposed.
The implementation of action plans is the subject of formal monitoring
by the Internal Audit Department in a specific report.

VICAT 2013 ANNUAL REPORT154
5 LEGAL INFORMATION
CHAIRMAN’S REPORT ON CORPORATE GOVERNANCE AND INTERNAL CONTROL
3. CORPORATE GOVERNANCE
The Board of Directors decided at the meeting on August 2, 2012 to
adopt the Chairman’s proposal to implement the Middlenext Corporate
Governance Code published in December 2009 and available on the
website www.middlenext.com.
Consequently, the Middlenext Code is the reference code for the
preparation of this report, specified in article L.225-37 of the French
Commercial Code (see governance statement in section 4.2.1.4 of the
Registration Document)
4. REMUNERATION OF THE COMPANY’S OFFICERS
Policy on remuneration of the Company’s officers
The Company has decided to apply the recommendations relating to the
remuneration of executive directors of listed companies, seeing as they
are aligned with the good governance principles which the Company
has always followed.
The Company’s position with respect to these recommendations is
as follows:
Wmeasures have been taken to ensure that Company executive officers
are not bound to the Company by an employment contract;
W no severance pay is provided for Company executive officers;
W the supplementary pension plans in place in the Company from
which Company executive officers and some non-executive officers
benefit are subject to strict rules. The amount of the additional
pension benefits may, in particular, not result in the beneficiaries
receiving, under all pension benefits, an amount exceeding 60 % of
the reference salary;
W the Company has not instituted a share purchase or share subscription
option policy or a performance-related share award scheme;
W in accordance with the recommendations on transparency for all
items in the remuneration package, the Company will adopt the
presentation recommended by its set of standards and will publish
this information, in particular in its Registration Document.
The current remuneration of company officers is less than the average
remuneration noted.
Policy for determining the remuneration of the non-executive directors
The Chairman of the Board of Directors has, in accordance with the
recommendations on corporate governance, monitored compliance
with the following principles:
A) EXHAUSTIVENESSThe remuneration of non-executive directors was determined and
evaluated overall for each of them. It comprises:
W a fixed remuneration;
W attendance fees;
W a top-up pension plan;
W benefits in kind.
For the record, no director receives a variable remuneration, or share
options, or a free share allotment, or severance payments.
B) BENCHMARKINGThe remuneration of the non-executive directors was compared with
the remuneration published by French companies and groups in the
same sector, and with reference to industrial companies comparable
in terms of earnings or sales. This revealed that current remunerations
are lower than average remunerations.
C) CONSISTENCYThe consistency of remunerations between the various non-executive
directors could be checked on the basis the following criteria:
W professional experience and training;
W years of service;
W level of responsibility.
D) SIMPLICITY AND STABILITY OF THE RULESThe absence of variable remuneration and allocation of share options
or free allocation of shares allows for simplicity and stability in the rules
for setting remunerations.
E) MEASUREMENTThe remuneration of the non-executive directors, taking into account the
amount and the fact that it is largely of a fixed nature, are compatible with
the general interests of the Company and are consistent with market
practices in this sector of industry.
Policy of allocating share options and free allocations of shares
The Company has not instituted a share options policy or a free share
award scheme.

VICAT 2013 ANNUAL REPORT 155
LEGAL INFORMATION
5
5
5
5
5
5
5
5
CHAIRMAN’S REPORT ON CORPORATE GOVERNANCE AND INTERNAL CONTROL
5. SHAREHOLDER PARTICIPATION AT THE GENERAL MEETING
The participation of shareholders in the General Meeting is not subject
to specific details or procedures and is governed by the law and by
article 25 of the Company by-laws reproduced below:
Article 25 - Attendance and representation at meetings
Any shareholder can attend, personally or through a representative,
the Meetings by providing proof of ownership of his shares provided
this is supported, in accordance with the law and the regulations in
force, by registration of his shares in his name or that of his registered
representative, in accordance with the seventh paragraph of
article L. 228-1 of the French Commercial Code, by the third working
day before the date of the Meeting at midnight, either in the registered
securities accounts held by the Company, or in the bearer’s securities
accounts held by the registered representative.
The registration of shares in securities accounts as bearer’s securities
held by the authorized representative is confirmed by a share certificate
submitted by the latter in accordance with the laws and regulations in
force.
Participation in General Meetings is subject to proof of holding at least
one share.
6. POWERS OF THE CHAIRMAN AND OF THE CEO
In accordance with article 21 of the Company’s by-laws, the Board of
Directors decided by a decision of March 7, 2008 to opt for a separation
of the functions of Chairman of the Board of Directors and the Chief
Executive Officer.
Mr. Jacques Merceron-Vicat has been reappointed as Chairman of the
Board of Directors for the remaining duration of his term of office as
director, i.e. until the General Meeting of 2016, which will be called
upon to approve the financial statements for the fiscal year ending on
December 31, 2015.
M. Guy Sidos was reappointed as Chief Executive Officer until the
General Meeting of 2016 which will be called to approve the financial
statements for the fiscal year ending December 31, 2015.
No limitation was placed on the powers of the Chairman of the Board
of Directors or those of the CEO.
At its meeting of March 7, 2014, the Board of Administrators will be
asked to:
W take note of the decision by Mr. Jacques Merceron-Vicat to step down
from his position as Chairman of the Board of Directors at the end of
the Ordinary General Meeting of May 6, 2014;
W decide, in accordance with the provisions of article 21 of the
Company’s by-laws, to combine the duties of the Chairman of the
Board of Directors and the Chief Executive Officer, with effect at the
end of the Ordinary General Meeting of May 6, 2014;
W elect Mr. Guy Sidos as Chairman of the Board of Directors, with effect
at the end of the General Meeting of May 6, 2014, and re-appoint
him as Chief Executive Officer;
W elect Mr. Jacques Merceron-Vicat as Honorary Chairman of the
Company.
Paris
February 24, 2014
The Chairman of the Board of Directors
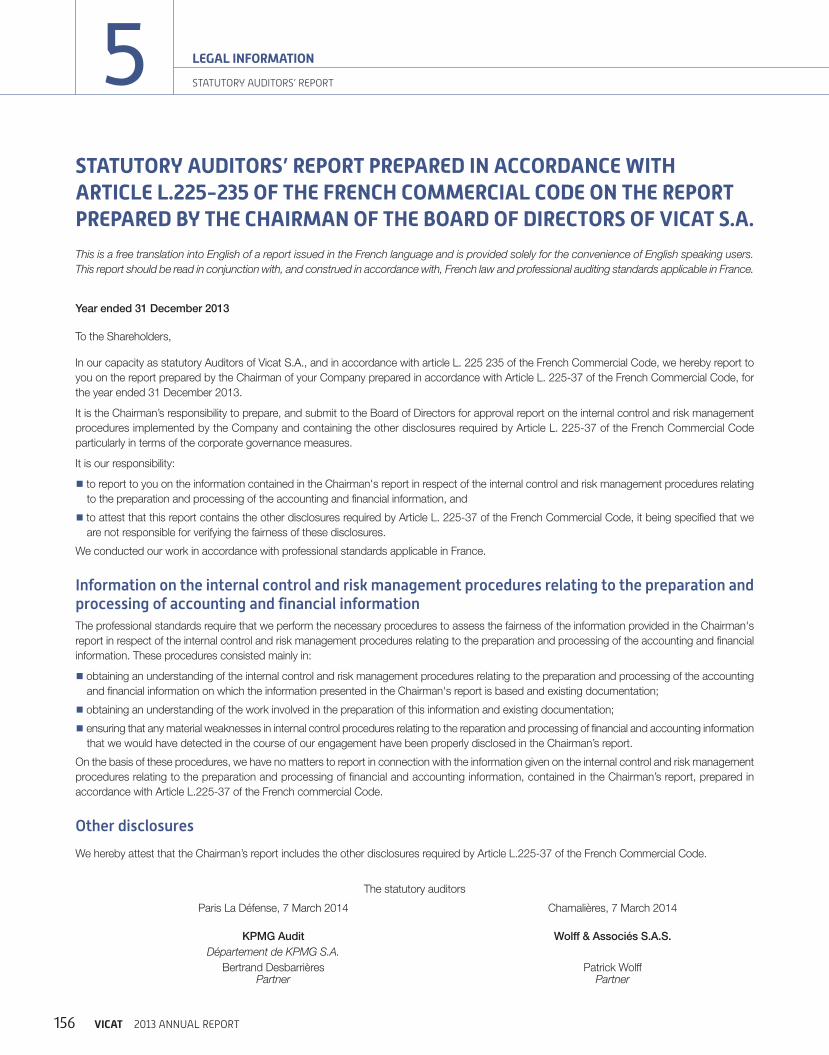
VICAT 2013 ANNUAL REPORT156
5 LEGAL INFORMATION
STATUTORY AUDITORS’ REPORT
STATUTORY AUDITORS’ REPORT PREPARED IN ACCORDANCE WITH ARTICLE L.225-235 OF THE FRENCH COMMERCIAL CODE ON THE REPORT PREPARED BY THE CHAIRMAN OF THE BOARD OF DIRECTORS OF VICAT S.A.
This is a free translation into English of a report issued in the French language and is provided solely for the convenience of English speaking users.
This report should be read in conjunction with, and construed in accordance with, French law and professional auditing standards applicable in France.
Year ended 31 December 2013
To the Shareholders,
In our capacity as statutory Auditors of Vicat S.A., and in accordance with article L. 225 235 of the French Commercial Code, we hereby report to
you on the report prepared by the Chairman of your Company prepared in accordance with Article L. 225-37 of the French Commercial Code, for
the year ended 31 December 2013.
It is the Chairman’s responsibility to prepare, and submit to the Board of Directors for approval report on the internal control and risk management
procedures implemented by the Company and containing the other disclosures required by Article L. 225-37 of the French Commercial Code
particularly in terms of the corporate governance measures.
It is our responsibility:
W to report to you on the information contained in the Chairman's report in respect of the internal control and risk management procedures relating
to the preparation and processing of the accounting and financial information, and
W to attest that this report contains the other disclosures required by Article L. 225-37 of the French Commercial Code, it being specified that we
are not responsible for verifying the fairness of these disclosures.
We conducted our work in accordance with professional standards applicable in France.
Information on the internal control and risk management procedures relating to the preparation and processing of accounting and financial informationThe professional standards require that we perform the necessary procedures to assess the fairness of the information provided in the Chairman's
report in respect of the internal control and risk management procedures relating to the preparation and processing of the accounting and financial
information. These procedures consisted mainly in:
W obtaining an understanding of the internal control and risk management procedures relating to the preparation and processing of the accounting
and financial information on which the information presented in the Chairman's report is based and existing documentation;
W obtaining an understanding of the work involved in the preparation of this information and existing documentation;
W ensuring that any material weaknesses in internal control procedures relating to the reparation and processing of financial and accounting information
that we would have detected in the course of our engagement have been properly disclosed in the Chairman’s report.
On the basis of these procedures, we have no matters to report in connection with the information given on the internal control and risk management
procedures relating to the preparation and processing of financial and accounting information, contained in the Chairman’s report, prepared in
accordance with Article L.225-37 of the French commercial Code.
Other disclosures
We hereby attest that the Chairman’s report includes the other disclosures required by Article L.225-37 of the French Commercial Code.
The statutory auditors
Paris La Défense, 7 March 2014 Chamalières, 7 March 2014
KPMG Audit Wolff & Associés S.A.S.
Département de KPMG S.A.
Bertrand Desbarrières Patrick WolffPartner Partner

VICAT 2013 ANNUAL REPORT 157
LEGAL INFORMATION
5
5
5
5
5
5
5
5
TEXT OF THE RESOLUTIONS PROPOSED AT THE COMBINED GENERAL MEETING OF MAY 6, 2014
TEXT OF THE RESOLUTIONS PROPOSED AT THE COMBINED GENERAL MEETING OF MAY 6, 2014
RESOLUTIONS FOR THE ORDINARY GENERAL MEETING
FIRST RESOLUTION
Approval of the financial statements and operations for the year ended December 31, 2013
Further to taking cognizance of the Board of Directors’ reports and the
statutory auditors’ general report on the financial statements for the
financial year ended December 31, 2013, the Ordinary General Meeting
approves the financial statements for the said financial year as presented
thereto, including the operations specified and summarized therein.
It finalizes net income for the said financial year at €224,461,751.
Accordingly, it provides full and unconditional discharge to the Board
of Directors for the performance of the latter’s mandate during the said
financial year.
SECOND RESOLUTION
Approval of the consolidated financial statements for the year ended December 31, 2013
Further to taking cognizance of the Board of Directors’ report on
the management of the Group and the statutory auditors’ report on
the consolidated financial statements for the financial year ended
December 31, 2013, the Ordinary General Meeting approves the
consolidated financial statements for the said financial year as presented
thereto, including the operations specified and summarized therein.
It finalizes the consolidated income of the Group for the said financial
year at €123,241,000, of which €120,259,000 was the Group’s share
of net income.
THIRD RESOLUTION
(Appropriation of earnings and dividend amount)
Further to recording the existence of distributable profits, the Ordinary
General Meeting approves the appropriation and distribution thereof as
proposed by the Board of Directors:
W net income for the 2013 financial year €224,461,751
W retained earnings carried forward €201,333,800
W total €425,795,551
Appropriation:
W dividend €67,350,000
(based on the current share capital of 44,900,000 shares with a
nominal value of €4)
W allocation to other reserve accounts €153,445,551
W retained earnings €205,000,000
and accordingly fixes the dividend to be distributed for the 2013 financial
year at the gross amount of €1.50 per share (excluding levies).
The said dividend shall be released for payment as of May 16, 2014,
at the registered office and by the banks, pursuant to the provisions
relating to the dematerialization of transferable securities.
The Ordinary General Meeting records that the dividends paid out per
share, for a comparable number of shares, in the three previous financial
years were as follows:
Financial year Dividend paid out
W 2010 €1.50
W 2011 €1.50
W 2010 €1.50
It is noted that the aforementioned dividend amounts take account of all
existing shares. When released for payment, the dividends on treasury
shares will be allocated to the “retained earnings” account.
The dividends are eligible for a tax allowance at the rates and on the
conditions specified in article 158-3 of the French General Tax Code.
FOURTH RESOLUTION
(Approval of regulated agreements)
Further to taking cognizance of the special report issued by the
statutory auditors relating to operations specified in article L. 225-38 of
the French Commercial Code, the Ordinary General Meeting formally
acknowledges the conclusions of the said report and approves the
agreements specified therein.
FIFTH RESOLUTION
(Authorization to empower the Board of Directors to purchase, hold or transfer Company shares and approval of the share buy-back program)
Further to taking cognizance of the Board of Directors’ special report
and the description of the share buy-back program specified in the
annual report, the Ordinary General Meeting hereby authorizes the
Board of Directors to purchase, hold or transfer Company shares,
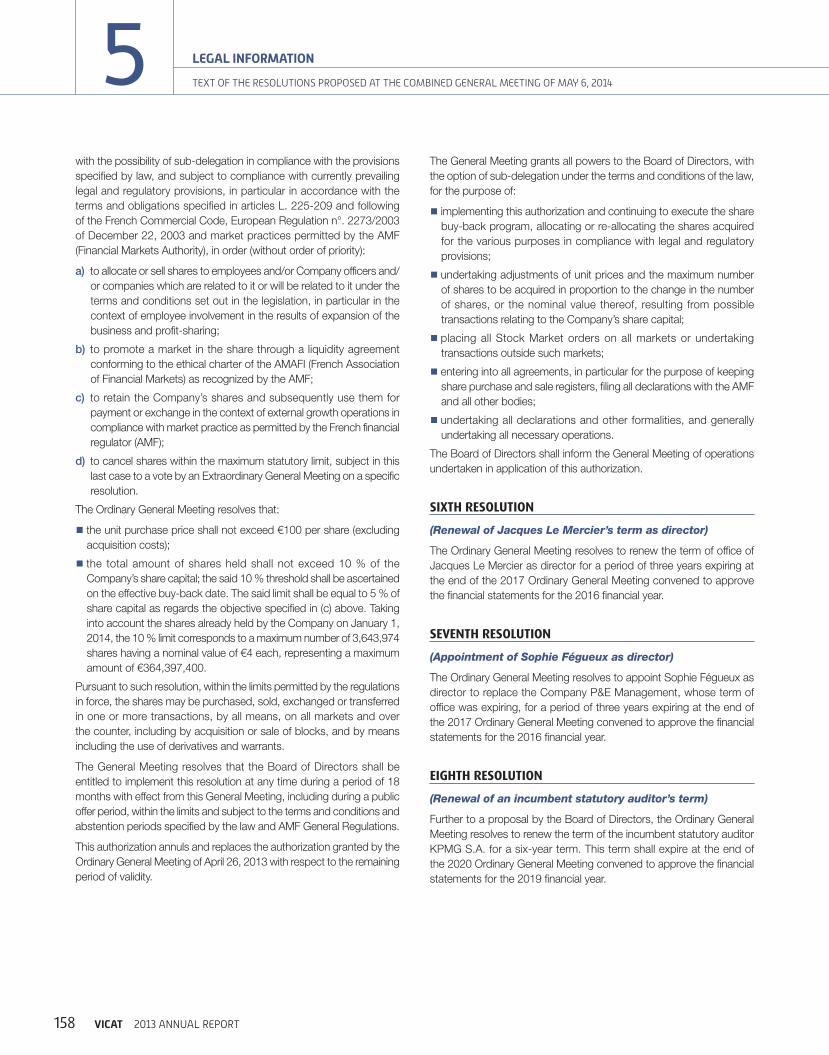
VICAT 2013 ANNUAL REPORT158
5 LEGAL INFORMATION
TEXT OF THE RESOLUTIONS PROPOSED AT THE COMBINED GENERAL MEETING OF MAY 6, 2014
with the possibility of sub-delegation in compliance with the provisions
specified by law, and subject to compliance with currently prevailing
legal and regulatory provisions, in particular in accordance with the
terms and obligations specified in articles L. 225-209 and following
of the French Commercial Code, European Regulation n°. 2273/2003
of December 22, 2003 and market practices permitted by the AMF
(Financial Markets Authority), in order (without order of priority):
a) to allocate or sell shares to employees and/or Company officers and/
or companies which are related to it or will be related to it under the
terms and conditions set out in the legislation, in particular in the
context of employee involvement in the results of expansion of the
business and profit-sharing;
b) to promote a market in the share through a liquidity agreement
conforming to the ethical charter of the AMAFI (French Association
of Financial Markets) as recognized by the AMF;
c) to retain the Company’s shares and subsequently use them for
payment or exchange in the context of external growth operations in
compliance with market practice as permitted by the French financial
regulator (AMF);
d) to cancel shares within the maximum statutory limit, subject in this
last case to a vote by an Extraordinary General Meeting on a specific
resolution.
The Ordinary General Meeting resolves that:
W the unit purchase price shall not exceed €100 per share (excluding
acquisition costs);
W the total amount of shares held shall not exceed 10 % of the
Company’s share capital; the said 10 % threshold shall be ascertained
on the effective buy-back date. The said limit shall be equal to 5 % of
share capital as regards the objective specified in (c) above. Taking
into account the shares already held by the Company on January 1,
2014, the 10 % limit corresponds to a maximum number of 3,643,974
shares having a nominal value of €4 each, representing a maximum
amount of €364,397,400.
Pursuant to such resolution, within the limits permitted by the regulations
in force, the shares may be purchased, sold, exchanged or transferred
in one or more transactions, by all means, on all markets and over
the counter, including by acquisition or sale of blocks, and by means
including the use of derivatives and warrants.
The General Meeting resolves that the Board of Directors shall be
entitled to implement this resolution at any time during a period of 18
months with effect from this General Meeting, including during a public
offer period, within the limits and subject to the terms and conditions and
abstention periods specified by the law and AMF General Regulations.
This authorization annuls and replaces the authorization granted by the
Ordinary General Meeting of April 26, 2013 with respect to the remaining
period of validity.
The General Meeting grants all powers to the Board of Directors, with
the option of sub-delegation under the terms and conditions of the law,
for the purpose of:
W implementing this authorization and continuing to execute the share
buy-back program, allocating or re-allocating the shares acquired
for the various purposes in compliance with legal and regulatory
provisions;
W undertaking adjustments of unit prices and the maximum number
of shares to be acquired in proportion to the change in the number
of shares, or the nominal value thereof, resulting from possible
transactions relating to the Company’s share capital;
W placing all Stock Market orders on all markets or undertaking
transactions outside such markets;
W entering into all agreements, in particular for the purpose of keeping
share purchase and sale registers, filing all declarations with the AMF
and all other bodies;
W undertaking all declarations and other formalities, and generally
undertaking all necessary operations.
The Board of Directors shall inform the General Meeting of operations
undertaken in application of this authorization.
SIXTH RESOLUTION
(Renewal of Jacques Le Mercier’s term as director)
The Ordinary General Meeting resolves to renew the term of office of
Jacques Le Mercier as director for a period of three years expiring at
the end of the 2017 Ordinary General Meeting convened to approve
the financial statements for the 2016 financial year.
SEVENTH RESOLUTION
(Appointment of Sophie Fégueux as director)
The Ordinary General Meeting resolves to appoint Sophie Fégueux as
director to replace the Company P&E Management, whose term of
office was expiring, for a period of three years expiring at the end of
the 2017 Ordinary General Meeting convened to approve the financial
statements for the 2016 financial year.
EIGHTH RESOLUTION
(Renewal of an incumbent statutory auditor’s term)
Further to a proposal by the Board of Directors, the Ordinary General
Meeting resolves to renew the term of the incumbent statutory auditor
KPMG S.A. for a six-year term. This term shall expire at the end of
the 2020 Ordinary General Meeting convened to approve the financial
statements for the 2019 financial year.

VICAT 2013 ANNUAL REPORT 159
LEGAL INFORMATION
5
5
5
5
5
5
5
5
TEXT OF THE RESOLUTIONS PROPOSED AT THE COMBINED GENERAL MEETING OF MAY 6, 2014
NINTH RESOLUTION
(Renewal of an alternate statutory auditor’s term)
Following a proposal by the Board of Directors, the Ordinary General
Meeting resolves to renew the term of the alternate statutory auditor
Cabinet Exponens Conseil et Expertise for six year. This term shall expire
at the end of the 2020 Ordinary General Meeting convened to approve
the financial statements for the 2019 financial year.
TENTH RESOLUTION
(Powers)
The Ordinary General Meeting hereby grants all powers to the bearer
of a copy or abstract of the minutes of this meeting for the purpose
of performing all legal or administrative formalities, filings and publicity
specified by current legislation.
RESOLUTIONS FOR THE EXTRAORDINARY GENERAL MEETING
ELEVENTH RESOLUTION
(Proposal of an increase in capital reserved for employees)
Further to taking cognizance of the Board of Directors’ report, the
Extraordinary General Meeting:
W formally acknowledges that, pursuant to the provisions of article
L. 225 129-6 of the French Commercial Code, an Extraordinary General
Meeting must be convened every three years to vote on a proposed
resolution on an increase in capital carried out under the terms of
article L. 3332-18 and following of the French Labor Code;
W but believes that these very general provisions are not useful to the
Company with regard to its employee profit-sharing plan established
many years ago and the option offered to these employees to
participate in the Group savings plan.
However, to comply with legal provisions, it authorizes the Board of
Directors to carry out, on one or more occasions, on its sole decision
and if it deems it useful, a cash capital increase under the terms defined
in article L. 3332-18 and following of the French Labor Code.
The total number of shares that may be subscribed cannot exceed 0.5 %
of the share capital.
The General Meeting resolves expressly to waive shareholders’ pre-
emptive subscription rights to new shares to be issued for employees
participating in the Group savings plan.
This authorization is granted for 36 months as of the date of this meeting.
The General Meeting grants all powers to the Board of Directors to set
all terms for future operation(s) and in particular to determine the issue
price of new shares and grants all powers to acknowledge the capital
increase(s) carried out to fulfill this authorization, amend the by-laws
accordingly and more generally take any other necessary steps.
TWELFTH RESOLUTION
(Powers)
The Ordinary General Meeting hereby grants all powers to the bearer
of a copy or abstract of the minutes of this meeting for the purpose
of performing all legal or administrative formalities, filings and publicity
specified by currently prevailing legislation.
VICAT 2013 ANNUAL REPORT160
5 LEGAL INFORMATION
STATUTORY AUDITORS’ REPORT
STATUTORY AUDITORS’ REPORT IN RELATION WITH THE SHARE CAPITAL INCREASE TO THE BENEFIT OF THE EMPLOYEES MEMBERS OF THE COMPANY’S SAVING PLAN
This is a free translation into English of the statutory auditors’ report issued in French and is provided solely for the convenience of English speaking
readers. This report should be read in conjunction with, and construed in accordance with, French law and professional auditing standards applicable
in France.
Combined Shareholders’ Meetings of May 6, 2014 – Eleventh resolution
To the Shareholders,
In our capacity as statutory auditors of your Company and pursuant to articles L. 225-135 et seq. of the French Commercial Code (Code de
commerce), we hereby report to you on the proposed of share capital increase through the issue of ordinary shares with cancellation of pre-emptive
subscription rights, reserved for employee members of a company saving plan of your Company up to a maximum amount of 0.5% of the share
capital, on which you are required to vote.
Shareholders are required to approve this share capital increase pursuant to article L. 225-129-6 of the French Commercial Code and article L. 3332-18
et seq. of the French Labor Code (Code du travail).
Your Management Board recommends that, based on his report and for a period of 36 months, you delegate to him the authority to decide a share
capital increase and cancel your pre-emptive subscription rights to the ordinary shares to be issued. The Board would also decide the final terms
of the issue, if appropriate.
The Management Board is responsible for preparing a report on the proposed issue in accordance with articles R. 225-113 and R. 225-114 of
the French Commercial Code. Our role is to express a conclusion on the fairness of the quantified data extracted from the financial statements, on
the proposed cancellation of pre-emptive subscription rights and on certain other information pertaining to the issuance as presented in this report.
We performed the procedures that we considered necessary in accordance with the professional guidelines of the French National Institute of Statutory
Auditors (Compagnie nationale des commissaires aux comptes) applicable to this engagement. Such procedures consisted in verifying the content of
the Management Board’s report as it relates to this transaction and the terms and conditions governing the determination of the issue price of shares.
Subject to a subsequent review of the final terms of any share capital increase that may be decided, we have nothing to report concerning the
proposed method of determining the issue price of the shares, as described in the Management Board’s report.
As the final terms and conditions of the share capital increase have not been determined, we do not express a conclusion thereon and, consequently,
on the proposed cancellation of pre-emptive subscription rights on which you are being required to vote.
In accordance with article R. 225-116 of the French Commercial Code, we will issue a further report if and when the Management Board decides
to use this authorization.
The statutory auditors
Paris La Défense, March 7, 2014 Chamalières, March 7, 2014
KPMG Audit Wolff & Associés S.A.S.
Département de KPMG S.A.
Bertrand Desbarrières Patrick Wolff
Partner Partner

This document was printed in France by an imprim’Vert-certified printing company,
on recyclable, chlorine-free, PEFC-certified paper using pulp from forests managed according
to sustainable environmental, economic and social principles.
Financial section printed on white paper by Papeteries de Vizilles.
© V
ica
t, G
eo
rge
s P
om
pid
ou
cu
ltu
ral c
en
ter
in M
etz
, bu
ilt w
ith
co
nc
rete
su
pp
lied
by
Bé
ton
Vic
at
(Fra
nc
e).
A French société anonyme with a share capital of €179,600,000Registred Offi ce:
Tour Manhattan - 6, place de l’Iris 92095 Paris-La Défense Cedex - France
Tel.: +33 (0)1 58 86 86 86 - Fax: +33 (0)1 58 86 87 87
Registred with the Trade and Companies Register of Nanterre under the number 057 505 539
Copies of this Registration Document are available free of charge from Vicat, as well as on the Vicat websites (www.vicat.fr)and on the Autorité des marchés financiers (AMF),
French market regulator website (www.amf-france.org).


