40
Crime Scene Assistance Crisis Intervention Advocacy Criminal Justice Procedures Crime Victims Compensation VICTIM SERVICES IN TEXAS WHERE WE ARE & WHERE WE NEED TO BE
Crime Scene
Assistance Crisis
Intervention
Advocacy
Criminal Justice
Procedures
Crime Victims
Compensation
VICTIM SERVICES IN TEXAS
WHERE WE ARE & WHERE WE NEED TO BE


…from the Director
Texas has been a leader in augmenting victims’ rights and services since the 1980s. For example, the Crime Victims’ Bill of Rights was added to the Texas Constitution in 1989. The Bill of Rights provides vic-tims with the right to be treated with fairness, respect and dignity throughout the criminal justice process; to be reasonably protected from the accused; to be notified of proceedings; to be present unless the victim is a wit-ness; and to confer with a representative of the prosecutor’s office. Laws have been passed requiring district attorneys’ offices and law enforcement agencies to have a person designated as a victim services provider. Community agencies have been developed to assist victims of crime whether or not they had reported the crime to law enforcement. Shelters have been set up to provide lodging and support for victims of domestic violence.
For all of the strides that have been made on behalf of victims, this report takes a look at what we ar
doing well, and considers ways we can do better. It is our hope that this will stimulate creative thinking and innovative approaches to better serving victims of crime in Texas.
Glen A. Kercher
Mission Statement
The Mission of the Crime Victims’ Institute is to
• Conduct research to examine the impact of crime on victims of all ages in order to promote a better understanding of victimiza-tion,
• Improve services to victims, • Assist victims of crime by giving them a voice, • Inform victim-related policymaking at the state and local levels.

Table of Contents From the Director 3
Executive Summary 5
Victim Service Providers 9
Coordination and Linkages Among Service Providers 9
Victim Service Delivery: Rural vs. Urban 10
Methodology 11
Study Participants 11
Survey Questionnaire 12
Interviews 12
Response Rates for the Survey 13
Data Analysis and Findings 14
Victim Service Provider Issues 14
Top Funding Sources 14
Staffing Level 15
Changes in the Past Three Years 17
Priority of Victim Services among VACs and VLOs 17
Mission Statement 18
Methods Used to Contact Victims 18
Gaps In Service Delivery 19
Provided Services 19
Services Not Provided 21
Barriers to Service Delivery 23
Barriers Reported by Victim Assistance Coordinators 23
Barriers Reported by Victim Liaison Officers 24
Barriers Reported by Community Victim Advocates 25
Why Some Victims Do Not Use Victim Services 26
Coordination and Linkages Among Service Providers 27
Victim Service Delivery: Rural vs. Urban 32
Discussion and Recommendations 34
Funding 35
Staffing 35
Training 36
Coordination Among Service Providers 36
Public Awareness Initiatives 36
Rural and Urban Differences 36
Endnotes 37
Table 1. Comparison of Texas County Population and Percentage of VLOs Responding to the Survey 13
Table 2. Services Provided by Victim Services Providers 20
Table 3. Services Requested Across All Providers but Not Available 22
Table 4. Items Used in Victim Orientation Scale 30
List of Tables
Victim Services In Texas: Where We Are and Where We Need To Be 7

List of Figures Figure 1. Annual Trend in the Amount of Compensation Dispensed in Texas (1980-2005) 8
Figure 2. Service Provider Response Rates 13
Figure 3. Funding Sources for Victim Service Programs 14
Figure 4. Average Number of Personnel by Agency 15
Figure 5. Gender Distribution Among Victim Service Providers 15
Figure 6. Race/Ethnicity of Victim Service Personnel 16
Figure 7. Race/Ethnicity of Victims Served 16
Figure 8. Staffing Increase vs. Victim Increase (over past 3 years) 17
Figure 9. Priority of Victim Services Among VACs and VLOs 17
Figure 10. Agency Mission Statements that Specifically Address Victim Services 18
Figure 11. Methods of Victim Contact 19
Figure 12. Reasons for Not Using Services 26
Figure 13. Degree of Inter-Agency Communication and Cooperation as Perceived by VACs 28
Figure 14. Degree of Inter-Agency Communication and Cooperation as Perceived by VLOs 28
Figure 15. Degree of Inter-Agency Communication and Cooperation as Perceived by Community Victim Advocates 28
Figure 16. Victim-Orientation Scale Scores 31
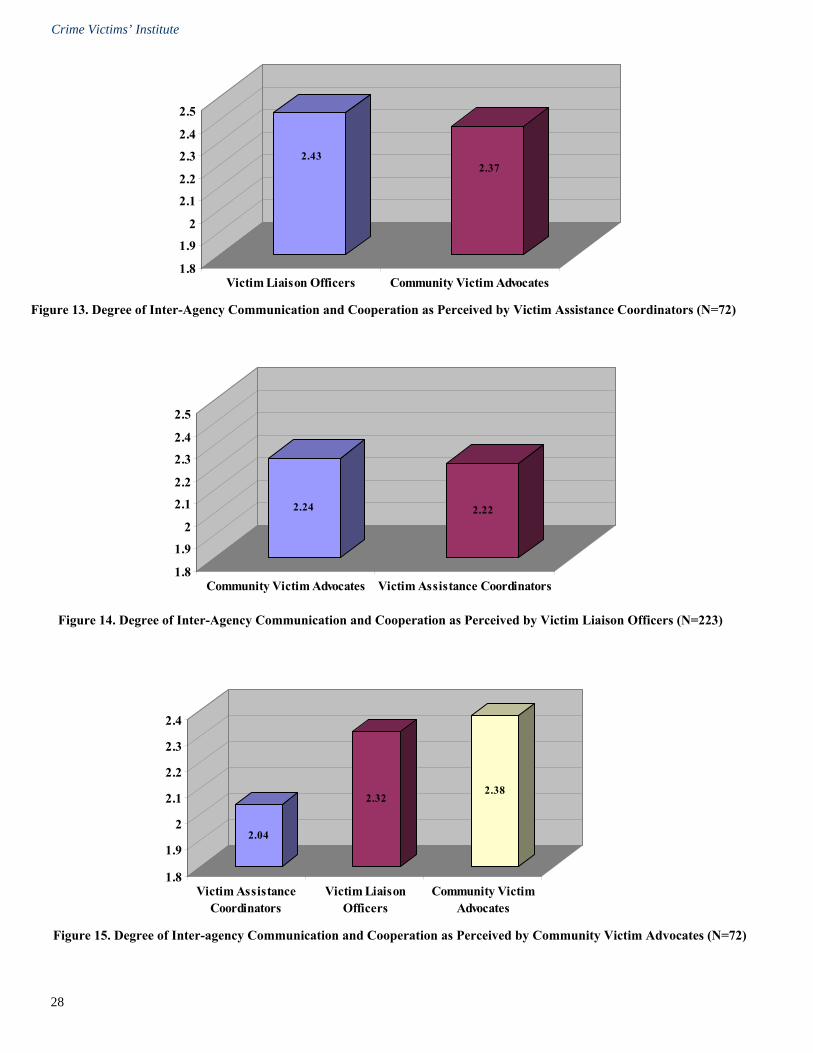
Figure 17. Providers Reporting a Community Committee or Task Force 32
Figure 18. Rural vs. Urban Service Providers 32
Figure 19. Funding Sources/Urban and Rural Service Providers 33
EXECUTIVE SUMMARY
The purpose of this study was to examine the provision of victim services in Texas. Surveys were sent to victim service pro-viders in prosecutors’ offices, law enforcement departments, and community victim services agencies across the state. A number of interviews were also conducted with representatives from each type of agency. Participants were asked about the organization and funding for their programs, the range of services provided, and coordination with other agencies in the community. Funding • Victim Assistance Coordinators (VACs) in prosecutors’ offices and Victim Liaison Officers (VLOs) in law enforcement agencies
get most of their funding from state and county sources. • Community Victim Service Agencies get most of their funding from federal and state moneys. Staffing • The majority of victim services providers in prosecutors’ offices and in community agencies are women. • In law enforcement agencies female providers only slightly outnumber male providers. • Less than half (43%) of the VACs indicated that victim assistance is their highest priority. • Only 20% of the VLOs stated that victim assistance is their highest priority. Victims Served • The race/ethnicity of victims served by service providers approximates that of the Texas population in general. • The majority of service providers reported an increase in the number of victims served over the past 3 years. • Staffing levels did not keep pace with the increase in victims served. Communication with Victims • VACs use written communication more than the other two groups. • All groups use face-to-face contact and phone calls the most, but this is more true for workers in community agencies. Services Provided • The services that are most frequently provided by all three groups include referral, explanation of criminal justice process, Victim
Impact Statements, and compensation assistance. • The least frequently offered services are medical care, security repair, mediation, child care, and insurance claims aid.

Crime Victims’ Institute
6
• Emergency services and counseling are more likely to be provided by community victim advocates. • Assistance with restitution and compensation is regularly provided by VACs. • Services that are frequently requested but not provided: security repair, financial assistance, child care, mediation, legislative
advocacy, paralegal/legal assistance, and completing insurance claims. Barriers to Victim Services Delivery Among Victim Assistance Coordinators • Insufficient funding and staffing. • Constraints in assisting victims because of other duties in the office. • Uncooperative attorneys. • Insufficient training for law enforcement officers on handling victims. • Judges and prosecutors unwilling to make victims a priority. • Inadequate training for prosecutors and judges concerning their responsibilities to victims . • Victims who do not respond to attempts to contact them. Barriers to Victim Services Delivery Reported by Victim Liaison Officers • Insufficient funding. • Law enforcement personnel do not know about the program. • Police officers and sheriff's deputies do not understand victims’ rights. • Corrections, Parole, and CPS are reluctant to cooperate with victim services agencies. • Excessive paperwork. • Victims are not always open to available services. Barriers to Victim Services Delivery Reported by Community Victim Advocates • Reductions in funding, competition for funds, and tougher grant guidelines. • Uncertain funding from year-to-year. • Grant reporting requirements. • Police officers are poorly trained for meeting victims’ needs. • Lack of sensitivity about victim needs by judges and prosecutors. • Victims are not aware of services available. Why Some Victims Do Not Use Victim Services • 33% receive assistance from families or friends. • 44% are not aware of available services. • 49% decide it is too much trouble to get the services. Coordination Among Service Providers • Communication among service providers in Texas appears to be at an acceptable level. • Most victim services providers in district attorney and law enforcement agencies believe that advocates in community agencies
provide realistic expectations about criminal justice procedures. • Regardless of the agency they represent, victim service providers appear to be victim oriented. • Communities with a multidisciplinary committee comprised of representatives from the various victim services programs pro-
vide 55% more services than communities without such coordination. Urban Versus Rural Service Delivery • Almost three quarters of victim services programs operate in the rural areas (population <50,000) of Texas. • 41% of the urban victim service programs receive major funding from federal and state sources. • 20% of the rural victim service programs receive major funding from federal and state sources. • Victim service providers in urban programs receive twice as much training as those in rural programs. Implications • Increase funding for victim services around the state. • Require each agency to have at least one person whose only priority is serving victims. • Improve training for victim services personnel, prosecutors, and police officers. • Enhance public awareness campaigns about victim services.

Crime Victims’ Institute
7
VICTIM SERVICES IN TEXAS: Where We Are and Where We Need To Be
Ilhong Yun Glen Kercher
Criminal victimization is not a choice. Yet until recently when victims sought help, they often discovered that they were marginalized by the very processes that were set up to assist them. Victims often felt invisible in the criminal justice system and unassisted by society as a whole. It is illustrative to compare the crime victim to the victim of natural disaster, such as a hurricane. Reiff, one of the first proponents of the Constitutional Amendment for the Victims’ Bill of Rights, posited that the public is more willing to provide a helping hand to victims of natural disasters because the danger comes from outside of the social system.1 That is, there is no specific human being to blame for the disaster: The assumption is that anyone could be the victim of such disaster, and empathy therefore abounds. Compare this with the plight of a victim of a crime. Approaching this person can often be awkward as attempts are made to comfort him or her. A non-victim witness to the President’s Task force on Victims of Crime put it this way: “It is hard not to turn away from victims. Their pain is discomforting: their anger is sometimes embarrassing; their mutilations are upsetting.”2 One rape victim made a similar statement to the Senate Subcommittee Hearings on the Omnibus Victim and Witness Protection Act: “… most people…treat us as anathema. Our very existence makes them uncomfortable.”3
Sizable sums of public money are spent on behalf of other less fortunate members of society, such as alcoholics, drug addicts, and the mentally ill, while the victim has not always received comparable funding. The underlying reason, according to Reiff is the differential threat these segments of people pose to society.4 That is, the offender, alcoholics, drug addicts, and the mentally ill all pose a threat to the stability of society. This type of threat is deserving of public funds. Victims do not pose such a threat to society and, therefore, may not always be perceived as deserving public assistance. Starting from the mid 1970s there have been gradual improvements in how society and the criminal justice system react to crime victims. The ensuing three decades have seen a marked increase in public attention and funds directed to the cause of victims. Legislation articulating victims’ rights were enacted at both federal and state levels. Crime victims today have the right to present a Victim Impact Statement that may have an effect on the sentencing decision of the judge as well as the plea agreement by the prosecutor. Victims also have the right to receive restitution from the violator. Many victims of violent crimes will receive the compensation from the state for the harm they experienced. Given that the criminal justice system was historically constructed and operated as an adversarial system—between the state and the offender—it is certainly fair to state that enormous strides have been made in helping victims of crime. In this regard, the incorporation of the victim into criminal justice consciousness has been referred to as one of the “most radical and potentially far-reaching legal reforms in recent times.”5 Others further referred to this as the “fourth dimension” of the criminal justice system, adding to the traditionally three-dimensional (police, courts, and corrections) system.6
The victim rights’ movement has also made a significant impact on the operation of the Texas criminal justice system. Texas has arguably been a national leader in augmenting victims’ rights and services since the 1980s. Texas receives the second highest portion of the federal Victims of Crime Act (VOCA) funds (after California), among all the states, both in compensation and victim assistance.7 Since 1980, when Texas first started dispensing compensation to victims of violent crime, the amount has continued to increase (Figure 1): 0.4 million dollars were first dispensed in 1980; by 2005 it reached 85 million dollars.8 This dramatic increase has especially accelerated since the beginning of the new millennium.

Crime Victims’ Institute
8
Furthermore, the Crime Victims’ Bill of Rights came to be incorporated into the Texas Constitution with 73 percent electoral support in 1989. The Bill of Rights grants an array of rights to crime victims, including the right to be treated with fairness, respect, and dignity throughout the criminal justice process; to be reasonably protected from the accused; to be notified of proceedings; to be present unless the victim is a witness; and to confer with a representative of the prosecutor’s office. Texas crime victims are annually receiving tens of millions of dollars from offender restitution. Victims are being heard at sentencing proceedings either in the form of a Victim Impact Statement or victim allocution. Paroling offenders is increasingly being delayed as a result of victim input. As of 2004, eighty four different Texas laws had been enacted to establish victims’ rights and services9. When considering victim rights and the services available to them now, some may conclude that today’s victim is well served. However, researchers at the Crime Victims’ Institute have heard a different story during many meetings with victim service providers over the past year: these providers convincingly and consistently told of existing gaps and barriers in victim service delivery. While the commitment and compassion of the Texas victim service providers was tangible and unrelenting, their discontent and frustration was likewise very real. Based on these interactions, the Crime Victims’ Institute attempted to investigate the gaps and barriers to helping victims as perceived by victim service providers in Texas. Utilizing both quantitative and qualitative methods, an attempt was made to answer the fundamental question: Are victim services being delivered as claimed? With this question in mind, this study focused on the following tasks:
1. Examine the nature and scope of the barriers in victim services delivery as perceived by Texas victim service providers. Service providers are privy to a great deal of information about both victims’ needs and how service systems respond to victims. The research findings presented here will shed new light on this little-studied area.
2. Examine the degree of coordination and collaboration among victim service agencies. Anecdotal accounts from practitioners often indicated that coordination is lacking and subtle conflicts exist among providers. This study attempted to examine the extent to which such conflict, if any, exists among service providers. The nature as well as sources of such conflict were also examined.
3. Examine victim services delivery in urban and rural areas. Claims were raised that victims who reside in rural counties are not receiving the services for which they are eligible. An attempt was made to examine the veracity of such claims and, if substantiated, the scope of the problems, drawing upon the service providers’ experiences.
These research questions will be answered through the voices of the service providers via both a state-wide mail survey and in-person interviews. Three types of victim service providers were the focus of this research: Service providers found in prosecutor’s offices, those from law enforcement agencies, and
0102030405060708090
1980 1982 1984 1986 1988 1990 1992 1994 1996 1998 2000 2002 2004
Mill
ion
Dol
lars
Figure 1. Annual Trend in the Amount of Compensation Dispensed in Texas (1980-2005) Note: Adopted from the Office of the Attorney General’s Crime Victim Services and Grants Annual Report, 2005

Crime Victims’ Institute
9
community-based victim advocates. The job title of victim assistance staff from criminal justice agencies is not uniform and varies state by state. The most commonly occurring title for those in prosecutor’s offices is Victim/Witness Coordinator or Victim Assistance Coordinator. Those from law enforcement agencies vary more widely and are frequently called Victim Assistance Liaison, Victim/Witness Assistance Liaison, or Victim Liaison Officer. In Texas, the official title for service providers in the district attorney’s offices is Victim Assistance Coordinator (VAC), and that for law enforcement agencies is Victim Liaison Officer (VLO).10 Before proceeding to answer these questions, a brief review of relevant literature follows in the next section. VICTIM SERVICE PROVIDERS Provision of victim services is neither the responsibility of a single institution, nor a one-time task. Rather, various agencies assume the duties for different services at different stages of the justice process. Victim service providers usually fall into two broad categories: those who are based in criminal justice agencies and those in various nongovernmental based community programs. Although these two groups’ primary goals appear to be the same—victim services delivery—their working philosophy, nature of tasks, and the contexts in which they are placed are very different. Each has its own unique advantages as well as disadvantages. Belonging to a criminal justice agency can offer victim assistance personnel relative financial security, official recognition, and swift access to victims in need and their case information. At the same time, service provision is often limited, for example, to those victims who reported crimes to the police. The nature of services also tends to be limited because of the typical goals of the criminal justice system. Often victim services staff find themselves at odds with their colleagues within the same host agency whose main mission is something other than victim services. In cases of scarce funding, it may be that the victim assistance function will be relegated a lower priority or a reduction in staff. In comparison, advocates from community-based programs are able to reach the victims who have not reported crimes. These services are less threatening for victims who might distrust the formal justice system. Utilizing the wide network of service resources, community-based agencies can easily tap into local support systems. Most importantly, these agencies are committed solely to meeting victims’ needs.11 Community programs are not without their disadvantages. The purview of their target clients is also limited in that the majority of these programs are primarily geared toward serving female victims. In addition, their access to victims frequently occurs during the latter stages of the criminal justice process, often relying upon referrals from the police or other criminal justice agencies. Also, there still exists some measure of distrust among justice personnel toward grass-roots programs. COORDINATION AND LINKAGES AMONG SERVICE PROVIDERS Early criminal justice system initiatives in victim assistance were largely motivated by the need for cooperative witnesses rather than to better serve victims’ needs per se. At the same time, a strong conviction that victims should be more humanely treated by society, regardless of the purpose of the justice system, began to inspire grass-roots victim services. These early victim service programs were mostly rape crisis centers and shelters, which were largely an off-shoot of the women’s movement in the 1970s. The community-based victim service programs acknowledged that some victims suffered secondary victimization by participating in the justice system, and these programs were determined to rectify these faults. Thus, the early programs explicitly resisted association with the agencies of the justice system; some of them were reluctant to accept government money, either federal or state. Criminal justice officials, in turn, often viewed them as “extremists,” refusing constructive collaboration with community-based programs.12
A clear-cut division between the justice agencies and grass-roots programs did not always serve victims well. The grass-roots programs increasingly realized that the antagonistic approach did not offer them much access to victims who were involved in the justice process, not to mention the opportunity to rectify the perceived faults of the system.13 Coincidentally, several influential lawsuits challenged the ways justice

Crime Victims’ Institute
10
agencies dealt with victims of domestic violence and sexual assaults. As a consequence, criminal justice agencies also came to realize the need to cooperate with community-based victim programs. A well-coordinated approach to providing victim services is essential if victims are not to fall through the cracks of the service network. Community resources for crime victims are frequently structured in a piecemeal fashion. Different agencies/programs perform different functions. For example, a rape victim goes to the hospital for a rape exam; to the police to be interviewed by a detective; to the district attorney to aid with prosecution efforts; to the rape crisis center for counseling and other assistance. The personnel in each system tend to focus on their own system goals, operating in relative isolation in the service network. However, the demarcation drawn by the disparate agencies has no particular meaning to the victim. Thus, the victim may see the current system in which the flurry of help is parceled out by varying entities as inconvenient or even burdensome. Ideally, it would be best if there was a single case manager who coordinated the services offered from various agencies to insure that overlap is avoided, rights are accorded, and needs are met. Because participating agencies vary in their character and goals, case managers for victims have not been established, nor is it likely that such a position will be established in the near future because of the added costs. The consequences for failing to coordinate service provision can be detrimental. Victims may decide that getting help is not worth the effort. Duplication of services may occur, leading to unnecessary and inefficient usage of limited resources. Without accurate information and referral services, victims may be passed from one agency to another. The ensuing victim dissatisfaction may lead victims to be less cooperative to the justice system. VICTIM SERVICE DELIVERY: RURAL VS. URBAN An important, but largely unattended, issue is the difference in victim services delivery between urban and rural communities. Most policies and programs on crime control and the operations of criminal justice institutions are based on urban settings. Rural and small-town settings have long taken a back seat. Urban policies and programs become viable in rural settings only when the conditions are homogenous, which is usually not the case. For instance, lay people as well as researchers commonly believe that Blacks have higher violent victimization rates than Whites. However, this phenomenon primarily applies to an urban environment.14 In a similar vein, policies impacting victim services delivery have largely focused on urban, large city models. “Innovative” victim programs widely promoted by governmental technical reports are usually the ones that are practiced in urban settings. By comparison, there has been a paucity of research, much less program development, geared toward service delivery in rural and small towns. Concerns and criticisms have been raised a few times, but have been largely unattended. For instance, the Texas Comptroller of Public Accounts noted years ago:
Advocacy groups claimed that victims who reside in rural counties are not receiving the services for which they are eligible… (but) there has been no comprehensive needs assessment or evaluation of victim services.15
In the area of victim services, rural communities do encounter different barriers and constraints than urban cities. Most of all, rural areas appear to have fewer available resources of all types, whether it be health, mental health, substance abuse treatment, or victim services.16, 17 The few that do exist must cover wider geographical areas, where public transportation may not be available. Individuals in rural areas tend to have fewer economic resources than urbanites, which might hinder the smooth transition of status from victim to survivor. With fewer resources but larger areas to cover, rural shelters might have a long waiting list of victims. In the absence of affordable transportation, abused wives may be forced to stay in the relationship and continue to suffer.

Crime Victims’ Institute
11
These concerns may be discounted in the minds of some people because crime rates in rural areas are usually lower than those in cities. Nonetheless, rural crime is also a problem in its own right and may be increasing.18 For instance, the recent decade witnessed an alarming surge of clandestine methamphetamine labs in rural America. Accordingly, the number of children involved in methamphetamine lab incidents increased exponentially.19 Gangs, traditionally a big city phenomenon, have crept into rural communities.20 Further, some have suggested that the lower crime rate in rural areas might simply be an artifact of lower reporting rates, while the actual rate is as high as that of urban areas.21, 22
The rural versus urban dichotomy is particularly prominent in Texas. With a population over 22 million, it is the second largest state in America, encompassing a geographic area of 269,000 square miles. Seven urban counties, among 254, contain over 50 percent of the state population. While the urban counties are among the fastest growing in the United States, the majority of the other counties are sparsely populated. Further, 85 counties contain fewer than 10,000 inhabitants.23
Just as national victim polices were developed based on the specifics of urban environments, there is some evidence that the Texas victim services delivery also followed suit. For example, many small rural counties still do not have shelter services. When shelters are available, a lack of space is another hindrance: 20 percent of Texans who sought refuge from abuse were turned away due to a lack of space in 2004.24 Without shelter or other housing services available, the pathway to using other services to cope with victimization is likely to be blocked.
METHODOLOGY
STUDY PARTICIPANTS Three different groups of victim service providers in Texas participated in this study:
• Victim Assistance Coordinators (VACs) in District and County Attorney’s Offices • Victim Liaison Officers (VLOs) in Police and Sheriff’s Departments • Community Victim Advocatesi including family violence programs, women’s centers, sexual assault
programs, children’s centers, etc. Presently, these three groups of professionals constitute the mainstay of victim service delivery in Texas. Community Supervision and Corrections Departments, another important actor in service delivery, were excluded from the study since the purview of their victim services delivery is largely limited to assistance related to the Victim Impact Statement, notification, and restitution. Complete lists of participating agencies/programs were obtained through three different sources. They are as follows:
• A list of all Victim Assistance Coordinators (VACs) was obtained from the Texas State Directory (N=180).
• The Law Enforcement Management Institute of Texas (LEMIT) provided a complete list of law enforcement agencies (N=1279).
• The Texas Association Against Sexual Assault (TAASA) and Texas Council on Family Violence (TCFV) each provided a mailing list of community-based victim services programs. The two lists were cross-referenced and compounded to create a list of 171 programs that provide various services to victims (N=171).
i The term “Community Victim Advocates” was coined to collectively define victim service programs and agencies that are not housed in criminal justice agencies.
Crime Victims’ Institute
12
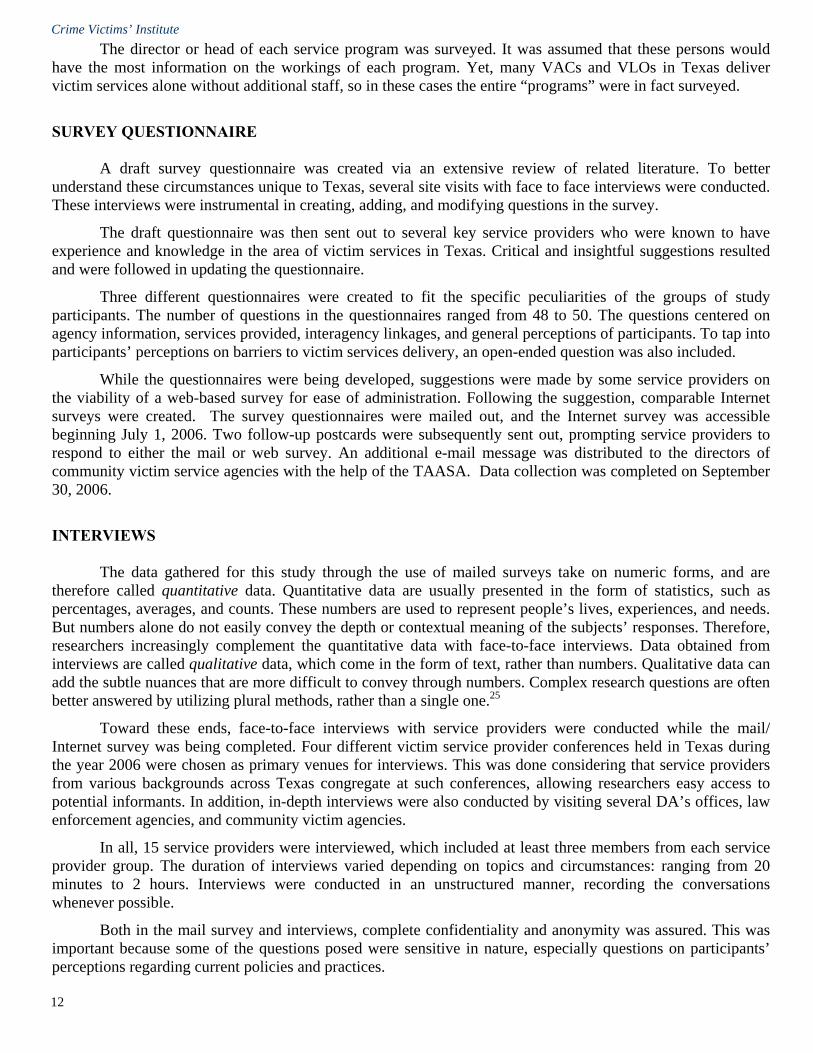
The director or head of each service program was surveyed. It was assumed that these persons would have the most information on the workings of each program. Yet, many VACs and VLOs in Texas deliver victim services alone without additional staff, so in these cases the entire “programs” were in fact surveyed. SURVEY QUESTIONNAIRE A draft survey questionnaire was created via an extensive review of related literature. To better understand these circumstances unique to Texas, several site visits with face to face interviews were conducted. These interviews were instrumental in creating, adding, and modifying questions in the survey. The draft questionnaire was then sent out to several key service providers who were known to have experience and knowledge in the area of victim services in Texas. Critical and insightful suggestions resulted and were followed in updating the questionnaire. Three different questionnaires were created to fit the specific peculiarities of the groups of study participants. The number of questions in the questionnaires ranged from 48 to 50. The questions centered on agency information, services provided, interagency linkages, and general perceptions of participants. To tap into participants’ perceptions on barriers to victim services delivery, an open-ended question was also included. While the questionnaires were being developed, suggestions were made by some service providers on the viability of a web-based survey for ease of administration. Following the suggestion, comparable Internet surveys were created. The survey questionnaires were mailed out, and the Internet survey was accessible beginning July 1, 2006. Two follow-up postcards were subsequently sent out, prompting service providers to respond to either the mail or web survey. An additional e-mail message was distributed to the directors of community victim service agencies with the help of the TAASA. Data collection was completed on September 30, 2006. INTERVIEWS The data gathered for this study through the use of mailed surveys take on numeric forms, and are therefore called quantitative data. Quantitative data are usually presented in the form of statistics, such as percentages, averages, and counts. These numbers are used to represent people’s lives, experiences, and needs. But numbers alone do not easily convey the depth or contextual meaning of the subjects’ responses. Therefore, researchers increasingly complement the quantitative data with face-to-face interviews. Data obtained from interviews are called qualitative data, which come in the form of text, rather than numbers. Qualitative data can add the subtle nuances that are more difficult to convey through numbers. Complex research questions are often better answered by utilizing plural methods, rather than a single one.25 Toward these ends, face-to-face interviews with service providers were conducted while the mail/Internet survey was being completed. Four different victim service provider conferences held in Texas during the year 2006 were chosen as primary venues for interviews. This was done considering that service providers from various backgrounds across Texas congregate at such conferences, allowing researchers easy access to potential informants. In addition, in-depth interviews were also conducted by visiting several DA’s offices, law enforcement agencies, and community victim agencies. In all, 15 service providers were interviewed, which included at least three members from each service provider group. The duration of interviews varied depending on topics and circumstances: ranging from 20 minutes to 2 hours. Interviews were conducted in an unstructured manner, recording the conversations whenever possible. Both in the mail survey and interviews, complete confidentiality and anonymity was assured. This was important because some of the questions posed were sensitive in nature, especially questions on participants’ perceptions regarding current policies and practices.
Crime Victims’ Institute
13
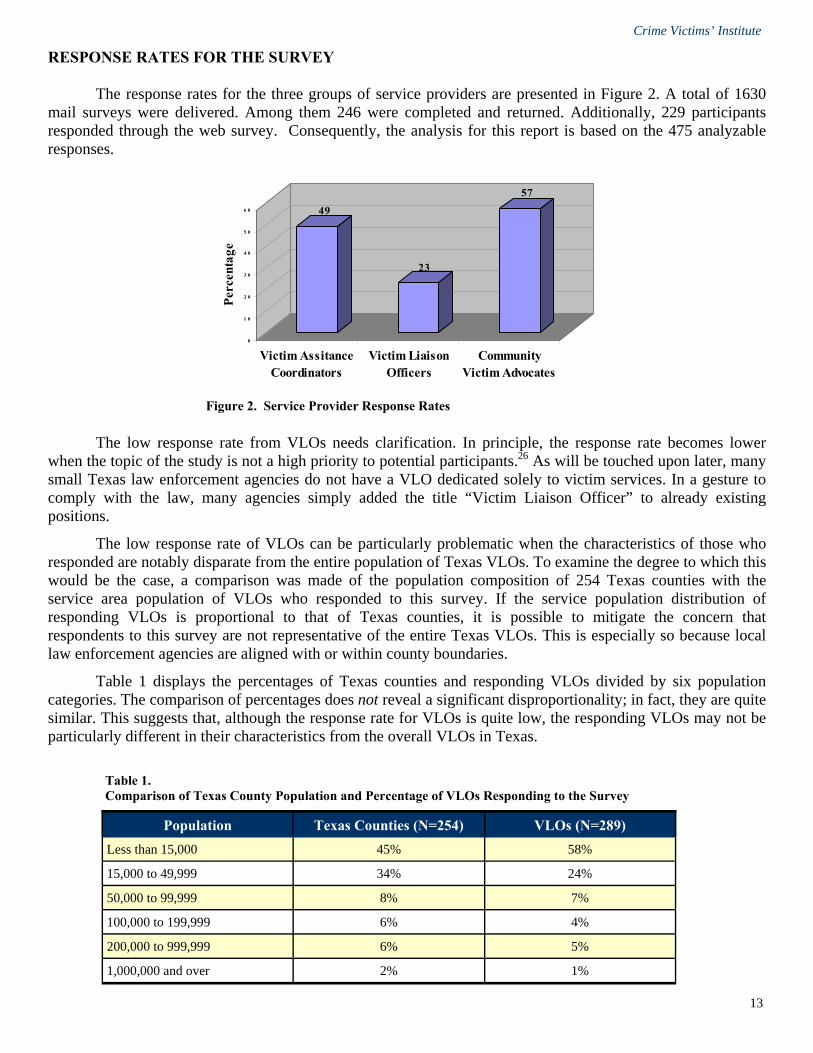
RESPONSE RATES FOR THE SURVEY The response rates for the three groups of service providers are presented in Figure 2. A total of 1630 mail surveys were delivered. Among them 246 were completed and returned. Additionally, 229 participants responded through the web survey. Consequently, the analysis for this report is based on the 475 analyzable responses.
The low response rate from VLOs needs clarification. In principle, the response rate becomes lower when the topic of the study is not a high priority to potential participants.26 As will be touched upon later, many small Texas law enforcement agencies do not have a VLO dedicated solely to victim services. In a gesture to comply with the law, many agencies simply added the title “Victim Liaison Officer” to already existing positions. The low response rate of VLOs can be particularly problematic when the characteristics of those who responded are notably disparate from the entire population of Texas VLOs. To examine the degree to which this would be the case, a comparison was made of the population composition of 254 Texas counties with the service area population of VLOs who responded to this survey. If the service population distribution of responding VLOs is proportional to that of Texas counties, it is possible to mitigate the concern that respondents to this survey are not representative of the entire Texas VLOs. This is especially so because local law enforcement agencies are aligned with or within county boundaries. Table 1 displays the percentages of Texas counties and responding VLOs divided by six population categories. The comparison of percentages does not reveal a significant disproportionality; in fact, they are quite similar. This suggests that, although the response rate for VLOs is quite low, the responding VLOs may not be particularly different in their characteristics from the overall VLOs in Texas.
Population Texas Counties (N=254) VLOs (N=289) Less than 15,000 45% 58%
15,000 to 49,999 34% 24%
50,000 to 99,999 8% 7%
100,000 to 199,999 6% 4%
200,000 to 999,999 6% 5%
1,000,000 and over 2% 1%
Table 1. Comparison of Texas County Population and Percentage of VLOs Responding to the Survey
Figure 2. Service Provider Response Rates
49
23
57
0
1 0
2 0
3 0
4 0
5 0
6 0
Perc
enta
ge
Victim AssitanceCoordinators
Victim LiaisonOfficers
CommunityVictim Advocates

Crime Victims’ Institute
14
DATA ANALYSIS AND FINDINGS
VICTIM SERVICE PROVIDER ISSUES Top Funding Sources To gain insight into the ways victim services are funded in Texas, respondents were asked to indicate their funding sources during the most recent fiscal year. Although victim service programs derive funding from multiple sources, only the top funding sources were reported in Figure 3 for the sake of brevity. In general, justice-based service providers heavily relied on county-level funding, whereas community-based providers relied more on federal and state grants. All of the three groups indicated that they received more state-level funding than federal funding. It is possible, however, that some respondents were confused about exact funding sources, because federal victim assistance grants are typically distributed through the Texas Governor’s Office and the Office of the Attorney General. Several items in figure 3 warrant attention. First, 10% of VLOs indicated that they had no funding for their positions. The Crime Victims’ Institute examined the same issue in 1998. The Institute’s report of 1998 showed that 86% of the 412 responding law enforcement agencies reported they had no funding for victim services at the time.27 It should be kept in mind that the response rate (23%) for law enforcement agencies in the present study was quite low. Assuming that small agencies—agencies that do not have funding for VLO positions—were less likely to respond to the survey, the actual percentage of VLOs without funding may be much higher than the reported 10%.
About 8 percent of VACs said their position was not funded. The fact that VACs without funding still exist is an unexpected finding, given that victim initiatives on the part of the criminal justice system have primarily focused on victim assistance in prosecutor’s offices. This is still a remarkable improvement, however, given that the 1998 study of the CVI noted that 57.9% of the responding 85 VACs were not funded. As many as 12% of community-based programs indicated that their top funding source was either from private donations or fundraising. It might be that these programs failed to secure federal or state funds due to limited funding opportunities coupled with increasing competition for limited funds.
Figure 3. Funding Sources for Victim Service Programs
Note: Percentages may not total 100 due to rounding.
10
24
56
1 0
8 6
13
69
1 1
10
35
45
9 93
00
10
20
30
40
50
60
70
Perc
enta
ge
Victim AssistanceCoordinators (n=71)
Victim Liaison Officers(n=230)
Community Victim Advocates (n=80)
FederalStateCountyDonationFundraisingNo Funding

Crime Victims’ Institute
15
Staffing Level According to the reports of the service providers surveyed, staffing level varied by agency and program type. The average number of VACs for a prosecutor’s office was 2.7, while that of VLOs from law enforcement agencies was 1.3 (Figure 4). The average number for Community Agencies reflects all full-time staff since no differentiation is made between providers and support staff. Volunteers were widely used for both groups, but more prevalent in law enforcement agencies (4.7) than in DA’s offices (1.7). The relatively low usage of volunteers in DA’s Offices reflects the fact that victim service tasks at this level are often sensitive in nature, (e.g., court accessibility and confidentiality of legal documents). It further indicates that the VOCA grants, which require the use of volunteers, are directed to VAC positions only to a limited degree.
Community-based programs reported an average of 30 staff. Volunteers were also extensively used, with at least two volunteers per staff member in community-member programs. This indicates most community victim programs depend upon federal and state grants, which frequently require the use of volunteers. Figure 5 reveals the gender distribution of victim service providers in Texas, compared with that of the Texas total population. The numbers in the table are derived from the respondents’ description of their own programs’ personnel composition. As is shown, the majority of VACs and community victim advocates are females: 88% of VACs and 78% of community-based programs. The gender difference is less prominent when
Figure 5. Gender Distribution Among Victim Service Providers
Note: Texas Population is derived from the American Community Survey, 2005.
51
49
88
12
55
45
78
22
0102030405060708090
100
Perc
enta
ge
Texas Population VictimAssistance
Coordinators
Victim LiaisonOfficers
CommunityVictim Advocates
MaleFemale
Figure 4. Average Number of Personnel by Agency
2.7 1.7 1.34.7
30
61
0
10
20
30
40
50
60
70
Victim AssistanceCoordinators
Victim LiaisonCoordinators
Community VictimAdvocates
Average # of ProvidersAverage # of Volunteers
Crime Victims’ Institute
16
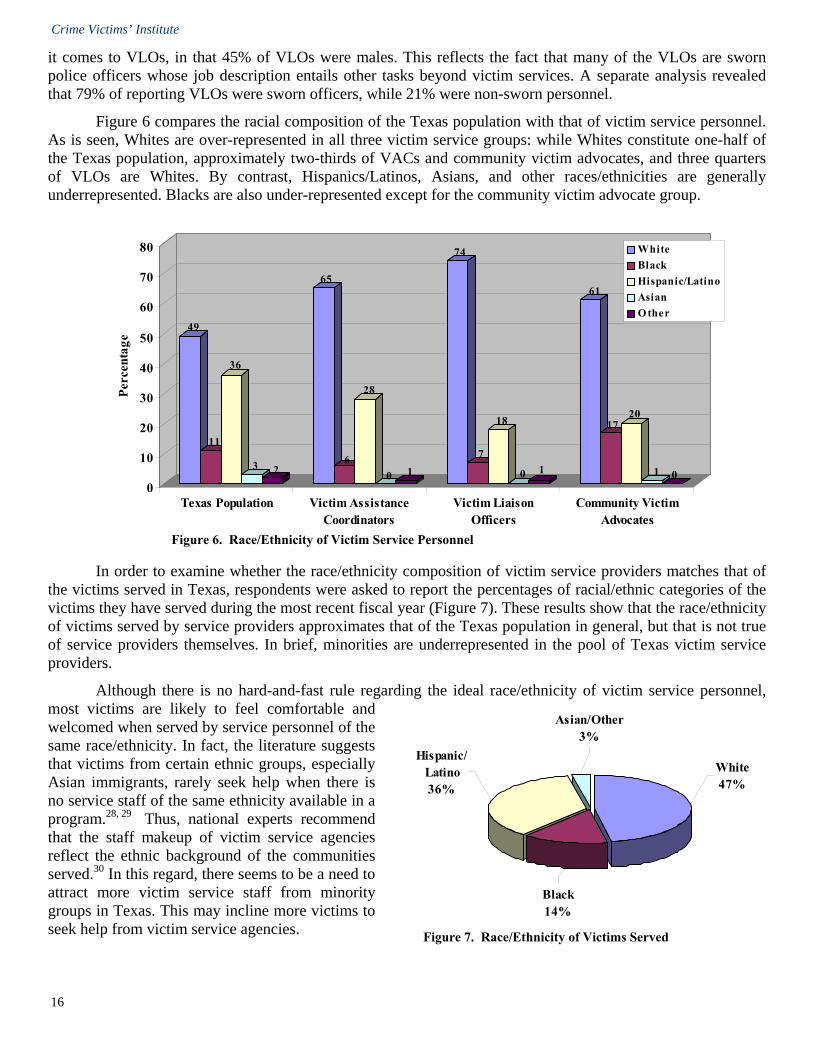
it comes to VLOs, in that 45% of VLOs were males. This reflects the fact that many of the VLOs are sworn police officers whose job description entails other tasks beyond victim services. A separate analysis revealed that 79% of reporting VLOs were sworn officers, while 21% were non-sworn personnel. Figure 6 compares the racial composition of the Texas population with that of victim service personnel. As is seen, Whites are over-represented in all three victim service groups: while Whites constitute one-half of the Texas population, approximately two-thirds of VACs and community victim advocates, and three quarters of VLOs are Whites. By contrast, Hispanics/Latinos, Asians, and other races/ethnicities are generally underrepresented. Blacks are also under-represented except for the community victim advocate group.
In order to examine whether the race/ethnicity composition of victim service providers matches that of the victims served in Texas, respondents were asked to report the percentages of racial/ethnic categories of the victims they have served during the most recent fiscal year (Figure 7). These results show that the race/ethnicity of victims served by service providers approximates that of the Texas population in general, but that is not true of service providers themselves. In brief, minorities are underrepresented in the pool of Texas victim service providers. Although there is no hard-and-fast rule regarding the ideal race/ethnicity of victim service personnel, most victims are likely to feel comfortable and welcomed when served by service personnel of the same race/ethnicity. In fact, the literature suggests that victims from certain ethnic groups, especially Asian immigrants, rarely seek help when there is no service staff of the same ethnicity available in a program.28, 29 Thus, national experts recommend that the staff makeup of victim service agencies reflect the ethnic background of the communities served.30 In this regard, there seems to be a need to attract more victim service staff from minority groups in Texas. This may incline more victims to seek help from victim service agencies.
Figure 7. Race/Ethnicity of Victims Served
Hispanic/Latino36%
Black14%
White47%
Asian/Other3%
Figure 6. Race/Ethnicity of Victim Service Personnel
49
11
36
3 2
65
6
28
0 1
74
7
18
0 1
61
1720
1 00
10
20
30
40
50
60
70
80
Perc
enta
ge
Texas Population Victim AssistanceCoordinators
Victim LiaisonOfficers
Community VictimAdvocates
WhiteBlackHispanic/LatinoAsianO ther

Crime Victims’ Institute
17
Changes in the Past Three Years Service providers were asked about changes their agencies had experienced in the past three years. When asked whether they had experienced an increase in the number of victims served, the majority of the three service provider groups said yes: 72% for Victim Assistance Coordinators, 45% for Victim Liaison Officers, and 78% for community victim advocates (Figure 8).
To put this increase in perspective, respondents were also asked whether there had been a comparable increase in staffing levels for the same period. Unfortunately, as Figure 8 denotes, the increase in the number of victims served was not accompanied by an equal increase in staffing levels. For instance, 72% of VACs indicated that they served an increasing number of victims over the last three years, but their staffing levels stayed the same for the most part. Only 17% said their staffing level increased. This suggests that the state of Texas has been requiring victim service providers to do more with the same resources. The current conditions may translate into more frequent burnouts and turnover rates among service personnel. Victims, in turn, may become underserved due to the increased workload of the overburdened service personnel. Priority of Victim Services among VACs and VLOs To gauge the importance of providing victim services within criminal justice agencies, VACs and VLOs were asked, “What priority is given to assisting crime victims in your job description?” The results are shown in Figure 9.
Figure 8. Staffing Increase vs. Victim Increase (over past 3 years)
72
17
45
10
78
41
0
10
20
30
40
50
60
70
80Pe
rcen
tage
Victim AssistanceCoordinators
Victim LiaisonOfficers
Community VictimAdvocates
Increase in VictimsIncrease in Staffing
Figure 9. Priority of Victim Services Among VACs and VLOs
43
35
22
20
36
44
020406080
100
Perc
enta
ge
Victim Assistance Coordinators(n=88)
Victim Liaison Officers (n=282)
It is a low priority due to my other duties.It is my primary priority, but I have other duties in the office.It is my highest priority.

Crime Victims’ Institute
18
Less than half (43%) of the VACs indicated that victim assistance was their highest priority. The rest (57%) said either they have other duties to do in addition to victim services or providing victim services was simply a low priority. This suggests that, despite their title, “Victim Assistance Coordinator,” more than half of the VACs in Texas are not dedicated solely to victim assistance. Other duties they are required to perform may involve being a legal or administrative assistant to the District Attorney. Nevertheless, unless a VAC’s highest priority is providing victim services, victims may not be well served. When it comes to law enforcement agencies, Figure 9 suggests a far more challenging situation: only 20% of the VLOs agreed that victim assistance is their highest priority. This means that the majority (80%) of the VLOs’ job descriptions require them to simultaneously conduct duties unrelated to victim services. Forty four percent of the VLOs expressed that victim service is simply a low priority in what they routinely do. The Code of Criminal Procedure in Texas requires a VAC at every DA’s office and a VLO at every law enforcement agency. In compliance with the law, justice agencies did designate victim service personnel in their departments and offices. However, due to lack of resources and other reasons, a sizable portion of them complied with the law simply by adding victim services as an additional duty for existing positions. Thus, it is not uncommon to see, for example, a name card of a police officer denoting Detective/Victim Liaison Officer. In such criminal justice agencies, it is hardly surprising to see victim services are given a lesser priority. As one victim advocate put it, “They just do it on the side.” There may be several reasons for this. Some rural departments may not serve as many victims as do the larger ones. With a small staff and limited funding, they may try to manage as best they can with a part-time VLO. Mission Statement A mission statement describes an overarching goal of an organization. It sends a message to its personnel as well as its clients about what the organization aims to accomplish. It can be an indicator of the degree to which an agency incorporates victim assistance as one of its major goals. As reported in Figure 10, almost three quarters of the VLOs and one half of the VACs stated that either their agencies’ mission statements do not address victim service provision or their agencies do not have a mission statement at all.
A mission statement that clearly addresses victim services can send an unequivocal message to its personnel that victims are important to their agency. At the same time, it gives victims and witnesses an idea of what to expect from a particular criminal justice agency. Methods Used to Contact Victims VLOs, VACs, and victim advocates in community agencies were asked about which methods they use in communicating with victims: written correspondence, face-to-face contact, phone conversations, and email.
Figure 10. Agency Mission Statements that Specifically Address Victim Services
45
56
37
73
0
20
40
60
80
100
Perc
enta
ge
Victim AssistanceCoordinators (n=75)
Victim Liaison Officers(n=263)
NoYes
Crime Victims’ Institute
19
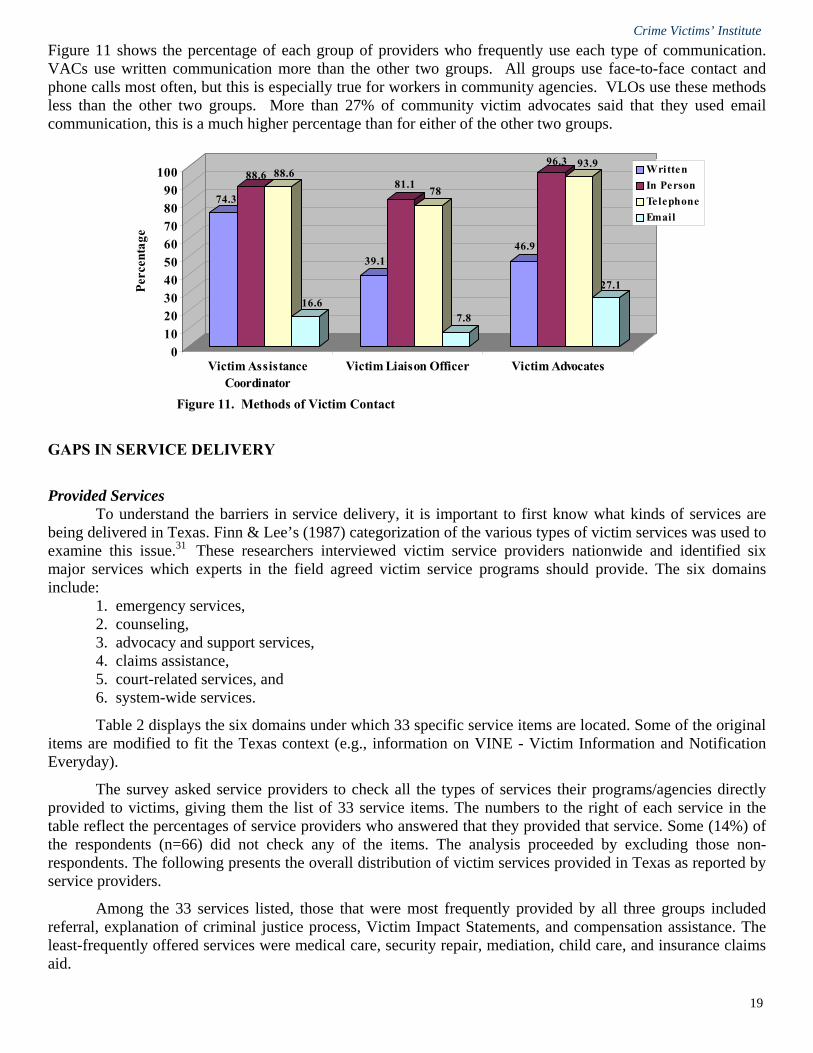
Figure 11 shows the percentage of each group of providers who frequently use each type of communication. VACs use written communication more than the other two groups. All groups use face-to-face contact and phone calls most often, but this is especially true for workers in community agencies. VLOs use these methods less than the other two groups. More than 27% of community victim advocates said that they used email communication, this is a much higher percentage than for either of the other two groups.
GAPS IN SERVICE DELIVERY Provided Services To understand the barriers in service delivery, it is important to first know what kinds of services are being delivered in Texas. Finn & Lee’s (1987) categorization of the various types of victim services was used to examine this issue.31 These researchers interviewed victim service providers nationwide and identified six major services which experts in the field agreed victim service programs should provide. The six domains include:
1. emergency services, 2. counseling, 3. advocacy and support services, 4. claims assistance, 5. court-related services, and 6. system-wide services.
Table 2 displays the six domains under which 33 specific service items are located. Some of the original items are modified to fit the Texas context (e.g., information on VINE - Victim Information and Notification Everyday). The survey asked service providers to check all the types of services their programs/agencies directly provided to victims, giving them the list of 33 service items. The numbers to the right of each service in the table reflect the percentages of service providers who answered that they provided that service. Some (14%) of the respondents (n=66) did not check any of the items. The analysis proceeded by excluding those non-respondents. The following presents the overall distribution of victim services provided in Texas as reported by service providers. Among the 33 services listed, those that were most frequently provided by all three groups included referral, explanation of criminal justice process, Victim Impact Statements, and compensation assistance. The least-frequently offered services were medical care, security repair, mediation, child care, and insurance claims aid.
Figure 11. Methods of Victim Contact
74.3
88.6 88.6
16.6
39.1
81.1 78
7.8
46.9
96.3 93.9
27.1
0102030405060708090
100
Perc
enta
ge
Victim AssistanceCoordinator
Victim Liaison Officer Victim Advocates
WrittenIn PersonTelephoneEmail

Crime Victims’ Institute
20
VAC (n=78) VLO (n=248) Community Victim Advocate (n=83)
Emergency Services % % %
Medical Care 15 29 16
Shelter 15 22 49
Security Repair 4 2 8
Direct Financial Assistance 13 6 37
On-Scene Comfort 26 63 63
Counseling
24 Hour Hot-Line 12 22 69
Crisis Intervention 37 46 84
Follow-Up Counseling 24 36 76
Mediation 17 23 15
Personal Advocacy 59 29 87
Employer Intervention 37 17 47
Property Return 50 55 24
Intimidation Protection 30 40 30
Paralegal/Legal Counsel 21 9 33
Referral 74 66 92
Information on VINE 67 48 69
Explanation of Criminal Justice Process 83 71 92
Assistance with Medical Appointments 37 12 51
Court-Related Services
Witness Reception Area 74 20 23
Court Orientation-Adult 65 15 53
Court Orientation-Child 64 14 48
Notification 80 32 37
Witness Alert 46 17 23
Transportation 41 25 58
Child Care 18 6 21
Escort to Court 73 21 78
Victim Impact Statement 90 27 64
Claims Assistance
Insurance Claims Aid 22 13 23
Restitution Assistance 64 21 28
Compensation Assistance 80 39 77
System Wide Services
Public Education 36 35 75
Legislative Advocacy 12 6 37
Training 33 23 80
Advocacy & Support Services
Table 2. Services Provided by Victim Services Providers (N=409)
Note: Some of the figures in Table 2 may not reflect actual services delivered by each agency, but referrals to local resources.

Crime Victims’ Institute
21
Table 2 also indicates that services under the categories of emergency services, counseling, and system-wide services were more likely to be provided by community victim advocates. One exception was on-the-scene comfort services which were equally likely to be rendered by VLOs (63%). All court-related services, by their nature, were most frequently offered by VACs. In addition, claims assistance, such as restitution and compensation assistance, was regularly provided by VACs. Court orientation, transportation, escort to court, and victim impact statement assistance were also frequently provided by community victim advocates. Of all three agencies, the most frequently provided service was explanations of the criminal justice process. The least frequent was security repair, which was provided by fewer than 10% of respondents from each of the three groups. The fact that security repair is the least offered service in Texas is an interesting finding. In 1990, victimology researchers surveyed 470 victims of burglary, robbery, and assault from four metropolitan cities.32 According to the results of the survey, five needs were most frequently identified by victims as being the most pressing, but not met by victim service agencies. One of the five was the need for installing better locks or improving security. Based on these findings, these researchers concluded that there existed a significant gap between what victims needed and what service providers offered. The present finding that security repair was the least provided service in Texas also suggests a possible gap that has been identified.33
Services Not Provided Possibly, the most effective way to measure the gap between what victims say they need and what service providers offer is to ask, “What are the services that were requested by victims but were not available in your community?” This inquiry explicitly asked about services that were not available in the respondents’ community rather than in their respective agency. Table 3 presents the results, aggregating the responses from the three service groups together. For all of the 33 listed services, there always existed a service that was requested but not provided. The numbers in Table 3 clearly quantify the existing gaps in Texas victim service delivery. Consistent with the findings in Table 2, Explanation of the Criminal Justice Process (10%) and Referrals (11%) were the services where gaps existed the least. On-scene Comfort, Property Return, Information on VINE, and Crisis Intervention were also most frequently provided. By comparison, the following lists in hierarchical order the services that were asked for but not provided:
• Security Repair (52%) • Direct Financial Assistance (44%) • Child Care (44%) • Mediation (43%) • Legislative Advocacy (42%) • Paralegal/Legal Counsel (41%) • Insurance Claims Aid (41%)
Most service providers (52%) reported that they have encountered victims who requested security repair services, which were not provided. Although victim service agencies do not consider repairing locks and broken windows to be a priority in victim services delivery, many victims have a contrary view. Further, 44% of service providers reported that victims requested direct financial assistance but were likely to be rejected. In fact, many providers said that many victims needed a small amount of emergency money which they could use to pay for utility bills, broken locks and windows, and the like. One service provider put it this way:
Most victims would benefit if there was some sort of financial service other than Crime Victims’ Compensation benefits—some just need a little cash to make it “over the hump.”
The Crime Victims’ Compensation Fund does not cover such expenses at this time. There do exist

Crime Victims’ Institute
22
Aggregate
Emergency Services %
Medical Care 32
Shelter 37
Security Repair 52
Direct Financial Assistance 44
On-Scene Comfort 20
Counseling
24 Hour Hot-Line 34
Crisis Intervention 23
Follow-Up Counseling 33
Mediation 43
Advocacy & Support Services
Personal Advocacy 29
Employer Intervention 39
Property Return 22
Intimidation Protection 28
Paralegal/Legal Counsel 41
Referral 11
Information on VINE 23
Explanation of Criminal Justice Process 10
Assistance with Medical Appointments 37
Court-Related Services
Witness Reception Area 33
Court Orientation-Adult 34
Court Orientation-Child 33
Notification 26
Witness Alert 33
Transportation 33
Child Care 44
Escort to Court 32
Victim Impact Statement 27 Claims Assistance
Insurance Claims Aid 41
Restitution Assistance 37
Compensation Assistance 27
System Wide Services
Public Education 28
Legislative Advocacy 42
Training 33
Table 3. Services Requested Across All Providers but Not Available (N=409)

Crime Victims’ Institute
23
victim service programs that provide emergency financial assistance to victims in dire need. Necessary funds, in such cases, are usually procured through donations from foundations and corporations. But this is not always available for smaller programs and agencies. This issue will be addressed in more detail later in this report. To summarize, findings from this study highlight the fact that gaps in service delivery exist. These gaps may exist primarily due to a lack of resources and funding. But they also exist because of the discrepancy between what victims want and what victim service programs are prepared to provide. An example is the finding that 52% of Texas service providers reported that crime victims who asked for security repair service were denied that kind of help. The same issue was also identified in a 1990’s national study.34 The present study, more than fifteen years later, confirms the earlier finding that the same need remains the most frequently unmet. BARRIERS TO SERVICE DELIVERY Survey participants were asked to submit comments on the barriers they saw in providing services to victims. More than one-half (53%, n=254) of the participants provided written comments. In addition, a number of victim service providers were interviewed face-to-face. A variety of perceived barriers were reported. The following, however, lists the most frequently reported barriers. Barriers Reported by Victim Assistance Coordinators The primary barriers felt by Victim Assistance Coordinators center around insufficient funding and personnel. Some other perceived obstacles were related to insensitive attitudes on the part of criminal justice personnel, lack of communication among agencies, onerous grant requirements, and unwillingness of victims to utilize services. Listed below are some of the comments made by victim service personnel:
• Insufficient funding and staffing • Constraints in assisting victims because of other duties in the office • Uncooperative attorneys • Insufficient training for law enforcement officers on handling victims • Judges and prosecutors unwilling to make victims a priority • Inadequate training for prosecutors and judges concerning their responsibilities to victims • Victims who do not respond to attempts to contact them
VACs cited limited funding as one of the most significant barriers. They often remarked that their positions were, in the beginning, established through federal funding, but the funding stopped after two or three years of operation. This happened because the original intent of the federal funding was simply to have DA’s offices initiate the VAC position. Once the position was in place, county governments had to find funding for the position on their own. VACs also lamented the lack of sensitivity of prosecutors toward victims. Such concerns raised by VACs underline their ironic structural placement—they are mandated to deliver victim services in an organization whose main mission is something other than victim services. Given that most of VACs’ positions are not secured by the civil service provisions and that they are required to serve at the pleasure of the District Attorney, it is likely that VACs experience considerable goal conflict. In spite of such probable goal conflicts, many VACs explicitly reported prosecutors’ insensitivity toward victims as one of the barriers of service delivery in this survey. Another frequently-mentioned barrier was the burdensome requirements attached to federal and state grants.
After years of the operation of our program, our agency finally received an OAG grant to fund my position. Now I must complete reports, get volunteers, and do a lot more to satisfy this grant, and there is not enough time for victim services. And if I don’t do it just right I will lose funding.

Crime Victims’ Institute
24
This complaint was often related to the size of the program. Whereas large programs were usually able to assign staff to take charge of paperwork, small programs lack such resources. In small programs, time spent for paperwork usually meant time that could have been spent on victims. Finally, as was found in the literature, VACs noted that many victims do not seek help, notwithstanding VACs’ extensive efforts to “get the word out.” Victims’ unwillingness to utilize services was also identified by many of the VLOs and community victim advocates. Barriers Reported by Victim Liaison Officers Victim Liaison Officers also expressed a great need for increased funding and staffing. Other needs mentioned were additional training for law enforcement officers, more time to devote to victim issues, improved linkages among service providing agencies, and less delay in service provision. Examples of some of the comments are presented below:
Our department does not have the funding to guarantee a Victim Liaison position after the grant money stopped. Our chief chose not to utilize other funding that was available. Unfortunately, that means victims may fall through the cracks because we do not have a specific person whose whole reason for existing is to take care of the victims. Our on campus housing has grown tremendously, so I'm thinking we'll probably get more cases in. I'm the Crime Victim Liaison for my department, along with the Community Oriented Police Sergeant and the Patrol Sergeant for the 3-11 shift. Hopefully, I want to be able to provide the correct and the right amount of support victims will need. Law enforcement personnel do not know about the program. They are not taught in academies. More training is needed, especially for rural departments. Police officers and sheriff's deputies do not understand victims’ rights and do not want to understand. Corrections, Parole, and CPS are unwilling to cooperate with victim services agencies. Too much paperwork and delays in receipt of assistance is the major barrier. Victims are not always open to available services.
The first and second statements above highlight the current state of affairs in which funding for VLO positions in Texas are generally insufficient. These statements also correspond with the previous finding that 80% of Texas VLOs are conducting other duties in addition to victim services. Note that the officer in the second statement holds three job titles simultaneously. One civilian VLO from a small police department commented in response to multiple-duty-VLOs:
I don’t know how they do that. It (victim assistance) requires a full-time job for me.
There may be various, and probably legitimate, reasons that account for the current state. However, without funding and without a VLO dedicated solely to victim assistance, it is likely that many law enforcement agencies fail to provide adequate services to crime victims in Texas. Another theme consistently expressed by VLOs was law enforcement officers’ lack of understanding and sensitivity to victim issues. This parallels many VACs’ sentiments toward prosecutors. Just like VACs, VLOs are also situated in organizations whose main mission is quite different from providing victim services. Thus, it stands to reason that VLOs often experience goal conflicts. Many VLOs talked about the difficulties fitting into the police subculture, especially at the initial stage. One civilian VLO from a suburban city said:
I’ve been a Victim Liaison Officer for ten years in my department. For the first three years, they (police officers) didn’t know what I was doing there. They didn’t even talk to me.
However, it appears that the longer the VLO operates within the agency, the more accepted he or she is by officers. Also VLOs reported that many officers increasingly appreciate what VLOs do.
Officers used to spend a long time sitting with victims although there was not much they could do. Now,
Crime Victims’ Institute
25
I frequently go with the officers to the crime scene, providing crisis counseling or simply listening to victims. So, officers can respond to other calls and get back in service faster. Now they do appreciate what I do.
As in the case of the VACs, too much paperwork was frequently cited as a barrier by VLOs, as was the victims’ unwillingness to seek help from available agencies. Barriers Reported by Community Victim Advocates Directors of community-based victim programs presented a variety of comments with regard to barriers in service delivery. The most frequently occurring theme, as with VACs and VLOs, pertained to insufficient as well as competitive funding. Insensitivity of criminal justice officials, grant requirements, lack of services to immigrant victims, and victims’ unwillingness to seek help were also frequently cited. Examples of the comments submitted are as follows:
Cutbacks in funding, competition for funds, and stricter grant guidelines make it difficult to concentrate on services, particularly in smaller programs. Funding is determined year-to-year and vulnerable to whims of the political process. We need more stable long-term funding commitments. A substantial barrier to providing victims services is the grant reporting requirements. All grants require recipient programs to report different information at different time frames through different reporting procedures. Police officers are insensitive towards and poorly trained for meeting victims’ needs. The justice system is focused on the offender leaving the victim/survivor standing awkwardly on the sidelines; most judges and prosecutors are not particularly victim sensitive. Probation/parole departments do not follow through on restitution for the victim/survivor. Another barrier is the fact that we are letting immigrants into our country, yet we are not prepared to provide services for them when they become victims. Victims are not aware of services available.
Lack of funding is almost always the major barrier faced by all three groups of service providers. To emphasize this point, one of the respondents from community victim advocates wrote in the survey, “Funding, funding, and funding!!!” Reflecting the fact that community-based programs are more likely than justice-based programs to rely on federal and state grants, problems related to grants were frequently reported. For instance, it seemed that the unstable funding stream remains a constant threat lurking in the mindset of the directors of community service programs. One director said that they hold their breath each year for fear of losing grants. Because of the unstable and limited funding available to community-based programs, several programs had to lay-off some of their staff. Community-based programs were not only constrained by unstable state and federal grants, but also were affected by fluctuating private donations. One advocate put it this way:
There have been some shelters that had to lay-off staff. Some even had to shut down their operations. It was especially so after 9/11. A lot of money from the VOCA grants as well as private donations went to that direction. Fundraising that year was very low for us. Anytime something like that happens, we are affected. When the Tsunami hit Thailand, the Houston Food Bank stopped sending discounted food to us. All the grocers were sending food over there. It made our grocery bills higher.
Like VACs and VLOs, community victim advocates also expressed a degree of resentment about excessive paperwork related to grant-reporting requirements.
How much money you get is based on how many people you serve. It’s all tied to numbers. So the funders put in controls to make sure we are not falsifying the numbers (chuckles). So, there is a lot of paperwork. I understand there has to be some controls in place, but I don’t know they have to be to this extent.

Crime Victims’ Institute
26
Other issues mentioned were insensitive justice officials and the justice system. Victims who do not seek help from service programs were also identified as a major barrier. Finally, lack of preparedness in services for immigrant victims was noted. A small-town victim advocate brought up her experience with Asian immigrant victims:
The Asian population in our community is growing. But I don’t think we are doing well at all with our Asian community. We don’t have anybody who speaks Vietnamese, Chinese, or Japanese. We had a Vietnamese lady a year ago who came in and wanted services. But we didn’t have anyone who could speak Vietnamese.
While there were many more barriers expressed by victim service providers in Texas, those introduced here are the ones that are frequent and consistently echoed by the respondents. All things considered, the most common barriers voiced by all three groups center around: (1) lack of funding, (2) grant requirements, (3) insensitivity on the part of members of the criminal justice system, and (4) unwillingness of victims to utilize available services. Why Some Victims Do Not Use Victim Services All three groups of service providers noted that many victims do not seek help even though there are services available. To better understand the reasons why some victims do not utilize available services, respondents were asked to choose two primary reasons they think prevents victims from taking advantage of available services. Figure 12 shows the results.
About half of the respondents (49%) said victims do not utilize services because they think it is not worth the trouble. On the other hand, only 8% selected “They do not need assistance.” This implies that many victims in Texas still hesitate to use victim services because of the perceived difficulties in accessing and utilizing them. As in any other human behavior, victims also engage in a cost-benefit analysis when deciding on a course of action. If the perceived costs exceed the likely benefits, victims are less likely to use the services. In effect, research indicates that victim programs providing quality services that are perceived as beneficial attract more victims than programs which are not.35 Thus, it is important for victim service programs to present and provide services in ways that victims perceive as beneficial and available with little effort on their part. An example would be reducing paper work requirements while providing services that are closely tailored to the needs of individual clients. Forty-four percent of respondents believed that victims fail to seek help because they are unaware of available services. This suggests that criminal justice personnel who initially respond to calls for service may
Figure 12. Reasons for Not Using Services (N=475)
33
17
44 49
8
0
10
20
30
40
50
Perc
enta
ge
They get assistance from families or friends.They have other resources to cope with victimization (e.g. insurance, savings).They were not told or made aware of available services.They think it is not worth the trouble to seek out services.They do not need assistance.

Crime Victims’ Institute
27
not always adequately inform victims of the availability of services and the necessary contact details. It also implies that, in spite of three decades of increased awareness of the needs of victims, public awareness initiatives by both criminal justice and community agencies may not be fully effective. Informing the general public about victims’ rights and services is important in assuring that victims are afforded the services they need. While not all victims contact official sources, most talk about their victimization experiences to friends, families, neighbors, or colleagues. If the public knows about victim services, they are more likely to share this information with their friends, families, neighbors, or colleagues in the event any of them become victims of crime. So far, the dissemination of information seems marginal at best. Public education efforts through the use of brochures, pamphlets, posters, and booklets are readily available; but major media outlets (e.g., TV and radio), which are profoundly more costly, have been less utilized. A remark from a VAC is the case in point:
We have distributed brochures to libraries, schools, and churches. But still not many people are aware of it…because people …do not plan to become a victim; so, they don’t pay attention to them. But, what people watch every day is TV. They also listen to radio every day. We’ve used them (i.e., these outlets) a couple of times, but it was too expensive, especially at the local level.
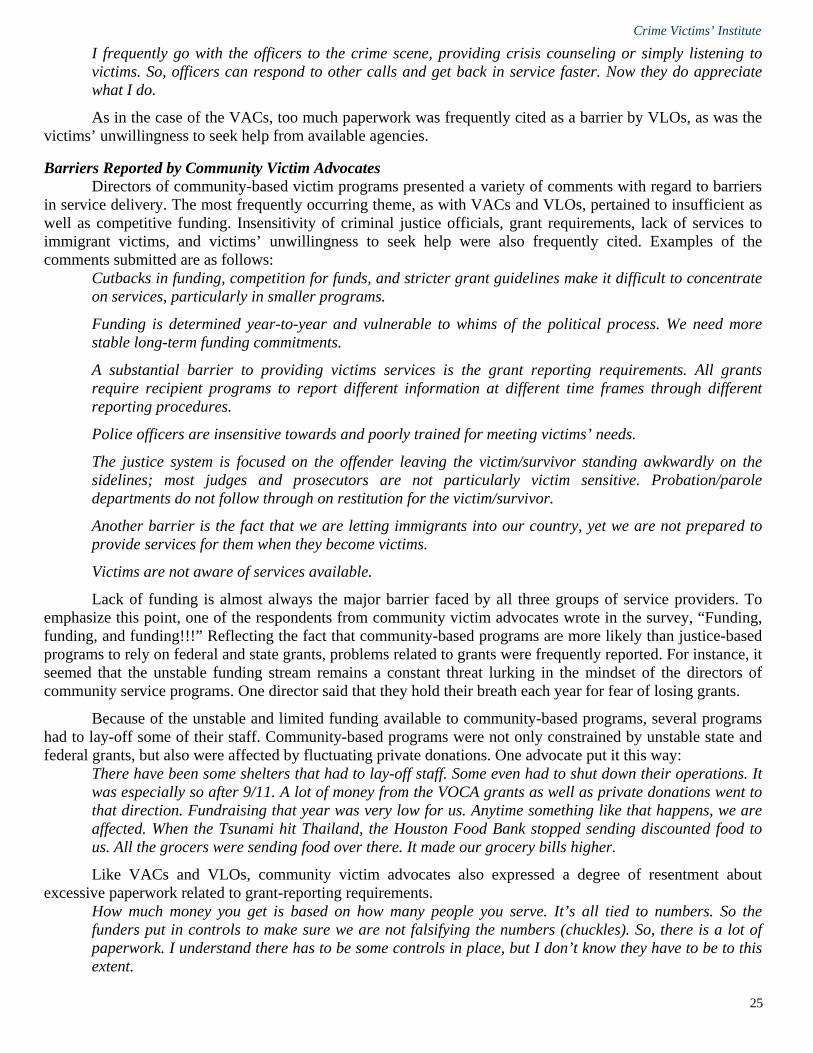
Each year public awareness campaigns are sponsored by the National Center for Victims of Crime and the Office for Crime Victims. For example, January is National Stalking Awareness month. A week in April is designated as National Crime Victims' Rights Week. Each of these organizations have websites, which provide information about victim services, victim rights, as well as posters, banners, public service announcements, etc. to publicize these issues. However, local programs must take the initiative in publicizing this information in their communities. COORDINATION AND LINKAGES AMONG SERVICE PROVIDERS Overcoming the barriers mentioned above requires active coordination among the various stakeholders in a community. To understand the extent to which coordination occurs among service providers in Texas, respondents were asked to evaluate the level of communication and cooperation between their own program and other service programs/agencies in the community. Answer categories presented were Poor (1), Acceptable (2), and Excellent (3). Figure 13 presents the average scores for the level of communication and cooperation of VACs with the VLOs and community victim advocates as perceived by VACs. The reported scores fall between 2 (Acceptable) and 3 (Excellent), which indicates that the degree of coordination among service providers in Texas is more than “Acceptable.” The ratings reported by VACs were slightly higher for the VLOs (2.43) than for community victim advocates (2.37). Figure 14 presents the scores reported by VLOs. The numbers again fall between 2 (Acceptable) and 3 (Excellent). VLOs apparently believe that the level of communication with community victim advocates (2.24) is better than that with VACs (2.22). But the difference was minimal (0.02). Finally, community victim advocates were asked how they view the degree of communication between themselves and VACs, VLOs, and other community victim advocates in the same community. Figure 15 indicates that community victim advocates perceive their relationship with other community advocates the highest (2.38), followed by VLOs (2.32), and VACs (2.04). Taking the three figures together (Figures 13-15), the level of communication among service providers in Texas appears to be at least at an acceptable level. Yet, no pair of relationships was reported to be Excellent or even close to Excellent. Note that all the numbers fall closer to 2 (Acceptable) than to 3 (Excellent). In general, the level of communication was higher among agencies within the criminal justice system. Likewise, community-based programs share relatively higher communication with other community-based
Crime Victims’ Institute
28
Figure 13. Degree of Inter-Agency Communication and Cooperation as Perceived by Victim Assistance Coordinators (N=72)
2.432.37
1.8
1.9
2
2.1
2.2
2.3
2.4
2.5
Victim Liaison Officers Community Victim Advocates
Figure 14. Degree of Inter-Agency Communication and Cooperation as Perceived by Victim Liaison Officers (N=223)
2.24 2.22
1.8
1.9
2
2.1
2.2
2.3
2.4
2.5
Community Victim Advocates Victim Assistance Coordinators
Figure 15. Degree of Inter-agency Communication and Cooperation as Perceived by Community Victim Advocates (N=72)
2.04
2.322.38
1.8
1.9
2
2.1
2.2
2.3
2.4
Victim AssistanceCoordinators
Victim LiaisonOfficers
Community VictimAdvocates

Crime Victims’ Institute
29
programs, but communication among criminal justice-based programs and community-based programs was slightly lower. The relatively low scores among community-based and justice-based programs may be related to their different missions and insufficient understanding of what is done in the other agencies. Consequently, as was suggested in a previous study,36 those in the justice system may think community victim advocates falsely raise victims’ expectations about what the system can accomplish. To examine this issue, criminal justice-based respondents were asked, “To what extent do you think community victim service providers give victims realistic expectations about what will be accomplished through the criminal justice process?” Most respondents (65% of VACs and 62% of VLOs) believed that the expectations about the criminal justice process promulgated by community victim advocates were realistic for the most part. However, just over a third of respondents in each group (35% of VACs and 38% of VLOs) questioned how realistic the expectations were. When a VAC from a medium-sized county was asked whether she thought community-based advocates’ expectations about the justice system were too high, she said:
Yes, I agree one hundred percent on that. For instance, those outside the criminal justice system (community victim advocates) definitely want to see the victims healed emotionally as well as reimbursed for the harm. But the prosecutor cannot provide both of them. To have the perpetrator punished, the prosecutor should send him to prison. To have the victim reimbursed, the prosecutor should put the perpetrator on probation. But these people want both. They want the victim’s money back as well as the offender to be sent to the prison. They put the prosecutor in a dilemma.
In addition, some VACs expressed a degree of resentment toward community advocates’ continuing “ownership” of victims even after VACs become involved in a case. One VAC described it this way:
When they (community victim advocates) made a contact with a victim, the victim trusts them and feels confident to call them up. So, they are hesitant to give up their role. They want to continue to sit with the victim. But this is where they really have to pass the baton to the next person. But they want to be the interceder between the victim and DA’s office.
The concern about coordination among agencies came not only from the justice-based providers. Community-based providers also raised concerns about their interaction with justice-based providers. Many community-based advocates claim that justice-based service providers are not primarily victim advocates, because they have to serve elected officials, who are beholden to political stakeholders. They argued that victim assistance through the justice system was primarily geared toward creating a cooperative or “emotionally stable” witness. They further argued that the ultimate goal of DA’s offices and law enforcement agencies is not providing direct victim services. To make matters more complicated, justice-based providers also expressed concerns about poor communication between law enforcement agencies and prosecutor’s offices. Thus, some degree of miscommunication existed in all relationship pairs among service providers. The following are examples which were expressed in the survey by service providers:
Cooperation and referrals from agencies that have first contact with victims are not sufficient - Community Victim Advocate. The greatest barrier we face is from prosecutors who do not want to deal with "emotional" victims and who refuse to inform victims of their rights or the status of the case. Victims often have to read the outcome in the newspaper - Community Victim Advocate. Communication with law enforcement agencies and other social service agencies is difficult - VAC. There is a need for more collaboration between law enforcement and prosecutors’ offices - VLO. There are too many territorial issues (turf issues) amongst some of the providers - VLO.

Crime Victims’ Institute
30
Many of the above-mentioned coordination difficulties seem to come from structural as well ideological differences among service providers. Yet, another frequently observed conflict has little to do with such differences; rather, it is closely related to grant requirements. One example relates to a crime victim’s compensation fund application using the presumptive eligibility process. One VLO whose position was funded by a VOCA grant delineates this issue quite clearly:
There was a family violence case in our community just one month ago. The people at the women’s center helped the victim apply for compensation through the presumptive eligibility process to expedite the claim. To do that, they needed the police offense report. But they didn’t come to me for the offense report. Ten days later, I got mail from the OAG’s office requesting the offense report: the OAG’s office couldn’t process the application because there was no offense report attached. The victim did not get her compensation earlier because of that unnecessary delay, although she could have received it way earlier. Whenever victim service providers help victims apply for compensation, they put their agency name on the application form. It becomes a count—an output measure—which eventually becomes one of the criteria for next year’s grant. They didn’t want my name on the application, because they were afraid that my position might take their grant away.
Some providers maintained that the current conflicts experienced by some communities stems from the lack of state-wide guidelines setting forth what the optimal procedure should be. In this regard, one VAC argued, The State must provide a chart explaining how it should happen. The final issue concerning coordination among service providers is related to the belief by some community victim advocates that justice-based providers are primarily focused on creating a “good witness,” rather than meeting the victim’s needs per se. As noted previously, some community victim advocates expressed that VACs and VLOs are not really victim advocates. An attempt was made to examine this issue more closely. It has been argued by scholars that a witness-oriented program emphasizes the importance of the victim as a witness for the prosecution, while a victim-oriented program emphasizes providing direct services to victims for the primary purpose of meeting victims’ needs. 37, 38
To measure these rather abstract concepts, eight survey items were created drawing on previous literature.39 The items are presented in Table 4. All respondents answered on a five-point Likert scale, ranging from Strongly Disagree (1) to Strongly Agree (5). Each respondent’s answers to the eight items were summed up (after reverse coding the negative items) to create a scale, which was named the Victim-Orientation Scale.
1. A crime should be considered first as an offense committed against the state, and second as an offense against individual victims.
2. The criminal justice system is overburdened. Therefore, efficient processing should be considered more important than victims’ participation in criminal justice decision-making processes.
3. The primary purpose of Victim services is to facilitate the victim’s role as a witness.
4. When a conflict arises between victims’ rights and defendants’ rights, victims’ rights should come first.
5. Sentencing should be proportional to the seriousness of the criminal act, rather than to the degree of victim harm.
6. A victim should be allowed to participate in plea-bargaining decisions.
7. Victims should be allowed to give testimony during the sentencing phase of a case.
8. A victim impact statement should be allowed for both property and violent crime.
Table 4. Items Used in Victim Orientation Scaleii
ii As a measure of internal consistency of the eight items, Cronbach’s alpha was calculated (.06). Although this value is slightly lower than the conventional standard of an acceptable Cronbach’s alpha, given the small number of items (8) it does not seem to pose a seri-ous problem (Pallant, 2001).

Crime Victims’ Institute
31
Scale scores can range from a minimum of 8 to maximum of 40. The lower the score, the more the respondent is thought to be witness-oriented. The higher the score, the more victim-oriented the respondent is likely to be. The reported scale scores ranged from 16 to 40, with a mean of 32, implying that victim service providers in aggregate are highly victim oriented. When compared separately, the three groups of service providers did not significantly differ in the scale scores: VACs (32.4) scored the same as community advocates (32.4), while VLOs (=31.1) scored slightly lower. However, this difference was too small to be statistically meaningful (Figure 16).
This finding implies that there is virtually no difference between criminal justice-based and community-based service providers in their expressed victim orientation: both are victim-oriented rather than witness-oriented. It means that although justice-based advocates are placed in criminal justice agencies whose main mission is not victim service, their personal attitudes towards serving victims are no less than those of community advocates. Thus, the present finding tends to dispel the contention of a handful of community victim advocates that justice-based advocates are not truly victim-oriented. What benefits accrue to victims in the communities where communication and collaboration among service providers are well established? Is there any proof that they are any better-off? To address this a proxy variable was used that can at least loosely capture the degree of the coordination that might exist. The selected proxy variable in the present study was whether there was a multi-disciplinary committee or task force in the respondent’s community. It was assumed that an existence of such a committee or taskforce denotes better coordination than where there is not. Therefore, respondents were asked “Is there any committee or taskforce in your community made up of representatives from the programs and agencies that provide services to crime victims in your community?” Among 380 service providers who answered this question, about two thirds (63%) said they had at least one. Related to the presence of community taskforces is the number of types of services that respondents reported they provided to victims. Respondents were asked about 33 types of services (see Table 2). Strictly speaking, the number of services available does not equate to precise quantification of services provided to victims. Nor does it reflect the differences in quality of service delivery. However, it is potentially useful in measuring victim service delivery. The same measure has been used in previous studies of victim services.40, 41
Figure 17 presents the comparison between communities where such a committee or task force exists and those where it does not. Service providers from communities with a committee or task force reported providing an average of 13.3 types of services, while those from without reported only 8.6. In other words, communities that have such a committee provided an average of five more services to victims than communities
Figure 16. Victim-Orientation Scale Scores
32.4 31.1 32.4
6
11
16
21
26
31
36
Victim AssistanceCoordinator (n=73)
Victim LiaisonOfficer (n=233)
Community VictimAdvocate (n=69)
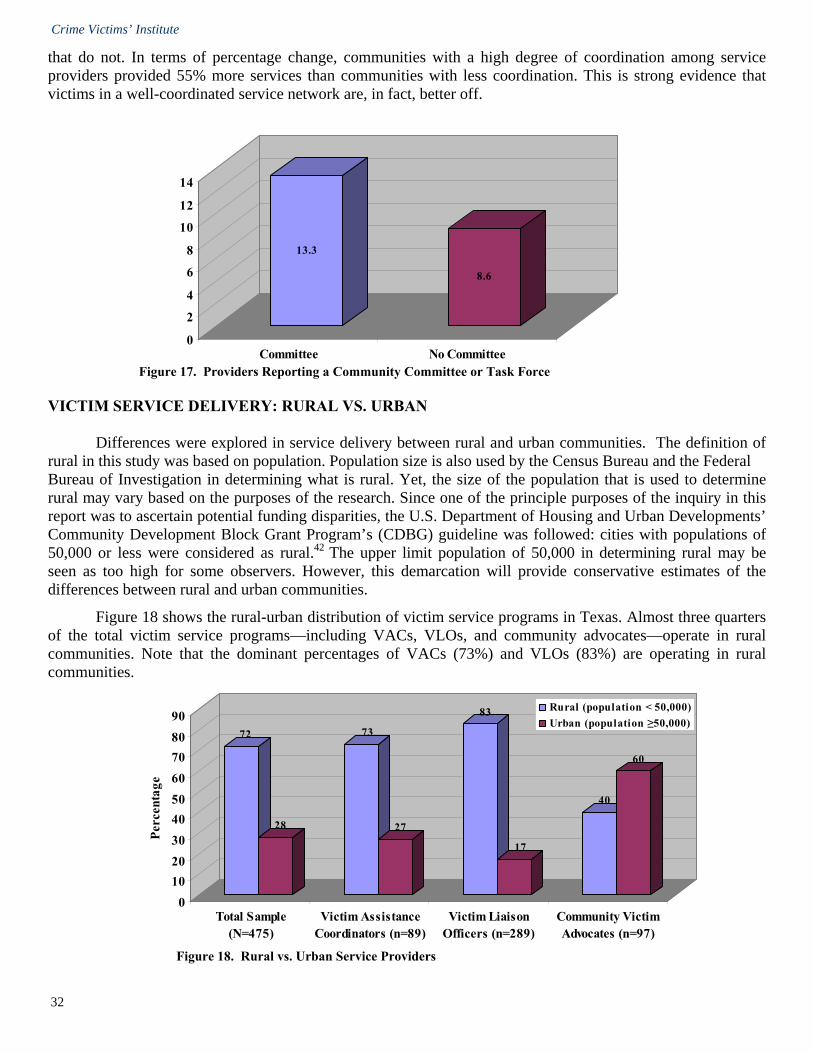
Crime Victims’ Institute
32
Figure 17. Providers Reporting a Community Committee or Task Force
13.3
8.6
0
2
4
6
8
10
12
14
Committee No Committee
that do not. In terms of percentage change, communities with a high degree of coordination among service providers provided 55% more services than communities with less coordination. This is strong evidence that victims in a well-coordinated service network are, in fact, better off.
VICTIM SERVICE DELIVERY: RURAL VS. URBAN Differences were explored in service delivery between rural and urban communities. The definition of rural in this study was based on population. Population size is also used by the Census Bureau and the Federal Bureau of Investigation in determining what is rural. Yet, the size of the population that is used to determine rural may vary based on the purposes of the research. Since one of the principle purposes of the inquiry in this report was to ascertain potential funding disparities, the U.S. Department of Housing and Urban Developments’ Community Development Block Grant Program’s (CDBG) guideline was followed: cities with populations of 50,000 or less were considered as rural.42 The upper limit population of 50,000 in determining rural may be seen as too high for some observers. However, this demarcation will provide conservative estimates of the differences between rural and urban communities. Figure 18 shows the rural-urban distribution of victim service programs in Texas. Almost three quarters of the total victim service programs—including VACs, VLOs, and community advocates—operate in rural communities. Note that the dominant percentages of VACs (73%) and VLOs (83%) are operating in rural communities.
Figure 18. Rural vs. Urban Service Providers
72
28
73
27
83
17
40
60
0102030405060708090
Perc
enta
ge
Total Sample(N=475)
Victim AssistanceCoordinators (n=89)
Victim LiaisonOfficers (n=289)
Community VictimAdvocates (n=97)
Rural (population < 50,000)Urban (population ≥50,000)
13.3
8.6
0
2
4
6
8
10
12
14
Committee No CommitteeFigure 17. Providers Reporting a Community Committee or Task Force
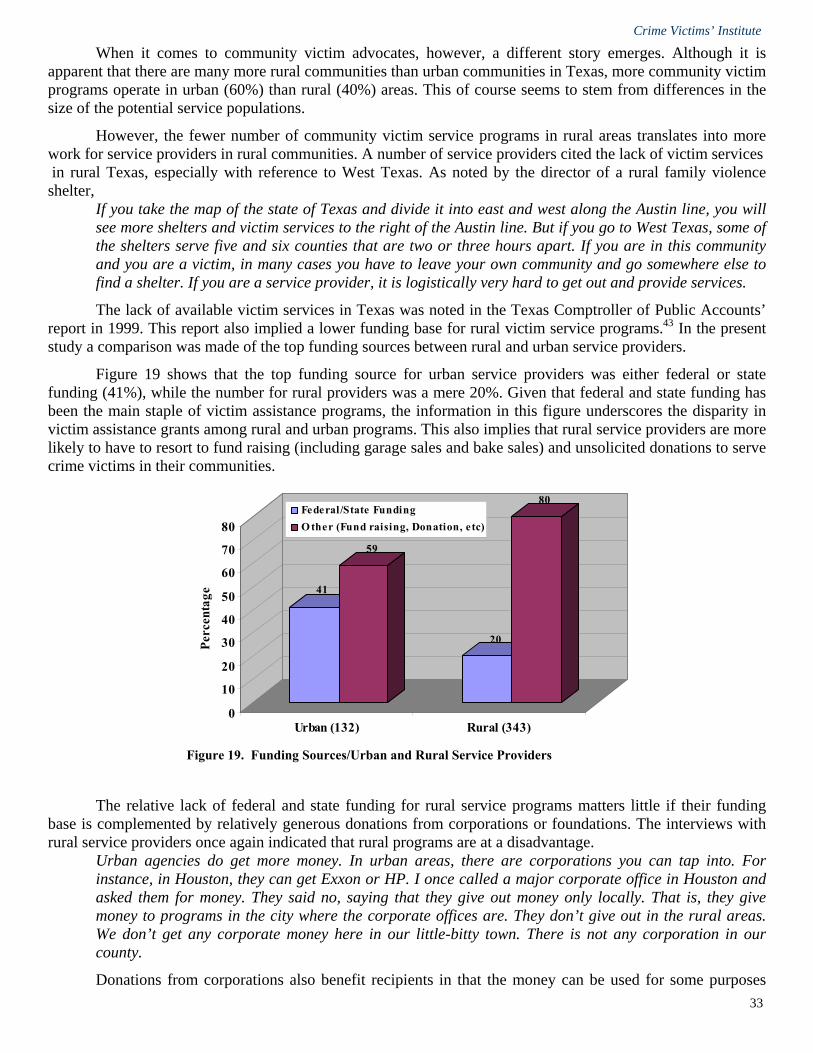
Crime Victims’ Institute
33
When it comes to community victim advocates, however, a different story emerges. Although it is apparent that there are many more rural communities than urban communities in Texas, more community victim programs operate in urban (60%) than rural (40%) areas. This of course seems to stem from differences in the size of the potential service populations. However, the fewer number of community victim service programs in rural areas translates into more work for service providers in rural communities. A number of service providers cited the lack of victim services in rural Texas, especially with reference to West Texas. As noted by the director of a rural family violence shelter,
If you take the map of the state of Texas and divide it into east and west along the Austin line, you will see more shelters and victim services to the right of the Austin line. But if you go to West Texas, some of the shelters serve five and six counties that are two or three hours apart. If you are in this community and you are a victim, in many cases you have to leave your own community and go somewhere else to find a shelter. If you are a service provider, it is logistically very hard to get out and provide services.
The lack of available victim services in Texas was noted in the Texas Comptroller of Public Accounts’ report in 1999. This report also implied a lower funding base for rural victim service programs.43 In the present study a comparison was made of the top funding sources between rural and urban service providers. Figure 19 shows that the top funding source for urban service providers was either federal or state funding (41%), while the number for rural providers was a mere 20%. Given that federal and state funding has been the main staple of victim assistance programs, the information in this figure underscores the disparity in victim assistance grants among rural and urban programs. This also implies that rural service providers are more likely to have to resort to fund raising (including garage sales and bake sales) and unsolicited donations to serve crime victims in their communities.
The relative lack of federal and state funding for rural service programs matters little if their funding base is complemented by relatively generous donations from corporations or foundations. The interviews with rural service providers once again indicated that rural programs are at a disadvantage.
Urban agencies do get more money. In urban areas, there are corporations you can tap into. For instance, in Houston, they can get Exxon or HP. I once called a major corporate office in Houston and asked them for money. They said no, saying that they give out money only locally. That is, they give money to programs in the city where the corporate offices are. They don’t give out in the rural areas. We don’t get any corporate money here in our little-bitty town. There is not any corporation in our county.
Donations from corporations also benefit recipients in that the money can be used for some purposes
Figure 19. Funding Sources/Urban and Rural Service Providers
41
59
20
80
0
10
20
30
40
50
60
70
80
Perc
enta
ge
Urban (132) Rural (343)
Federal/State FundingO ther (Fund raising, Donation, etc)

Crime Victims’ Institute
34
that are not allowed with federal or state grants. For example, with donations, a service program may purchase a van to transport clients around the community or add a day care program. Therefore, with fewer grants and donations, rural agencies are at a further disadvantage. The argument can be made that reduced funding for rural programs is appropriate because there are fewer victims who need services in rural communities. In response to this, one provider at a rural shelter responded:
It is kind of like asking the question which came first between the chicken and the egg: Are we getting less money because we serve fewer people or are we serving fewer people because we get less money? The women’s center (in a big city) can serve 800 women, but our shelter can hold only 32 people. Funders make allocations based on the number of people we serve. They (urban programs) can always do more, better, and faster because they have more resources.
Do the disadvantages experienced by rural service providers translate into fewer services to victims of crime? As expected, the average number of services available at urban programs is 14, while that for rural programs is 10. In other words, rural victims receive 40% fewer services than urban victims. In the previous section, the analysis partially validated the hypothesis that victims are better served in communities with a better coordinated service network. Is there any difference in the level of coordination between urban programs and rural programs? As before, whether there existed a multi-disciplinary committee or taskforce in a community was used as a proxy for the level of coordination among service providers. Perhaps not surprisingly, there were fewer committees or task forces in rural areas (44%) when compared to urban communities (72%). This finding suggests that the level of coordination among rural service providers is generally lower than among urban providers. Lower coordination is, as we saw, accompanied by fewer services to victims. Finally, a comparison was made of the required training hours for the service providers in rural and urban programs. Since training is directly related to quality of service provision, the quantity of training is important in ascertaining how well victims are served. Here again the rural-urban disparity is marked. Rural providers reported an average of 32 training hours, while urban providers reported 67. The comparative lack of training of rural service providers seems to be caused in part by the lack of resources and by the distance that has to be traveled to reach the training sites. One VAC from a rural DA’s office said:
I do want to attend training and conferences which are frequently held in Austin and other big cities. But I am the only one who serves victims here in my office. I don’t feel comfortable leaving my office for training.
Because of such constraints, service providers in rural communities voiced the need for more frequent regional conferences rather than those held in big cities. In summary, the analyses show that victim service programs in rural Texas do not fare as well as their urban counterparts. They operate under many disadvantages, and the scope of such disadvantage is not limited to a few issues; it ranges from public as well as private funding, staffing, training, and even coordination among service providers. It is not difficult to assume that the burden of these multiple disadvantages is born primarily by victims of rural Texas.
DISCUSSION AND RECOMMENDATIONS
Research findings become particularly meaningful when they have policy implications. The following recommendations are based on the findings of the current research. Although this study produced many more findings, the following address some of the most important.

Crime Victims’ Institute
35
FUNDING Without exception, all three groups of service providers emphasized the need for increased funding. Although the recent decades have seen a remarkable increase in victim assistance funding, it seems this has not been sufficient to adequately serve the victims of crime in our society. Further, many service providers felt uncertain about their program’s financial stability. This was primarily related to the fact that most funding is from grants, which might fluctuate with socio-political contingencies. As was shown in this study, the relative scarcity of grants can result in a subtle competition among service providers, and this can adversely affect coordination of services among them. These findings underscore the need to find ways to increase funding for victim assistance. Ideally, the funding base for victim services should rely on more stable revenue sources, other than fluctuating grants. Finding ways to do this would make victim services in Texas the “fourth dimension” of the criminal justice system, more equivalent to the police, courts, and corrections system. Federal grant reporting requirements are viewed as onerous by many service providers. Methods should be found to streamline the reporting process. Currently, different grants require different information through different accounting and reporting systems. As a result, some service providers report manually, others electronically, and others do both. A unified electronic system of reporting would greatly benefit service providers. Service providers frequently have a need for emergency funds to assist persons in the immediate aftermath of victimization. Such funds could be used to pay urgent bills, such as rents or utility bills. Emergency funds could also be used to repair locks or broken windows, which were identified as one of the most unmet needs of Texas crime victims. Money from the Crime Victims’ Compensation Fund are not sufficiently immediate enough to help with these needs. Also, beneficiaries of the Compensation Fund only include persons who report a crime to the police. Many victims—especially victims of intimate partner violence and sexual assault—do not report their victimization, but their needs are no less important than those who reported their victimizations to the police. Therefore, the benefits of discretionary emergency funds can be far-reaching. STAFFING The Texas Code of Criminal Procedure stipulates that there be at least one VAC in all prosecutors’ offices and a VLO in all law enforcement agencies. Many local agencies have met this mandate by simply adding the victim assistance function to an officer’s or staff member’s existing duties. This is evident from the information collected for this report, in that 57% of VACs and 80% of VLOs in Texas reported that victim assistance is not the highest priority in their job description. This finding may not be in keeping with the intent of the law. Consideration should be given to requiring prosecutors to have a person designated exclusively as a VAC when the county exceeds a certain size. Similar population guidelines might be considered for law enforcement agencies. Presently, about 80% of Texas VLOs perform duties other than assisting victims. Notwithstanding the practicalities that have led to that arrangement, it is difficult to understand how victims are well served by it. When it comes to the racial and ethnic composition of service providers, Whites are overrepresented given both the composition of Texas residents and crime victims. This finding is important given that many victims do not avail themselves of the services available to them. There is an indication that victims are more likely to contact service programs when they know they will be served by program staff from the same race or ethnicity. The findings from this study show that service providers are serving more victims without a

Crime Victims’ Institute
36
corresponding increase in staff. For instance, 72% of VACs reported serving an increasing number of victims over the last three years, but only 17% of them had an increase in staff. If staffing levels do not keep pace with the volume of clients to be served, the quantity and quality of victim services will inevitably fall short. TRAINING Many service providers reported that a major barrier to victim services delivery was the insensitivity of criminal justice officials, including judges, prosecutors, and peace officers. Such concerns were raised not only by community victim advocates, but by VACs and VLOs as well. Education and training are needed to overcome this barrier. As criminal justice officials learn more about the traumatic effects of victimization, they may respond with more understanding, empathy, and sympathy toward victims. In return, victims who are treated in these ways may be more cooperative with investigators and be more willing to participate in prosecution of offenders. The need for victim sensitivity training for law enforcement officers was frequently mentioned by service providers. The majority of Texas peace officers are exposed to such training either in pre-service or in-service training, but it may be useful to require officers to receive training on victim issues on a biennial basis. COORDINATION AMONG SERVICE PROVIDERS Victim services are best provided through a well-coordinated network of service providers within a community in order to insure that victims’ needs are met and duplication of services is minimized. The findings of this report underscore the importance of having multidisciplinary taskforces or committees in that there tend to be more services available to victims in those communities than where multidisciplinary teams do not exist. Collaboration is important to work out referral and coordination procedures, to educate members about the vagaries of each agency’s procedures, and to encourage multi-agency grant submissions in a community. Finally, all relevant state agencies should exert concerted efforts to map out state-wide protocols and guidelines in areas where confusion arises in the provision of victim services. With all these mechanisms in place, service providers will be better able to effectively leverage resources to provide victims with a seamless web of services. PUBLIC AWARENESS INITIATIVES Despite the three decades’ of the victims’ movement, many victims still do not avail themselves of the rights and services to which they are entitled. A number of things may account for this. It may often be the case that victims do not seek help, because they are unaware of available services and their rights under the law. In the present study, 44% of service providers were of the opinion that victims do not come for services because they do not know about them. This suggests a continuing need to more aggressively disseminate information about victims’ rights and services. Outreach efforts should be expanded to inform victims about the existence of services to assist them. Other than using flyers and posters, other media such as billboards and public service announcements on the radio might be helpful. Efforts such as these may also help overcome the stigma and prejudice some people attach to seeking help. RURAL AND URBAN DIFFERENCES The quality and quantity of services that crime victims receive should not depend on geographic location. Yet, the data in this study suggest that victims from rural areas are somewhat marginalized. For instance, federal and state funding is more directed toward non-rural than rural programs. Rural programs also fare worse in terms of staff training and amount of private donations they receive. Furthermore, rural victims

Crime Victims’ Institute
37
have access to 40% fewer services than their urban counterparts. There is no simple solution to the problems faced by rural service providers. Indeed, the lack of funding is not only experienced by rural programs; it is prevalent across-the-board in victim services. And yet, it is unfortunate that victims are turned away because of the lack of space in local shelters. When abused wives see no alternatives to staying in an abusive relationship because of the lack of affordable transportation in rural areas, they are not well served. In order to better serve the victims of rural Texas and leave no one behind, a long-term funding scheme should be pursued that increases and stabilizes funding for rural victim service programs. Finally, rural service providers receive less training than their urban counterparts. The average training hours for rural providers was 32 hours, while that for urban providers was 67 hours. The primary reason for this disparity appears to be the distances that need to be traveled to attend conferences, which are typically held in major cities. One possible remedy for this is to encourage small regional conferences to be held around the state.
Endnotes
1. Reiff, R. (1979). The invisible victim. New York: Basic Books. 2. President’s Task Force on Victims of Crime. (1982). Final report. Washington, DC: Government Printing Office. 3. Henderson, L. (1985). The wrongs of victims’ rights. Stanford Law Review, 37, 936-1021. 4. Supra Note 1 5. Erez, E., & Laster, K. (1999). Neutralizing victim reform: Legal professionals’ perspectives on victims and impact statements.
Crime and Delinquency, 45(4), 530-553. 6. Blomberg, T.G., Waldo, G.P., & Bullock, C.A. (1989). An assessment of victim service needs. Evaluation Review, 13, 598-627. 7. Office for Victims of Crime. (2005). Report to the nation 2005: Fiscal years 2003-2004. Washington, DC: Author. 8. .Office of the Attorney General. (2005). Pathways: Crime victims services and grants annual report, 2005. Austin, Texas: Author. 9. Anderson, K. (2004). Texas crime victims handbook (4th ed.). Georgetown, TX: Georgetown Press. 10. Texas Code of Criminal Procedure, Article 56.04 11. Tomz, J., & McGillis, D. (1997). Serving crime victims and witnesses. Washington, DC: Department of Justice. 12. Davis, R., & Henley, M. (1990). Victim service programs. In A. Lurigio, W. Skogan, and R. Davis (Eds.), Victims of crime:
problems, politics, and programs (pp. 188-204). Thousand Oaks, CA: Sage. 13. Finn, P., & Lee, B. (1987). 1987 Serving crime victims And witnesses. Washington, D.C.:National Institute of Justice. 14. Bachman, R. (1992). Crime victimization in city, suburban, and rural areas. Washington, D.C.: U.S. Bureau of Justice Statistics 15. Texas Comptroller of Public Accounts. (1999). Challenging the status Quo: Improve services and increase funding for victims of
crime. Retried May 5, 2006 from http://www.window.state.tx.us 16. DeLeon, P., Wakefield, M., & Hagglund, K. (2003). The behavioral health care needs of rural communities in the 21st century. In
B. Stamm (Ed.), Rural behavioral health care: An interdisciplinaryguide (pp. 23-31). Washington, DC: American Psychological Association.
17. Logan, T., Evan, L., Stevenson, E., & Jordan, C. (2005). Barriers to services for rural and urban survivors of rape. Journal of Interpersonal Violence, 20(5), 591-616.
18. Weisheit, R., Wells, E., & Falcone, D. (1995), Crime and policing in rural and small-town America: An overview of the issues. U.S. Department of Justice: Washington, DC.
19. Office for Victims of Crime. (2003).Children at clandestine methamphetamine labs: Helping Meth’s youngest victims. Washington, DC: Author.
20. Office of Justice Programs. (2002). National youth gang survey trends from 1996 to 2000. Washington, DC: Author. 21. Ruback, R., & Menard, K. (2001). Rural-urban differences in sexual victimization and reporting: Analysis using UCR and crisis
center data. Criminal Justice and Behavior, 28(2), 131-155. 22. Supra Note 18 23. United States Census Bureau. (2006). State and county quick facts: Texas. Retrieved April 11, 2006, from http://quickfacts.census.gov/qfd/states/48000.html 24. Cason, S. (2005, October 24). Shelter lacking for local abuse victims. Marshall News Messenger. Retrieved November 21, 2006,
from http://infoweb.newsbank.com/iw-search 25. Patton, M. (2002). Qualitative research and evaluation method. Thousand Oaks, CA: Sage Publication. 26. Taris, T. W. (2000). A primer in longitudinal data analysis. Thousand Oaks, CA: Sage. 27. Crime Victims’ Institute. (1998). The impact of crime on victims: A baseline study on program service delivery 1997-98. Austin,
TX: Author.

Crime Victims’ Institute
38
28. Lee, M., & Au, P. (1998). Chinese battered women in North America: Their experiences and treatment. In A. Roberts (Ed.), Battered women and their families: Intervention and treatment programs (pp. 448-482). New York: Springer.
29. Bui, H. (2003). Help-seeking behavior among abused immigrant women: A case of Vietnamese American women. Violence Against Women, 9(2), 207-239.
30. Tomz, J., & McGillis, D. (1997). Serving crime victims and witnesses. Washington, DC: Department of Justice. 31. Supra Note 13. 32. Skogan, W.G., Davis, R.C., & Lurigio, A.J. (1990). Victims’ needs and victim services. Final report of the Center for Urban
Affairs, Northwestern University to the National Institute of Justice. 33. Ibid 34. Ibid 35. Supra Note 6. 36. Jerin, R., Moriarty, L., & Gibson, M. (1995). Victim service or self service: An analysis of prosecution based victim-witness
assistance programs and providers. Criminal Justice Policy Review, 7(2), 141-154. 37. Karmen, A. (1990). Crime victims. Belmont, CA: Brooks/Cole. 38. Regehr, C., & Alaggia, R. (2006). Perspectives of justice for victims of sexual violence. Victims and Offenders, 1, 33-46. 39. Ibid 40.Supra Note 13. 41.Supra Note 35. 42.U.S. Department of Housing and Urban Development. (2006). Community development block grant program. Retrieved December
12, 2006, from http://www.hud.gov/offices/cpd/communitydevelopment/programs/ 43.Supra Note 14.

CRIME VICTIMS’ INSTITUTE
Criminal Justice Center
Sam Houston State University Box 2180
Huntsville, TX 77341-2180
Phone: 936.294.3100 Fax: 936.294.4296
Additional copies of this report can be downloaded at:
www.crimevictimsinstitute.org
Kent Adams Chair, Houston Bernie C. Francis Vice-Chair, Carrollton Dora G. Alcala Del Rio Alan W. Dreeben San Antonio John E. Dudley Comanche
Dionicio “Don” Flores El Paso Ken Luce Dallas Pollyanna A. Stephens San Angelo Greg Wilkinson Dallas Magdalena Manzano Student Regent Huntsville
Board of Regents
Charles R. Matthews Chancellor Austin
Texas State University System


