Viet Nam’s Lesson for China: An Examination of the Sachs-Woo Hypothesis Nazrul Islam International Centre for the Study of East Asian Development Working Paper Series Vol. 2006-14 September 2006 The views expressed in this publication are those of the author(s) and do not necessarily reflect those of the Institute. No part of this article may be used reproduced in any manner whatsoever without written permission except in the case of brief quotations embodied in articles and reviews. For information, please write to the Centre. The International Centre for the Study of East Asian Development, Kitakyushu
Transcript
Viet Nam’s Lesson for China: An Examination of the Sachs-Woo Hypothesis
Nazrul Islam
International Centre for the Study of East Asian Development
Working Paper Series Vol. 2006-14
September 2006
The views expressed in this publication are those of the author(s) and
do not necessarily reflect those of the Institute.
No part of this article may be used reproduced in any manner
whatsoever without written permission except in the case of brief
quotations embodied in articles and reviews. For information, please
write to the Centre.
The International Centre for the Study of East Asian Development, Kitakyushu
Viet Nam’s Lesson for China:
An Examination of the Sachs-Woo Hypothesis
By
Nazrul Islam* International Centre for the Study of East Asian Development (ICSEAD)
Kitakyushu, Japan
Abstract
This paper examines Sachs and Woo’s (1997, 2000) hypothesis that the experience of Viet Nam’s 1989 reforms shows that China would have grown faster had she followed the Big Bang approach to reform instead of the Gradual approach. The paper scrutinizes this hypothesis and the associated argumentation from the point of view of accuracy of facts, appropriateness of the characterization, and acceptability of the hypothesis. The paper finds that Sachs and Woo fall short of meeting these criteria. The paper then examines the possible reasons for Sachs and Woo’s pitfalls.
Key words: Economic Reforms, Transition, Viet Nam, China JEL Classification Codes: O
September 21, 2006
* The author is a Research Professor and Head of the Development Strategy section at ICSEAD. He is grateful to Vo Tri Thanh, Le Dang Doanh, Vu Thieu, Vu Huy, Trinh Quang Long, Steve Parker, Adam McCarty, Jonathan Pincus, Eric Ramstetter, Shoichi Yamashita, and, in particular, Raymond Mallon for discussions that helped him have a better understanding of the Vietnamese reforms. Thanks are also due to the participants of seminars at Asia Pacific School of Economics and Government (APSEG) of the Australian National University and at Economics Department of Queensland University, Australia, for their helpful comments. None of them however is responsible for any remaining error. The views expressed in this paper are author’s own and need not be ascribed to the organizations to which he belongs. Send your comments to [email protected] .
1
Viet Nam’s Lesson for China: An Examination of the Sachs-Woo Hypothesis
Nature does not jump! “Quantum theory does not require the existence of discontinuities: neither in
time (quantum jumps), nor in space (particles), nor in spacetime (quantum events).” Physical Letters A172, 189 (1993)
1. Introduction
In several recent papers, Sachs and Woo (1997, 2000)1 puts forward the hypothesis that
the experience of Viet Nam’s 1989 reforms shows that China would have grown faster had
she followed the Big Bang approach to reform instead of the Gradual approach. The paper
scrutinizes this hypothesis and the associated reasoning from the viewpoint of (a) accuracy of
facts, (b) appropriateness of the characterization, and (c) acceptability of the hypothesis.
So far as facts are concerned, Sachs and Woo (2002) appear to either misunderstand or
misrepresent the history of Vietnamese reforms in important respects. According to them,
Vietnamese reforms started to succeed only after 1989. In actual fact, reforms started much
earlier and produced significant positive results during pre-1989 years. For example, the
successful transition of the Vietnamese agriculture from collective to household farming was
completed in the early eighties. Similarly, the industrial reforms started in 1981 and brought
about a significant turnaround. It is the success of pre-1989 reforms that made it possible for
Viet Nam to withstand the industrial contraction that 1989 measures caused.
With regard to characterization, the paper shows that Viet Nam’s 1989 measures do not
satisfy either of the Big Bang’s two connotations, namely that it has to be the beginning of a
process occurring all at once, and that it has to be big. The paper demonstrates that first,
changes introduced in 1989 were a continuation of efforts made earlier along the same
directions. Second, these changes appear bigger when viewed from outside than they actually
were when viewed from inside. Third, the 1989 measures did not entail any change in the
1 The journal version of the paper, Sachs and Woo (2000), is almost identical to its NBER Working Paper version, Sachs and Woo (1997), except at a few places. Most of the references in this paper are to Sachs and Woo (2000), other than a few cases where we refer to Sachs and Woo (1997).
2
ownership of productive assets. In particular, there was no privatization, which is generally
regarded as one of the hallmarks of Big Bang.
With regard to the hypothesis itself, the paper shows that it is not acceptable either in its
prospective or in its retrospective interpretation. At the time when Viet Nam undertook its
1989 measures, China was already there if not much further ahead than where Viet Nam tried
to reach through these measures. Hence in a prospective sense, there was not much scope for
China to raise its growth rate by emulating Viet Nam’s 1989 measures. On the other hand,
given that China’s high growth rates from the very beginning of the reform process have been
historically and internationally unprecedented, it is difficult to see how China would have
grown any faster had she adopted Viet Nam’s 1989-like measures earlier in time. This makes
a retrospective interpretation of Sachs and Woo’s hypothesis unacceptable too.
The paper next raises the question of why Sachs and Woo fall into pitfalls regarding facts
and characterization and offer an untenable hypothesis. The paper shows that the root of the
problems lies in the authors’ subjective preference for the Big Bang approach to reform. This
leads them to see Big Bang or success where these are not there, and to see failure or
departure from Gradualism where these are actually not the case. The subjectivity of Sachs
and Woo may have several sources. The epistemological source seems to lie in their lack of
appreciation of the dialectics of the reform process. This lacking finds reflection in their
reluctance to see the time-specificity of various reform measures (so that a particular reform
may become redundant without losing its rationale and usefulness today) and the organic
connection between economics and politics in the reform process and in their often very
linear, mechanistic reasoning. Sachs and Woo’s subjectivity may have other sources, which
we do not discuss in this paper. However, the revelation and recognition of this subjectivity is
important because it can have important practical consequence in future as it probably
already had in the past.
3
The discussion of the paper is organized as follows. Section 2 provides the background
and splits up the research question of the paper into four constituent questions. Section 3
considers the issue of factual accuracy of Sachs and Woo’s assertions. Section 4 examines the
appropriateness of their characterization of 1989 measures as a Big Bang. Section 5 discusses
the acceptability of their main hypothesis. Section 6 examines the reasons behind Sachs and
Woo’s pitfalls regarding facts, characterization, and hypothesis. Section 7 offers some
concluding remarks.
2. Background
Jeffery Sachs is one of the architects of the Big Bang approach and has played an active
role in actual implementation of this approach in several countries, including Russia. The
‘disappointing’ results in Russia on the one hand, and the remarkable success following the
Gradual approach by China, on the other, have led many to question the merit of the Big
Bang approach. Sachs however remains defiant in his support for the Big Bang approach. In
fact, he argues that even China’s experience supports Big Bang. According to Sachs, the
Gradual approach has restrained China’s growth, rather than facilitating it. In particular,
Sachs and Woo (1997, 2000) put forward the hypothesis that Viet Nam’s 1989 experience
shows that China would have grown faster had she followed the Big Bang approach to reform
instead of the Gradual approach. The following passage contains their argumentation behind
this hypothesis:
“Suppose that China had in fact pursued more rapid liberalization of the economy,
including a harder constraint on state enterprises and a faster unification of product
markets and the market for foreign exchange. How much larger would have been the
dislocations in the economy? While we cannot answer this crucial question with any
precision, it is instructive to look next door at the case of Vietnam. During 1985-88,
Vietnam implemented a gradual reform strategy that did not address serious
macroeconomic imbalances. The program failed: inflation and import of rice
4
accelerated while growth performance remained unchanged. In 1989, Vietnam enacted
an Eastern-Europe style “big bang,” including across-the-board price liberalization, 450
percent devaluation to unify the exchange market and a tight credit policy. The
collective farms were returned to family farms with long-term leases. Growth
accelerated, inflation ended, agricultural productivity soared (turning Vietnam into a
rice exporter in 1989), and small, non-state enterprises proliferated. The “big bang” did
not cause an output decline in Vietnam as in Eastern Europe.” (Sachs and Woo 2000,
pp. 16-17)
The goal of this paper is to examine the validity of the Sachs and Woo hypothesis and the
associated argumentation. To facilitate the task, we split the research question into the
following three constituent questions. First, how accurate are Sachs and Woo with regard to
facts? Second, how appropriate is their characterization of the Vietnamese 1989 reform
measures as a Big Bang? Third, how acceptable is the Sachs and Woo hypothesis?
3. How accurate are the facts?
We begin with the issue of facts. For that purpose, we first list the factual points that Sachs
and Woo try to make in the passage above. The passage claims that:
a) The gradualist reforms of Viet Nam began in 1985.
b) The return from collectivist farming to family farming took place in 1989 and was part
of 1989 Big Bang.
c) The pre-1989 reforms were of no positive effect. As Sachs and Woo put it, “inflation
and import of rice accelerated” while “growth performance remained unchanged.”
d) Pre-1989 reforms did not address “serious macro-economic balances.”
In order to examine the accuracy of these claims it is necessary to take a brief look at the
history of Vietnamese reforms. Detailed accounts of early years of Vietnamese reforms can
be found in, among others, Arkadie and Mallon (2003), De Vylder and Fforde (1988), Fforde
and Vylder (1996), Riedel (1995), Riedel and Comer (1997), and Tran (1994).
5
3.1 Pre-1989 reforms in agriculture
Reforms in Viet Nam, as in China, started with the agricultural sector, and they began in
1979-81. As Viet Nam was reaching the end of her First Five Year Plan (FFYP) spanning
1976-1980, certain gloom set in. The FFYP was launched in 1976 with considerable euphoria.
Just a year ago, in 1975, Viet Nam won its stunning victory over the US and reunited the
country under the banner of the Vietnamese Communist Party (VCP) and socialism. The
main goal of FFYP was therefore construction of socialism, which in concrete terms of
economic policies for agriculture meant collectivization in the North and co-operativization
in the South. At the beginning of FFYP, both these campaigns were conducted with some
gusto. However, soon the perils of imposition of collectivization and co-operativization on a
pre-industrial agriculture began to surface. Inefficiency of production was the pervasive
passive form of these perils. However, in the South, particularly in the Mekong delta, they
even took the active form of large tracts of land left uncultivated and large number of cattle
slaughtered.
Alarmed by these developments, the Sixth Plenum of VCP CC (elected at the Fourth
Congress) held in August-September of 1979, decided to slow down the pace of socialist
transformation of agriculture and to change the direction of transformation. In particular, it
decided to introduce what came to be known as the “Contract System,” directed towards
household/family farming and away from collective farming. This move was backed up by
decisions of the 5th Congress of VCP held in September 1979.
The switch was formalized in the form of the Resolution 100 adopted by the Central
Secretariat of VCP on January 13th 1981. This Resolution enhanced the role of households
vis-à-vis cooperatives in both actual farming and disposal of output. In particular, households
were given rights to hold on and/or sell in free markets the part of the output that was above
the contracted amount.
6
The Doi Moi program adopted by the VCP Sixth Congress in 1986 helped agricultural
reforms to progress further. For example, following the Congress, the National Assembly, in
its December 1987, session passed a “Law on Land,” which was enacted in 1988. The Law
created long-term private land use rights (for agricultural purposes) and conferred these rights
to rural families. Also, the Party Resolution No. 10, passed on April 5th 1988 by the
Politburo of CC CPV, greatly enhanced the rights of rural families and reduced the legal
authority of village cooperatives. This resolution allowed farmers to hold about 40 percent of
the contracted output, and thus encouraged them to put in more labor and even invest capital.
In many areas, farmers raised funds for building irrigation works and purchasing draught
power (buffaloes and oxen) and even small agricultural machinery. They also took initiative
to apply new technology and introduce new varieties in order to increase crop yield.
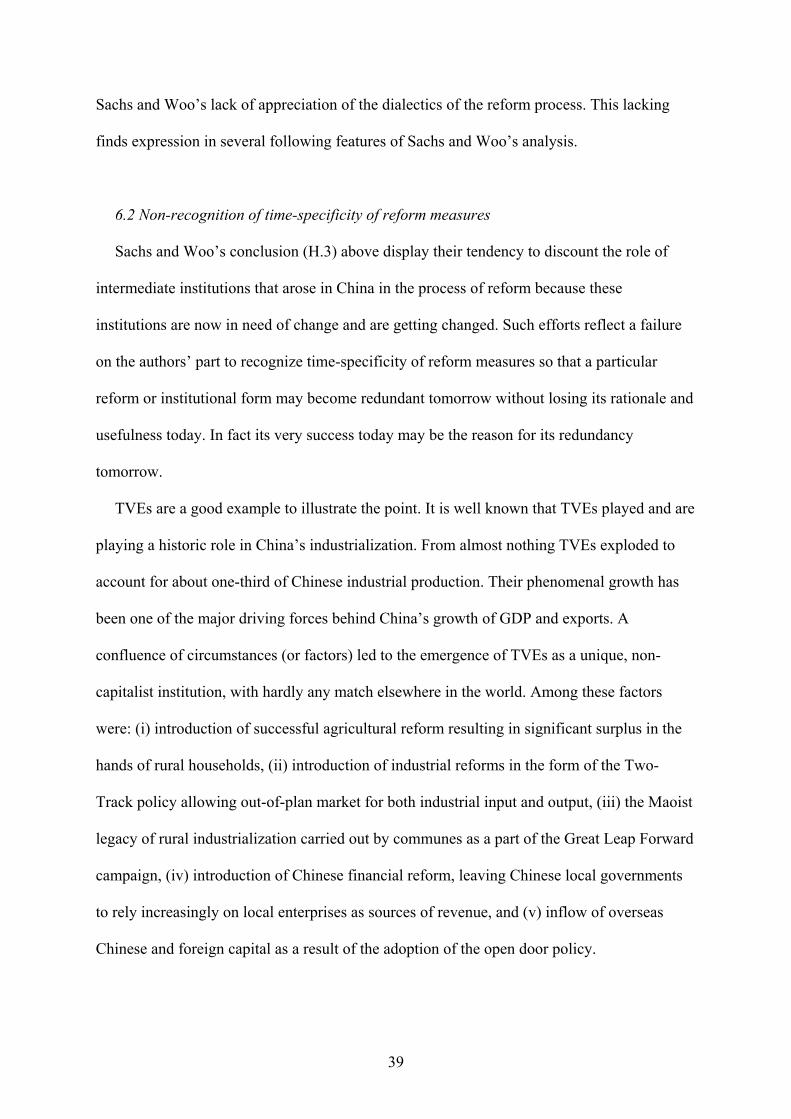
Were these pre-1989 agricultural reforms of no positive effect, as Sachs and Woo suggest?
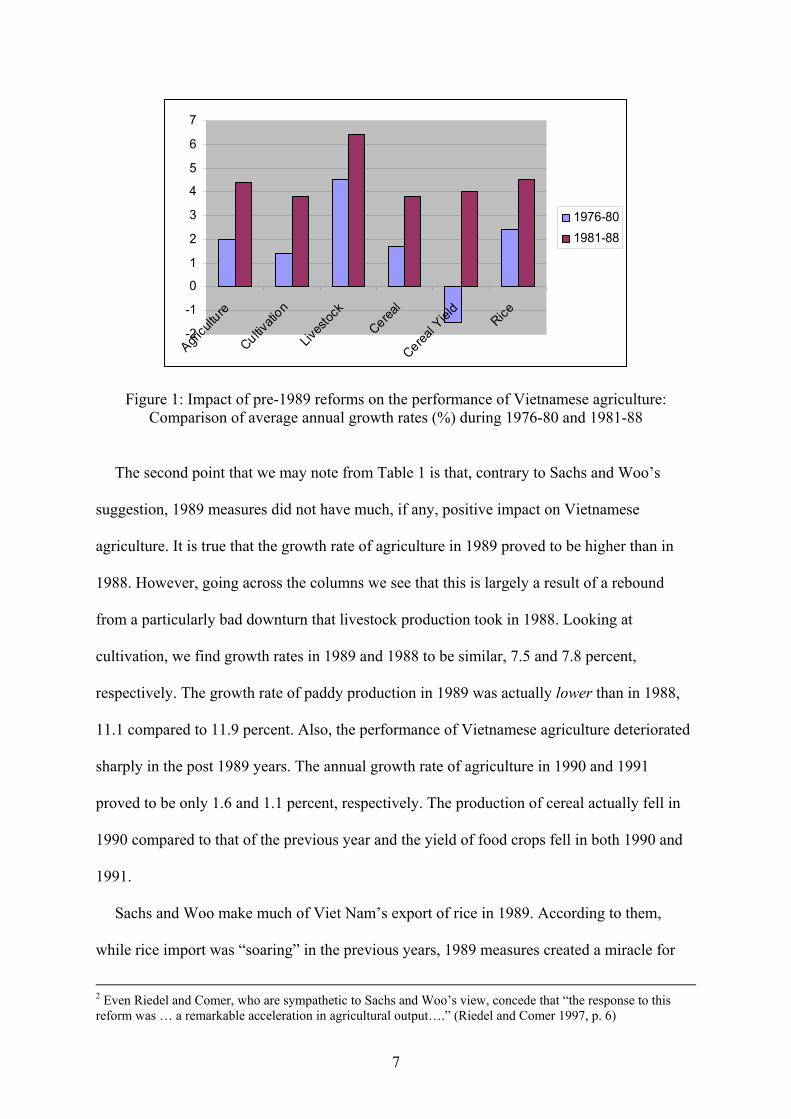
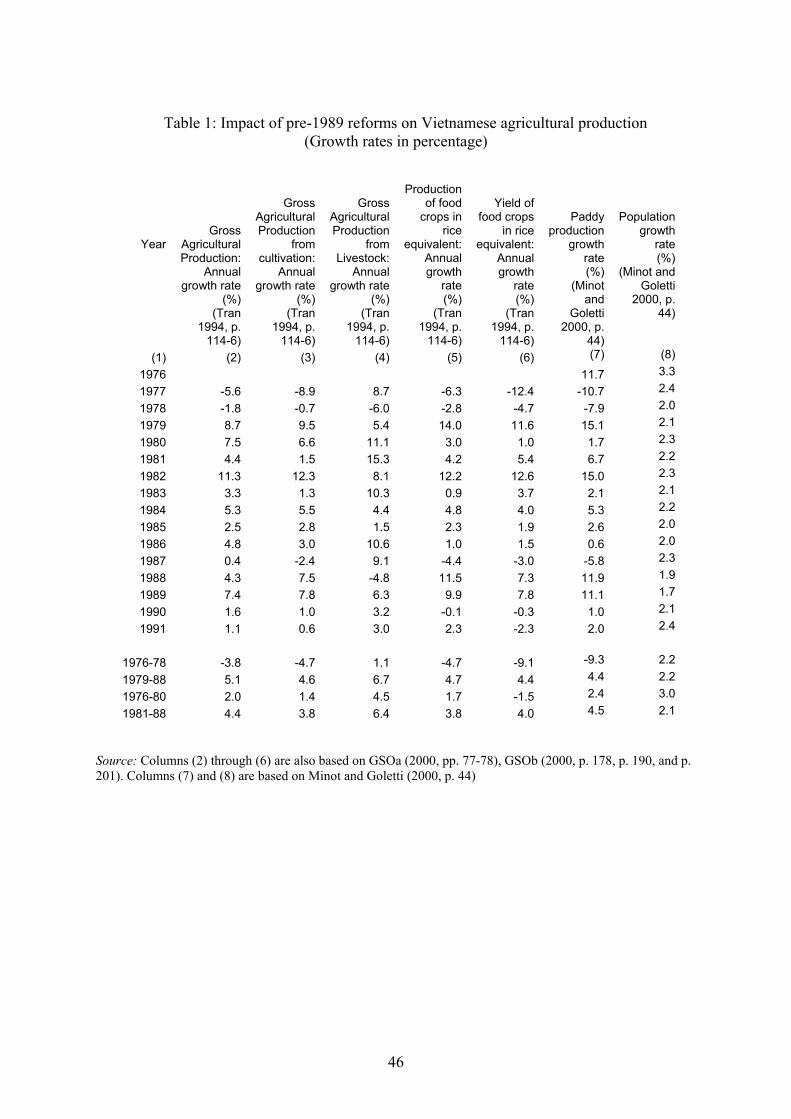
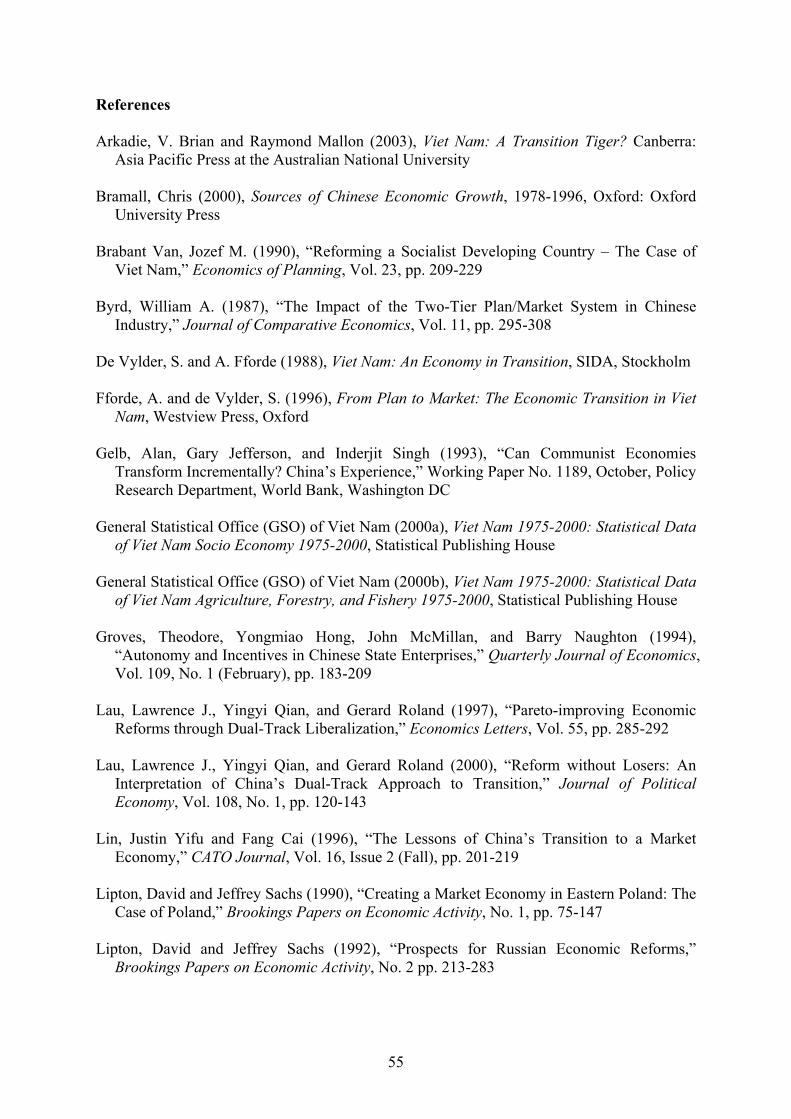
Table 1 and Figure 1 present some relevant information. We see that while the average
annual growth rate of gross agricultural production for the 1976-1978 period was -3.8 percent,
it jumped to 5.1 percent during 1979-1988. Even if we leave out 1979 and 1980 as years of
recovery from the particularly bad years (due to natural disasters) of 1977 and 1978, the
average annual growth rate for 1981-1988 turned out to be 4.4 percent, a significant jump
over the previous period’s growth rate. Going across the columns of Table 1, we see that the
turnaround was wide ranging, covering both cultivation and livestock. The cereal production
underwent a dramatic improvement, with the average annual growth rate increasing from -4.7
to 4.7 between the periods of 1976-1978 and 1979-1988, respectively. Much of this increase
resulted from increase in yield, not surprising given that arable land in Viet Nam is very
limited. While the yield of food crops had decreased at an annual rate of 9.1 during 1976-
1978, it increased at a rate of 4.4 percent during the whole period of 1979-1988.2
7
-2
-1
0
1
2
3
4
5
6
7
Agricu
lture
Cultivati
on
Lives
tock
Cereal
Cereal Y
ield
Rice
1976-801981-88
Figure 1: Impact of pre-1989 reforms on the performance of Vietnamese agriculture: Comparison of average annual growth rates (%) during 1976-80 and 1981-88
The second point that we may note from Table 1 is that, contrary to Sachs and Woo’s
suggestion, 1989 measures did not have much, if any, positive impact on Vietnamese
agriculture. It is true that the growth rate of agriculture in 1989 proved to be higher than in
1988. However, going across the columns we see that this is largely a result of a rebound
from a particularly bad downturn that livestock production took in 1988. Looking at
cultivation, we find growth rates in 1989 and 1988 to be similar, 7.5 and 7.8 percent,
respectively. The growth rate of paddy production in 1989 was actually lower than in 1988,
11.1 compared to 11.9 percent. Also, the performance of Vietnamese agriculture deteriorated
sharply in the post 1989 years. The annual growth rate of agriculture in 1990 and 1991
proved to be only 1.6 and 1.1 percent, respectively. The production of cereal actually fell in
1990 compared to that of the previous year and the yield of food crops fell in both 1990 and
1991.
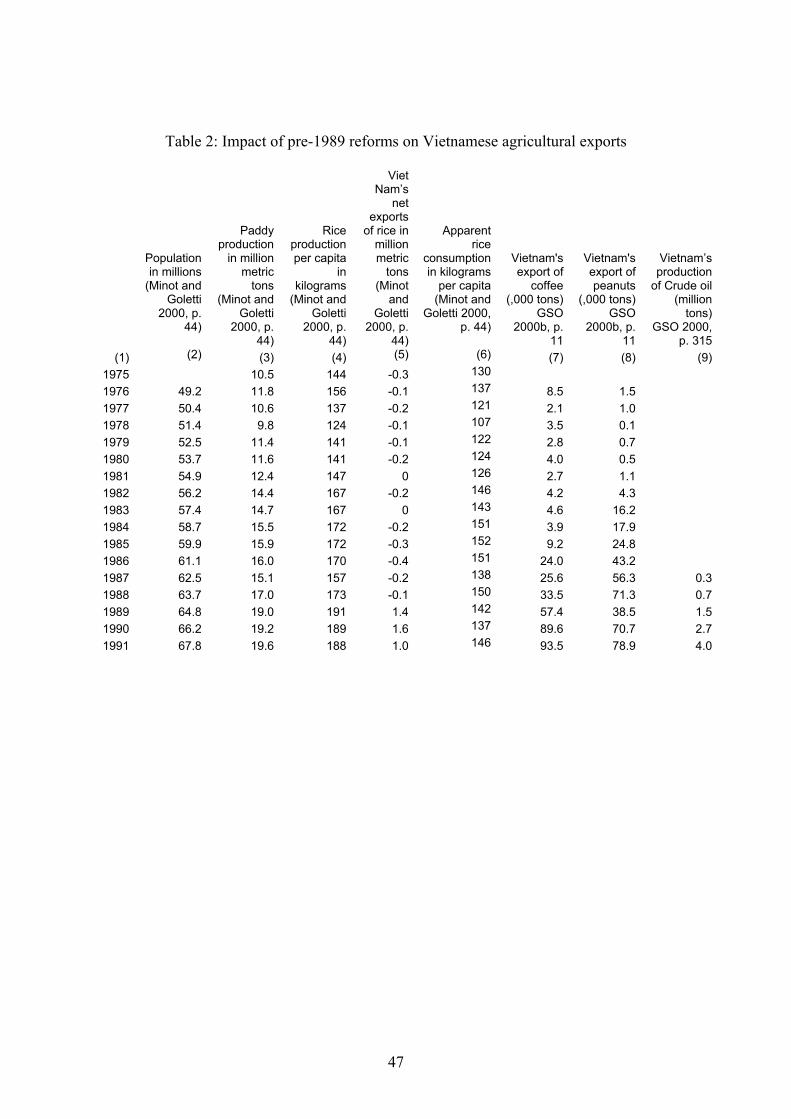
Sachs and Woo make much of Viet Nam’s export of rice in 1989. According to them,
while rice import was “soaring” in the previous years, 1989 measures created a miracle for
2 Even Riedel and Comer, who are sympathetic to Sachs and Woo’s view, concede that “the response to this reform was … a remarkable acceleration in agricultural output….” (Riedel and Comer 1997, p. 6)
8
Vietnamese agriculture, so that all of a sudden she had a huge increase in production and
started to export rice. Table 2 provides some additional information to assess these claims.
Information in Tables 1 and 2 show that Viet Nam became capable to export rice over time as
a result of reforms introduced in 1981 and not suddenly from reform of 1989. The annual rate
of growth of paddy production increased from 2.4 percent (less than the population growth
rate of 3.0 percent) during 1976-80 to 4.5 percent (more than twice the population growth
rate of 2.1 percent) during 1981-88 (Table 1). It is therefore no wonder that over time
Vietnamese had more rice to consume and eventually to export. Per capita consumption of
rice rose from 126 to 150 kilogram between 1981 and 1988 (Table 2). Instead of “soaring,”
Viet Nam’s import of rice during the years immediately preceding 1989 actually decreased
from 0.4 million ton in 1986 to 0.1 million ton in 1988. The rising agricultural capability was
not limited to rice. Table 2 shows a steady increase in Viet Nam’s export of agricultural
commodities throughout the 1980s. Between 1981 and 1988, Viet Nam’s export of tea, coffee,
Nam’s export of rice increased from 9 thousand tons in 1981 to 132 thousand tons in 1986
(GSO 2000b, p. 11), even though on a net basis Viet Nam remained an importer of rice
during those years. What happened in 1989 is a price effect arising from devaluation, which
made export more lucrative than domestic sales. That is why we see that Viet Nam’s rice
export in 1989 was associated with a significant decline in per capita consumption, which fell
from 150 in 1988 to 142 kilogram in 1989, and it remained less than the level reached in
1988 till 1993.3 In sum, the production capability that allowed Viet Nam to export rice in
1989 was built over time as a result of pre-1989 reforms.
3 There is a similarity in this regard to what happened in Viet Nam’s oil and gas sector. Viet Nam has been conducting (with Soviet help) exploration for a long time during the seventies and eighties. However, coincidentally oil output for export became available around 1989. It is therefore inaccurate to imply that Viet Nam suddenly became capable to export oil in 1989 as a result of measures taken in that year, just as it is inaccurate to suggest that the production capability to export rice was created overnight in 1989 due to the measures taken in that year.
9
3.2 Pre-1989 reforms in industry
Vietnamese industrial reforms also started with the August-September 1979 VCP CC
Sixth Plenum. The industrialization strategy pursued during the FFYP (1976-1980) was
influenced by the Soviet model with emphasis on capital intensive heavy industry, and
executed through a command system. This led to inefficiencies. For example, the output-
capital ratio decreased from 1.48 in 1976 to 0.87 in 1980. Social productivity decreased by
7.4 percent during the same period. (Tran 1994, pp. 27-28)
The VCP CC Sixth Plenum of 1979 therefore decided to reform the state owned
enterprises (SOE) in the direction of introducing self-accounting and self-financing.
Following the Plenum’s decision, the Vietnamese government promulgated its Decision 25
on January 21, 1981. Under the new system, state-owned enterprises were subject to three
plans (hence the name “Three Plan System”). Under Plan One, the enterprises were provided
with inputs at subsidized prices and in turn were required to supply set quantities of goods to
the state at set prices; under Plan Two, enterprises could produce beyond the amount
specified in Plan One and use revenues to purchase additional inputs; Plan Three gave
enterprises the right to engage in sideline activities more or less on a free market basis, what
became known as ‘fence-breaking’ (xe rao) movement.” (Riedel and Comer 1997, p. 6)
Another decision issued around this time allowed enterprises to link managerial salary
payments to output. Enterprises were allowed to retain up to 85 percent of the profits made
from outside-plan production, and to use these retained profits for paying bonuses to workers.
These reforms initiated during 1979-81 got further boost from the Doi Moi program
adopted at VCP Sixth Congress of 1986. In general, renovation of the management
mechanism, rather than investment promotion, was given priority as the way to enhance
industrial production. Following the Congress, in late 1987, the Vietnamese government
promulgated the Decree 217. It set forth a broad reform program aimed at putting SOEs on a
10
commercial footing, with increased autonomy and financial responsibility. This Decree and
subsequent regulations clarified the relationship between the state and the enterprises.
(Arakdie and Mallon 2003, p. 125)
These changes implied altogether different type of relationships among SOEs and among
business entities in general. These relationships were now on the basis of economic contracts
instead of implementation of directives issued from above. The government established
economic arbitration offices to assist in enforcing contracts. All these changes created a
fundamentally different environment for SOEs to operate and led to significant improvement
in their performance. (Brabant 1990, p. 216)
Industrial reforms of pre-1989 years were not limited to SOEs. Another important
dimension of these reforms was represented by the development of the non-state owned
enterprises (NSE). First of all, there was a basic change in the understanding of the role of the
government in the industrialization process. It was now recognized that the role of the
government was more in creating the conditions and “building the necessary premises” for
industrialization than in carrying out industrialization itself. Second, in line with the changed
attitude, the government took measures favorable for setting up of enterprises under
cooperative and individual ownership. This led to a large increase in the number of NSEs and
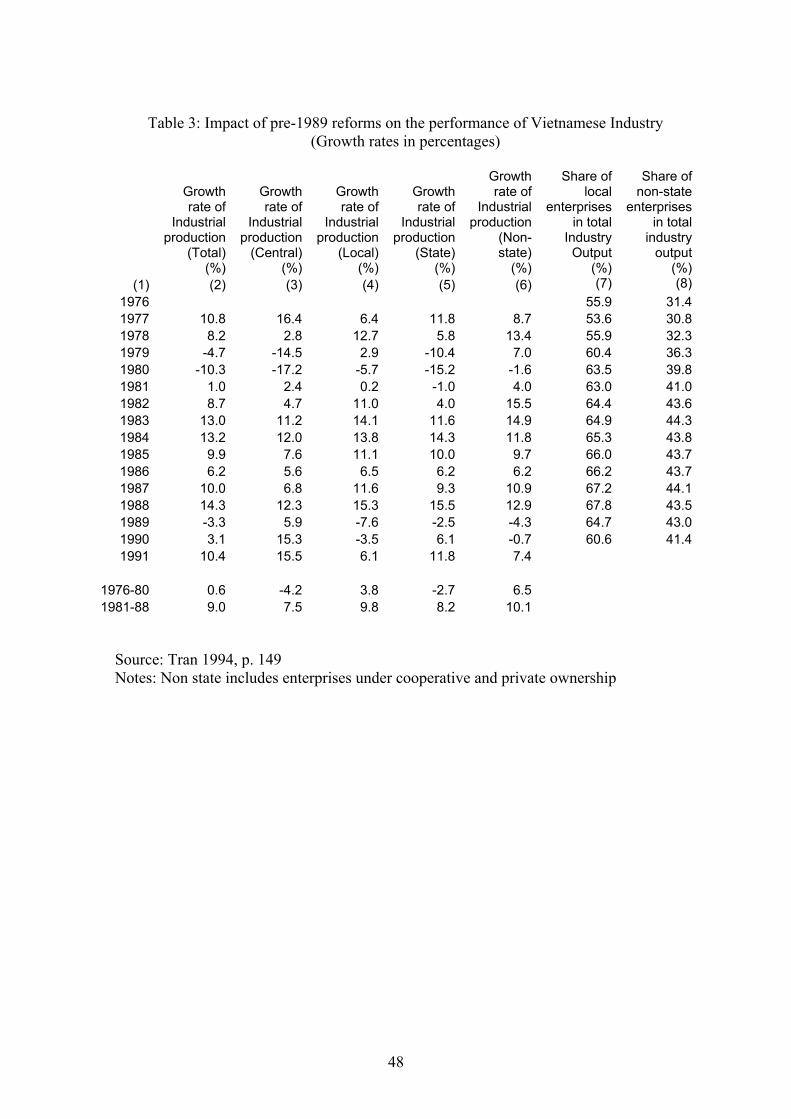
the volume of the output produced by them. The number of non-state industrial enterprises
jumped from 3799 in 1981 to 350909 in 1988 (GSO 2000, p. 249). Thus contrary to Sachs
and Woo’s claim, the explosion in the number of NSEs in Viet Nam was a consequence of
pre-1989 reforms and not of measures adopted in 1989. As a result of their rapid growth, the
share of NSEs in the total industrial output rose from 39.8 percent in 1981 to 43.5 percent in
1988. (Table 3) Another reflection of the growth of NSEs, which were more often under local
than central jurisdiction, was in the changes in relative weights of central and local
enterprises. As Table 3 shows, between 1981 and 1988, the share of the local enterprises rose
11
from 63 to 67.8 percent while the share central enterprises in total industrial output decreased
from 37 percent to 32.2 percent.
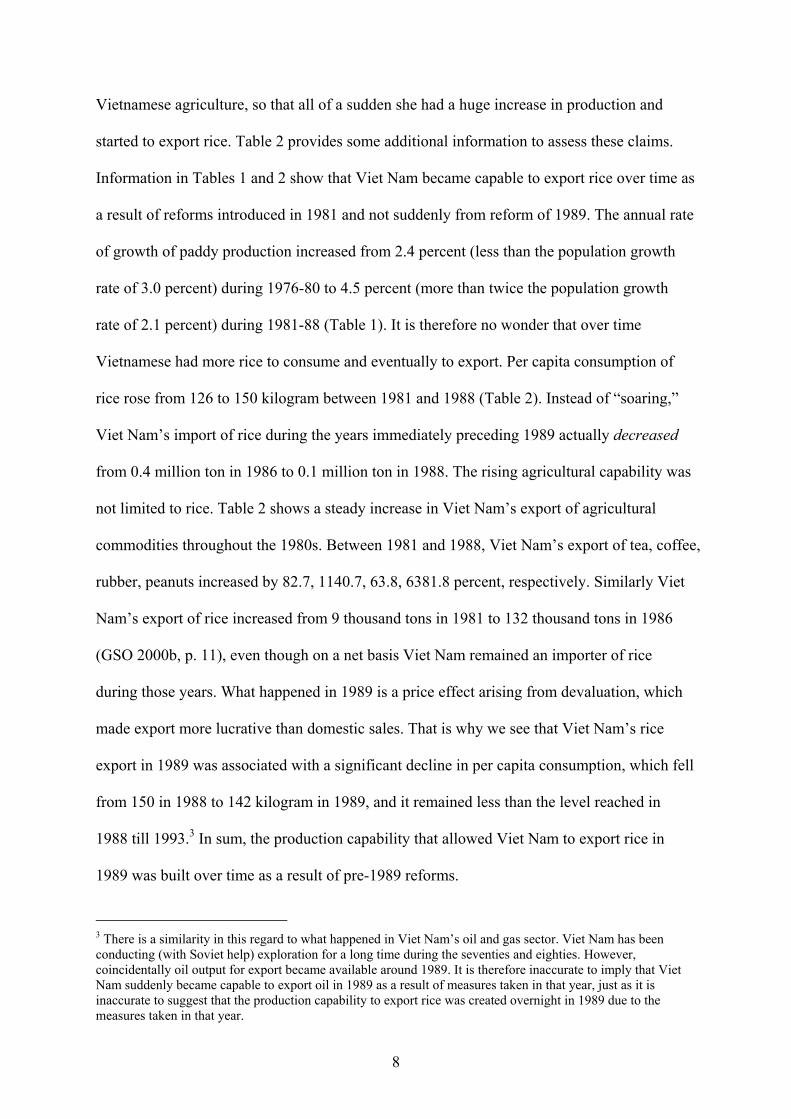
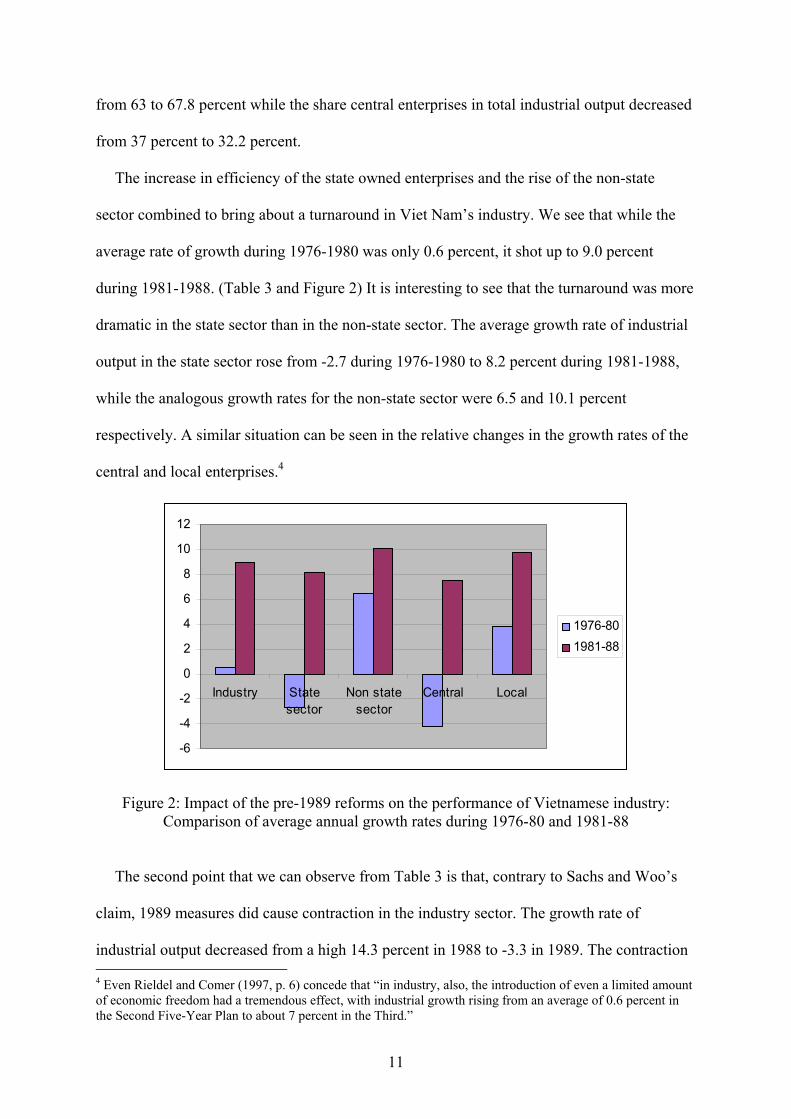
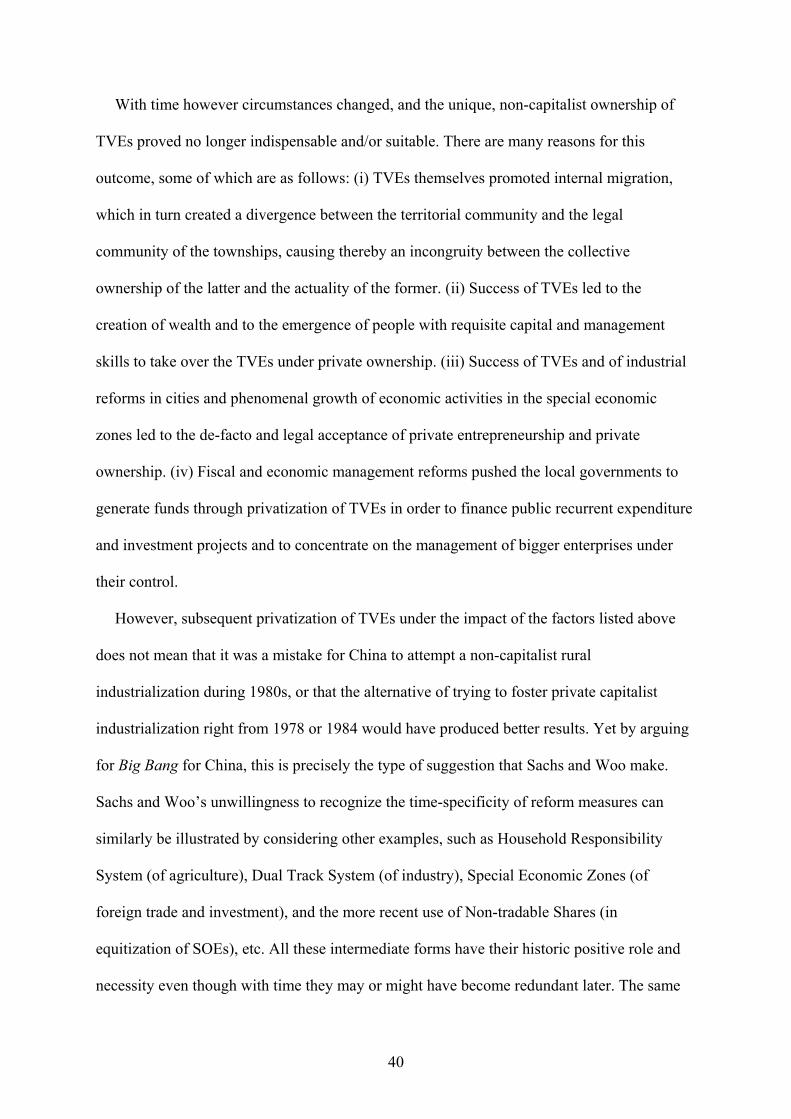
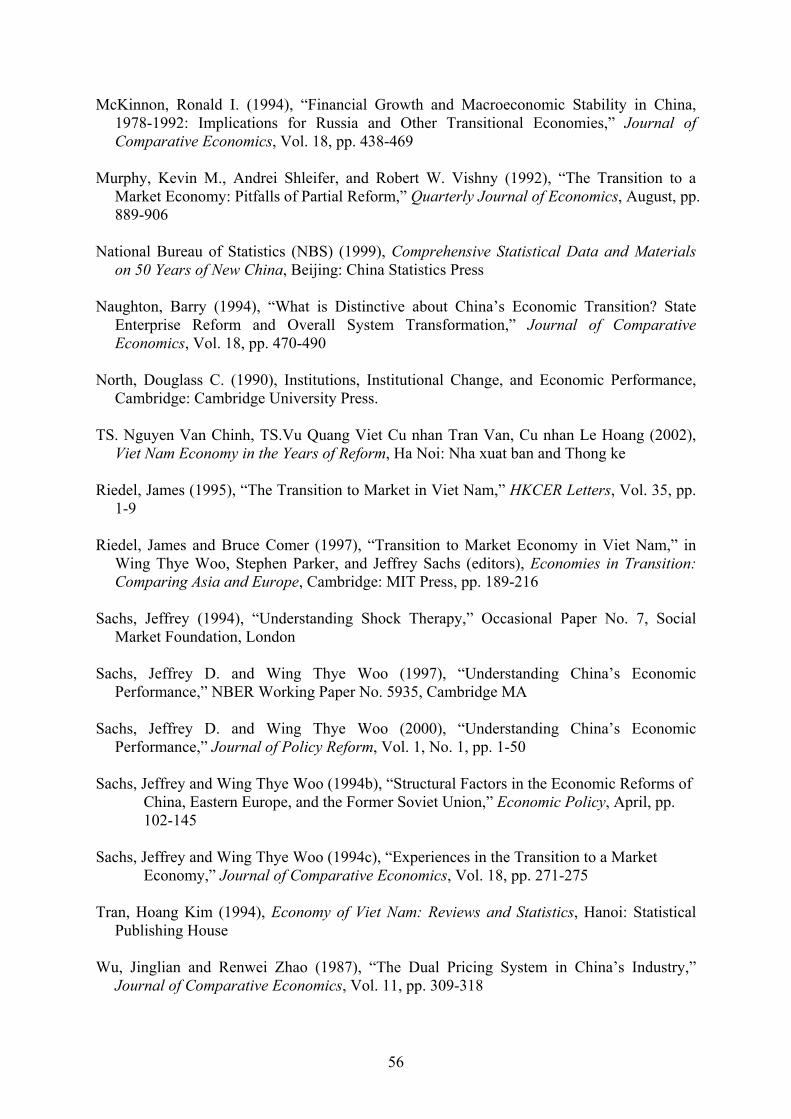
The increase in efficiency of the state owned enterprises and the rise of the non-state
sector combined to bring about a turnaround in Viet Nam’s industry. We see that while the
average rate of growth during 1976-1980 was only 0.6 percent, it shot up to 9.0 percent
during 1981-1988. (Table 3 and Figure 2) It is interesting to see that the turnaround was more
dramatic in the state sector than in the non-state sector. The average growth rate of industrial
output in the state sector rose from -2.7 during 1976-1980 to 8.2 percent during 1981-1988,
while the analogous growth rates for the non-state sector were 6.5 and 10.1 percent
respectively. A similar situation can be seen in the relative changes in the growth rates of the
central and local enterprises.4
-6
-4
-2
0
2
4
6
8
10
12
Industry Statesector
Non statesector
Central Local
1976-801981-88
Figure 2: Impact of the pre-1989 reforms on the performance of Vietnamese industry: Comparison of average annual growth rates during 1976-80 and 1981-88
The second point that we can observe from Table 3 is that, contrary to Sachs and Woo’s
claim, 1989 measures did cause contraction in the industry sector. The growth rate of
industrial output decreased from a high 14.3 percent in 1988 to -3.3 in 1989. The contraction 4 Even Rieldel and Comer (1997, p. 6) concede that “in industry, also, the introduction of even a limited amount of economic freedom had a tremendous effect, with industrial growth rising from an average of 0.6 percent in the Second Five-Year Plan to about 7 percent in the Third.”
12
applied to both the state and non-state sectors, whose output declined by 2.5 and 4.3 percent
in 1989 after increasing at 15.5 and 12.9 percent, respectively, in 1988. The industrial sector
remained depressed in 1990, growing at only 3.1 percent, with the non-state sector still
undergoing a contraction by -0.7 percent.
3.3 Pre-1989 reforms in trade, service, and crafts
The pre-1989 reforms extended to the tertiary sector as well. By allowing free disposal of
above-quota output, the Contract System led to the development of a free market of
agricultural products in the rural areas. This in turn stimulated handicrafts and small scale
service sector enterprises. The process got further boost from many complementary,
proactive measures taken by the government. For example, in early 1987 many checkpoints
established earlier to restrict domestic trade were removed, enabling private markets for
agricultural goods develop rapidly. Many administrative restrictions on private trade were
also lifted. Thus reforms in the area of trade were a direct corollary of the agricultural
reforms. (Arkadie and Mallon 2003, p. 69)
The introduction of the Three Plan system in the industry similarly led to the development
of a free market in industrial products, stimulating thereby further increase in trade and
services. There was a huge increase in the number of privately owned businesses, shops,
restaurants, etc., as reflected in the parallel dramatic rise in the number of NSEs, reported
earlier.5 These reforms in the area of trade and crafts had significant positive impact too. The
average growth rate of the service sector (that includes trade) rebounded from a negative 0.1
percent during 1976-80 to 4.7 percent during 1981-85, and increased further to 8.7 percent
during 1986-90.
5 As Riedel and Comer (1997, pp. 9-10) observe, “Private economic activity did, however, blossom in the informal commercial sector immediately after Doi Moi as doors of restaurants and shops opened almost as fast as they had closed during the purge of the private sector in 1978.” See also Tran (1994, p. 33)
13
3.4 Reforms in the external sector
Pre-1989 reforms spread to the external sector too. First of all, there was a significant
relaxation of restrictions about who can engage in external trade. State owned enterprises
were now allowed to engage in international trade on their own. At the beginning, only large
scale enterprises were allowed to do so, and they were permitted to retain only a portion of
foreign exchange earnings. However, soon further reforms ensued with a goal to boost
exports. These reforms extended to a wider set of state owned enterprises the right to engage
in external trade and to retain a larger portion of their earnings.6 Second, following the Law
on Export and Import Duties on Commercial Goods promulgated in December 1987, most
quotas were eliminated and replaced by import duties. Third, in 1988 a Foreign Investment
Law was passed by the National Assembly and was enacted. This law provided guarantee
against expropriation, allowed full repatriation of profits, and provided tax holidays in order
to encourage foreign direct investment. As noted earlier, state owned enterprises were
allowed to set up joint ventures with foreign firms. Together these measures made it easier
for foreign capital to flow into Viet Nam.7
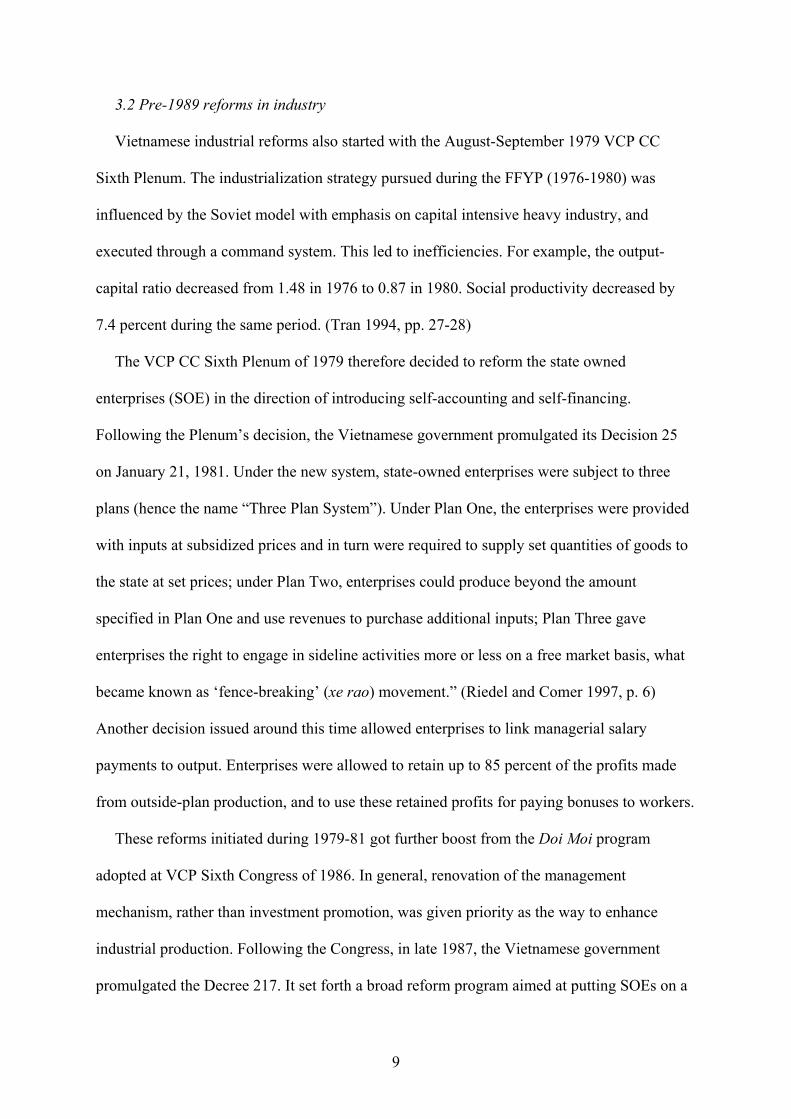
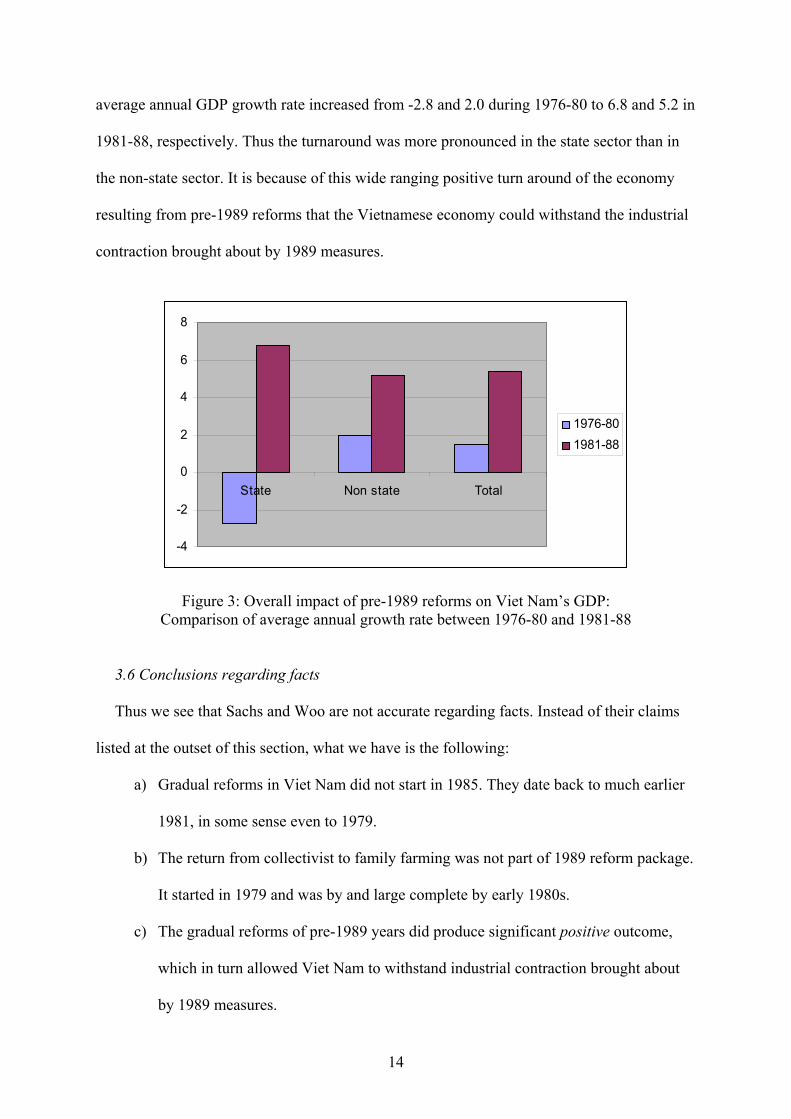
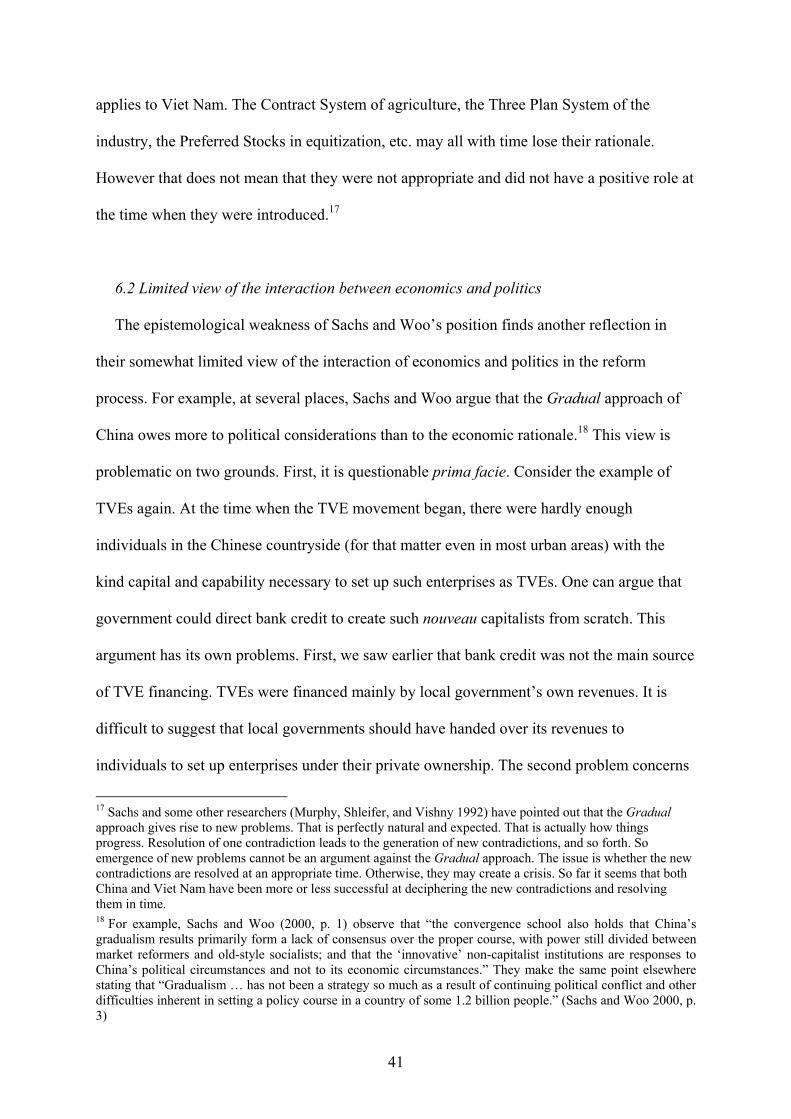
3.5 Overall positive effects of pre-1989 reforms
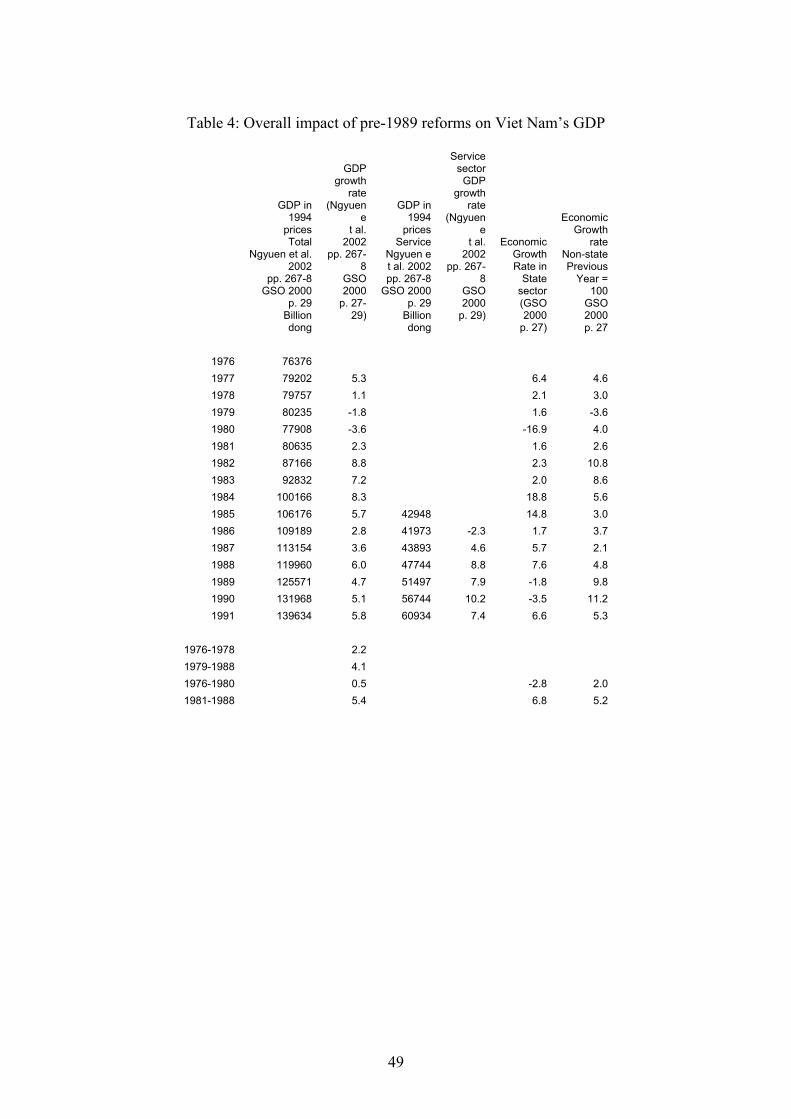
The combined outcome of pre-1989 reforms was a significant turnaround in the overall
performance of the Vietnamese economy. As Table 4 and Figure 3 show, the average GDP
growth rate rose to 5.4 percent during 1981-1988 from only 0.5 percent during 1976-1980.
We also note that the turnaround spread across both state and non-state sectors, for which the
6 As UNDP/World Bank (1993, p. 48) notes, “another early important step in the Doi Moi program was the elimination of the state monopoly of foreign trade in 1988, allowing the establishment of foreign trade organizations (FTOs) and permitting some firms to engage directly in international trade outside the FTOs.”
7 “In addition to freeing up international trade, another early step was a new law permitting and even encouraging foreign direct investment, by providing tax holidays guaranteeing against expropriation, and allowing full repatriation of profits.” (Riedel and Comer 1997, p. 10)
14
average annual GDP growth rate increased from -2.8 and 2.0 during 1976-80 to 6.8 and 5.2 in
1981-88, respectively. Thus the turnaround was more pronounced in the state sector than in
the non-state sector. It is because of this wide ranging positive turn around of the economy
resulting from pre-1989 reforms that the Vietnamese economy could withstand the industrial
contraction brought about by 1989 measures.
-4
-2
0
2
4
6
8
State Non state Total
1976-801981-88
Figure 3: Overall impact of pre-1989 reforms on Viet Nam’s GDP: Comparison of average annual growth rate between 1976-80 and 1981-88
3.6 Conclusions regarding facts
Thus we see that Sachs and Woo are not accurate regarding facts. Instead of their claims
listed at the outset of this section, what we have is the following:
a) Gradual reforms in Viet Nam did not start in 1985. They date back to much earlier
1981, in some sense even to 1979.
b) The return from collectivist to family farming was not part of 1989 reform package.
It started in 1979 and was by and large complete by early 1980s.
c) The gradual reforms of pre-1989 years did produce significant positive outcome,
which in turn allowed Viet Nam to withstand industrial contraction brought about
by 1989 measures.
15
d) The pre-1989 reforms were directed to problems of macro-economic imbalances
too. We take up this last point for discussion in the next section.
4. How appropriate is the characterization?
According to Sachs and Woo, the Vietnamese Big Bang of 1989 consisted of the following
four elements: (a) across-the-board price liberalization; (b) devaluation and unification of the
foreign exchange market; (c) tight credit policy; (d) return of the collective farms to family
farms with long-term lease. We have already seen that the return of collective farms to
families occurred much earlier and was not part of 1989 measures. So inclusion of item (d)
above is not correct. This leaves us with (a)-(c). We may note that going by the conventional
terminology of the transition literature, (a) and (b) can be grouped together as “liberalization
measures,” while (c) may be classified as the “stabilization measure.”
In considering whether it is appropriate to characterize Viet Nam’s 1989 measures as a Big
Bang, we notice that the notion of Big Bang usually has two connotations: First, it has to be
the beginning of a fundamentally new process, and second, it has to be something big,
occurring all at once. Let’s examine whether the 1989 changes satisfy these requirements.
4.1 Viet Nam’s 1989 measures: Were they the beginning?
According to Sachs and Woo (pp. 16-17), Viet Nam’s pre-1989 reforms “did not address
serious macroeconomic imbalances.” This creates an impression that no pre-1989 efforts
were directed at Viet Nam’s macroeconomic imbalances. A closer look at Viet Nam’s reform
process shows that this is actually not true.
Reforms introduced in 1981, alongside their general positive impact, had some negative
consequences. The most prominent among these was inflation. In pre-reform years, prices in
Viet Nam, as in other centrally planned economies, were controlled administratively.
16
Inflationary pressures under this situation remained generally suppressed, finding some outlet
only in illegal black markets. However, the reforms since 1981 led to the development of a
thriving market in both rural and urban areas. The stage for visible inflation was therefore set.
As Friedman famously argued, inflation was always and everywhere a monetary
phenomenon. In Viet Nam too, it was excess money supply (relative to the goods and
services) that was causing inflation. There were two main sources of excess money supply.
The first was subsidies in the form of budgetary grants and concessionary credits given to
SOEs. Introduction of enterprise autonomy under the Three Plan System while SOEs were
still very much under soft budget constraints led to some unintended consequences. In
particular, the SOEs found it convenient to divert more resources to Plan Three catering for
the free market and turn deficits on Plan One catering for the Plan Sector. They could then
turn to the state budget and/or banking system for subsidies to cover their deficits on Plan
One. The second source of inflation was the subsidies to products for consumption, in
particular by urban dwellers. Together, these led to a situation of rising output associated with
a rising inflation. (Brabant 1990, p. 213; Reidel and Comer 1997, p. 8)
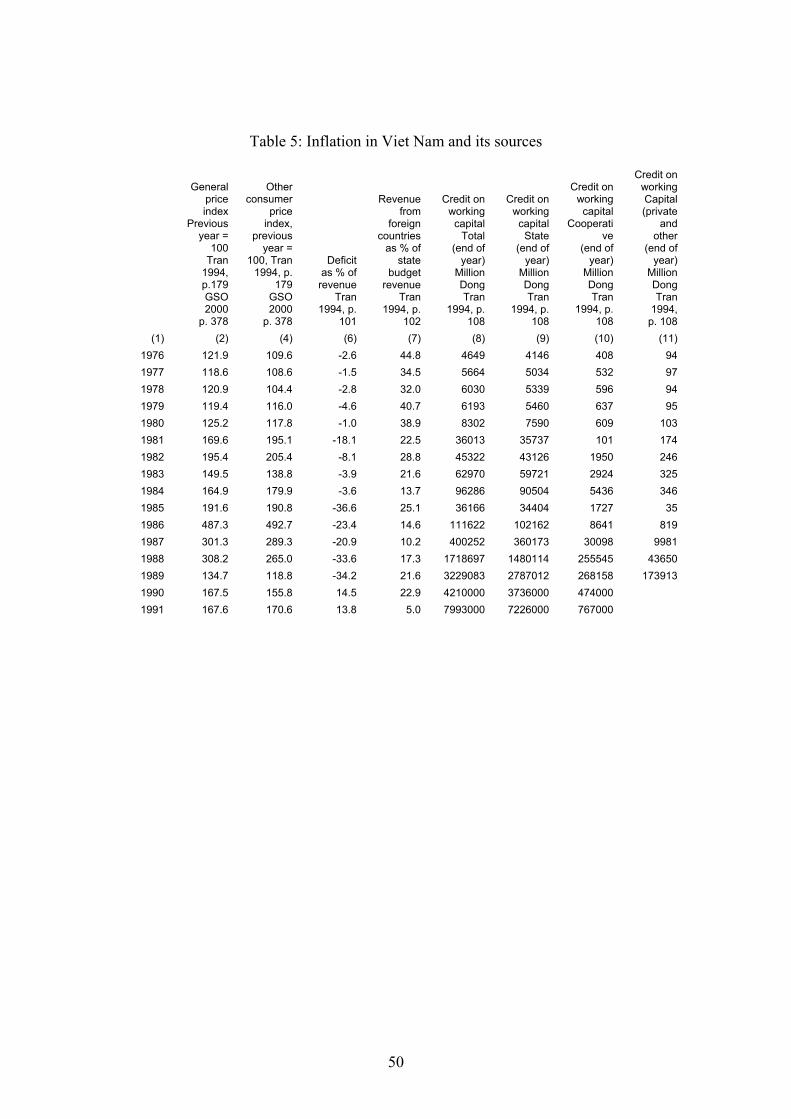
Table 5 helps to understand the process. We see that the budget deficit as percentage of
revenue jumped from 2.5 during 1976-1980 to 18.1 in 1981. Alongside, credit on working
capital jumped 4.3 fold from 8.3 billion Dongs in 1980 to 36.0 billion in 1981. No wonder,
inflation (as measured by increase in the general price index), which averaged to 20 percent
per annum during 1976-1980, jumped to 70 percent in 1981. During the subsequent 1982-
1984 years, the government succeeded in restraining the budget deficit, however this was
offset by expansion of credit, which grew at an average annual rate of 32.8 percent between
1981 and 1984. Accordingly, inflation during this period (1982-84) ran high, averaging to
about 70 percent per annum. Such high rates of inflation were however undermining the
gains of the reform. In particular, they were hurting government officials and other state
17
sector employees who were on a fixed salary. It therefore became imperative, on both
economic and political grounds, to control inflation.
In 1985, Viet Nam took some drastic measures to curb inflation. On 17th June 1985, the
8th Plenum of VCP CC (Session V) adopted the Resolution on “Price-Salary-Money”
basically to eradicate subsidy through equal rise in prices and salaries. The goals were as
follows: (i) raise salaries and wages to compensate for the erosion these underwent during
1981-84 as a result of inflation; (ii) monetize the in-kind components of salary and wages;
(iii) bring the market and plan prices closer by withdrawing subsidies; and (iv) increase
salaries and wages to adjust for rise in prices of commodities resulting from subsidy
withdrawal. (Brabant 1990, pp. 213-214 and Tran 1994, p. 33)
In addition to the wage and price reforms, Viet Nam in 1985 also went for currency reform.
She introduced the new Dong equivalent to 10 old Dong. Each person was allowed to convert
a limited amount, and the amount beyond the limit was kept at the State Bank as long term
deposits. The idea was to restrict private consumption and improve money balance in the
economy.
The efforts at macroeconomic stabilization did not end with 1985 measures. In mid-1987
substantial price reforms were implemented raising the official price of most consumer goods
further closer to market prices. The scope of rationing was drastically reduced. At about the
same time, Viet Nam implemented substantial devaluation of its currency. The government
also took steps to streamline the administration by reducing the number of line ministries,
state committees, and other central government agencies, and by rationalizing their structure.
Unfortunately the reforms of 1985 and 1987 were not successful in controlling inflation.
The main reasons were as follows. First, the addition to burden from increases in salary,
monetization of in-kind parts, etc. outweighed the reduction in burden from withdrawal of
subsidies. As a result, as Table 5 shows, the budget deficit soared from 3.6 percent of revenue
18
in 1984 to 36.6 percent in 1985, and it remained high, averaging at 28 percent (of revenue)
during 1986-1989. Second, the volume of credit continued to expand. After undergoing a
marked shrinkage in 1985, credit expansion resumed from 1986. Between 1986 and 1988, the
volume of credit on working capital increased 15-fold. As a consequence, inflation soared.
During 1985-1988, inflation averaged at 222 percent per annum.
One important cause of inflation lay in the government’s failure to mobilize private
savings to cover government budgetary deficit and expansion of credit. There were two
reasons for this failure. The first was the government’s lack of realization of the importance
of and/or ability to ensure positive real interest rates in order to entice private savings to the
formal financial system. The second was the historic availability of dollars as the alternative
medium of exchange and savings (in addition to gold). As a result of these two factors, the
substantial amount of surplus generated by the successful agricultural and other reforms went
into hiding in the form of dollar and gold and remained largely outside the reach of the
formal financial system. The currency swap of 1985 and associated restrictions on
withdrawal of deposits aggravated the situation further by making people more apprehensive
about putting their savings in the formal system. In absence of domestic savings and in the
face of dwindling external savings (loans and grants from the former COMECON8 countries
and western world), the government resorted to inflationary financing.
What is important to note here is that Viet Nam did take important steps during pre-1989
years to address macroeconomic imbalances even though these were not that successful. The
measures of 1989 were a continuation of these on-going efforts and not a new beginning.
Also, these reforms did not end with 1989 measures. Follow up steps had to be taken during
1989-92 to keep the right alignment of prices. The 1989 measures were therefore neither the
beginning nor the end of Viet Nam’s efforts at macroeconomic stabilization.
8 COMECON is the abbreviation for “Council of Mutual Economic Assistance” consisting mainly of former USSR and other East European socialist countries.
19
4.2 Viet Nam’s 1989 measures: Were they big?
Some of the changes introduced in 1989 were indeed apparently big. However, a close
scrutiny shows that these changes were bigger on the outside than they were in essence.
With regard to unification of product prices, first of all, we note that much of the rural
sector was already tuned to market prices and operated outside the plan prices. Hence
unification of agricultural product prices did not have much affect in rural areas. Similarly,
operation of the Three Plan system made a significant part of the urban sector attuned to free
market prices of industrial goods. So the effect of unification of prices was limited mostly to
the relatively narrow sphere of the SOE interaction among themselves.
With regard to unification of foreign exchange markets, again, the actual impact was much
less than the apparent size of devaluation would suggest. One of the reasons was the
previously noted wide prevalence of dollar for accounting, exchange, and store of value. Thus
devaluation of Dong did not affect transactions that were already denominated and carried
out in dollars. Second, as already noted, much of the private sector was hedged against the
devaluation of Dong by switching their savings into Dollar and gold. The devaluation
therefore did not have much direct effect on their net worth.
The main sting of 1989 measures was therefore not in the liberalization steps but in the
stabilization measures. The latter took the following forms. The first is reduction of
government expenditure on public administration. Among the measures taken for such
reduction were restraining civil servants’ wage increase rate below inflation rate and
demobilization of half a million soldiers. The second was cuts in public investment programs.
Table 5 shows that the two steps together resulted in deep cuts. While government budgetary
balance was negative 34.2 percent of revenues in 1989, it turned into positive 14.5 percent in
1990 and stayed positive for the subsequent years. The third stabilization measure was
hardening of the SOE budget constraint. One of the ways in which the latter was done is
20
through raising the rate of interest in order to ensure positive real interest rates. Credit still
expanded. However, the credit expansion now could be better matched by deposits
responding to the positive real interest rates. As a result of these stabilization measures
inflation started to decrease. From about 200 percent in 1988, it came down to 35 percent in
1989. However, even after the 1989 measures, inflation rebounded and reached pre-1989
levels of about 70 percent in both 1990 and 1991. Further measures were necessary to bring
the inflation down. (Brabant 1990, p. 214)
The above shows that the big percentage changes associated with the liberalization
measures of 1989 are somewhat deceptive. Much of it was accommodation of what already
existed instead of creation of a new ground reality and hence did not have much effect. On
the other hand, the stabilization measures that had the sting did produce industrial contraction,
which Viet Nam could withstand because of the continued buoyancy that agriculture and
service sectors enjoyed as a result of pre-1989 reforms. This buoyancy of pre-1989 origin
also enabled these sectors to absorb the half million soldiers demobilized in 1989.
It is because of the dependence of 1989 steps on the outcomes of pre-1989 reforms that
many perceptive external observers, unlike Sachs and Woo, did not attach separate
importance to 1989 measures. For example, Tran, one of the acclaimed Vietnamese
commentators, hardly mentions 1989 measures in his account of the reform process. Instead,
he emphasizes that the achievements of Viet Nam “are the results of a long research and test
process, not simple a ‘leap’ in 1989.” (Tran 1994, p. 23) Similarly, Arkadie and Mallon (2000,
p. 69) note that “while some commentators focus on the reforms implemented from 1989
onwards, important micro-level reforms were introduced from 1986 that resulted in a strong
supply response that greatly improved the environment for the successful implementation of
the subsequent macro level reforms.”
21
4.4 What about privatization?
We have already seen Sachs and Woo’s list of measures taken by Viet Nam in 1989 that
comprised, according to them, “an European Style Big Bang.” Quite notably, there was no
mention of privatization in that list. However, at a different place in the paper, Sachs and
Woo provide the following, more general definition of Big Bang:
“In our usage, Big Bang reforms include: rapid and comprehensive price and trade
liberalization, macroeconomic stabilization, alignment of the official exchange rate to
the market rate, ending legal discrimination against all types of non-state enterprises,
and an early commitment to mass privatization of SOEs, recognizing that actual
privatization will take several years in practice.” (Sachs and Woo 1997, p. 5)
We notice that this definition of Big Bang does include “early commitment to mass
privatization of SOEs,” even though carrying out of privatization is left out of its immediate
scope. This treatment of the privatization issue represents a marked departure from Sachs’
earlier pronouncements on this issue. For example, in discussing the Polish Big Bang, Sachs
clearly mentions that “the third step of the reform process should be privatization.” (Lipton
and Sachs 1990, p. 101) Similarly, in discussing the Russian Big Bang, Sachs repeats the
same position, declaring that “the third task is privatization.” (Lipton and Sachs 1992, p. 229)
Thus according to Sachs of early 1990s, privatization was an integral part of the Big Bang
package.
Furthermore, Sachs (1994) informs that in those early years, many proponents of Big Bang
thought of privatization even as the first task. This was because of their apprehension that
stabilization and liberalization measures would not succeed without privatization carried out
first.9 This may be termed as the original definition of Big Bang, according to which the
whole process has to start with privatization. The definition, according to which privatization
9 “Before 1989, a common view among reformers in the East was that market stabilization and liberalization in advance of privatization would prove futile: the state-owned enterprises would not adjust to market forces, and would find ways to reassert ‘soft budget constraints,’ thereby undermining stabilization.” (Sachs 1994, p. 31)
22
is the third task may therefore be called as the modified definition of Big Bang. However,
even under this modified definition, privatization, though treated as the third task, remains an
integral part of Big Bang and has to occur simultaneously with other tasks from the very
beginning of the process. As Sachs (1994, p. 31) explains, “Shock therapy presupposes that
rapid privatization will be initiated at the time of stabilization and liberalization, so that after
a few years, the economy will be not only market-oriented, but predominantly privately
owned.” From this perspective, the definition that is provided in Sachs and Woo (1997) may
be termed as the re-modified definition of Big Bang, according to which only expression of
‘commitment to privatization’ is enough.10
What is important to note here is that, no matter which of these different definitions is
used, Viet Nam’s 1989 measures do not qualify to be characterized as a Big Bang, because
these measures entailed neither any announcement of privatization nor its actual carrying out.
In fact, Viet Nam has proved to be the most reluctant among transition countries to privatize
SOEs. There is still no commitment to whole scale privatization. The privatization aspect of
Big Bang’s definition provides further ground why it is inappropriate to characterize Viet
Nam’s 1989 measures as a Big Bang.
4.5 Doi Moi of 1986: The real turning point
Viet Nam therefore did not adopt the Big Bang approach despite the apparent sharpness of
1989 measures. It basically followed the Gradual approach. However, if someone wishes to
identify a decisive point in Viet Nam’s reform process, it is probably provided by the VCP
Sixth Congress in 1986 that adopted the Doi Moi program. Even though reforms got under
way from early 1980s, these reforms had a hesitant and tentative character. It was still not
10 These repeated modifications of Big Bang’s definition are instructive, and they seem to be ex-post responses to the negative experience of Russian privatization. In fact, it is noteworthy that Sachs now does not want to consider Russia as an example of Big Bang reform. (Sachs and Woo 1997, pp. 5-6) Such ex-post tailoring of the definition of Big Bang however undermines the very integrity of the concept.
23
clear whether the VCP and the government as whole have committed themselves to a switch
to the market system, and how far they were ready to go in this new direction.
In fact, Viet Nam witnessed contradictory processes during the initial years of reform.
There was a clear paradox in the situation. After the victory and political unification of the
country in 1975, Viet Nam went through an interim three-year (1978-80) plan. As that plan
period came to an end, Viet Nam drew up its first Five Year Plan for 1981-85. This Plan was
supposed to lay the foundations for “a more complete socialist transformation,” and it set out
to construct “a strict central planning system with allocations of capital and inputs and labor
being made centrally.” The Party did initiate a critical reevaluation of the economic strategy
early on, as was reflected by the discussion of the 1979 (August-September) Sixth Plenum of
CC. However, the First Five Year Plan showed that the debate has not then reached a final
conclusion, and Party was still not sure about the direction to take.
Meanwhile, events overtook Plans. Instead of further collectivization, there started out a
process of de-collectivization. Instead of a stricter central planning system, there started a
process of moving away from the Plan. There was therefore a contradiction between “high
official thinking” expressed in Plan documents and what was actually done (or taking place)
at the ground level.
It is an interesting question as to why this contradiction arose and why the real Viet Nam
moved away from the theoretical Viet Nam described in high official thinking. This paper is
not the place to pursue a full answer to this question. However, the following few brief
observations can be made. First, Viet Nam could not avoid the inefficiencies resulting from
collectivization imposed on a pre-industrial agriculture. Second, Viet Nam could not avoid
the inefficiencies arising from an industrial policy that emphasized heavy industry at the cost
of light industries, where Viet Nam’s comparative advantage lay. Third, efficient
management of the state owned enterprises continued to pose problems despite the attempt to
24
overcome them through formation of Unions (of enterprises). Fourth, exodus of the Chinese
population following the unification in 1975 and aggressive pursuit of anti-capitalist policies
of post-1975 years added to the economic problems. Fifth, military conflicts with Kampuchea
and China in 1978 made things worse. Sixth, Viet Nam had to confront the actual and
potential decrease in assistance from COMECON countries. Seventh, Viet Nam could not
avoid the impact of the reforms already introduced in China since 1978. Eighth, Viet Nam
could not avoid the influence of successful market economies of the neighboring East Asian
countries.
As a result of these influences, VCP adopted Resolution 100 in January 1981 initiating
decollectivization of agriculture and Three Plan System for industry even though these went
against the directions set out in the First Five Year (1981-85) Plan document. The hesitant
nature of the reform process found reflection in some policy reversals that took place in 1983
in order to contain ‘anarchy’ in the market. Even the Second Five Year Plan, drawn up for
1986-90, emphasized the need to “broaden the collective economy,” to “restrict the negative
aspects of the private economic sectors,” and to uphold the leading role of the state sectors.
By 1986, however, the VCP was ready for a strategic switch from central planning to the
market system. Two sets of circumstances led to this development. The first is the
encouraging results from reforms introduced in 1981. The second is the emergence of new
problems, in particular the problem of inflation. Faced with inflation, the government had two
routes to take. One was to put a brake on the reforms and return back to central planning and
administered prices. However, time and experience have made that route unacceptable. The
other route was to accept the market, and make the best use of market mechanisms to solve
the problem. The moment came, and the issue of choosing between plan and market could
not be postponed any longer. The Sixth VCP Congress made the choice in favor of market
reforms by adopting Doi Moi. It is for these reasons that the Sixth VCP Congress can be
25
termed as the decisive event, the real turning point, in Viet Nam’s gradual transition from
central planning to market.
4.6 Conclusions regarding characterization
The characterization of Viet Nam’s 1989 measures as a Big Bang is a
mischaracterization. Such a characterization is based on a rather superficial understanding of
the Vietnamese reform process. The 1989 measures did not start anything new. They were a
continuation and part of an ongoing wide ranging reform process. It is therefore erroneous to
absolutize them, lionize them, and counter-pose them to pre-1989 measures. Even the failure
of pre-1989 stabilization measures provided valuable learning mechanism for Viet Nam to
enact and implement the 1989 steps. If any pivotal point for the Vietnamese reform process
needs to be identified, it should be sought in the Sixth Congress of VCP of 1986 that adopted
the Doi Moi program.
5. How acceptable is the hypothesis?
Sachs and Woo’s hypothesis that China would have grown faster had she adopted Big
Bang like that of Viet Nam’s 1989 measures may be interpreted in two ways, namely
prospective and retrospective. The prospective interpretation would suggest that China could
have higher growth rates from 1989 onwards if she had adopted similar measures as Viet
Nam did in that year. The retrospective interpretation, on the other hand, would suggest that
China would have grown faster earlier had she adopted measures similar to Viet Nam’s 1989
measures in, say, 1978 or 1984. It is not clear which of the two interpretations Sachs and
Woo have in their mind. However, in either case, to judge the hypothesis, we need to
examine the concrete Big Bang steps that Sachs and Woo would have liked China to take
(inspired by Viet Nam’s 1989 measures) in order to bolster her growth rate. The list that
26
Sachs and Woo provide include: (a) faster unification of product markets, (b) faster
unification of foreign exchange markets, and (c) imposition of harder budget constraint on
state enterprises. Let’s consider these in turn.
5.1 Unification of product markets
What could China emulate from Viet Nam’s 1989 measures with regard to unification of
product markets? To answer this question, we need to take a look at the Chinese price reform
process. Byrd (1987) provides one of the early accounts of price liberalization in China.11
Others who have analyzed Chinese price reform include Lau, Qian, and Roland (1997, 2000),
Wu and Zhao (1987), Xu (1998), Lin and Cai (1996), and Bramall (2000). The picture that
emerges from these accounts is as follows.
Price reform of the recent period in China started in September 1979, when industries and
localities were allowed to vary prices of their products by 20 percent from centrally
determined prices depending on specific supply and demand conditions. Further, prices of
many non-strategic commodities were left completely to “market forces.” After January 1985,
the pace of price reform was accelerated through introduction of the Dual Track (or Two
Tier) system, under which enterprises were allowed to charge “market floating prices” (prices
that were marginally below market prices) for output that was above the plan.
Byrd (1987, pp. 299-305) notes that the dual track system triggered dynamics that
propelled the economy toward more market determined outcomes. There were several
channels through which this process unfolded. The first of these is what Byrd terms as
“growing out of plan.” This refers to the fact that plan targets were often fixed in absolute
terms. With growth of the total output, the share subject to plan prices steadily decreased.
11 Byrd (1987) begins his analysis with a theoretical treatment of the dual track system and distinguishes between sellers’ and buyers’ markets. Given that transition economies are generally characterized by shortages, we are generally dealing with sellers market, the conclusions regarding the former is more pertinent. Byrd (1987, pp. 296-298) also notes a more complex origin of the Two Tier system going back to even the Maoist period.
27
Second, often the planned part was reduced by the authorities. Third, plan prices were often
raised to make them more equal to the market prices. Fourth, through the practice of
“monetization of the embodied rent,” even the plan portion was priced at market prices and
the payers were given subsidy equaling to the difference. Byrd thought that, so far as the
incentive role of prices is concerned, introduction of dual track was enough, because at the
margin it was market prices that mattered, and hence there was not much necessity of even
unification of the two markets.12 He thought that prices reforms in China have been so
successful and effective, that the issue of price reforms for China has become a passé.13
In their discussion of unification of product prices in China, Lau, Qian, and Roland (1997,
2000) distinguish two types of market liberalization. The first is “Limited Market
Liberalization (LML),” which they define as the situation when “market resale of plan-
allocated goods and market purchases by planned suppliers for fulfilling plan-mandated
delivery quotas are not permitted.” The second is the “Full Market Liberalization (FML),”
which refers to the situation when “market resale and market purchases for redelivery are all
allowed by a planned supplier or a rationed user, as long as its obligations under the plan are
all fulfilled.” Lau, Qian, and Roland think that the Chinese product market liberalization was
close to being FML, because resale, sub-contracting, and purchases for redelivery were not
prohibited. They further note that such FML began with the agricultural sector, whereby
farms were allowed to purchase grain and other output from the market to be redelivered to
the state in order to fulfill their quota since 1979.
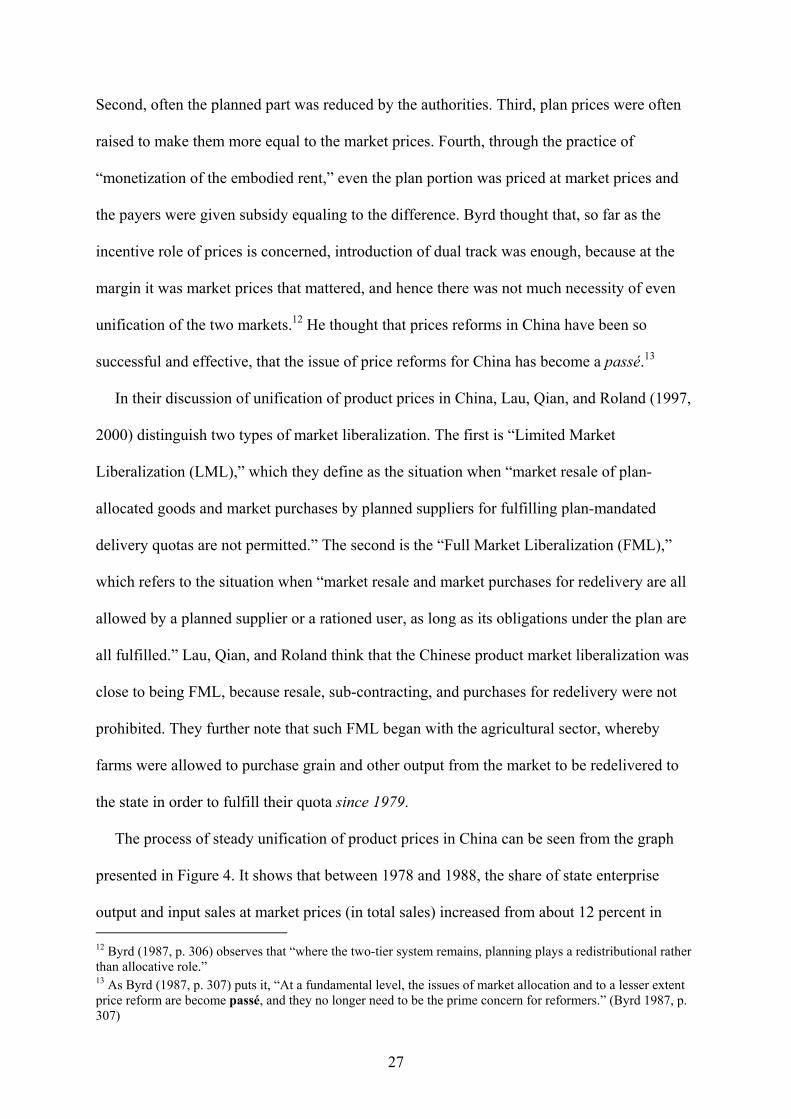
The process of steady unification of product prices in China can be seen from the graph
presented in Figure 4. It shows that between 1978 and 1988, the share of state enterprise
output and input sales at market prices (in total sales) increased from about 12 percent in
12 Byrd (1987, p. 306) observes that “where the two-tier system remains, planning plays a redistributional rather than allocative role.”
13 As Byrd (1987, p. 307) puts it, “At a fundamental level, the issues of market allocation and to a lesser extent price reform are become passé, and they no longer need to be the prime concern for reformers.” (Byrd 1987, p. 307)
28
1980 to about 70 percent by 1988. Similarly, the share of collective enterprise output sold at
market prices (in total cases) increased from about 37 percent in 1980 to about 82 percent by
1988. As the mirror opposite, the share of retail sales at state fixed prices over the same
period decreased from 97 percent (of total sales) to about 30 percent. This steady pace of
unification of product prices meant that China was quite ahead of Viet Nam in unification of
product prices and was not in need of a large correction as was the case in Viet Nam in 1989.
Figure 4: Continuous process of unification of prices in China Source: Zhou (1992) and Gelb, Jefferson, and Singh (1993)
5.2 Inflation
What triggered Viet Nam’s 1989 measures was runaway inflation. Was there anything for
China to emulate from Viet Nam’s 1989 measures with regard to inflation? Ironically,
keeping inflation under control was one of the remarkable successes of China’s reform
29
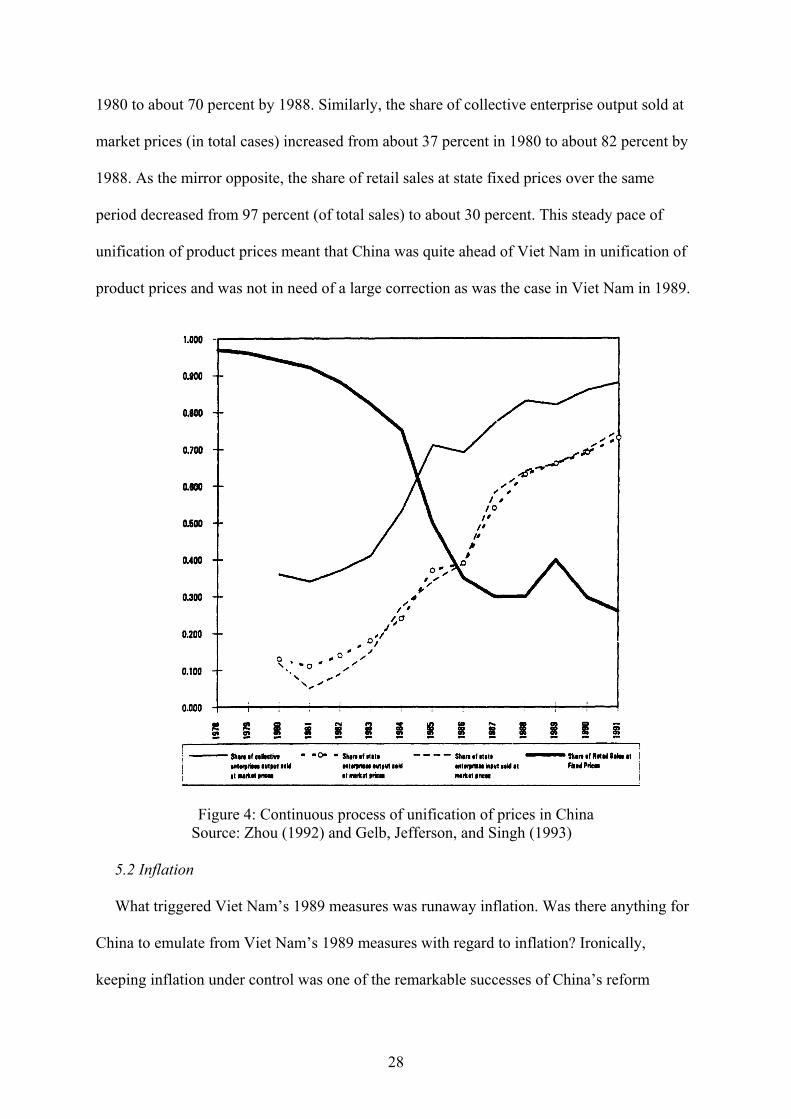
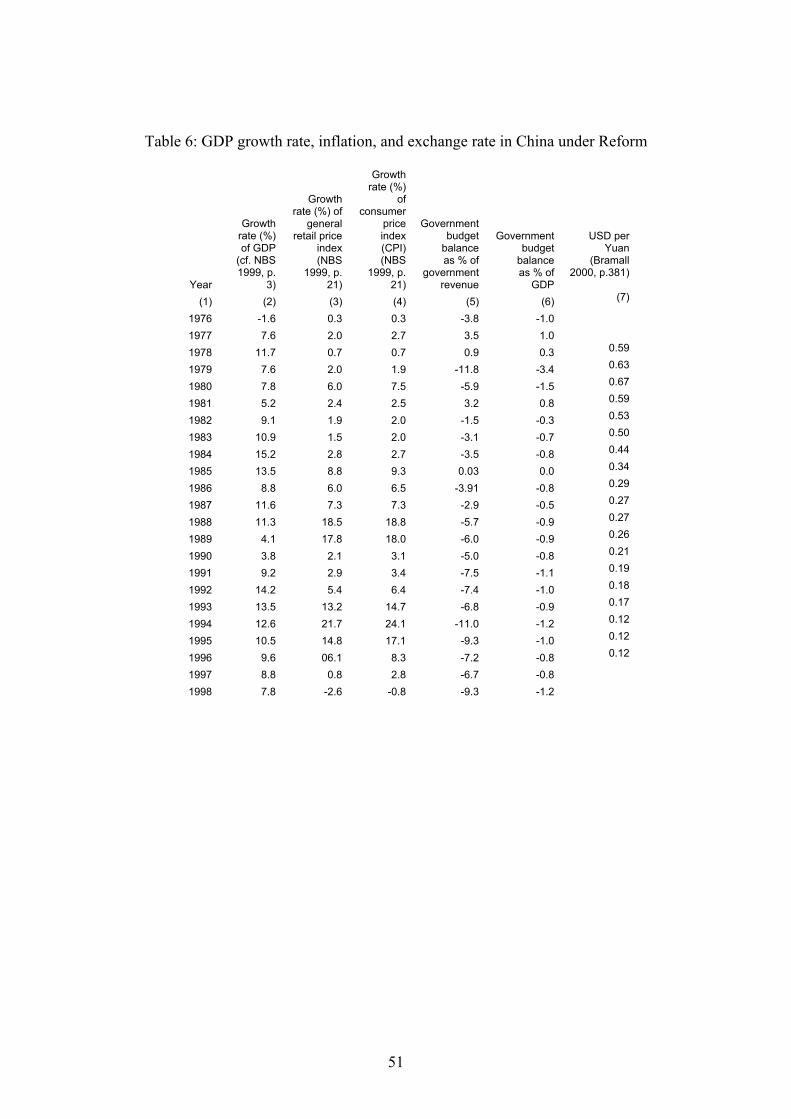
process. As Table 6 shows, inflation in China, as measured by annual growth in general retail
price index, averaged (simple arithmetic average of annual rates) to only 3.94 percent during
the entire period of 1978-1987. The corresponding average of inflation measured by annual
growth of CPI was 4.24 percent only. This is a radically different situation from what we saw
in this regard in Viet Nam. McKinnon (1994) noticed that China’s success at controlling
inflation was all the more remarkable in view of China’s deteriorating public finances during
the period.
0
20
40
60
80
100
120
140
160
GPI CPI Budget deficit
Viet NamChina
Figure 5: Comparative financial performance of Viet Nam and China during pre-1989 years: Annual average rate of inflation (in percentage) and budget deficit as percentage of revenue
during 1981-1988
The proximate reason behind China’s success at keeping inflation low was that it could
prevent market prices from running away far off from plan prices. The average differential
between plan and market prices during 1980-1987 never exceeded 35 percent (Zhou 1992
and Gelb, Jefferson, and Singh 1993). Why China proved successful in controlling even the
market prices, and thereby keeping overall inflation under control, is a crucial question that
we will soon discuss. However, what we can see here is that China did not have much to
emulate from Viet Nam’s 1989 measures, so far as controlling inflation was concerned.
30
5.3 Unification of foreign exchange markets
The foreign exchange markets in China were integrated rapidly too. Lin and Cai (1996)
provide a good account of this process. They note that a dual exchange rate system was
introduced in 1981. The proportion of foreign exchange that exporting enterprises could
retain was increased, and these enterprises were allowed to swap their exchange entitlements
with other enterprises through the Bank of China at rates that were higher than the official
rate. In 1985 a “foreign exchange adjustment center” was established in Shenzhen in which
enterprises could trade foreign exchanges at negotiated rates. By late 1980s, most provinces
of China had such centers, and more than 80 percent of foreign exchange earnings were
swapped through such centers. Thus de-facto a market exchange rate could emerge and
prevail for the larger part of foreign exchange transactions.
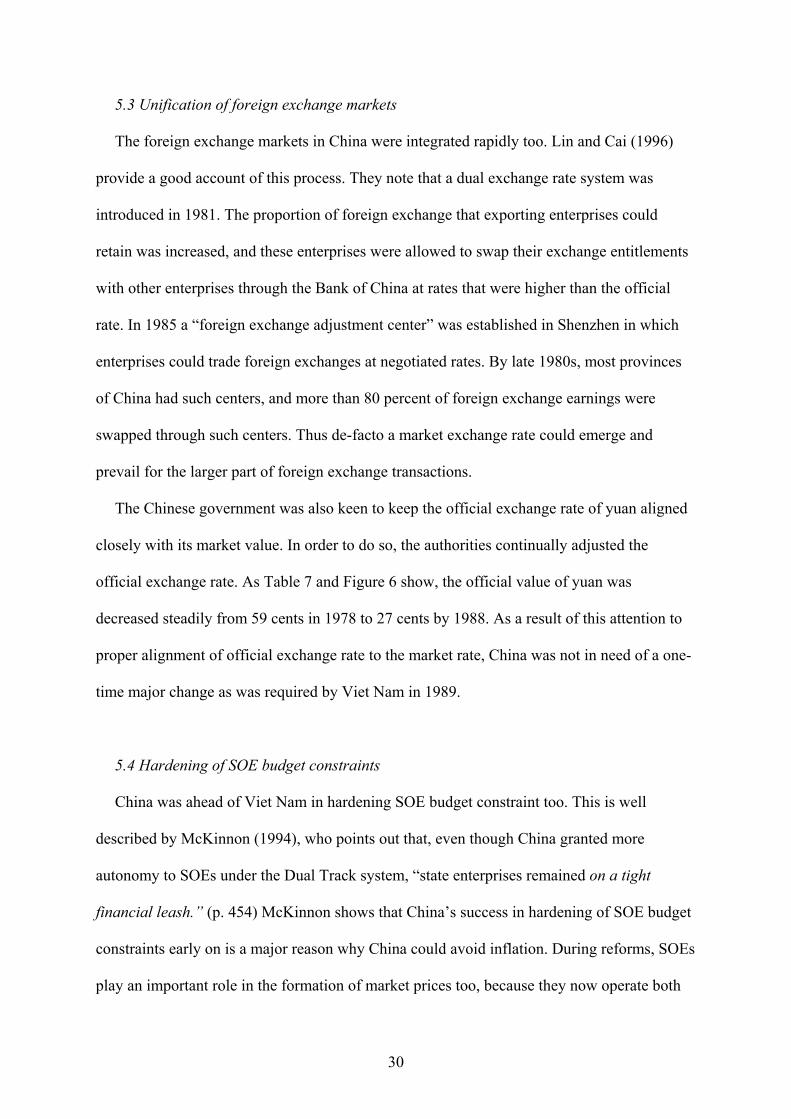
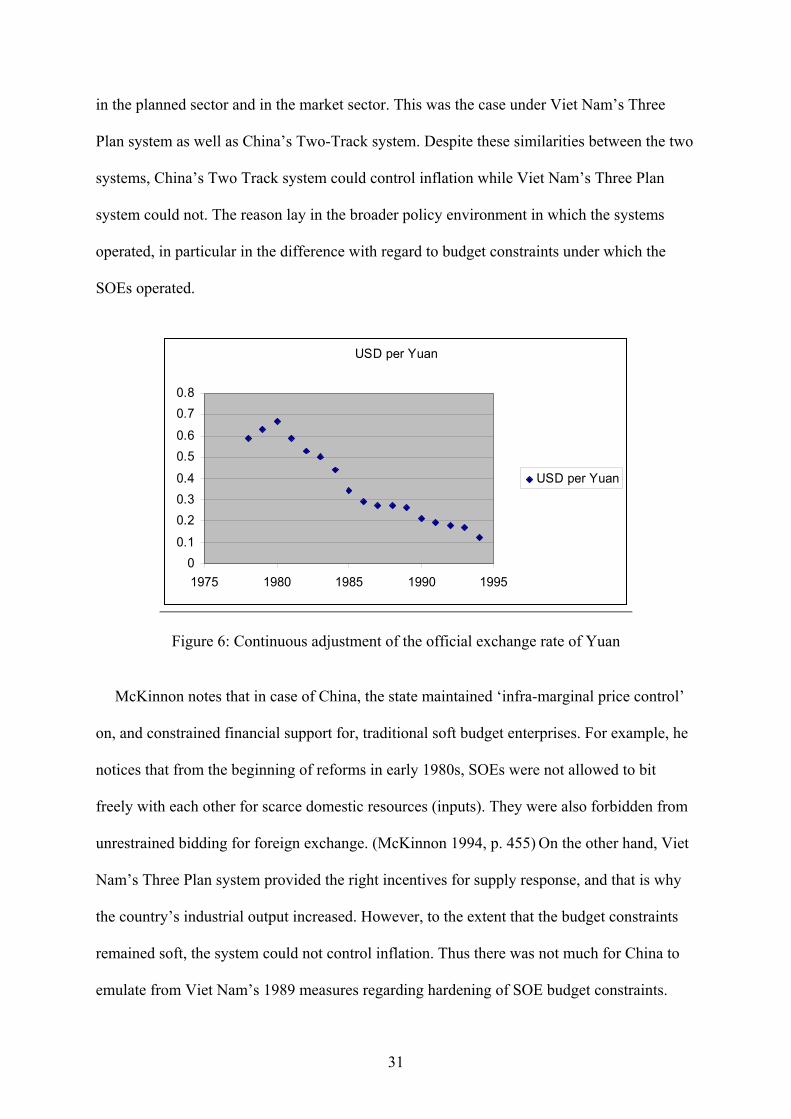
The Chinese government was also keen to keep the official exchange rate of yuan aligned
closely with its market value. In order to do so, the authorities continually adjusted the
official exchange rate. As Table 7 and Figure 6 show, the official value of yuan was
decreased steadily from 59 cents in 1978 to 27 cents by 1988. As a result of this attention to
proper alignment of official exchange rate to the market rate, China was not in need of a one-
time major change as was required by Viet Nam in 1989.
5.4 Hardening of SOE budget constraints
China was ahead of Viet Nam in hardening SOE budget constraint too. This is well
described by McKinnon (1994), who points out that, even though China granted more
autonomy to SOEs under the Dual Track system, “state enterprises remained on a tight
financial leash.” (p. 454) McKinnon shows that China’s success in hardening of SOE budget
constraints early on is a major reason why China could avoid inflation. During reforms, SOEs
play an important role in the formation of market prices too, because they now operate both
31
in the planned sector and in the market sector. This was the case under Viet Nam’s Three
Plan system as well as China’s Two-Track system. Despite these similarities between the two
systems, China’s Two Track system could control inflation while Viet Nam’s Three Plan
system could not. The reason lay in the broader policy environment in which the systems
operated, in particular in the difference with regard to budget constraints under which the
SOEs operated.
USD per Yuan
00.1
0.20.30.4
0.50.6
0.70.8
1975 1980 1985 1990 1995
USD per Yuan
Figure 6: Continuous adjustment of the official exchange rate of Yuan
McKinnon notes that in case of China, the state maintained ‘infra-marginal price control’
on, and constrained financial support for, traditional soft budget enterprises. For example, he
notices that from the beginning of reforms in early 1980s, SOEs were not allowed to bit
freely with each other for scarce domestic resources (inputs). They were also forbidden from
unrestrained bidding for foreign exchange. (McKinnon 1994, p. 455) On the other hand, Viet
Nam’s Three Plan system provided the right incentives for supply response, and that is why
the country’s industrial output increased. However, to the extent that the budget constraints
remained soft, the system could not control inflation. Thus there was not much for China to
emulate from Viet Nam’s 1989 measures regarding hardening of SOE budget constraints.
32
5.5 Positive real interest rates
Establishment of positive real interest rates provides another important area in which
China was ahead of Viet Nam and did not have much to emulate from Viet Nam’s 1989
measures. Unlike Viet Nam, China established and maintained positive real interest rates
from the very beginning of the reform process. In fact, McKinnon (1994) points to China’s
positive real interest rates as the most important reason why China could control inflation. He
notes that beginning of the reforms with the agricultural sector yielded quick results and
created considerable surplus in the hands of millions of rural households. Unlike Viet Nam,
where private surplus went underground in the form of dollars and gold, China succeeded in
drawing this surplus to the formal financial sector by offering positive real interest rates.
According to some estimates China could mobilize almost 80 percent of the rural savings
through the banking system.
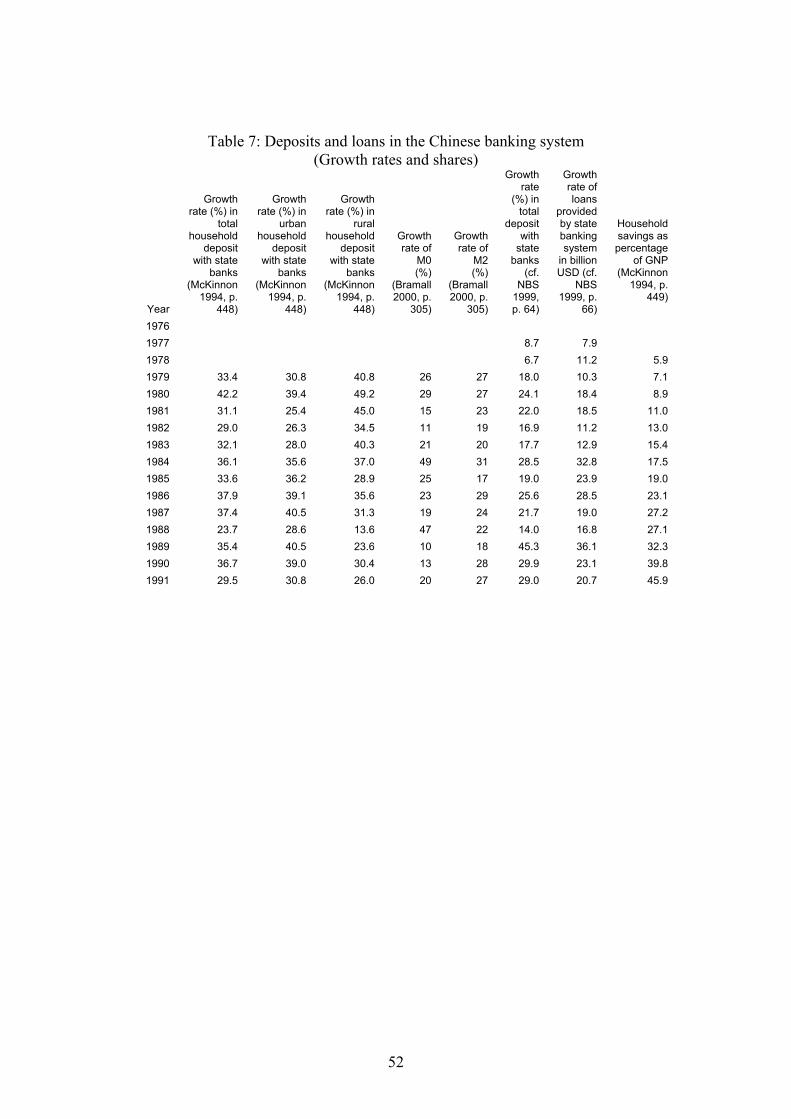
Table 7 provides some relevant information. First, we see the marked and steady increase
in household savings in China. Household saving as a percentage of GNP rose from 5.9 pct in
1978 to 27.1 pct in 1987. Second, we see that much of this saving was actually deposited in
the banking system. Total household deposits with the banking system grew by an average
(simple arithmetic) rate of 33.65 percent per year during 1979-1988. This rate was faster for
the rural households (35.62 percent) than for the urban households (32.99 percent). The
corresponding rates were 41.96 percent and 29.98 during 1979-1984, showing that the rural
households were building up bank balances at a much faster rate than their urban counterparts
during the initial years of reform.
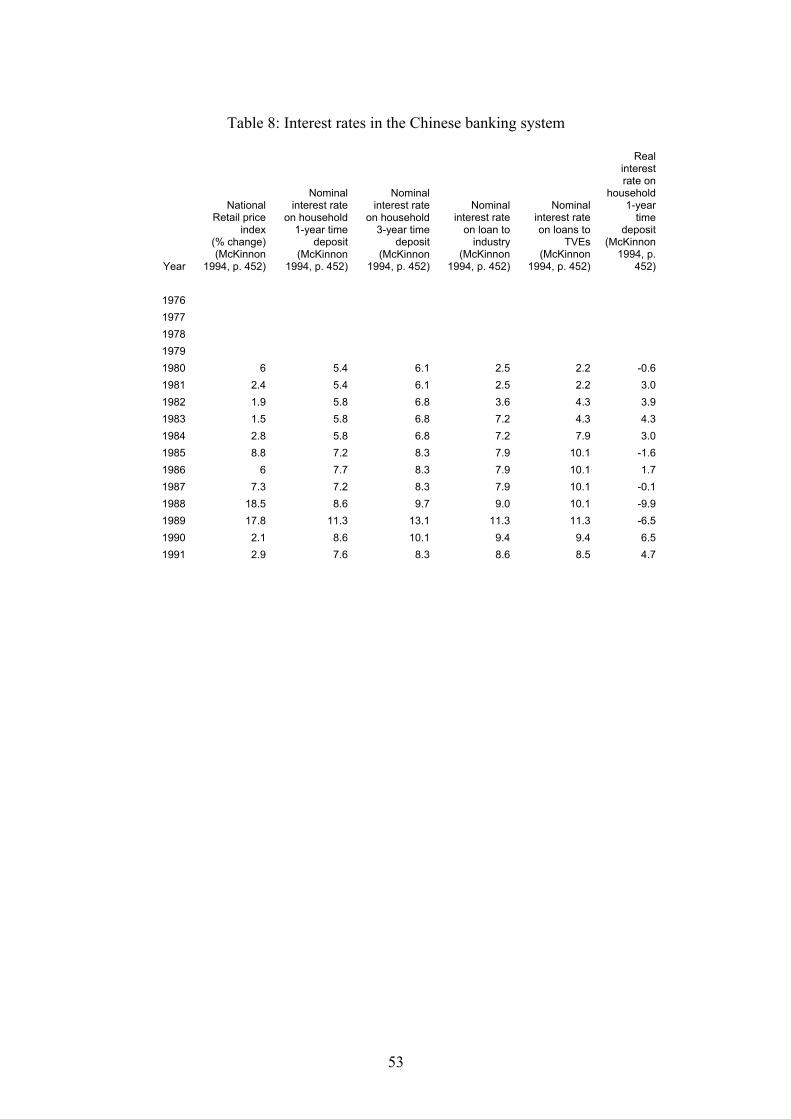
Table 8 shows why bank deposits increased in China during the reform years. We see that
the real interest rate (on household one-year time deposit) for most of the years during 1980-
1987 was positive and averaged to 1.69 percent. For the initial years of reform, the rate was
much higher, averaging to 2.70 percent during 1980-1984. The Chinese authorities’ keen
33
appreciation of the role of positive real interest rates in mobilizing savings and stabilizing the
economy was further displayed by their behavior during the crisis years of 1988-1989, when
the government fully indexed some interest rates in order to sustain positive real interest rate
in face of high inflation rates. When inflation came down to a very low level in 1990-1991,
indexing was discontinued. See McKinnon (1994, pp. 452-453) for details.
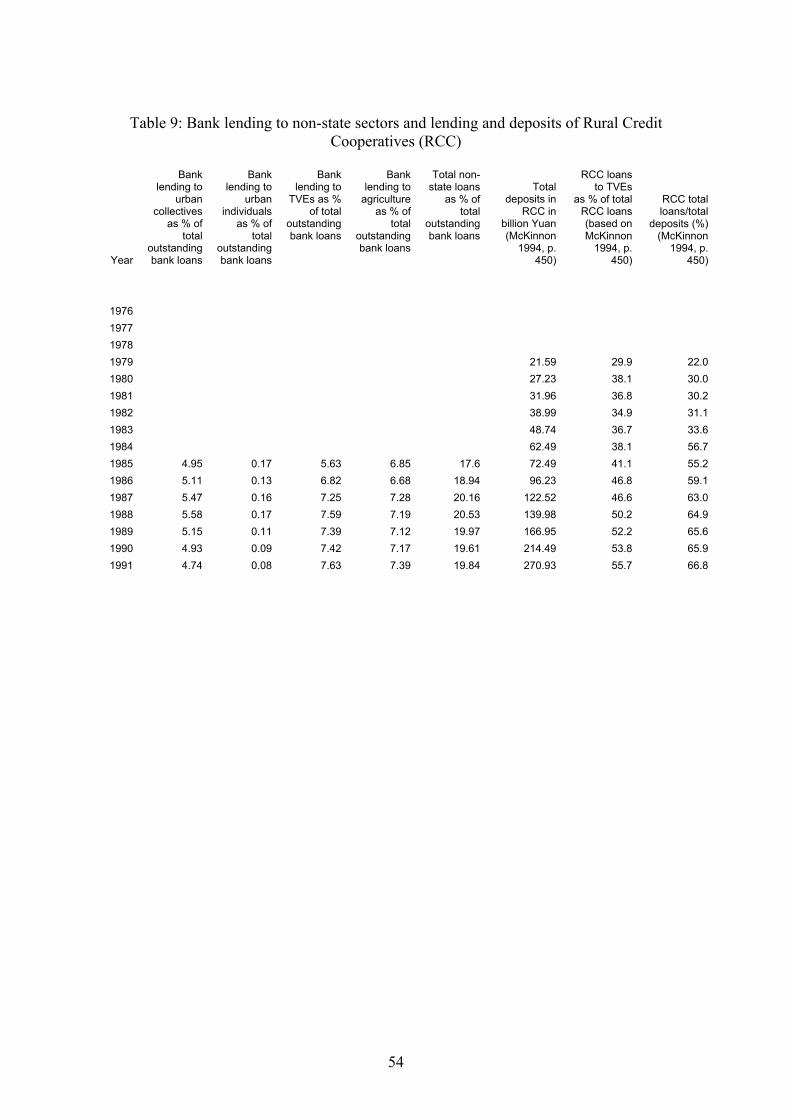
The Chinese authorities also displayed considerable prudence in the use of deposits
mobilized through positive real interest rates. Table 9 provides some information about
destination of bank loans. We see that the non-state sector as a whole (including rural and
urban households, TVEs, and agriculture) accounted for only about 20 percent of the overall
bank lending, with TVEs accounting for only 6 to 7 percent. The Table further shows that a
considerable part of even savings deposited with RCCs was mobilized for purposes other
than those in the rural sector. RCC loans to deposit ratio rose from 22.0 percent in 1979 to
64.9 percent in 1988. Also, the share of TVEs in total RCC lending increased from 29.89
percent in 1979 to 50.20 percent in 1988. Thus even of the limiting lending that RCC made
for rural purposes, TVEs got less than half in most of the years. This shows that to a great
extent TVEs were financed out of local governments’ budget. To the extent that the local
governments are not allowed to run deficits, TVE financing was therefore by and large non-
inflationary.
The upshot is that by mobilizing household savings and by not using them for TVEs, the
government of China could use bulk of it for non-inflationary financing of its budget deficit,
investment program, and for meeting SOE credit needs. Positive real interest rates were
therefore the key to China’s financial success.14 It was Viet Nam which belatedly realized the
importance of positive real interest rates and tried to ensure such rates through its 1989
measures.
14 Another benefit of positive real interest rates and consequent high lending rates was that they forced the borrowing to be directed to more productive investments. See MacKinnon (1994, pp. 461-462)
34
5.6 Any room for faster growth?
Form the above discussion we see that there was not much for China to emulate from Viet
Nam’s 1989 measures to bolster her growth rate. China was already there where Viet Nam
tried to reach through her 1989 reforms. Thus the prospective interpretation of the Sachs and
Woo hypothesis does not stand.
What about the retrospective interpretation? To examine this interpretation of the Sachs
and Woo hypothesis, we first note that even post-1989 growth rates of Viet Nam were
actually lower than either pre- or post-1989 growth rates of China. The average annual GDP
growth rate for Viet Nam during 1989-1999 was 7.1 percent. By comparison, the average
annual GDP growth rate of China during 1978-1988, 1984-1988, and 1989-1998 periods has
been 9.6, 10.7, and 9.5 percent, respectively. (NBS 1999, p. 4)
Second, China’s record of nearly 10 percent annual average GDP growth for about three
decades now is unparalleled from both historical and international comparative perspectives.
As Kojima (2006) points out, Japan’s high post war economic growth lasted 18 years with an
average annual growth rate of 9.3 percent. Taiwan and Korea’s high economic growth lasted
longer, about forty years, but averaged to 8.3 and 8.6 percent per year, respectively. Given
this historical and international record, it is difficult to see how China would have grown any
faster than she already did. As noted earlier, many observers rather think that Chinese growth
rates are too high and need to be slowed down.
5.7 Conclusions regarding the hypothesis
Sachs and Woo’s hypothesis that China would have grown faster had she adopted Big
Bang steps like that of Viet Nam’s 1989 reforms is not acceptable either in a prospective
sense or in a retrospective sense. By 1989 China was already there where Viet Nam wanted
to reach through its 1989 steps, and there was not much scope for China to increase her post-
35
1989 growth rates by emulating those steps. On the other hand, China’s unprecedented high
growth rates from the very beginning of her reform makes untenable the hypothesis that she
could have higher pre-1989 growth rates by adopting Big Bang measures earlier in the reform.
6. Why the pitfalls?
The question that naturally arises is why Sachs and Woo run into pitfalls regarding facts
and characterization and offer an untenable hypothesis. What we will see is that Sachs and
Woo’s pitfalls ensue from a subjective preference that they have for the Big Bang approach to
reform. To show that first we demonstrate very briefly that Sachs and Woo’s pitfalls
regarding facts and characterization are not limited to Viet Nam; they extend to China too.
6.1 Pitfalls regarding China and contradictions in the broader conclusions
Sachs and Woo’s papers are intended to reach some broader conclusions regarding China
and reform process in general. The list of such conclusions is as follows (See Sachs and Woo
2000, pp. 4-5):
“(H.1) China’s rapid growth has come despite gradualism, in areas of the economy
characterized by radical rather than gradual reforms. China’s ability to grow rapidly
(H.2) China’s gradualist strategy is not transferable to Eastern Europe and the former
Soviet Union (hereafter EEFSU), because of fundamental differences in economic
structure;
(H.3) China’s experiments in non-capitalist institutions are proving to be unsuccessful in
(a) agriculture; (b) rural industry; (c) state industry, and are therefore in need of further
reform toward more typical capitalist institutions;
36
(H.4) China is gradually harmonizing its economic institutions with those of East Asian
market economies.”15
We begin by noticing that there are several contradictions in the set of conclusions above.
The first is the contradiction between the universalist and particularist positions. The
position that even China would have done better had she followed Big Bang instead of the
Gradual approach may be termed as the universalist position, because according to this
position, the superiority of the Big Bang approach is universal, no matter where the country is
located (whether in Asia or in Europe) and what the structure of the economy is (whether
labor surplus agrarian or full-employment industrial). It is this universalist position that finds
reflection in conclusion (H.1). However, this position contradicts the particularist position
implied by conclusion (H.2). According to this position, a particular reform approach is
suitable for a particular country, depending on its economic structure and other conditions.
Thus, Gradualism succeeded in China, because of China’s specific economic structure
(characterized by surplus labor and large agricultural sector). And that is why this approach is
not suitable for Eastern European countries, because their economies had a very different
structure (characterized by full employment and over-industrialization), and for which Big
Bang was the only route available.
Sachs and Woo apparently are oblivious to this contradiction. According to their
reconciliation of the two positions, China’s success following the Gradual approach was only
limited and would have been much greater had she instead followed the Big Bang approach.
However, we have already observed that the proposition of a higher growth rate for China
than what she already achieved is not realistic. Hence their reconciliation of the universalist
and particularist positions is not tenable.
15 The allusion to Viet Nam pertains directly to (H.1). However, it is not difficult to see that the conclusions listed above are interrelated. Thus, (H.1) helps to reach (H.2) and (H.3), and to some extent (H.4) too. Hence the allusion to Viet Nam serves as an important link in Sachs and Woo’s causality chain.
37
The second contradiction lies in Sachs and Woo’s presentation of China as an example of
both Gradualism and Big Bang. In (H.2) China is presented as a case of Gradualism. Yet in
(H.1) China’s success is attributed to ‘radical’ rather than ‘gradual’ reforms, claming that
China’s growth was despite gradualism.16 The suggestion here is that even China had its Big
Bangs, just as Viet Nam had one in 1989, and it is to those Big Bangs that China owes its
growth. Gradualism on the other hand only slowed it down acting as obstructions. The
question that arises is: What are these Chinese Big Bangs?
Sachs and Woo cite three examples. These are: (a) switch from collectivist to household
farming, (b) liberalization of TVEs, and (c) opening up to the external world. (Sachs and
Woo 2000, p. 10) A detailed perusal of these examples is beyond the scope of this paper.
However, it may be noted summarily that the portrayal of these steps as examples of Big
Bang type measures is not very convincing. First, China’s record of opening up, beginning
with a few special economic zones and then gradually increasing the number and scope of
such special zones, is rather a classic example of proceeding gradually than that of opening
up the entire economy at one stroke, as the Big Bang approach would suggest. Second, it is
unclear what Sachs and Woo mean by ‘liberalization of TVEs.’ TVEs have been generally
regarded as another classic example of China’s Gradual approach, of experimentation with
intermediate institutional forms, rather than jumping directly from state ownership to outright
private ownership. TVEs are also an epitome of the Gradual approach from two other points
of view, namely (i) spatial character of industrialization and (ii) mobility of labor. TVEs
allowed China not to jump directly to industrialization concentrated in a few urban centers (as
can be seen in many developing countries) and not to jump directly from the restricted labor
mobility situation (characterized by the household registration system, known in Chinese as
the hukuo system) to a situation of entirely unrestricted mobility. As is known, TVEs were
16 As Sachs and Woo make it clear elsewhere in the paper, “Favorable outcomes have emerged (in China) not because of gradualism, but despite gradualism.” (Sachs and Woo 2000, p. 3, italics added)
38
associated with the slogan: “Leave agriculture but not the village!” Characterization of
(liberalization of) TVEs as a Big Bang type of measure therefore does not conform to the
reality. Third, even the switch from collectivist to household farming did not happen in as
fast a manner as Sachs and Woo presents. As Bramall (2000) documents, this switch was a
protracted process too. Thus it is difficult to agree with Sachs and Woo’s portrayal of any of
these three reforms and examples of Big Bang.
However, suppose that we do not agree with the above reasoning, and instead think of the
cited three measures as indeed examples of Big Bang-like reform, we then face a thorny
conceptual problem. After all, China overall is an example of the Gradual approach, as Sachs
and Woo themselves agree through their (H.2). That being the case, their argumentation
regarding the three reforms above would make Big Bang-like measures part of the Gradual
approach! That would put the very definition of Big Bang further into question, making this
definition ever more fluid!
There is therefore a similarity between Sachs and Woo’s ways of viewing the reform
processes in Viet Nam and China. Just as they ignore the role of pre-1989 reforms and try to
attribute all success to 1989 measures in Viet Nam, so in case of China they try to attribute all
success to certain apparently ‘radical’ measures and try to disparage and discount gradual
changes. In their penchant to find successful Big Bangs, they try to see either success or Big
Bang where these do not exist. Similarly, in their desire to discredit the Gradual approach
they try to see either failure or departure from Gradualism where these were not the case.
Thus, Sachs and Woo have a subjective preference for the Big Bang approach to reform, and
in order to establish this subjective view, they tend to sacrifice objectivity.
The question that arises is what explains Sachs and Woo’s subjectivity. There may be
several sources of this subjectivity. One of these is epistemological, which in this case lies in
39
Sachs and Woo’s lack of appreciation of the dialectics of the reform process. This lacking
finds expression in several following features of Sachs and Woo’s analysis.
6.2 Non-recognition of time-specificity of reform measures
Sachs and Woo’s conclusion (H.3) above display their tendency to discount the role of
intermediate institutions that arose in China in the process of reform because these
institutions are now in need of change and are getting changed. Such efforts reflect a failure
on the authors’ part to recognize time-specificity of reform measures so that a particular
reform or institutional form may become redundant tomorrow without losing its rationale and
usefulness today. In fact its very success today may be the reason for its redundancy
tomorrow.
TVEs are a good example to illustrate the point. It is well known that TVEs played and are
playing a historic role in China’s industrialization. From almost nothing TVEs exploded to
account for about one-third of Chinese industrial production. Their phenomenal growth has
been one of the major driving forces behind China’s growth of GDP and exports. A
confluence of circumstances (or factors) led to the emergence of TVEs as a unique, non-
capitalist institution, with hardly any match elsewhere in the world. Among these factors
were: (i) introduction of successful agricultural reform resulting in significant surplus in the
hands of rural households, (ii) introduction of industrial reforms in the form of the Two-
Track policy allowing out-of-plan market for both industrial input and output, (iii) the Maoist
legacy of rural industrialization carried out by communes as a part of the Great Leap Forward
campaign, (iv) introduction of Chinese financial reform, leaving Chinese local governments
to rely increasingly on local enterprises as sources of revenue, and (v) inflow of overseas
Chinese and foreign capital as a result of the adoption of the open door policy.
40
With time however circumstances changed, and the unique, non-capitalist ownership of
TVEs proved no longer indispensable and/or suitable. There are many reasons for this
outcome, some of which are as follows: (i) TVEs themselves promoted internal migration,
which in turn created a divergence between the territorial community and the legal
community of the townships, causing thereby an incongruity between the collective
ownership of the latter and the actuality of the former. (ii) Success of TVEs led to the
creation of wealth and to the emergence of people with requisite capital and management
skills to take over the TVEs under private ownership. (iii) Success of TVEs and of industrial
reforms in cities and phenomenal growth of economic activities in the special economic
zones led to the de-facto and legal acceptance of private entrepreneurship and private
ownership. (iv) Fiscal and economic management reforms pushed the local governments to
generate funds through privatization of TVEs in order to finance public recurrent expenditure
and investment projects and to concentrate on the management of bigger enterprises under
their control.
However, subsequent privatization of TVEs under the impact of the factors listed above
does not mean that it was a mistake for China to attempt a non-capitalist rural
industrialization during 1980s, or that the alternative of trying to foster private capitalist
industrialization right from 1978 or 1984 would have produced better results. Yet by arguing
for Big Bang for China, this is precisely the type of suggestion that Sachs and Woo make.
Sachs and Woo’s unwillingness to recognize the time-specificity of reform measures can
similarly be illustrated by considering other examples, such as Household Responsibility
System (of agriculture), Dual Track System (of industry), Special Economic Zones (of
foreign trade and investment), and the more recent use of Non-tradable Shares (in
equitization of SOEs), etc. All these intermediate forms have their historic positive role and
necessity even though with time they may or might have become redundant later. The same
41
applies to Viet Nam. The Contract System of agriculture, the Three Plan System of the
industry, the Preferred Stocks in equitization, etc. may all with time lose their rationale.
However that does not mean that they were not appropriate and did not have a positive role at
the time when they were introduced.17
6.2 Limited view of the interaction between economics and politics
The epistemological weakness of Sachs and Woo’s position finds another reflection in
their somewhat limited view of the interaction of economics and politics in the reform
process. For example, at several places, Sachs and Woo argue that the Gradual approach of
China owes more to political considerations than to the economic rationale.18 This view is
problematic on two grounds. First, it is questionable prima facie. Consider the example of
TVEs again. At the time when the TVE movement began, there were hardly enough
individuals in the Chinese countryside (for that matter even in most urban areas) with the
kind capital and capability necessary to set up such enterprises as TVEs. One can argue that
government could direct bank credit to create such nouveau capitalists from scratch. This
argument has its own problems. First, we saw earlier that bank credit was not the main source
of TVE financing. TVEs were financed mainly by local government’s own revenues. It is
difficult to suggest that local governments should have handed over its revenues to
individuals to set up enterprises under their private ownership. The second problem concerns
17 Sachs and some other researchers (Murphy, Shleifer, and Vishny 1992) have pointed out that the Gradual approach gives rise to new problems. That is perfectly natural and expected. That is actually how things progress. Resolution of one contradiction leads to the generation of new contradictions, and so forth. So emergence of new problems cannot be an argument against the Gradual approach. The issue is whether the new contradictions are resolved at an appropriate time. Otherwise, they may create a crisis. So far it seems that both China and Viet Nam have been more or less successful at deciphering the new contradictions and resolving them in time.
18 For example, Sachs and Woo (2000, p. 1) observe that “the convergence school also holds that China’s gradualism results primarily form a lack of consensus over the proper course, with power still divided between market reformers and old-style socialists; and that the ‘innovative’ non-capitalist institutions are responses to China’s political circumstances and not to its economic circumstances.” They make the same point elsewhere stating that “Gradualism … has not been a strategy so much as a result of continuing political conflict and other difficulties inherent in setting a policy course in a country of some 1.2 billion people.” (Sachs and Woo 2000, p. 3)
42
how banks or local governments would choose such persons. Neoclassical economics
discourages governments from making such choices and advocates the choice to be left to
impersonal market processes. Thus creation of nouveau capitalists from zero was not a
feasible option on economic grounds.
Second, the option of hatching TVEs under private ownership from the very beginning
was not feasible on political grounds too. The society was still steeped in the ideology and
practice of socialism, as manifested in the principle of “Eating from the Same Iron Bowl.” In
such a social context, an attempt to foster nouveau capitalists from zero, even if successful,
would create social resentment, undercutting their legitimacy and hampering their ability to
function properly. The experience of Russia is quite instructive in this regard. Russia created
a class of capitalists by allowing them basically to rob state assets. To this day, these robber
barons find it difficult to gain social legitimacy and remain vulnerable to both populist
pressures as well as revivalist government’s attempts to retake those assets. As a result,
Russia still could not establish a well functioning market economy.
Thus the contraposition of political grounds to economic grounds is a false contraposition.
The economics and politics of a situation are usually intertwined into an organic whole, so
that it is difficult to separate the two. Reforms never happen in a political vacuum. The
political parameters are as much a part of the landscape as the economic ones, and the two are
related. It is unreasonable to claim that the policy advice was correct but did not prove
successful because the politics of the situation were not correct. The reform policy needs to
be formulated keeping both the political and economic conditions in mind, in particular
keeping the interrelationship between the two in sight.
6.3 Mechanistic reasoning
43
The epistemological weakness of Sachs and Woo’s position also finds reflection in their
often very mechanistic way of thinking. An example can be found in their claim that “since
reforms unleashed growth, even more reform would have unleashed faster growth.” (Sachs
and Woo 2000, p. 13)19 This is obviously a very simplistic linear projection.20 The reality is
usually far more complex, non-linear, full of breaks, and involving feedbacks, turnarounds,
and unintended consequences.
We have noticed earlier that given the unprecedented (in history and across nations) high
growth rates of China, it is difficult to claim that China could have grown faster with more
reform. What is important to note is that sometimes it is lack of reform (in Sachs and Woo’s
sense) that may generate faster growth rather than the other way round!
An example may be drawn from the Chinese experience with liberalization of interest
rates. According to Lin and Cai (1996), the main area of sluggishness in China’s unification
of markets concerned the interest rate. Referring to the situation in 1984, they explain that
maintaining the interest rate at artificially low level led to higher demand for credits.
Previously, such excessive demand used to be curtailed by administrative means. However
delegation of credit approval authorities made such rationing difficult, leading to a “rapid
expansion of credit and an investment thrust,” leading to very high growth rates.21 We thus
see an example where less reform (i.e. less liberalization of interest rates) ended up causing
faster growth. This shows the pitfalls of linear reasoning.
Sachs and Woo’s mechanistic reasoning also finds reflection in their conclusion (H.4),
whereby they suggest that China (and for that matter Viet Nam) have no necessity to
19 Similarly they argue elsewhere that “the faster the convergence, the better will be the outcome.” (Sachs and Woo 2000, p. 2)
20 Some may say that this is like arguing for binge drinking because some studies have found that moderate drinking leads to less cardiac problems.
21 “Maintaining the interest rate at an artificially low level gave enterprises an incentive to obtain more credits that the supply permitted. Before the reforms, the excess demands for credit were suppressed by restrictive central rationing. The delegation of the credit approval authority to local banks in the autumn of 1984 resulted in a rapid expansion of credits and an investment thrust.” (Lin and Cai 1996, p. 208)
44
experiment with institutions because the ultimate forms of capitalist institutions are known.22
This is again simplistic. First of all, neither China nor Viet Nam has yet declared capitalism
as their end-goal. Hence, the entire argument that institutional forms of capitalism are known
and no experimentation is needed may be unwarranted. Second, even if it is assumed that
both China and Viet Nam are in fact headed toward capitalism (no matter what their official
documents say), the fact remains that even institutional forms of capitalism can be quite
varied. Looking at developed capitalist countries, we see that even after several centuries of
capitalism, the institutions vary. We see such variation in the relative role of public vs.
private sector in the economy, in the role of banks vs. stock markets in financing companies,
in labor institutions and bargaining between labor and capital, in social safety network, etc.
Only through a gradual process of change, trial and error, experimentation, evolution, can a
country attain the configuration of institutions that are best suited for it, given its economy,
history, culture, physical characteristics, etc. Also, it may not be only an issue of adjusting
institutional forms that are already available elsewhere. There is also the possibility of new
institutional forms to arise. As North (1990) emphasizes, institutions cannot be just
supplanted from outside. They have to be home grown (even if the seeds and samplings are
brought from outside), and growth requires time, because nature does not jump!
7. Concluding remarks
The analysis of this paper shows that Sachs and Woo’s hypothesis that the experience of
Viet Nam’s 1989 reforms show that China would have grown faster had she adopted Big
Bang approach rather than the Gradual approach to reform is flawed. The allusion to Viet
Nam suffers from inaccuracy of facts and inappropriateness of characterization, and the
hypothesis itself is untenable in its both prospective and retrospective interpretations. 22 As they put it, “The key point is that little experimentation is needed or desired. The long-run goals of institutional change are clear, and are found in the economic models of existing market-based economies.” (Sachs and Woo 2000, p. 8)
45
Sachs and Woo’s paper does a great job in elucidating different view points with regard to
Chinese reform. It contains a wealth of information and helps greatly in understanding
China’s reform process. However, their analysis of the reform processes in China and Viet
Nam suffer from weaknesses, which emanate from their subjective preference for the Big
Bang approach to reform. It is this subjectivity that leads them to pitfalls regarding facts,
interpretation, and the hypothesis.
The epistemological source of this subjectivity seems to lie in Sachs and Woo’s lack of
appreciation of the dialectics of the reform process. This lacking finds reflection in their
reluctance to see the time-specificity of various reform measures and the complex interaction
between politics and economics in the reform process and in their mechanistic reasoning.
Sachs and Woo’s subjectivity may have other sources, which remain beyond the discussion
of this paper. However, recognition of this subjectivity is important as it may help avoid its
negative consequences.
46
Table 1: Impact of pre-1989 reforms on Vietnamese agricultural production
(Growth rates in percentage)
Year
GrossAgriculturalProduction:
Annual growth rate
(%)(Tran
1994, p. 114-6)
Gross Agricultural Production
from cultivation:
Annual growth rate
(%) (Tran
1994, p. 114-6)
GrossAgriculturalProduction
fromLivestock:
Annual growth rate
(%)(Tran
1994, p. 114-6)
Production of food
crops in rice
equivalent:Annual growth
rate (%)
(Tran 1994, p.
114-6)
Yield of food crops
in rice equivalent:
Annual growth
rate (%)
(Tran 1994, p.
114-6)
Paddy production
growth rate (%)
(Minot and
Goletti 2000, p.
44)
Population growth
rate (%)
(Minot and Goletti
2000, p. 44)
(1) (2) (3) (4) (5) (6) (7) (8)
1976 11.7 3.3
1977 -5.6 -8.9 8.7 -6.3 -12.4 -10.7 2.4
1978 -1.8 -0.7 -6.0 -2.8 -4.7 -7.9 2.0
1979 8.7 9.5 5.4 14.0 11.6 15.1 2.1
1980 7.5 6.6 11.1 3.0 1.0 1.7 2.3
1981 4.4 1.5 15.3 4.2 5.4 6.7 2.2
1982 11.3 12.3 8.1 12.2 12.6 15.0 2.3
1983 3.3 1.3 10.3 0.9 3.7 2.1 2.1
1984 5.3 5.5 4.4 4.8 4.0 5.3 2.2
1985 2.5 2.8 1.5 2.3 1.9 2.6 2.0
1986 4.8 3.0 10.6 1.0 1.5 0.6 2.0
1987 0.4 -2.4 9.1 -4.4 -3.0 -5.8 2.3
1988 4.3 7.5 -4.8 11.5 7.3 11.9 1.9
1989 7.4 7.8 6.3 9.9 7.8 11.1 1.7
1990 1.6 1.0 3.2 -0.1 -0.3 1.0 2.1
1991 1.1 0.6 3.0 2.3 -2.3 2.0 2.4
1976-78 -3.8 -4.7 1.1 -4.7 -9.1 -9.3 2.2
1979-88 5.1 4.6 6.7 4.7 4.4 4.4 2.2
1976-80 2.0 1.4 4.5 1.7 -1.5 2.4 3.0
1981-88 4.4 3.8 6.4 3.8 4.0 4.5 2.1
Source: Columns (2) through (6) are also based on GSOa (2000, pp. 77-78), GSOb (2000, p. 178, p. 190, and p. 201). Columns (7) and (8) are based on Minot and Goletti (2000, p. 44)
47
Table 2: Impact of pre-1989 reforms on Vietnamese agricultural exports
References Arkadie, V. Brian and Raymond Mallon (2003), Viet Nam: A Transition Tiger? Canberra:
Asia Pacific Press at the Australian National University Bramall, Chris (2000), Sources of Chinese Economic Growth, 1978-1996, Oxford: Oxford
University Press Brabant Van, Jozef M. (1990), “Reforming a Socialist Developing Country – The Case of
Viet Nam,” Economics of Planning, Vol. 23, pp. 209-229 Byrd, William A. (1987), “The Impact of the Two-Tier Plan/Market System in Chinese
Industry,” Journal of Comparative Economics, Vol. 11, pp. 295-308 De Vylder, S. and A. Fforde (1988), Viet Nam: An Economy in Transition, SIDA, Stockholm Fforde, A. and de Vylder, S. (1996), From Plan to Market: The Economic Transition in Viet
Nam, Westview Press, Oxford Gelb, Alan, Gary Jefferson, and Inderjit Singh (1993), “Can Communist Economies
Transform Incrementally? China’s Experience,” Working Paper No. 1189, October, Policy Research Department, World Bank, Washington DC
General Statistical Office (GSO) of Viet Nam (2000a), Viet Nam 1975-2000: Statistical Data
of Viet Nam Socio Economy 1975-2000, Statistical Publishing House General Statistical Office (GSO) of Viet Nam (2000b), Viet Nam 1975-2000: Statistical Data
of Viet Nam Agriculture, Forestry, and Fishery 1975-2000, Statistical Publishing House Groves, Theodore, Yongmiao Hong, John McMillan, and Barry Naughton (1994),
“Autonomy and Incentives in Chinese State Enterprises,” Quarterly Journal of Economics, Vol. 109, No. 1 (February), pp. 183-209
Lau, Lawrence J., Yingyi Qian, and Gerard Roland (1997), “Pareto-improving Economic
Reforms through Dual-Track Liberalization,” Economics Letters, Vol. 55, pp. 285-292 Lau, Lawrence J., Yingyi Qian, and Gerard Roland (2000), “Reform without Losers: An
Interpretation of China’s Dual-Track Approach to Transition,” Journal of Political Economy, Vol. 108, No. 1, pp. 120-143
Lin, Justin Yifu and Fang Cai (1996), “The Lessons of China’s Transition to a Market
Economy,” CATO Journal, Vol. 16, Issue 2 (Fall), pp. 201-219 Lipton, David and Jeffrey Sachs (1990), “Creating a Market Economy in Eastern Poland: The
Case of Poland,” Brookings Papers on Economic Activity, No. 1, pp. 75-147 Lipton, David and Jeffrey Sachs (1992), “Prospects for Russian Economic Reforms,”
Brookings Papers on Economic Activity, No. 2 pp. 213-283
56
McKinnon, Ronald I. (1994), “Financial Growth and Macroeconomic Stability in China, 1978-1992: Implications for Russia and Other Transitional Economies,” Journal of Comparative Economics, Vol. 18, pp. 438-469
Murphy, Kevin M., Andrei Shleifer, and Robert W. Vishny (1992), “The Transition to a
Market Economy: Pitfalls of Partial Reform,” Quarterly Journal of Economics, August, pp. 889-906
National Bureau of Statistics (NBS) (1999), Comprehensive Statistical Data and Materials
on 50 Years of New China, Beijing: China Statistics Press Naughton, Barry (1994), “What is Distinctive about China’s Economic Transition? State
Enterprise Reform and Overall System Transformation,” Journal of Comparative Economics, Vol. 18, pp. 470-490
North, Douglass C. (1990), Institutions, Institutional Change, and Economic Performance,
Cambridge: Cambridge University Press. TS. Nguyen Van Chinh, TS.Vu Quang Viet Cu nhan Tran Van, Cu nhan Le Hoang (2002),
Viet Nam Economy in the Years of Reform, Ha Noi: Nha xuat ban and Thong ke Riedel, James (1995), “The Transition to Market in Viet Nam,” HKCER Letters, Vol. 35, pp.
1-9 Riedel, James and Bruce Comer (1997), “Transition to Market Economy in Viet Nam,” in
Wing Thye Woo, Stephen Parker, and Jeffrey Sachs (editors), Economies in Transition: Comparing Asia and Europe, Cambridge: MIT Press, pp. 189-216
Sachs, Jeffrey (1994), “Understanding Shock Therapy,” Occasional Paper No. 7, Social
Market Foundation, London Sachs, Jeffrey D. and Wing Thye Woo (1997), “Understanding China’s Economic
Performance,” NBER Working Paper No. 5935, Cambridge MA Sachs, Jeffrey D. and Wing Thye Woo (2000), “Understanding China’s Economic
Performance,” Journal of Policy Reform, Vol. 1, No. 1, pp. 1-50 Sachs, Jeffrey and Wing Thye Woo (1994b), “Structural Factors in the Economic Reforms of
China, Eastern Europe, and the Former Soviet Union,” Economic Policy, April, pp. 102-145
Sachs, Jeffrey and Wing Thye Woo (1994c), “Experiences in the Transition to a Market
Economy,” Journal of Comparative Economics, Vol. 18, pp. 271-275 Tran, Hoang Kim (1994), Economy of Viet Nam: Reviews and Statistics, Hanoi: Statistical
Publishing House Wu, Jinglian and Renwei Zhao (1987), “The Dual Pricing System in China’s Industry,”
Journal of Comparative Economics, Vol. 11, pp. 309-318