29
IR Presentation Quarter I - 2015 Improving the values of life
| Date post: | 27-Jul-2015 |
| Category: |
Economy & Finance |
| Upload: | bibi8x0883 |
| View: | 65 times |
| Download: | 0 times |
IR Presentation
Quarter I - 2015
Improving the values of life
Table of contents1. General information
2. Investment highlights
3. Operating results
1. General information Important Milestones
Vision & Strategic Objectives
Organization Structure
Awards

VietinBank Overview
Vietnam Joint Stock Commercial Bank for Industry and Trade (VietinBank) is a leading financial and banking group, plays a key role in Vietnamese financial-banking system.
1988 Established upon the spin-off from The State Bank of Vietnam (SBV).
2008 Going public through IPO and listed on Hochiminh Stock Exchange (HOSE) one year later
2009 Officially renamed into Vietnam Joint Stock Commercial Bank for Industry and Trade (or VietinBank in short)
2011 IFC officially became the foreign strategic shareholder of VietinBank with 10% stake ownership
2012
Became the first bank in Vietnam successfully issuing USD250mil international bond listed on Singapore Exchange
Selling 19.73% stake to Bank of Tokyo-Mitsubishi UFJ (BTMU) as a second foreign strategic shareholder.

Corporate vision & strategic objectives
Continue to expand business vertically and horizontally to increase market share1
Enhance service quality to ensure the efficiency in the context of well-managed risks2
Improve financial capability and transparency3
Strengthen corporate governance and risk management in line with international standards4
Accelerate modernization of the Bank5
Become the leading financial group and key player in Vietnam6
Maximize value of stakeholders, employees and customers7
Vision Strives to become the leading financial group in Vietnam and highly rated bank in the international domain
Overall Strategic Objectives
Motto Grows prudentially, efficiently and sustainably

Robust group corporate structure
Head Office
Operation Centre Branches Representative Offices Non-profit Making Units Subsidiaries & Affiliates
Transaction Offices
VietinBank Leasing
Company Ltd
VietinBank Securities Joint Stock company
VietinBank Debt and
Asset Management Company Ltd
VietinBank Insurance Company
Ltd
VietinBank Aviva Life Insurance Joint Venture
Company
VietinBank Fund
Management Company
Ltd
Financial Leasing
Asset management
Non-life
insuranceLife Insurance
Fund management
Banking and Finance
VietinBank Gold and Jewelry
Trading company Ltd
Securities
Indovina Joint Venture
Bank
Manufacture, design and trade
in gold and precious metals
and gems
1 2 3 4 5 6
Saving Offices
VietinBank Global Money
Transfer Company Ltd
International Remittance
7 8 9
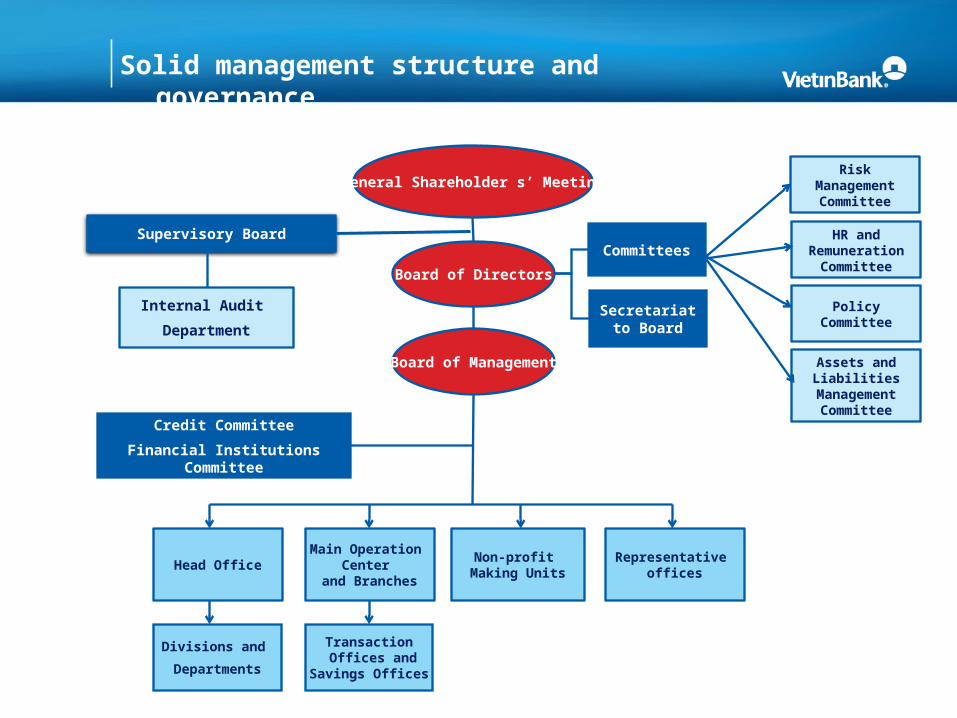
Solid management structure and governance
Supervisory Board
Board of Directors
Board of Management
Internal Audit
Department
Committees
Secretariat to Board
Risk Management Committee
HR and Remuneration
Committee
Policy Committee
Assets and Liabilities
Management Committee
Head OfficeMain Operation
Center and Branches
Non-profit Making Units
Representative offices
Transaction Offices and
Savings Offices
Credit Committee
Financial Institutions Committee
Divisions and
Departments
General Shareholder s’ Meeting

Awards
HIGHLIGHTS According to Brand Finance, VietinBank brand name is grade A and worth about 197 million USD, ranked the
437th in the world. This is the 3rd time VietinBank was selected and shortlisted into Top 500 financial institutions with strong brand name – the most valuable awards for the banks in the world.
According to Vietnam Report và Vietnamnet E-Newspaper, VietinBank was ranked the 20 th among Top 500 big corporations in Viet Nam (VNR500). Đồng thời, VietinBank was honored to be shortlisted into best enterprises in Viet Nam.
VietinBank was also named the 3rd consecutive times and ranked the 1.854th in 2014 by the Forbes Global 2.000 awards.
AWARDS
• Ranked the 437th, 328th and 434th respectively for 2014, 2013 and 2012.
• Ranked the 20th in the Top 500 Vietnam Group
• The best awards in Viet Nam
• Awarded by the Ministry of Industry and Trade
• Awarded the 11th consecutive time in 2014
• Being honored as a leading business in the financial sector to pay corporate income tax.
• Ranked the 5th and in five consecutive years, VietinBank in the Top 10 Business
• Awarded the organizations that providing the best financial services in Vietnam
• Ranked the 1.854th in 2014• Awarded the 3rd consecutive years.
2. Investment highlights Chartered Capital, Total Equity and Total Asset
Market Share
Distribution network
Brand name & Client base
Shareholder support
Corporate governance and HR
Operating results vs other listed banks

Strong abilities
2
3
4
5
6
7
8
1
Top financial institution in Vietnam with dominant market share: • Loans (12%)• Mobilized fund (10.4%)• Investment Banking (16.5%)• Remittance (15%)• International payment (12.9%)• Leading position in cards services (21%)
Highest operational efficiency and most remarkable business performance in Vietnamese banking system
World-wide and Nation-wide network
Largest scale in Charter Capital and Total Equity
3rd largest bank in terms of Total Assets
Experienced management team and effective human resources
A strong brand name with a diversified client base
Strong shareholder support
Solid infrastructure with modern technology system
Investment Highlights
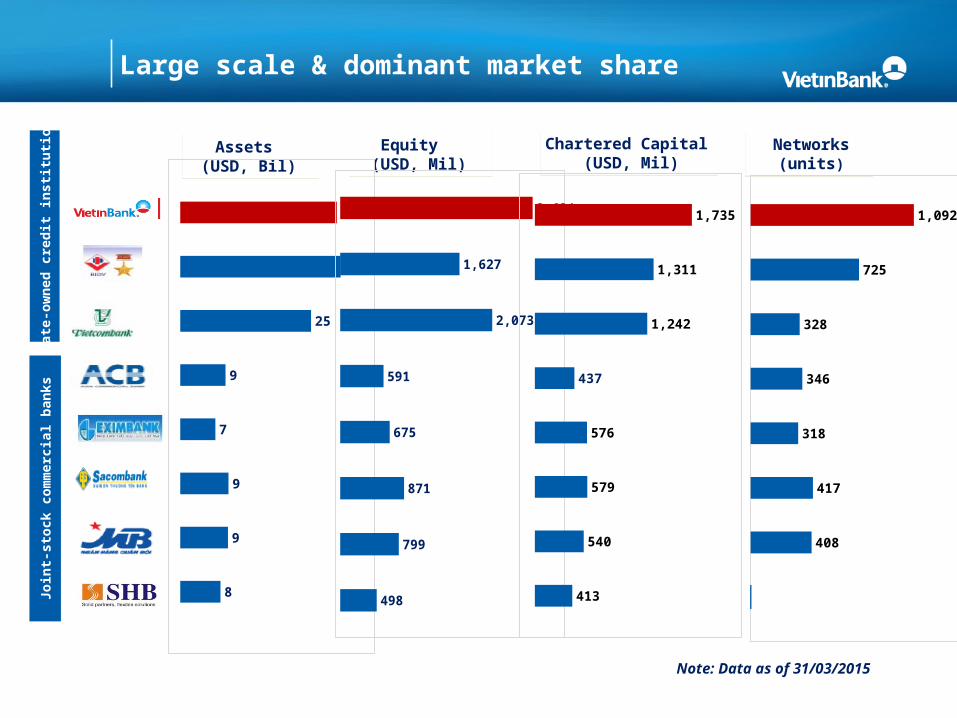
Large scale & dominant market share
Assets (USD, Bil)Assets
(USD, Bil)Equity
(USD, Mil)Equity
(USD, Mil)Chartered Capital
(USD, Mil)Chartered Capital
(USD, Mil)Networks
(units)
Networks(units)
Sta
te-o
wn
ed c
red
it in
stit
uti
on
sJo
int-
sto
ck c
om
mer
cial
ban
ks
8
9
9
7
9
25
31
30
498
799
871
675
591
2,073
1,627
2,624
413
540
579
576
437
1,242
1,311
1,735
408
417
318
346
328
725
1,092
Note: Data as of 31/03/2015
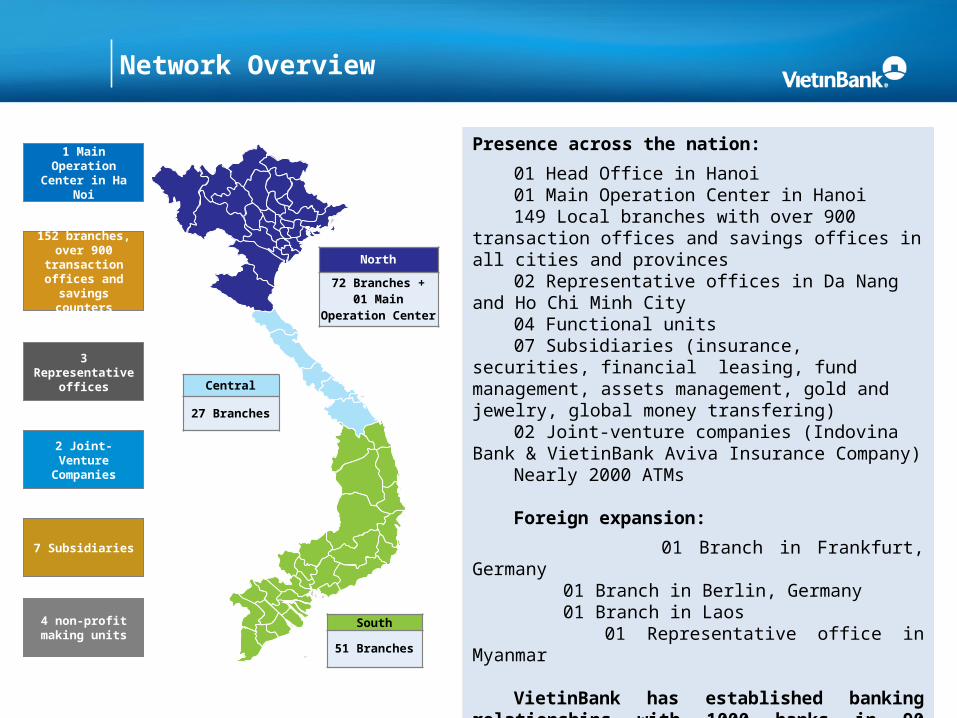
Network Overview
Presence across the nation:
01 Head Office in Hanoi01 Main Operation Center in Hanoi149 Local branches with over 900 transaction
offices and savings offices in all cities and provinces02 Representative offices in Da Nang and Ho Chi
Minh City04 Functional units07 Subsidiaries (insurance, securities, financial
leasing, fund management, assets management, gold and jewelry, global money transfering)
02 Joint-venture companies (Indovina Bank & VietinBank Aviva Insurance Company)
Nearly 2000 ATMs
Foreign expansion:
01 Branch in Frankfurt, Germany 01 Branch in Berlin, Germany 01 Branch in Laos 01 Representative office in Myanmar
VietinBank has established banking relationships with 1000 banks in 90 countries and territories all over the world
1 Main Operation Center in Ha Noi
152 branches, over 900
transaction offices and
savings counters
3 Representative offices
2 Joint-Venture Companies
7 Subsidiaries
4 non-profit making units
North
72 Branches +01 Main Operation
Center
Central
27 Branches
South
51 Branches
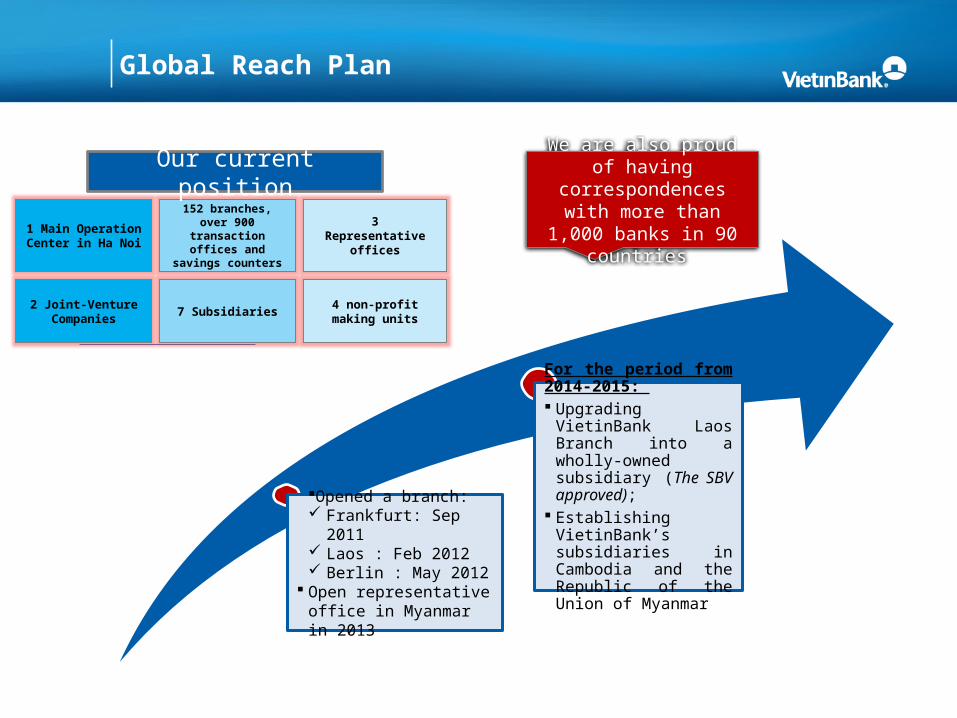
Global Reach Plan
1 Main Operation Center in Ha Noi
152 branches, over 900 transaction
offices and savings counters
3Representative
offices
2 Joint-Venture Companies
7 Subsidiaries4 non-profit making
units
Our current position We are also proud of having correspondences
with more than 1,000 banks in 90 countries
Opened a branch: Frankfurt: Sep 2011 Laos : Feb 2012 Berlin : May 2012
Open representative office in Myanmar in 2013
For the period from 2014-2015: Upgrading VietinBank
Laos Branch into a wholly-owned subsidiary (The SBV approved);
Establishing VietinBank’s subsidiaries in Cambodia and the Republic of the Union of Myanmar

Reputable & Diversified Corporate Customer
VietinBank has fostered strong banking relationships with some of the most well-established corporates in Vietnam
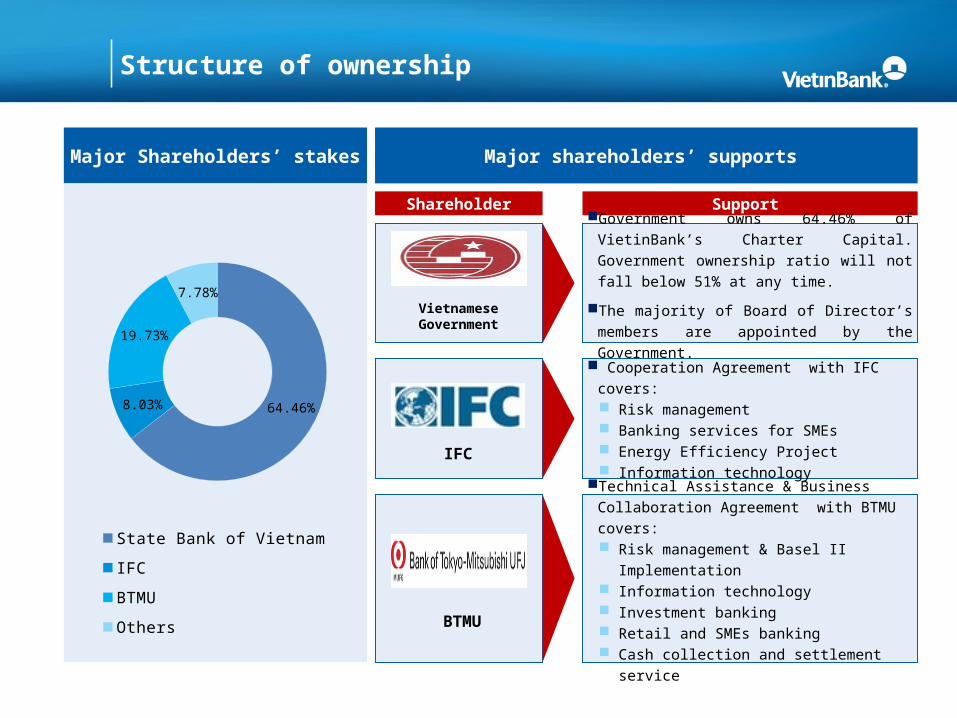
Structure of ownership
Major Shareholders’ stakes
Shareholder
VietnameseGovernment
IFC
BTMU
Support
Government owns 64.46% of VietinBank’s
Charter Capital. Government ownership ratio
will not fall below 51% at any time.
The majority of Board of Director’s members are
appointed by the Government.
Cooperation Agreement with IFC covers: Risk management Banking services for SMEs Energy Efficiency Project Information technology
Technical Assistance & Business Collaboration
Agreement with BTMU covers: Risk management & Basel II Implementation Information technology Investment banking Retail and SMEs banking Cash collection and settlement service
64.46%8.03%
19.73%
7.78%
State Bank of Vietnam IFC
BTMU Others
Major shareholders’ supports

2015’s strategic objectives
Strengthen capital base to enhance financial strength (CAR>9%, ROE in the range of 10-11% and ROA in the range of 1-1.2%)
Continues to consolidate organizational structure and operating model with the launch of the ORP project (consulted by McKinsey and Ernst & Young)
Improve service quality to increase the share of non-interest income
Focus on Commercial Banking and Investment Banking pillars
Enlarge the retail banking business
Expand market and client base to increase market share.
Expand distribution network both domestically and internationally
Dividend: 7-9%Focus on risk management: NPL ratio/total credit exposure <3.0%
Growth: Assets: 13% Mobilized fund:14% Credit: 13%

VietinBank vs other banks – QI/2015
(Unit: USD Million) CTG BIDV VCB ACB STB EIB MBB SHB Average
Total Assets 30,098 30,861 25,154 8,729 9,262 6,750 9,188 7,733 15,972
Chartered capital 1,735 1,310 1,242 437 579 576 540 413 854
Balance sheet
Placements with and loans to other banks 2,624 1,991 4,461 185 202 1,111 604 800 1,497
Loans and advances to customers 20,974 21,678 15,415 5,555 6,244 3,834 4,661 5,215 10,447
Trading and investment securities 4,274 5,051 3,750 2,082 1,660 1,041 3,067 628 2,694
Trading securities 214 581 540 114 412 0 599 2 308
Investment securities 4,060 4,470 3,210 1,967 1,248 1,041 2,469 627 2,386
Long-term investments 180 214 165 41 12 90 70 14 98
Other assets 1,262 1,074 432 455 471 184 400 750 629
LiabilitiesDeposits and borrowings from other banks 3,623 4,100 1,480 507 200 1,212 501 567 1,524 Customer deposits 19,967 21,603 20,334 7,304 7,974 4,623 7,572 6,273 11,956
Financing funds, entrusted funds 1,787 1,463 0
8 50
0
10 10 416
Other liabilities 1,718 639 483 167 165 99 178 124 447
Owner's equity and Funds 2,624 1,627 2,073 591 872 675 799 498 1,220
Income statement (accummulated)
Net interest and similar income 219 214 163 65 90 42 93 29 114
Net profit from services 13 21 16 8 12 3 5 1 10
Other income 14 11 38 2 3 2 8 2 10
Total income 245 246 216 75 105 47 106 32 134
Operating expenses 102 94 78 47 51 22 34 21 56
Provision for credit losses 70 46 71 12 15 0
36 0 31
Profit before tax 73 106 68 17 38 25 37 10 47
Profit after tax 58 87 53 13 30 19 29 8 37

3. Operating results
Stable deposits growth & high liquidity
High loans value, NPL ratio is well controlled
Safe & diversified securities portfolio
Strong financial results
Contribution in subsidiaries
CTG Stock Performance

Stable deposits growth
Mobilized Fund structure (USD, Mil) Deposits of customers & credit institutions (USD, Mil)
Inner ring: As at 31 Dec 2014: USD 28,040 MilOuter ring: As at 31 Mar 2015: USD 26,964 Mil
0.79%
17%
71%
5%1%4%
0.27%
13%
74%
7%1%5%
Due to Gov and SBVDeposits & borrowing from other banksCustomer DepositsSponsor capital, Entrusted InvestmentValue paper issuedOther mobilized funds
2010 2011 2012 2013 2014 Q1/20150
5,000
10,000
15,000
20,000
25,000
9,566
12,050 13,56817,156
19,957 20,1661,492
3,366
4,572
3,796
4,895 3,660
Deposit &borrowing from other banks
Customer Deposits

High liquidity
Customer Deposit Breakdown by
Type of business (31.12.2014)
Customer Deposit Breakdown by by Tenor (31.03.2015)
CAR ratio
13.83%
82.57%
0.60%
3.00%Demand deposits
Term deposits
Deposits for specific purpose
Margin deposit20
1020
1120
1220
13
Q1/20
14
Q2/20
14
Q3/20
14
Q4/20
14
Q1/20
150%
2%
4%
6%
8%
10%
12%
14%
8.02%
10.57%10.33%
13.17% 13.16%12.57%
11.77%
10.40%
11.46%
26.01%
7.17%
4.78%55.81%
6.23%SOEs Other business entities
FDI Individuals
Others

High loans value, sustainable LAR ratio
Total loans and advances to customer (USD, Mil)
Loan Breakdown by Type of business (31.12.2014)
Loan to Total assets ratio
Loan Breakdown by Tenor (31.03.2015)
2010 2011 2012 2013 2014 Q1/2015
0
5,000
10,000
15,000
20,000
25,000
11,018
13,81115,690
17,711
20,704 20,974
2010 2011 2012 2013 2014
63.69% 63.71%
66.20%
65.28%
66.53%
58.06%
9.57%
32.37%
Short term
Medium term
Long term
31.86%
46.30%
4.41%
16.81%
0.62%
SOEs
Other business entities
FDI
Individuals
Others
2010 2011 2012 2013 2014 Q1/2015
63.69% 63.71%
66.20%65.28%
66.53%
69.69%

NPL ratio is well controlled
Group Q1/2015 Q4/2014 Q3/2014 Q2/2014 Q1/2014 2013
Value
(USD, mil)
%Value
(USD, mil)
%Value
(USD, mil)
%Value
(USD, mil)
%Value
(USD, mil)
%Value
(USD, mil) %
Group 1
Current20,312 96.84 20,295 98.03 18,366 97.83 17,203 96.69 16,130 96.74 17,404 98.27
Group 2
Special mention
285 1.36 177 0.86 80 0.42 138 0.78 246 1.48 129 0.73
NPLs 377 1.80 231 1.12 328.4 1.75 451 2.53 297 1.78 177 1.00
Total 20,974 100 20,704 100 18,695 100 17,791 100 16,672 100 17,711 100
2008 2009 2010 2011 2012 2013 Q1/2014 Q2/2014 Q3/2014 Q4/2014 Q1/20150%
1%
2%
3%
4%
5%
1.81% 0.61% 0.66% 0.75%
1.47%1.00%
1.78%
2.53%
1.75%
1.12%
1.80%2.10%
2.50% 2.40%
3.47%
4.09%3.79% 3.86%
4.17%3.88%
3.25%3.59% (*)
VietinBank
Banking average
(*): Data as at end of Feb 2015

•VietinBank has in place robust credit systems, clearly defining relevant exposure limits and credit risk appetite
•Such systems are enhanced by a strong credit culture, benefiting from well-defined delegations of authority and reporting lines
Robust Credit Systems
•Advances are relatively well diversified across business entities & Industrial sectors, ensuring a high degree of diversification of potential risks
•The credit policy has put in place strict exposure limits
Well Defined Sectoral, Single Party and Group Exposure
Limits
•Comprehensive and detailed loan classification and provisioning requirements and policies are in place, consistent with regulatory norms and guidelines
•Existence of robust procedures have resulted in positive developments in non-performing asset measures in recent times
Comprehensive Loan Classification and
Provisioning Requirements
•Strong Credit risk management system is in place which has ensured improvement in the asset quality in this growing economic environment
Strong Credit Risk Management System
Asset Quality Management

Safe & diversified securities portfolio
Components of Investment portfolioInvestment portfolio (USD, Mil)
2010 2011 2012 2013 2014 Q1/20150%
5%
10%
15%
20%
25%
30%
35%
0
1,000
2,000
3,000
4,000
5,000
6,000
7,000
8,000
9,000
5,420
6,4336,332
7,539
8,327
7,179
31.1%
29.7%
26.7% 27.8%26.8%
23.6%
Total investment Investment to total asset ratio
42.6%
55.2%
0.1%
2.1%
36.9%
60.5%
0.1%
2.5%
Interbank Debt securities Equity securities
Long-term investments
Inner ring: As at 31 Dec 2014Outer ring: As at 31 Mar 2015

Strong financial results
Profit results (USD, Mil) Operating Income Breakdown
Cost to income ratio
2010 2011 2012 2013 2014 Q1/20150
100
200
300
400
500
600
700
361
625
590
559
527
145164
296 295273 270
59
Profit before provisions for credit losses
Profit after tax
2010 2011 2012 2013 2014 Q1/2015
0%10%20%30%40%50%60%70%80%90%
100%
82%90% 84% 84% 84%
89%
10%5%
6% 7% 7% 5%
9% 5% 10% 9% 9% 6%
Other operating income Fees and commission incomeNet interest income
2010 2011 2012 2013 2014 Q1/201536%
38%
40%
42%
44%
46%
48%
50%48.57%
40.57%
42.96%
45.49%
46.72%
41.50%
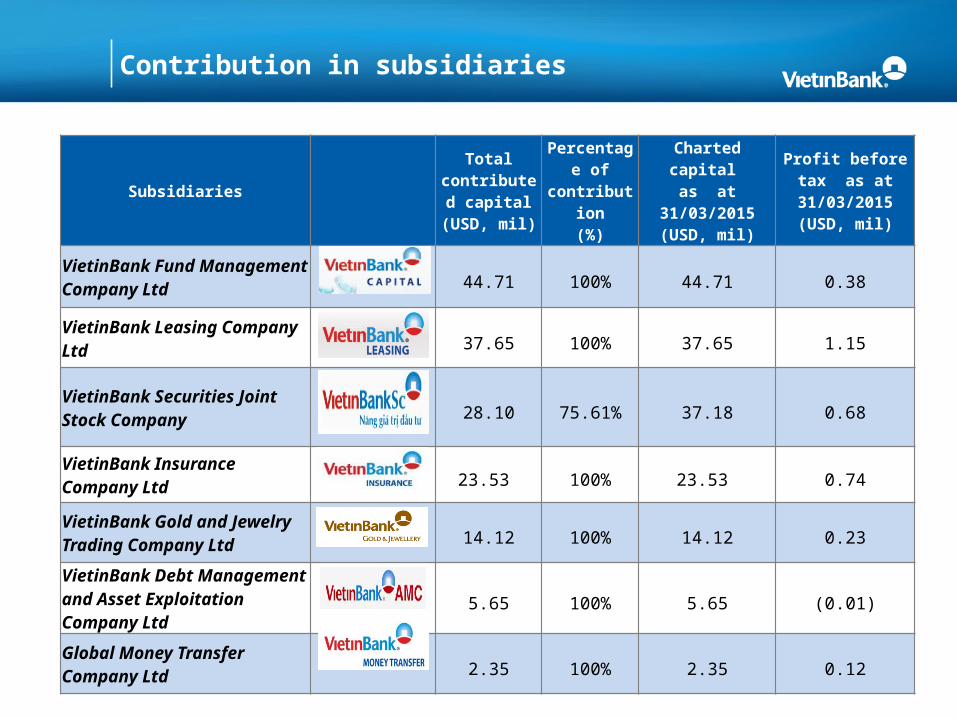
Contribution in subsidiaries
Subsidiaries
Total contributed
capital(USD, mil)
Percentage of
contribution(%)
Charted capital as at 31/03/2015
(USD, mil)
Profit before tax as at 31/03/2015
(USD, mil)
VietinBank Fund Management Company Ltd 44.71 100% 44.71 0.38
VietinBank Leasing Company Ltd 37.65 100% 37.65 1.15
VietinBank Securities Joint Stock Company 28.10 75.61% 37.18 0.68
VietinBank Insurance Company Ltd 23.53 100% 23.53 0.74
VietinBank Gold and Jewelry Trading Company Ltd 14.12 100% 14.12 0.23
VietinBank Debt Management and Asset Exploitation Company Ltd
5.65 100% 5.65 (0.01)
Global Money Transfer Company Ltd 2.35 100% 2.35 0.12

CTG Stock Performance - QI/2015
0
5
10
15
20
25
0
1,000
2,000
3,000
4,000
5,000
6,000
7,000CTG Stock Performance - QI/2015
Volumn (Thousands of shares) CTG price
Th
ou
sa
nd
s d
on
g
05/0
1/20
15
08/0
1/20
15
13/0
1/20
15
16/0
1/20
15
21/0
1/20
15
26/0
1/20
15
29/0
1/20
15
03/0
2/20
15
06/0
2/20
15
11/0
2/20
15
24/0
2/20
15
27/0
2/20
15
04/0
3/20
15
09/0
3/20
15
12/0
3/20
15
17/0
3/20
15
20/3
/201
5
25/3
/201
5
30/3
/201
5
80%
100%
120%
140%
160%Growth of VN-Index and Bank Stock (QI/2015)
CTG VCB BID MBB STB ACB
VNIndex
Value
The closing price on 05th Jan 2015 13,900 VND/share
The closing price on 31th Mar 2015 17,300 VND/share
The highest prices in QI/2015
19,400 VND/share (27th Feb 2015)
The lowest prices in QI/2015
13,900 VND/share(05th Jan 2015)
Volumn 132,224,850 shares
Trading value 2,686 Million VND
The trading volum of foreign investors
Net purchase 15.828.840 share
EPS 1,567 VND/share
P/E 11.04x
BVPS 14,001 VND/share
P/B 1.24x

Website for investorshttp://investor.vietinbank.vn
For further information, please contact:
Investor Relations, Board of Director SecretariatsVietinBankAddress: 108 Tran Hung Dao street, Hanoi, Vietnam. Email: [email protected] Tel: 84-4-3 941 3622

Thank you!
Disclaimer :
This presentation is prepared by using financial reports and other reliable sources with the aims to provide
information only. Readers should use this presentation as a reference source. The information might be
updated from time to time and we have no responsibility to notify about that change.


![[XLS] Log Mail 2015.05.xls · Web viewM MOJELA K MAKWELA J SEBOPA O MAMPURU Q SEEGER CENTURION J MOLEPO M KEIN T MICHEL L MATHESE T URIA P MAKHURA D SEBUYI P KOLODI D NYALUNGA S BALOI](https://static.documents.pub/doc/80x56/5b0ae8637f8b9ac7678d249b/xls-log-mail-201505xlsweb-viewm-mojela-k-makwela-j-sebopa-o-mampuru-q-seeger.jpg)


