Research Paper No. 2008/84 Vietnam Following in China’s Footsteps The Third Wave of Emerging Asian Economies Jean-Raphael Chaponnière,1 Jean-Pierre Cling,2 and Bin Zhou3 September 2008
Abstract
Vietnam has been following China’s path closely and very successfully for the last two decades, since the adoption of ‘Doi moi’ in 1986. Over those last two decades, economic growth rates in both countries have been the highest worldwide (with GDP growing by 8 per cent and 10 per cent per year, respectively). The increase of the Vietnamese share of world trade is the highest of all major Asian exporters (including China) since the mid-1990s. In the current international context, doubts have been raised by some economists concerning the possibility for new Asian countries to take-off and join the group of emerging countries. Several obstacles might block this emergence, such as the rise of China and the stringent rules of the World Trade Organization (WTO). This paper addresses this question with regard to Vietnam, who joined the WTO at the beginning of 2007: we study Vietnam’s potential for sustainable growth and international integration. We start by briefly describing economic reform and trade policies in Vietnam, and their results in terms of economic growth and world integration. We then analyse Vietnamese trade specialization and the bilateral relationship with China. Finally, we assess the competition between Vietnam and China on world markets, and show that the export structures are very different. Both countries have benefited from a boom in their textile and clothing exports following the cessation of quotas (in the case of China) and the signing of USBTA (in the case of Vietnam). For Vietnam, reducing the specialization in textiles and clothing, and joining the Asian production network in electronics, represents a major challenge.
Keywords: export-led growth, WTO, Vietnam, China
JEL classification: F13; O24; O53
The World Institute for Development Economics Research (WIDER) was established by the United Nations University (UNU) as its first research and training centre and started work in Helsinki, Finland in 1985. The Institute undertakes applied research and policy analysis on structural changes affecting the developing and transitional economies, provides a forum for the advocacy of policies leading to robust, equitable and environmentally sustainable growth, and promotes capacity strengthening and training in the field of economic and social policy making. Work is carried out by staff researchers and visiting scholars in Helsinki and through networks of collaborating scholars and institutions around the world.
UNU World Institute for Development Economics Research (UNU-WIDER) Katajanokanlaituri 6 B, 00160 Helsinki, Finland Typescript prepared by Janis Vehmaan-Kreula at UNU-WIDER The views expressed in this publication are those of the author(s). Publication does not imply endorsement by the Institute or the United Nations University, nor by the programme/project sponsors, of any of the views expressed.
Tables and Figures appear at the end of the paper.
1
1 Introduction
Rapid industrialization is the major characteristic of East Asian economic development. It has been accelerated by export orientation and a specialization pattern that has evolved from simple products (for example, garments, shoes, toys, and so on) to more sophisticated products. Countries have been involved in a catch-up process in line with their comparative advantage. According to Okita (1985), the great diversity among the Asian nations in their stages of development and resource endowments ‘works to facilitate the flying geese pattern of shared development as each is able to take advantage of its distinctiveness to develop with a supportive division of labour’.
The ‘flight of wild geese’ image has acquired different meanings over time. It was first used to describe the life cycle of industries (Akamatsu 1962); it has been successively extended to the evolution of industrial structure, then to the shift of industries from one country to another. According to this latter meaning, as Japan and the other East Asian countries leave industries in which they have no comparative advantage, countries that industrialized later are able to move into these industries and join the ‘flying geese’ formation. The textiles and clothing industry offers an example of the shift of industries in Asia, from Japan to Hong Kong/Korea, and then to Malaysia/ the Philippines/ Thailand and now to China/ Vietnam, and so on.
This model was helpful to describe Asian development during recent decades, and the successive emergence of Japan, followed by the ‘Dragons’ (Hong Kong, Korea, Singapore, and Taiwan) and the ‘Tigers’ (Indonesia, Malaysia, Philippines, Thailand, and so on). Three major evolutions have made this transition process more difficult and might provoke a major disruption in the ‘flight of wild geese’:
• First, Asian development came to a halt in 1997 because of the Asian crisis, with a long-term impact in some countries. While Korea was able to grow out of the crisis very rapidly, Indonesia was the major victim and Thailand is still having difficulties moving from middle-income to high-income status.
• Second, economic emergence has become more difficult as China has fully joined the ‘flight’ and has been rapidly moving up the value chain. Indeed, the pace of China’s growth has accelerated since the Asian crisis, while that of other Asian emerging countries has slowed down compared with their pre-crisis performances.
• Third, the new trade rules imposed by the WTO have been considered as an obstacle to the integration of new emerging countries in the world economy; according to Chang (2002), developed countries have ‘kicked away the ladder’ of economic development (Korea and the other dragons would not have been allowed to pursue the industrial policies that contributed to their success story). Moreover, the end of clothing quotas mostly benefited China and had a negative impact on other developing countries.
Following Eichengreen (2004), several studies (Lall and Albaladejo 2004; Eichengreen and Tong 2005; Humphrey and Schmitz 2006; Ravenhill 2006) have tried to assess the impact of China’s economic growth on Asian middle-income emerging countries. They concluded that it was positive, as most of these countries were able to adjust to the Chinese threat. But, to our knowledge, the impact of China’s economic emergence on its low-income neighbours has not been assessed yet, although it is most probably of a
2
different nature. Studying this impact is all the more important, as it can present some answers concerning the possibility of new Asian countries emerging in the current international economic context.
In this paper, in order to study Vietnam’s potential for sustainable growth and international integration, we focus on international trade and the trade relationship between Vietnam and China. Our paper draws on international foreign trade databases and uses traditional indicators of trade specialization and competition.
In the first section, we describe Vietnamese economic reform (especially trade policies), and its results in terms of economic growth and world integration. The subsequent section studies Vietnam’s trade specialization and the bilateral relationship with China. This is followed by an assessment of the competition between Vietnam and China on world markets, and an analysis of the particular case of textiles and clothing, which, historically, was the initial basis of the industrialization process.
2 Vietnam is the latest Asian emerging economy
Vietnam is a neighbour of China, and Vietnam’s capital Hanoi is less than 1000 kilometres from Hong Kong and Guangzhou (Canton). Both countries share many cultural values (Confucianism), as well as a common history: until the signature of the Treaty of Tientsin with France hardly more than a century ago (1885), China had suzerain rights and sovereignty over Vietnam (and the Indo-China peninsula). Vietnam also used Chinese ideograms up until the early twentieth century.1 Since independence (1945), Vietnam has maintained a close political and economic relationship with China (only interrupted, temporarily, from the end of the 1970s to the beginning of the 1990s). Finally, China and Vietnam are among the last countries in the world where the communist party still has a monopoly of power.
It is therefore unsurprising that economic reform in Vietnam followed that of China relatively closely: facing economic difficulties, both countries had to adopt some principles of market economy. Although reform in Vietnam was (as in the case of China) gradual, results came quickly in terms of economic growth and integration in the world economy.
2.1 Vietnam’s Doi moi followed China’s reform
At the beginning of the 1980s, Vietnam faced alarming economic difficulties: acute shortage of basic consumer goods (even for staple food products), growing external debt, increasing macro-economic imbalances (inflation, public sector and trade deficits) and a slowdown of economic growth.
In December 1986 – eight years after China (December 1978) – Vietnam reacted by embarking on a radical reform programme called ‘Doi moi’ (‘Change and Newness’) that marked the adoption of ‘market socialism’ (Figure 1). As in China, the reforms
1 At the beginning of the twentieth century, Vietnam abandoned Chinese ideograms and shifted to the Latin alphabet.
3
started in the rural areas where agriculture was virtually decollectivized, farmers were given more autonomy, and prices were liberalized. A private sector was authorized, consisting mainly of small and medium-sized enterprises. Major elements of central planning were dismantled.
The external liberalization process was also very rapid. The state monopoly of foreign trade was abandoned. Tariff exemptions were introduced for inputs used in the production of export goods; the non-tariff barriers were reduced. Progress was made in a number of areas, including reduction in maximum import tariff rates, the implementation of tariff reductions associated with membership of ASEAN (in 1997), and so on.
Since the adoption of Doi moi, and following the East Asian ‘Dragons’ model (World Bank 1993), Vietnamese trade policy has mixed import substitution measures and export subsidies to promote an export led growth strategy. As had previously been the case in East Asian emerging countries (Amsden 2001), export subsidies have played a key role in the export surge, especially for textile and clothing products.
Following the end of the US embargo in 1993, Vietnam speeded up its process of international integration. Three trade agreements have had a major impact on trade liberalization and increased market access:
• After joining ASEAN, tariffs on imports from ASEAN countries were reduced to below 5 per cent in 2006 under the Asian Free Trade Area (AFTA). This tariff reduction was also applied by other ASEAN countries to Vietnamese exports, which benefited from improved market access in the area.
• In 2000, Vietnam signed a bilateral trade agreement (USBTA) with the United States, opening the doors of the American market to Vietnamese products (submitted to quotas). As Vietnam’s exports to the US have been granted most favoured nation (MFN) status since 2002, the average tariff on Vietnamese imports into the USA dropped from some 40 per cent to 3–4 per cent.
• Vietnam eventually joined the WTO at the beginning of 2007 (five years after China), almost exactly 20 years after the adoption of Doi moi. As it is now a member of the WTO, Vietnam benefits from the MFN status in all member countries (which also means that quotas will no longer be applied to Vietnamese exports) and has to apply WTO rules. Consequently, the MFN tariff will be reduced, on average, to below 15 per cent by 2019 and the maximum tariff applied will decrease from 150 per cent to 85 per cent (IMF 2007). However, after its accession to the WTO, Vietnam will not be immune from new trade frictions as it is considered (as is China, also) to be a ‘non-market economy’.
2.2 Vietnam has received increasing flows of FDI
Although financial liberalization has been slow and modest, Vietnam has received important foreign funding: according to the balance of payment figures, foreign direct investment (FDI) amounts to around US$2 billion per year (that is, 4 per cent of GDP) and Development Aid to around US$1.5 billion per year. FDI comes mostly from Asian countries (Table 1): the first five foreign investors (Singapore, Taiwan, Japan, Korea,
4
and Hong Kong) contributed to nearly two-thirds (63 per cent) of total disbursed investment up until 2006.
FDI has become a significant contributor to domestic investment (more than 10 per cent of gross investment) and exports, and picked up with the completion of the WTO negotiation. Up until 2000, the oil and gas sectors were the principal recipients of FDI but, since then, light and heavy industries have received the lion’s share.
For Asian firms, Vietnam is increasingly perceived as an alternative to China with regard to labour-intensive industries. It is notably the case for Japanese multinationals: Vietnam ranks third in their intentions for investment behind India and China, according to the 2006 annual survey of the Japan Bank for International Cooperation, as well as Taiwanese firms. Labour costs in Vietnam are slightly lower than in China and both countries share the same work ethics. Compared with low-income countries, Vietnam also has an excellent education record: the primary completion rate is almost 100 per cent and the secondary school enrolment ratio is as high as 76 per cent (World Bank 2007).
2.3 An export boom sustained by foreign firms
In Vietnam, economic and export growth rates have been impressive: since the mid-1980s, GDP has grown at the rate of nearly 8 per cent per year and foreign trade has expanded at the rate of nearly 20 per cent per year (the respective figures for China are 9 per cent and 15 per cent per year). For the last two decades, Vietnam and China have been the fastest growing Asian economies.2 Thanks to the low level of its financial openness, Vietnam was relatively spared from the 1997 crisis. As the dollar has been depreciating since 2003, Vietnamese competitiveness has been helped by an exchange rate policy that follows an implicit peg to the US$. At the national level, between 1993 and 2004 the proportion of the population living in poverty was considerably reduced from 54 per cent to 24 per cent.
The growth of the Vietnamese share of the world market for goods has been remarkable since the mid-1980s, even when compared with China (Figure 2). Its growth is by far the most dynamic of all Asian exporters (although the current level of 0.3 per cent is far behind Thailand’s market share of 1 per cent and, of course, China’s 8 per cent). The Vietnamese market share on the world and EU markets has almost tripled between 1995 and 2004. The ratio is 14 on the US market, where Vietnamese exports were totally insignificant in 1995 (as the US embargo had only ended in 1993). The gain on the Japanese market is important but much lower than that on the European market.
According to the General Statistical Office, foreign investors (which are mostly Asian) exported a total value of US$22.8 billion in 2006 (including oil); that is, 57 per cent of total exports. Foreign firms export over 50 per cent of total garment exports (this share is probably even larger in the case of electronics). The role of export processing is
2 Some other small countries in other continents have also registered very high growth rates (for example, Equatorial Guinea). But these growth rates are based on one commodity only (oil, in this case).
5
similar to that in China, where Asian subsidiaries account for around 50 per cent of total exports (Gaulier et al. 2005).
The structure of exports has also changed dramatically in recent years. Since 2002, manufactured products have contributed to the majority of exports (Figure 3). This 50 per cent threshold was reached by the Philippines in 1984, by China in 1986, by Thailand and Malaysia in 1989, and by Indonesia in 1995. Being an oil exporter (as is Indonesia, but on a smaller scale) tends to reduce the share of manufactured exports. However, crude oil exports will go down in the next few years as Vietnam is building oil refineries for domestic consumption.
3 Vietnam still has the trade specialization of a low-income country
In spite of its rapid progress, Vietnam is still in the early stages of industrialization and international integration. The study of its trade specialization conducted in this section confirms this situation. Contrary to other Asian emerging countries, Vietnam is not yet part of the Asian production network (except, to a certain extent, in clothing), which is dominated by China. Its trade with China corresponds to a ‘South–North’ trade pattern: it exports raw materials and imports manufactured products from its sizeable neighbour.
3.1 Vietnam is building up new comparative advantages
The specialization in Vietnamese foreign trade is analyzed here using the indicators of revealed comparative advantage, drawn from Balassa (1965). The advantage of using these indicators is that we do not restrict ourselves to analyzing the breakdown of Vietnamese trade independently from the rest of the world, but we analyze Vietnam’s specialization relatively to the structure of world trade.
Vietnamese specialization, which is highly concentrated on a few products, is characteristic of a low-income country rich in natural resources (Table 2): oil (20 per cent of its exports in 2004, according to CEPII/Chelem) is its first comparative advantage, followed by textile and clothing products (shoes, followed by clothing and knitwear) and by meat products. On the import side, refined oil is the first comparative disadvantage (12 per cent of imports), followed by yarn and fabric used by the textiles and clothing industry, and by other intermediate products (iron and steel, plastic products) and specialized machinery.
Among Asian emerging countries, Vietnam’s specialization is only comparable to Indonesia’s (Table 3). All the other countries participate in the Asian electronic regional network and, therefore, have a strong revealed comparative advantage in electronic and computer products. Only China, Indonesia, and the Philippines are still specializing in clothing products, whereas the more advanced economies (Korea, Malaysia, Taiwan, and Thailand) have moved up the ladder.
Chinese specialization is much more diversified than the Vietnamese. Exports, contrary to Vietnam, do not rely on raw materials at all: the comparative advantages are found in computers, other manufactured products, and textiles and clothing (shoes, clothing, and knitwear, in the same order as Vietnam). The comparative disadvantages correspond to inputs for the computer industry (electronic components), raw materials (crude oil),
6
specialized machinery, and other intermediate products (chemical organic and plastic products).
In both countries, the evolution of trade specialization over the last two decades is striking:
• Vietnam has built up its revealed comparative advantages in textile and clothing from scratch (in knitwear but not in clothing, which already existed at the end of the 1980s). This is also the case for shoes and for furniture. Inversely, the specialization of exports in agricultural products has been progressively reduced. As Vietnam has started producing pharmaceutical products, the relative weight of this product in imports has also strongly decreased.
• China already had a specialization in textiles and clothing two decades ago but did not export any computers, electronic products, or telecommunication equipment: the specialization in these products has increased progressively.
3.2 Bilateral trade with China follows a South–North pattern
In 2004, China became the first supplier to Vietnam and its fourth client.3 According to Vietnam’s trade statistics, total bilateral trade amounted to US$7.5 billion in 2006 (the real amount is larger due to widespread smuggling). Applying a gravity model taking into account usual variables (the distance between the two countries, the size of their economies, and so on), Tumbarello (2006) shows that bilateral trade is in line with the amount predicted by the model. Bilateral trade is expected to double and rise to US$15 billion in 2010.4
Vietnam’s bilateral trade with China shares three common characteristics with its least developed country neighbours (LDCs) (Cambodia, Laos, and Myanmar):
• In contrast to middle-income Asian countries which all enjoy a large surplus in their trade with China, Vietnam (as well as these other LDCs’ neighbours) runs a trade deficit with China. According to Vietnam’s trade statistics, this bilateral deficit amounted to US$3 billions in 2006 (4 per cent of GDP), and the ratio of exports to imports was 41 per cent. The deficit has sharply increased over time. In 2001, the bilateral trade was still almost balanced (the deficit amounted to US$ 200 millions only, and the export/import ratio to 87 per cent).
• In Vietnam, as in Cambodia and Myanmar (but not in Laos, where Thailand is the largest supplier), China is by far the first supplier. This is not the case for middle-income Asian countries, where China’s market share is much smaller;
• Finally, as is the case for Cambodia, Vietnam’s export structure to China is different from the structure of its world exports. Indeed, manufactured goods represent a small percentage of Vietnamese exports to China (18 per cent), much inferior to the
3 Bilateral trade was completely marginal when both countries re-established diplomatic relations in 1991.
4 Vietnam and China joint press communiqué on 19 May 2007 (http://english.vietnamnet.vn/politics/2007/05/696637).
7
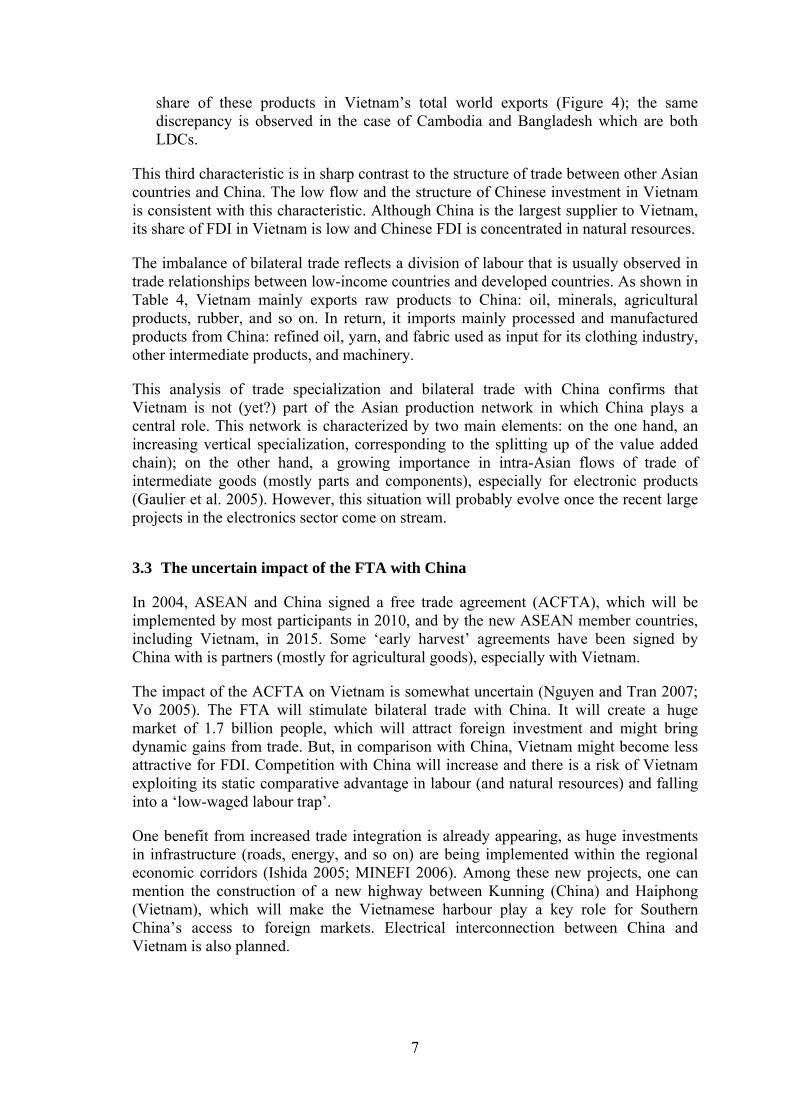
share of these products in Vietnam’s total world exports (Figure 4); the same discrepancy is observed in the case of Cambodia and Bangladesh which are both LDCs.
This third characteristic is in sharp contrast to the structure of trade between other Asian countries and China. The low flow and the structure of Chinese investment in Vietnam is consistent with this characteristic. Although China is the largest supplier to Vietnam, its share of FDI in Vietnam is low and Chinese FDI is concentrated in natural resources.
The imbalance of bilateral trade reflects a division of labour that is usually observed in trade relationships between low-income countries and developed countries. As shown in Table 4, Vietnam mainly exports raw products to China: oil, minerals, agricultural products, rubber, and so on. In return, it imports mainly processed and manufactured products from China: refined oil, yarn, and fabric used as input for its clothing industry, other intermediate products, and machinery.
This analysis of trade specialization and bilateral trade with China confirms that Vietnam is not (yet?) part of the Asian production network in which China plays a central role. This network is characterized by two main elements: on the one hand, an increasing vertical specialization, corresponding to the splitting up of the value added chain); on the other hand, a growing importance in intra-Asian flows of trade of intermediate goods (mostly parts and components), especially for electronic products (Gaulier et al. 2005). However, this situation will probably evolve once the recent large projects in the electronics sector come on stream.
3.3 The uncertain impact of the FTA with China
In 2004, ASEAN and China signed a free trade agreement (ACFTA), which will be implemented by most participants in 2010, and by the new ASEAN member countries, including Vietnam, in 2015. Some ‘early harvest’ agreements have been signed by China with is partners (mostly for agricultural goods), especially with Vietnam.
The impact of the ACFTA on Vietnam is somewhat uncertain (Nguyen and Tran 2007; Vo 2005). The FTA will stimulate bilateral trade with China. It will create a huge market of 1.7 billion people, which will attract foreign investment and might bring dynamic gains from trade. But, in comparison with China, Vietnam might become less attractive for FDI. Competition with China will increase and there is a risk of Vietnam exploiting its static comparative advantage in labour (and natural resources) and falling into a ‘low-waged labour trap’.
One benefit from increased trade integration is already appearing, as huge investments in infrastructure (roads, energy, and so on) are being implemented within the regional economic corridors (Ishida 2005; MINEFI 2006). Among these new projects, one can mention the construction of a new highway between Kunning (China) and Haiphong (Vietnam), which will make the Vietnamese harbour play a key role for Southern China’s access to foreign markets. Electrical interconnection between China and Vietnam is also planned.
8
4 Vietnam and China: more complementary than competitors on industrialized markets
In order to assess the potential for further growth of Vietnamese exports, it is essential to measure the degree of competition with China, which has become the third exporter of goods in the world (behind Germany and the USA). In this section, we analyze the proximity of the Vietnamese export structure with that of China and its evolution, and study the particular case of textiles and clothing.
4.1 Vietnam is making inroads in an increasing number of sectors
The USA is, by and large, the largest market for both Vietnam and China; they account for one-fifth of their exports (respectively 20 per cent and 21 per cent of exports in 2006, according to Vietnamese and Chinese trade statistics). While the Chinese share of the US market increased from 8.9 per cent (2001) to 15.5 per cent (2006), Vietnam’s share increased from 0.09 per cent to 0.46 per cent. In order to compare the performance of China and Vietnam (and Thailand) on the US market, trade shares have been computed for the period 2001 to 2006 at the three-digit industry level.
Table 5 confirms that China has emerged as a significant exporter across virtually the entire spectrum of industries: its share of the US import market has increased in 210 out of 263 industries and decreased in only 7. To assess Vietnam’s performance, one has to take into account the fact that Vietnamese exports were facing strong trade obstacles up until the USBTA came into force in 2002. Nevertheless, Table 5 shows that, between 2001 and 2006, Vietnam has made inroads on a very large number (175 out of 263) of markets. By comparison, Thailand’s market share in the USA increased in 137 markets only, and decreased in 33 markets.
As Vietnamese exports diversify rapidly on the US market, their structure could well be rapidly coming to resemble that of China; such evolution might represent a threat for the future of Vietnamese exports. In order to appreciate this evolution, we measured the proximity of the export structure of China on the US and the UE markets with the export structures of Vietnam, Korea and Thailand from 2001 to 2006 (Figure 5). This indicator, based on Linnemann (1966), was calculated by desegregating exports between 230 products, using the SITC classification at three-digit levels (see methodology in Appendix 6.1).
On both markets, the structures of Vietnamese and Chinese exports are very different, but register different evolutions:
• On the EU market, the Vietnamese export structure is very much different from the Chinese structure, and this difference has not evolved significantly since 2001. Vietnam exports mostly shoes (around 50 per cent of total exports) and textile and clothing products, whereas China exports mostly electronic and computer products together with a relatively small proportion of textile and clothing; the structure of Thai exports is nearer to that of China, while Korea is evolving in a different manner;
9
• The evolution is somewhat different on the US market. In 2001, the Vietnamese structure used to be rather dissimilar to the Chinese, but appears to be a little closer in 2006 (with a cosine of 0.42). This increased proximity is due to the export boom of Vietnamese exports of textiles and clothing (which were previously insignificant) since the opening of the US market (USBTA). As in the case of the EU market, Thailand’s export structure is very near to China’s (with a cosine of 0.8), while Korea’s structure is significantly different.
As stated by Lall and Albaladejo (2004), these similarities, or their absence, reveal either a lack of competition or a potential for competition. They do not demonstrate that competition actually exists as product categories are still broad (for example, in our classification in 230 products, all shoes exports are grouped into one category) and might include products that do not compete with each other. Even if the products were comparable, it would be possible that countries specialized in differentiated versions. Even in the same product, countries may complement each other by performing different functions within an integrated production system.
4.2 Vietnamese and Chinese textile exports are both benefiting from joining the WTO and from the cessation of quotas
As mentioned before, Vietnamese manufactured exports consist mostly of textiles and clothing (as well as shoes). This structure is characteristic of a developing country in the early stages of its industrialization process. As shown on Figure 6, the share of these products in total exports of goods is still growing (the decrease in 2004 was due to quotas and has reversed since 2005). This trend is to compare with other major Asian exporters, where the share of textiles and clothing in exports peaked around 1985–1990 and has been progressively declining since then.
Indeed, as happened with Japan a few decades earlier (and with European countries and the USA during the nineteenth-century industrial revolution), textiles and clothing has historically been the core industrial sector for all countries starting a take-off process. Many reasons explain why this key role is still valid at the beginning of the twenty-first century: clothing is the first industrial product consumed, it is a sector that requires light investment; the technology is simple; it mostly uses unskilled labour; poor countries have a huge supply of cheap labour and, therefore, are the most competitive in this labour intensive sector.
It is therefore important to assess recent Vietnamese performance in this sector together with future potential. This is all the more important as international competition has increased in this sector following the final dismantling of quotas imposed on Asian countries since the beginning of 2005.5
Having been a member of the WTO since the end of 2001, China appears to be the main beneficiary from the cessation of quotas (Table 6): its exports to the EU and the USA
5 The Multi-Fibre Arrangements (MFAs) were established in 1974. They imposed quotas on Asian exports of textile & clothing to industrialized countries. The Agreement on Textile & Clothing (ATC) signed in 1994 organized the progressive dismantling of these quotas during a 10-year period which ended at the beginning of 2005.
10
have almost doubled between 2004 and 2006 (despite new restrictions being quickly re-imposed on Chinese exports until the end of 2008); export growth has been slower on the Japanese market, which was already ‘quota free’. China is now, by far, the first exporter of textiles and clothing on all major industrialized markets.
However, Vietnam has also benefited (as have other major Asian exporters) from the new international context for these products (although the USA has imposed quotas within the USBTA): it now ranks sixth (even fifth, if Hong Kong is considered to be part of China) amongst Asian exporters to the EU + USA + Japanese market and its exports have grown at a strong pace over recent years (as has its market share).
As Vietnam joined the WTO at the beginning of 2007, it can be expected that its exports growth rate could even increase, as they will no longer be subject to quotas (although the EU has applied anti-dumping measures to Vietnamese shoes exports since 2006 and the USA have threatened to do the same on textiles and clothing). However, joining the WTO also means eliminating all export subsidies. Thus, as from June 2006, when Decision 126 replaced Decision 55 (2003), the textile and garment industry has no longer been eligible to receive preferential state credits from the Vietnam Development Bank (VDB).
In any case, the Asian low-income countries’ gain on textiles and clothing confirm that these countries have relatively similar low labour costs and high overall competitiveness for these products. This is not the case for other important exporters (Mexico and North African countries), which are generally middle-income countries that have lost considerable ground in recent years.
5 Conclusion
At the beginning of the 1980s, Vietnam was still recovering from three decades of devastating war – first, with France, then with the USA, followed by a rising tension with China that culminated in a war at the border in 1979. It was also suffering from an embargo imposed by the USA (which lasted until 1993), and which also prevented the World Bank (as well as other donors) from bringing aid to the country. The boat people leaving Vietnam at the turn of the 1970s, because of political pressure and the disastrous economic situation, contributed to reinforcing the country’s isolation.
A quarter of a century later, the economic improvement is remarkable, as is the integration into the world economy. Vietnam has been able to make inroads on world markets and can no longer be considered a ‘sitting duck’ waiting to be picked off by China, armed with a huge pool of cheap labour (Bhalla 1998, quoted by Ahearne et al. 2006). As has always been the case, the sustainability of Vietnam’s growth path is intimately linked to the economic situation in China, and to the evolution of China’s economic specialization.
China is undoubtedly both a serious competitor and a very important economic partner (Vo 2005). One of the main challenges for Vietnam’s industry, therefore, is to pursue a more offensive strategy towards China, as its neighbour will probably be the main engine of the world economy in the coming years. Vietnam needs to diversify its exports to China (which currently consist of oil and agricultural products only), while industrial goods dominate imports.
11
However, the impact of Vietnam’s WTO accession on its industrialization strategy must not be underestimated. In order to add greater value to its exports, this country needs to invest heavily in new technologies and raise productivity. It also needs to improve domestic support industries in order to provide inputs to the rapidly growing industries. While private and foreign firms are very active in labour-intensive industries, they import a significant part of their inputs. The government plans to reinforce the state-owned sector in order to stimulate the production of upstream industries (steel, petrochemicals, refining and fertilizers) as well as to develop industrial chains (Cao and Tran 2005). This strategy will have to abide by the rules of the WTO, and exports and import substitution subsidies will be totally eliminated in the next few years.
In order to strengthen their position, state-owned enterprises will have to attract foreign investment. This could prove difficult in the case of scale-intensive industries where these enterprises are more exposed to international competition from Japan, Korea and, increasingly, China.
Ultimately, although WTO regulations and the competition from China might make it more difficult for Vietnam to follow the East Asian path, Vietnam might nonetheless enjoy the benefit of being a late starter (especially at the Asian level), as stated by Gerschenkron (1966): ‘One can say that in a backward country, there exists a prerequisite to industrial development which the advanced countries did not have at its disposition, that is the existence of the more advanced countries as source of technological assistance, skilled labour and capital goods.’
At the moment, unlike other Asian emerging countries, Vietnam does not participate actively in the swiftly developing regional production networks, a situation that might change with the rise of electronics exports. Vietnam increasingly emerges as an alternative destination for the multinationals of this sector, as illustrated by Intel’s decision to build a chip assembly and testing plant in this country, and the appearance of outsourcing activities. This move could help Vietnam to join Asian countries in the ‘Asian integrated circuit’, which could prove Gerschenkron right.
12
Appendixes
Appendix 1: Methodology
Cos Cos indicator The methodology is taken from Van Beers and Biessen (1996), who based their work on an indicator proposed by Linnemann (1966).
The Cos indicator is used for measuring parallelism between export structures. In order to compare export structures to UE and USA from country i to country j, we considered vectors Eik and Ejk for k = 1,...,n (n are the 263 items of CICI 3 digits) that represent the exports of the different countries. The cosine of the angle between these two vectors evolves between 0 (total dissimilarity) to 1 (similarity).
Revealed comparative advantage
The comparative advantage indicator answers the question: ‘What are the strong points and the weak points of an economy?’
Instead of relative export structures, as in the classic Balassa (1965) method, the analytical indicator used here is based on the share of the total trade balance and takes into account the size of each country’s market.
The formulas are described below, with Vijk indicating the flow from exporting country i, to importing country j for product k. The summations of the various indices are given as:
Xik = Vi.k Exports from country i of product k
Xi. = Vi.. Exports from country i of all goods
Mjk = V.jk Imports by country j of product k
Mj. = V.j. Imports of country j of all goods
Wk = V..k World trade of product k
W. = V... World trade of all goods
For country i and product k, the balance is first calculated in relation to GDP at current exchange rate Y, giving (in thousandths):
yik = 1000 * Xik - Mik
Yi
∑ ∑∑
=
k kjkik
jkk
ik
ijEE
EECos
22*
*
13
The contribution of product k to the trade balance, in relation to GDP, is defined by:
fik = yik - gik * yi
where:
gik = Xik + Mik
Xi. + Mi.
yi. = 1000 * Xi. - Mi.k
Yi
AND
In addition, it is necessary to eliminate the influence of changes that are not specific to the country in question but result from the evolution of the importance of the product in world trade. In relation to a base year (r), the flows X and M in the other years (n) are adjusted by multiplying them all by:
eni = Wr
k : Wnk
Wr Wn The comparative advantage indicator f′ is therefore calculated using world weights for the base year (r). For this year, it is identical to the relative contribution f. For the other years (n), the difference is all the greater the more world trade in product k diverges from the average tendency for all merchandise.
Comparative advantages are calculated for individual products at the most detailed level of the CHELEM sectoral classification. The advantage by chain or by stage or production is then calculated by summing.
Source: www.cepii.fr (accessed 10 May 2007).
Appendix 2: Statistical sources
Foreign trade
Three types of foreign trade data are used in this paper: international databases, industrialized countries’ imports, and foreign direct investment.
International databases
We use the CHELEM IT database built by CEPII (Centre d’Etudes Prospectives et d’informations internationals, based in Paris).
CHELEM-IT brings together trade flows (goods), which are broken-down into 71 product categories. These trade figures are given in current US$ (millions), and are available from 1967. Trade statistics for flows between geographic zones (countries and country groups) are provided for each year, and for each product category, in a single, ‘harmonized’ matrix.
14
Industrialized countries’ imports
European Union (15): Eurostat, HS 2 Classification (http://epp.eurostat.ec.europa.eu, accessed in May 2007). USA: US International Trade Commission: CTCI 3 digit Classification (www.usitc.gouv, accessed in May 2007). Japan: Global Trade Atlas
(http://www.gtis.com/gta/, accessed in May 2007). Vietnam: General Statistical Office (GSO) China: Statistical Yearbook Foreign direct investment (Vietnam) Ministry of Planning and Investment: statistics on FDI (committed and disbursed), with breakdown by country origin of investors.
15
References
Ahearne, A., J. Fernald, P. Loungani, and J. Shindler (2006). Flying Geese or Sitting Ducks: China’s Impact on the Trading Fortunes of other Asian Countries. Board of Governors of the Federal Reserve System, International Finance Working Paper 887, December.
Akamatsu, K. (1962). ‘A Historical Pattern of Economic Growth in Developing Countries’. Developing Economies, 1: 3–25.
Amsden, A. (2001). The Rise of the Rest. Oxford: Oxford University Press.
Athukorala, P. (2004). Product Fragmentation and Trade Patterns in East Asia. Canberra: Research School of Pacific and Asian Studies: Australia National University.
Balassa, B. (1965). ‘Trade Liberalization and “Revealed” Comparative Advantage’. Manchester School of Economics and Social Studies, 33: 99–123.
Bhalla, S. (1998). Chinese Mercantilism: Currency Wars and How the East was Lost. ICRIER Paper 45, July. New Delhi: Indian Council for Research on International Economics.
Cao, X. D., and T. A.-D. Tran (2005). ‘Transition et ouverture économique au Vietnam : une différenciation sectorielle’. Economie Internationale, 104 (4): 28–43.
Chang, H. A. (2002). Kicking Away the Ladder: Development Strategy in Historical Perspective. London: Anthem Press.
Eichengreen, B. (2004). ‘The Impact of China on the Exports of Other Asian Countries’. NBER Working Paper 10768, September. Cambridge, MA: NBER.
Eichengreen, B. (2005). How China is Reorganizing the World Economy, Asia Economic Policy Panel.
Eichengreen, B., and H. Tong (2005). Is China’s FDI Coming at the Expense of Other Countries. NBER Working Paper 11335. Cambridge, MA: NBER.
Gaulier, G., F. Lemoine, and D. Unal-Kesenci D. (2005). China’s Integration in East Asia: Production Sharing, FDI and High-Tech Trade. Working Paper 2005-09, June. Paris: Centre d’Etudes Prospectives et d’Informations Internationales.
Gerschenkron, A. (1966). Economic Backwardnesss in Historical Perspective. Boston: Harvard University Press.
Humphrey, J., and H. Schmitz (2006). The Implication of China’s Growth on Other Asian Countries. Brighton: Institute of Development Studies.
IMF (2007). Regional Economic Outlook: Asia and Pacific, April. Washington, DC: IMF.
Ishida, M. (2005). Effectiveness and Challenges of Three Economic Corridors of the Greater Sub-region. Discussion Paper 35. Tokyo: Institute of Developing Economies.
16
Kwan, C. H. (2002). ‘The Rise of China and Asia’s Flying Geese Pattern of Economic Development: An Empirical Analysis based on US Import Statistics’. RIETI Discussion Paper 02 E 003. Tokyo: RIETI.
Lall, S., and M. Albaladejo (2004). ‘China’s Competitive Performance: A Threat to East Asian Manufactured Exports?’. World Development, 32(9): 1441–66.
Linnemann, H. (1966). An Econometric Study of International Trade Flows. Amsterdam: North-Holland.
Maddison, A. (n.d.) http://www.ggdc.net/maddison/
Mercerau, B. (2005). ‘FDI flows to Asia: Did the Dragon Crowd out the Tiger’, IMF Working Paper 05/189.
MINEFI (2006). ‘La strategie de la Banque Asiatique de Developpement dans la region du Mekong’, Fiche de synthese de la Mission economique du Ministere de l’Economie, des Finances et de l’Industrie. Manilla : Ambassade de France aux Philippines.
Nguyen, B. D., and T. A.-D. Tran (2007). ‘Insertion internationale et integration regionale: le Vietnam, doit-il craindre la concurrence chinoise?’, Mimeo. Paris : Universite Paris Nord.
Okita, S. (1985). ‘Special Presentation: Prospect of Pacific Economies’, Korea Development Institute, Pacific Cooperation: Issues and Opportunities, Report of the Fourth Pacific Economic Cooperation Conference, Seoul, Korea, 29 April–1 May: 18–29.
Ravenhill, J. (2006). ‘Is China an Economic Threat to Southeast Asia?’, Asian Survey, 46, September.
Tumbarello, P. (2006). ‘Does Vietnam Overtrade with Its Neighbouring Countries? A Regional Investigation using a Gravity Model’, IMF, selected issues.
Van Beers, C., and G. Biessen (1996). ‘Trade Possibilities and Structure of Foreign Trade: The Case of Hungary and Poland’. Comparative Economic Studies, 38 (2/3): 1–19.
Vo, T. T. (2005). ‘Vietnam’s Trade Liberalization and International Economic Integration; Evolution, Problems and Challenges’. ASEAN Economic Bulletin, 22 (1): 75–94.
World Bank (1993). The East Asian Miracle: Economic Growth and Public Policy. New York: Oxford University Press.
World Bank (2007). World Development Indicators. Washington, DC: World Bank.
17
Table 1: Cumulative amount of foreign investment projects in Vietnam (1988–2006)
Rank
Number
Investment (disbursed) Investment (committed)
Amount (US$ bn)
Share of total (%)
Amount (US$ bn)
Share of total (%)
Total 6761 25.4 100.0 57.3 100.0
1 Japan 724 4.8 18.9 7.1 12.3
2 Singapore 447 3.6 14.2 8.0 14.0
3 Taiwan 1547 2.9 11.4 8.0 14.0
4 Korea 1246 2.6 10.2 6.1 10.6
5 Hong Kong 375 2.1 8.3 4.6 8.0
Total top 5 4339 16.0 62.9 33.8 59.0
Source: Ministry of Planning and Investment.
Table 2: Five main revealed comparative advantages/disadvantages of Vietnam and China in
2004 (in 1/1000 of GDP)
Vietnam China
Comparative advantage Comparative advantage
1. Oil (crude) 104.5 1. Computers 27.8
2. Shoes and leather products 84.7 2. Manufactured products nec 19.7
3. Clothing 53.4 3. Shoes and leather products 19.1