THIS REPORT CONTAINS ASSESSMENTS OF COMMODITY AND TRADE ISSUES MADE BY USDA STAFF AND NOT NECESSARILY STATEMENTS OF OFFICIAL U.S. GOVERNMENT POLICY Date: GAIN Report Number: Approved By: Prepared By: Report Highlights: Post estimates Vietnam’s wheat imported volume for MY 2016/2017 at 4.5 million tons due to expected increase in the use of both milling and feed wheat. Corn imports are likely to decrease partly as wheat prices remain competitive. Rice production is forecast at 44.52 million tons of paddy rice due to improved weather conditions and sufficient rainfall. Quan Tran Gerald Smith 2017 Grain and Feed Annual Vietnam VM7016 4/13/2017 Required Report - public distribution
Transcript
THIS REPORT CONTAINS ASSESSMENTS OF COMMODITY AND TRADE ISSUES MADE BY
USDA STAFF AND NOT NECESSARILY STATEMENTS OF OFFICIAL U.S. GOVERNMENT
POLICY
Date:
GAIN Report Number:
Approved By:
Prepared By:
Report Highlights:
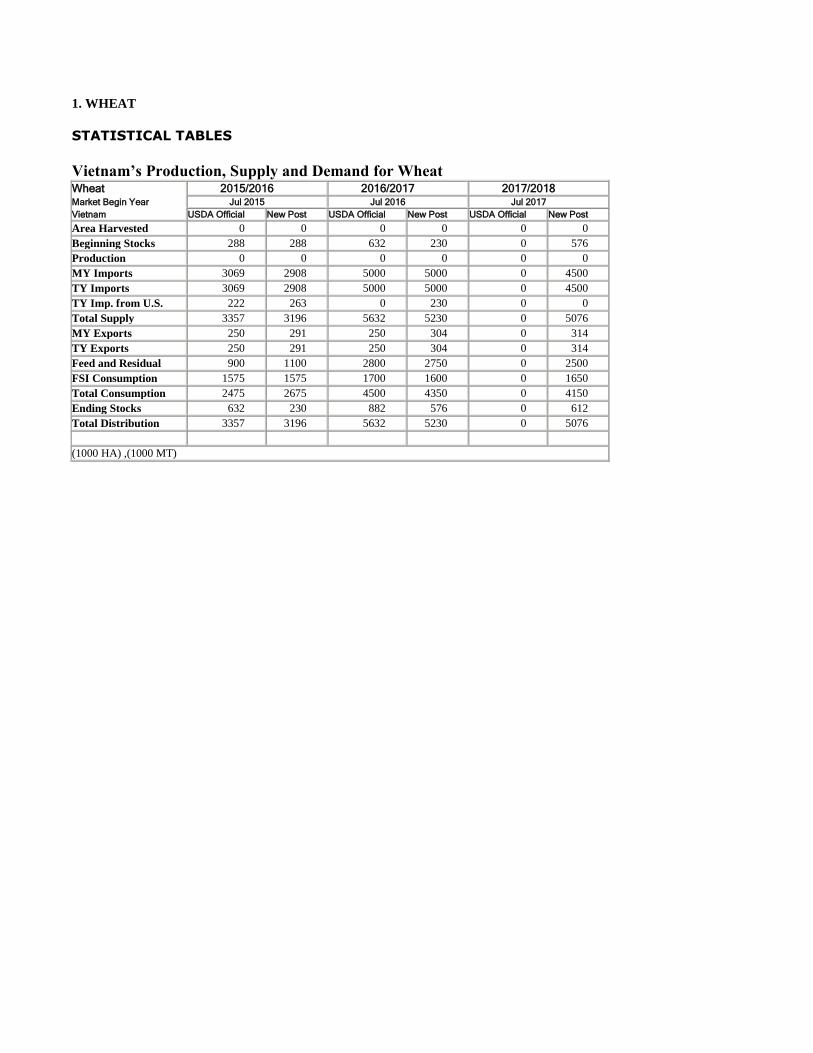
Post estimates Vietnam’s wheat imported volume for MY 2016/2017 at 4.5 million tons due to expected
increase in the use of both milling and feed wheat. Corn imports are likely to decrease partly as wheat
prices remain competitive. Rice production is forecast at 44.52 million tons of paddy rice due to
improved weather conditions and sufficient rainfall.
Quan Tran
Gerald Smith
2017
Grain and Feed Annual
Vietnam
VM7016
4/13/2017
Required Report - public distribution
SITUATION AND OUTLOOK
Vietnam is one of world’s top pork consumption countries and stands second in Asia, only after
China. The Vietnam hog industry is the key driver of local feed industry. The hog industry has
developed rapidly since the 1990s. The last two years, Vietnam sold a growing number of live hogs
through the border whenever the demand was very high in China.
Total 4,195 6.14 25,769 4,240 6.20 26,289 4,230 6.26 26,487
Source: MARD, Post estimate CONSUMPTION
Rice is the main staple food in Vietnam. Vietnam’s decline in per-capita rice consumption is
consistent with other countries in Asia. As the economy develops, consumers have greater
purchasing power and more access to other foods. As a result, per-capita consumption of rice
declines as income increases.
However, Vietnam’s growing population may help curb the declining trend in the country’s per capita
rice consumption. According to MARD, the most recent per capita rice consumption is about 136
kilograms. MARD uses the average per capita rice consumption to forecast rice supply and demand.
The amount of rice used for average per capita consumption has decreased because of the
availability of other food sources. The average per capita rice consumption per month in urban areas
is lower than that in the rural areas. Post estimates that the country needs each year an additional
150,000 tons to meet domestic consumption. Post’s per capita consumption is showing over 200 kilograms in the PSD table. Part of this is due to
residual volume, which is actually the unrecorded volume of border trade (about 2 million tons of
milled rice in MY 2015/2016 and expected same volume in MY 2016/2017 and MY 2017/2018).
Residual contributed to the high rise of paddy price in the early of MY 2016/2017.
Other factors contributing to Vietnam’s increased rice consumption include higher use of rice in
home-made animal and aquaculture-feeds, and growth in the food processing sector, especially in
the beer and rice wine industries.
Post estimates the use of rice for food processing at around 6 million tons a year with an additional
50,000-100,000 tons increase per year. In this sector, rice flour based food products such as
dumplings, noodles, rice papers, rice flour cakes, beer and local rice wine production use a large
volume of rice.
In the animal feed industry, commercial feed only meet around 60 percent of the total demand; the
remaining 40 percent is drawn from local sources of home-made feed. Rice is one of the main
ingredient sources of home-made feed for swine, fish, and poultry, especially in the MRD. Post
estimates the increased use of rice for animal feed industry at about 50,000-100,000 tons per year,
depending on the price competitiveness of rice compared with other alternative sources like corn
and cassava.
In total, the additional local rice consumption is a maximum of 500,000 tons per year.
STOCK
There is no official number of Vietnam rice stocks. Rice stocks are calculated from the total of rice
production, carry-over stock and import after deducting export and consumption and residual. Rice
carry-over stock in MY 2015/2016 was at about 1.46 million tons, due to smaller than expected
export volume.
Rice carry-over stocks in MY 2016/2017 and MY 2017/2018 are estimated to remain at around the
volume of over one million tons of milled rice - specifically, 1.42 million tons and 1.02 million tons
respectively, due to the GVN’s policy of limiting both official exports and on-going border trade
exports. According Post’s calculation, 1 million tons of milled rice could approximately feed
Vietnam’s 93 million-population for 28 days.
TRADE / COMPETITION
Domestic Prices
Domestic prices fluctuations depend on several factors: the availability of paddy harvested from
different crops during the year, export demand, and the overall carry-over stock/ending stock.
Generally, paddy prices drop to their lowest point two times a year: once at the peak harvest of the
Spring crop (during March-April) and the second drop occurs at peak harvest of the main Autumn
crop (during June-July). The harvest of the Spring paddy crop in the MRD started at the end of
January. Additionally, paddy prices also depend on the available stocks, especially carry-over
stocks at the end of the year.
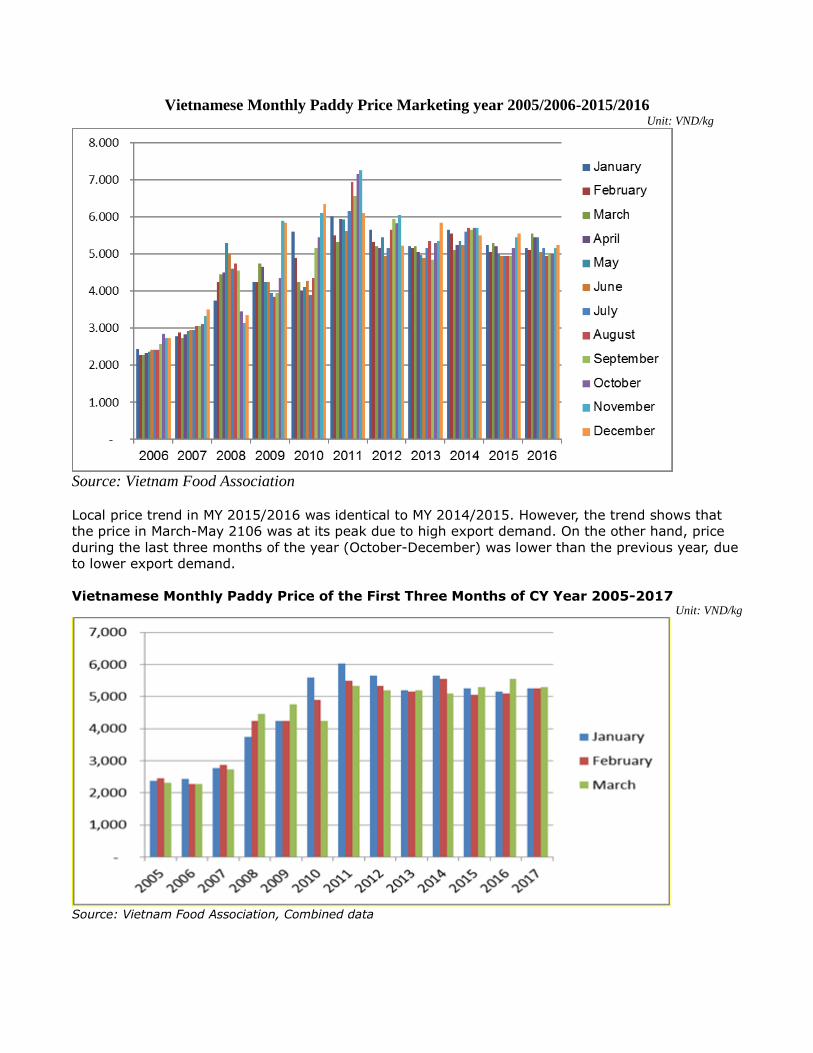
Vietnamese Monthly Paddy Price Marketing year 2005/2006-2015/2016 Unit: VND/kg
Source: Vietnam Food Association
Local price trend in MY 2015/2016 was identical to MY 2014/2015. However, the trend shows that
the price in March-May 2106 was at its peak due to high export demand. On the other hand, price
during the last three months of the year (October-December) was lower than the previous year, due
to lower export demand.
Vietnamese Monthly Paddy Price of the First Three Months of CY Year 2005-2017 Unit: VND/kg
Source: Vietnam Food Association, Combined data
The above table shows local paddy prices for the first 3 months of the year. Prices have been flat
for the first 3 months of 2017, which is distinct from other bumper harvest years. During past
years of bumper crops, prices have continuously dropped or increased as a result of high demand.
However, prices during the first 3 months of 2017 were flat at high levels in conjunction with the on-
going harvest in the MRD, continuing rice movement from the MRD to the North for the border trade
and weak demand from conventional export markets.
Exports
The Vietnam Food Association (VFA) maintains rice export registration requirements and the
Minimum Export Price (MEP) based on - Ordinance 109/2010/ND-CP, which regulates the flow and
prices for rice exports.
Commonly, prices were down about $20-30 per ton during the first 3 months of the year, over the
past years, due to the start of rice harvesting in the MRD. Export prices increased during the first
three months of MY 2015/2016 and MY 2016/2017, supported by buying demand from the
Philippines and the border trade.
According to Post’s statistic, the Vietnam MY 2015/2016 rice exports is estimated at 5.1 million tons,
compared to 6.6 million tons in the MY 2014/2015, due to lower paddy production, increased
competition from other rice exporting countries (mainly Thailand and India).
According to VFA, Vietnam MY 2015/2016 (January-December 2016) exports reached 4.89 million
tons, a FOB value worth of $2.13 billion, and CIF value at $2.19 billion.
Regarding official trade, Asia remained the biggest market for Vietnamese rice receiving
approximately 5.1 million tons in MY 2015/2016 compared with 5.17 million tons out of total 6.62
million tons of exported milled rice in the MY 2014/2015. Within Asia, China remained the top
importer of Vietnamese rice with 1.77 million tons in MY 2015/2016, compared to 2.16 million tons
of milled rice in MY 2014/2015. The Philippines’ imports dropped from its regular official import
volume of about 1.1-1.2 million tons to only 400,000 tons.
Vietnam’s exports of milled rice to Africa were 873,000 tons in MY 2015/2016, compared to 785,000
tons in the MY 2014/2015. The decrease was due to strong competition from India, Thailand and
Pakistan. 77 percent of Vietnam’s rice shipped to the African market was fragrant rice, which is
priced competitively over other sources.
In terms of quality (grade), despite the lowest export volume in three years (MY 2013/2014,
2014/2015, and 2015/2016), Vietnam shipped more high quality white rice (5 percent, glutinous,
and especially Jasmine). In particular, Jasmine rice volume accounting for more than 24 percent of
the total milled rice export recorded more than 1.26 million tons, compared to 1.2 million tons in MY
2014/2015, and nearly 1.1 million tons in MY 2013/2014. The increase reflects the government’s
goal of increasing rice exports, especially the export of high value Jasmine rice.
Vietnamese rice exports to the Chinese market is expected to remain strong in MY 2016/2017. In
late December 2016, Vietnam’s Plan Protection Department, Ministry of Agriculture and Rural
Development, announced that 22 rice exporters were approved by the Chinese General
Administration of Quality Supervision, Inspection and Quarantine (AQSIQ). Effective January 1,
2017, the 22 exporters can officially export rice into the Chinese market.
In MY 2016/2017, Vietnam is focusing on rice exports to the East European countries. The reason is
that the Vietnam-Eurasia Economic Union Free Trade Agreement (VN-EAEU FTA) went into effect on
October 5, 2016. As a result, Vietnam can export rice with preferential import duty into Russia,
Belarus, Kazakhstan, Armenia, and Kyrgyzstan.
According to the Vietnam Ministry of Industry and Trade (MOIT), the Rice Trade Agreement between Vietnam and the Philippines signed in 2010 has been officially extended to 2018. Consequently, Vietnam can supply up to 1.5 million tons of rice each year to the Philippines. Post put an initial estimate for Vietnam MY 2016/2017 rice export volume at 5.5 million tons and 6.0
million tons for MY 2017/2018 export forecast.
Vietnam Rice Export By Grade and Destination MY 2015/2016
5% 10% 15% 25% 100% Glutinou
s Jasmine
Unknow
n Total
ASIA
604,003
55,32
7
644,39
5
377,39
6
162,45
7
998,510
487,121 106,025
3,435,23
4
In which:
Indonesia
81,400
-
266,50
0
-
9,177
3,250
143
-
360,470
Philippines
54,243
880
-
328,27
0
4,000
12,570
1,000
-
400,963
Malaysia
64,138
7,383
101,852
1,500
260
37,552
50,154
6,228
269,067
Singapore
15,177
-
4,821
607
5,306
6,907
63,935
5,342
102,095
East Timor
2,700
-
103,70
0
-
-
72
2,796
-
109,268
Iraq
15,600
-
-
-
-
-
75
50
15,725
Iran
50
-
-
-
-
-
3
108
161
Syria
1,340
-
-
-
-
-
-
-
1,340
Yemen
125
-
-
-
-
-
-
-
125
South/North
Korea
5,351
-
-
-
1,000
17
168
10,014
16,550
Japan
125
-
150
-
-
-
234
154
663
Cambodia
-
-
-
-
-
-
-
122
122
Hongkong
17,521
338
4,200
3,585
193
982
64,093
5,413
96,325
UAE
51,705
-
-
23
-
108
38,003
30,412
120,251
Taiwan
2,086
1,898
-
-
-
18,313
3,745
4,259
30,301
Bahrain
172
-
-
-
-
29
863
206
1,270
Bangladesh
-
-
-
-
-
2
16
6
24
Saudi Arabia
5,541
-
-
-
-
80
11,892
1,816
19,329
China
258,161
29,07
8
163,17
2
42,536
141,72
4
915,578
199,709
24,547
1,774,50
5
Brunei
6,673
14,50
0
-
-
-
1,450
7,067
946
30,636
others*
21,895
1,250
-
875
797
1,600
43,225
16,402
86,044
AFRICA
143,471
-
19,576
2,546
490
369
680,186
25,881
872,519
In which:
Tanzania
3,500
-
-
-
-
-
11,558
-
15,058
Senegal
23
-
25
-
-
-
299
-
347
Angola
30,515
-
1,170
250
-
26
2,118
206
34,285
Rwanda
-
-
-
-
-
-
-
-
-
Ghana
19,275
-
-
250
390
-
473,157
-
493,072
Uganda
-
-
-
-
-
-
-
-
-
Ivory coast
49,636
-
-
-
-
-
138,556
-
188,192
Reunion
-
-
-
-
-
-
3,659
-
3,659
west africa
-
-
-
-
-
-
-
-
-
Mozambiq
775
-
-
-
-
265
31,159
-
32,199
Yemen
-
-
-
-
-
-
-
-
-
Kenya
-
-
-
-
-
-
126
50
176
Congo
50
-
-
-
-
-
733
-
783
Libya
1,000
-
-
-
-
-
44
300
1,344
Algeria
30,558
-
18,305
-
-
-
197
894
49,954
Benin
407
-
-
-
-
-
2,851
2,000
5,258
Burkina Faso
-
-
-
-
-
-
65
-
65
Cameroon
23
-
23
23
-
73
1,700
13
1,855
Gambia
-
-
-
-
-
-
69
-
69
Guinea
-
-
-
-
-
-
-
-
-
Guinea Bissau
-
-
-
-
-
-
46
-
46
Madagascar
-
-
-
1,500
-
-
-
-
1,500
Mali
-
-
-
-
-
-
-
-
-
Mauritania
-
-
-
-
-
-
-
-
-
Nigeria
-
-
-
-
-
-
939
23
962
Sierra Leone
52
-
-
-
-
-
177
-
229
Somali
-
-
-
-
-
-
-
-
-
South Africa
185
-
-
-
-
5
2,913
20,646
23,749
Togo
375
-
53
500
-
-
1,605
-
2,533
Zambia
-
-
-
-
-
- -
-
-
others*
7,097
-
-
23
100
-
8,215
1,749
17,184
EUROPE and CIS
47,448
3,972
3,130
2,600
265
7,330
50,604
18,103
133,452
In which: Russia
9,339
2,760
1,600
2,500
-
125
93
8,980
25,397
Ukraine
3,975
-
-
100
-
17
378
233
4,703
Poland
-
-
-
-
-
1
528
297
826
others*
34,134
1,212
1,530
-
265
7,187
49,605
8,593
102,526
AMERICAS
466,478
-
2,260
103
2,156
1,518
31,950
11,606
516,071
In which: Cuba
427,590
-
-
-
-
-
2
6
427,598
Brasil
390
-
-
-
-
38
48
1,127
1,603
Haiti
333
-
-
-
-
141
103
-
577
Mexico
500
-
2,000
-
-
-
-
-
2,500
Chile
550
-
260
-
-
-
-
1,550
2,360
Puerto Rico
-
-
-
-
-
-
-
-
-
others*
37,115
-
-
103
2,156
1,339
31,797
8,923
81,433
AUSTRALIA
40,569
417
3,400
250
2,076
508
11,547
72,936
131,703
In which:
Australia
3,600
142
-
-
1,984
368
4,086
4,813
14,993
New Caledonia
51
-
-
-
-
45
-
22
118
New Zealand
1,629
50
200
-
92
-
1,425
4,882
8,278
others*
35,289
225
3,200
250
-
95
6,036
63,219
108,314
UNKNOWN
-
TOTAL 1,301,96
9
59,71
6
672,76
1
382,89
5
167,44
4
1,008,23
5
1,261,40
8 234,551
5,088,97
9
* Others indicates that no clear destination is declared. It may/may not include the countries in the list of the same region
Source: Trade/Custom Office/VFA
Imports
Vietnam imports rice mostly from Cambodia, including a small volume of sticky rice from Laos. Most
of Cambodia’s shipments occur around the beginning of the calendar year, immediately after its
main crop is harvested. In Vietnam, imported paddy is used for local consumption after processing,
since most of the rice grown in the MRD is purely for export. Vietnamese farmers also have paddy
rice investments in Cambodia ensuring additional rice production, which is used mostly for local
consumption in Vietnam. In the absence of official data, Post estimates that MY 2016/2017 and MY 2017/2018 rice imports
from Cambodia is 300,000 tons, given the limited sources of rice from Cambodia.
POLICY
Government Purchase program
The Vietnam Food Association (VFA) is a state-owned enterprise (SOE) operating in the fields of
food producing, processing and trading. One of the VFA’s functions is to boost the country’s rice
production, under direction of the Prime Minister. VFA often operates programs instructing its
members to purchase rice for stockpiling one or two times per year in March and/or June- at the
peak of the Spring and Autumn harvests. This policy prevents local prices from dropping
significantly, thereby helping rice farmers to maintain higher profit margins. The purchase program
often goes together with the minimum purchase price or guaranteed purchase price.
The purchase price established by VFA is based on the calculation of estimated production cost,
provided by the Vietnam Ministry of Finance, of a specific seasonal crop plus a 30 percent profit
margin. The guaranteed purchase price for paddy rice has been VND5,000 per kilogram since MY
2010/2011. The guaranteed purchase price set for MY 2009/2010 Spring crop was VND4,000 per
kilogram, while MY 2008/2009 was set at VND3,500 per kilogram.
In January 2017, the VFA proposed a purchase program in March-April 2017 in order to prevent the
local rice price from crashing during peak harvest. Currently, there are no signs from the GVN
regarding support of local paddy price during January-March 2017 season in the MRD.