Page 1
Vietnam’s Accession to the WTO: Lessons from Past Trade
Agreements
PHILIP ABBOTT*
Purdue University, Indiana, USA
JEANET BENTZEN AND FINN TARP University of Copenhagen, Denmark
Summary. – This paper examines Vietnam’s experience with bilateral trade
agreements and compares subsequent outcomes with predictions from existing
computable general equilibrium (CGE) models. Those model based assessments
have greatly underestimated the impact of past agreements. Tariff reform is not
the main factor driving economic adjustments, and market imperfections mean
there is potential for greater output and trade expansion. The key questions to ask
in future research are what critical new institutional reforms WTO accession will
bring, and what incentives will be put in place to determine the evolution of
investment by sector.
Keywords – Trade liberalization, Bilateral trade agreements, WTO Accession, Vietnam
JEL classification: F13, F14, O24, O53
* We are grateful to colleagues at the Central Institute of Economic Management (CIEM), Hanoi,
Vietnam for comments. Financial support from Danida in supporting the research underlying this paper is
gratefully acknowledged. The usual caveats apply.
Page 2
2
1. INTRODUCTION
WTO accession by Vietnam on 11 January 2007 as the 150th member of this organization
culminates a long process of efforts to integrate the Vietnamese economy into international
markets. Since 1986, when the Doi Moi restructuring process began, Vietnam has negotiated a
series of bilateral trade agreements. Numerous market-oriented legal and economic reforms have
been introduced, and significant institutional changes have put the country on the path to become
a more open, socialist-oriented market economy. This was established as an overarching goal at
the Ninth Party Congress in April of 2001.
Among the more than 100 other trade agreements of varying scope,1 Vietnam signed a
bilateral agreement with the European Union (EU) in 1992. It joined ASEAN in 1995, and in
2000 entered into a bilateral trade agreement (BTA) with the U.S. Each time such a major
agreement was reached, Vietnam’s trade with that region expanded, and these trade agreements
were clearly an impetus to ongoing domestic economic reforms. They included reducing the role
of state owned enterprises (SOEs), revising commercial law, granting greater access of foreign
firms to the domestic economy and establishing new regulations to facilitate international trade.
Negotiations to join the WTO began in 1995 and eventually involved 20 separately
negotiated bilateral agreements with WTO member countries. These agreements went beyond
previously established trade agreements with those same countries and set the terms for
Vietnam’s accession. The final accession agreement was negotiated in 2006 with a working party
including 63 countries. Overall, Vietnam’s WTO membership has been predicated on the
implementation of institutional reforms negotiated in earlier bilateral trade agreements, with
special focus on completing legal reforms and pursuing institutional changes.
The liberal reforms undertaken by Vietnam have been associated with rapid economic
growth, increasing international trade and impressive poverty reduction. GDP per capita
measured in constant purchasing power parity (PPP) corrected (2000) dollars increased almost
threefold from $1,097 in 1989 to $2,739 in 2005 (World Bank, 2006). Figure 1 presents this
exceptional growth performance and accompanying expansion of trade (imports plus exports), to
140% of GDP in 2004, along with data on significant reduction in poverty. According to the
World Development Indicators (World Bank, 2006), headcount poverty (at the $1 per capita per
day threshold) had already fallen to below 15% in 1993 and was only 2% in 2002. Vietnam’s
own poverty criterion set the poverty rate at 58% in 1993 and slightly below 29% in 2002, with a
Page 3
3
food poverty measure of 24% in 1993 and 11% in 2002 (Thang, 2004). From this economic
performance Vietnam would seem to be a particularly illuminating case in which to study the
linkages between international trade liberalization, economic development, and poverty
reduction.
[Figure 1 about here]
The policy dialogue by both foreigners and Vietnamese has often evaluated the ongoing
reform process in much harsher terms than the impressive economic performance would seem to
warrant.2 Critiques of Vietnamese policy continue to highlight such factors as the need for
deeper institutional reform and persistently high tariffs for clothing and agricultural
commodities. This is so even if Vietnamese tariffs are low by developing country standards.
Tariffs averaged only 16% in 2000 (STAR-Vietnam, 2002), well before WTO accession and
associated commitments were even remotely in sight. Numerous studies of the likely impacts of
bilateral trade agreements and WTO accession have called for further reform to spur trade and
development.3 Yet, those same studies fail to demonstrate the causal mechanisms underlying the
successes of earlier trade agreements. Much of the critique is informed by the basic theory
underlying trade models, but existing economy wide computable general equilibrium (CGE)
models have not been very helpful to policy makers. This is so both with regard to estimated
aggregate levels of economic variables and in the details of how growth and trade evolve.
Simulated changes are often small relative to both prior performance and to actual changes
following past trade agreements.
We believe there is a contradiction between Vietnam’s socioeconomic performance and
the critiques of policy which have emanated from model based evaluations of the Vietnamese
trade regime. The models have, as we see it, overemphasized tariff changes as the key element of
reform and have failed to integrate satisfactorily the potential impact of institutional changes. It
is not uncommon for authors of economy wide impact studies to acknowledge the ongoing
debate in Vietnam over legal reforms, the role of SOEs, access by foreign firms, and the
importance of “services trade” – banking, insurance, financial markets, wholesale and retail
trade, and telecommunications. Subsequent formal modeling exercises have almost exclusively
limited the analysis to tariff changes, however, probably because these other reforms are indeed
Page 4
4
hard to capture. One study which did try to address these changes was only able to model the
pro-competitive effects of service trade reforms, and concluded that impacts of the reforms
negotiated in the Vietnam WTO accession agreement would be trivial in comparison to recent
economic performance (Dee et al., 2005). Arguably, the performance following past bilateral
trade agreements paints a very different picture of both the success of past reforms and the likely
impact of WTO accession than modeling efforts have so far been able to unravel.
In this paper we examine Vietnam’s past experience with economic integration as a basis
for predicting the economic impact of WTO accession, and we ask whether WTO accession will
further economic growth and poverty reduction. Our expectations, based on historical
experience, are that impacts are likely to be much greater than existing formal modeling
exercises indicate. Several lessons of relevance to developing countries more generally can be
drawn from this analysis, and we suggest that a distinctly different analytical path to the
evaluation of trade agreement impacts than has so far been pursued at both national and
international level is long overdue. Whatever path is followed, it must better address institutional
reforms and services trade issues. The same goes for the key roles played by unemployment and
international capital flows as well as productivity growth in determining consequences of
economic integration. The key questions which should be addressed up-front, instead of asking
about tariff revisions, are: (i) What are the critical new institutional reforms WTO accession will
bring about that go beyond the significant steps already taken under the various bilateral trade
agreements?; and (ii) What are the likely impacts of these implementation steps in light of
historical experience, and through what mechanisms do they work? We hypothesize that the
mechanisms through which WTO accession will influence economic development are most
likely to work through incentives to investment.
In the next section of this paper further detail on Vietnam’s trade policy history is
examined. We present a timeline of economic and legal reforms, pinpoint when major bilateral
trade agreements were reached, and examine the trade performance following those changes.
Then we review in Section 3 existing model based assessments of both WTO accession and
bilateral trade agreement impacts, comparing predictions to actual outcomes. This is followed in
Section 4 by an identification of the key features of those models which limit their ability to
predict and indication of the directions future research on quantitative assessment of trade
liberalization need to take. Section 5 concludes.
Page 5
5
2. VIETNAM’S ECONOMIC HISTORY – POLICY AND TRADE
Figure 1 has already shown the remarkable economic performance of Vietnam following
the Doi Moi (renovation) reforms in 1986. Since then GDP has grown steadily at an average of
7.6% per year. Growth accelerated to 9.8% a year from the early 1990s until 1998, but then
stalled at 7.0% per year following the Asian financial crisis, before increasing again to 7.7% per
year from 2002 to 2004. This rapid economic growth has been accompanied by an extraordinary
increase in trade (imports plus exports) over this same period, from 23% in 1986 to 97% already
in 1998 and 140% in 2004. Growth in exports has been especially impressive, from only 6.6% of
GDP in 1986 to 44.8% in 1998 and 66.4% in 2004. Moreover, the share of exports in GDP has
been rising somewhat faster than imports. In 1983 trade was more than two-thirds imports,
whereas in 2004 exports are nearly half of the trade share of GDP. Imports continue to exceed
exports as capital flows into Vietnam, but foreign direct investment (FDI) has been erratic and
strongly affected by the Asian financial crisis. There was no measurable FDI in 1986; FDI grew
to 7.7% of GDP by 1993, stagnated at below that level, equaling only 6.1% in 1998 and falling
thereafter to less than 4% of GDP since 2002. Figure 1 shows that this erratic FDI inflow has had
no discernable effect on past GDP growth, however, while the extent to which increasing GDP
has been associated with reduced poverty by any measure is also clear.
Performance has been less impressive for employment expansion. According to
Yoko,Winters and Dutta (2003) employment has only increased from 2 to 3% since 1990.
Unemployment remains at about 6.9% in urban areas and underemployment persists in rural
areas. Nevertheless, real wages have increased 36-38% over this same period, with minimum
wage increases and higher wages paid by foreign enterprises accounting for wage growth.
Questions these data raise are whether the trade performance has followed or led
economic growth, and whether trade policy and specifically trade agreements have played a
significant role in explaining Vietnam’s development success. While this short time series,
serious identification difficulties, and likely measurement errors in some of this data preclude
direct econometric testing of the direction of these effects, we believe much can be learned from
looking at the timing of reforms and corresponding bilateral trade flows. Trade performance, and
particularly export success, has been region (destination) specific, and has followed successful
negotiations of bilateral and regional trade agreements.
Page 6
6
Figure 2 presents a timeline of significant changes in Vietnam’s trade and related
domestic policies associated with increased international integration. The process of reforming
Vietnam’s trading institutions and engaging in agreements with potential trade partners has been
continuous if not smooth, so it is difficult to set precise dates with reforms that would
significantly influence trade trends. 4 Specific dates for changes in bilateral export flows are more
evident. Two types of events are highlighted in the timeline – key bilateral trade agreements and
ongoing trade related legal reforms.
[Figure 2 about here]
Legal reforms have been instituted as part of the ongoing renovation process, in response
to negotiations both of bilateral agreements and as part of the WTO accession process. The first
significant changes at the border involved introduction of import tariffs in 1988, elimination of
the state monopoly over international trade in 1989, and establishment of export processing
zones in 1990. While additional reforms were undertaken in the 1990s, a substantial new impetus
to legal reform began following the U.S. bilateral trade agreement (BTA) signed in 2000. Since
then Vietnam has rewritten its commercial code almost entirely, with significant new Enterprise,
Competition, and Investment Laws all introduced. The final negotiations for Vietnam’s WTO
accession were enabled by significant additional legal reforms undertaken particularly in 2005 as
the U.S. and other WTO members insisted that Vietnam implement reforms before accession
would be granted. These legal reforms have gone a long way to establish property rights and
contract sanctity and to create a court system where business related legal issues can be
addressed. This has made it easier for foreign firms to do business in Vietnam, and as an external
benefit it is now also easier for Vietnamese firms to do business. WTO accession will insure
multilateral application of the reforms negotiated with each region individually.
The timeline in Figure 2 also shows some of the key bilateral agreements negotiated by
Vietnam. Yoko,Winters and Dutta (2003) notes that by 2000 Vietnam had negotiated 129 either
bilateral trade agreements (57) or MFN tariff agreements (72). The first major agreement was
with the EU in 1992. Vietnam also joined ASEAN in 1995, the same year that WTO accession
talks formally began. Vietnam then joined APEC in 1998 and implementation of tariff reductions
under CEPT/AFTA began in 2001. Agreements under ASEAN auspices with China and Japan
Page 7
7
followed in 2002 and 2003, and implementation of the BTA with the U.S. got underway in 2002.
Bilateral agreements on WTO accession were reached with WTO members, including countries
with which Vietnam had previously negotiated bilateral trade agreements. For example, Vietnam
concluded its accession agreement with the EU in 2004 and all accession agreements were
completed in 2006, including a new agreement with the U.S. specifically to allow Vietnam to
join the WTO.
It has been argued in the literature that many of the earlier bilateral agreements probably
had little impact on Vietnam’s trade and economic performance, since they were with similar
countries, suggesting little basis for Vietnam to realize comparative advantage. Moreover, tariff
reductions were typically small and occurring over long, delayed implementation periods
(Fukase and Martin, 1999b). Yet, each agreement also altered institutional arrangements between
Vietnam and its potential trading partners, and data on bilateral trade flows paints a different
picture of the effectiveness of these early trade agreements. Figure 3 shows exports since 1986
from Vietnam to ASEAN countries (as of 1995), with the year Vietnam joined ASEAN (i.e.
1995) noted by a horizontal line. Figure 4 then shows exports from Vietnam to the EU, the U.S.,
China, Japan and South Korea, with the years of the EU and U.S. bilateral agreements
highlighted. In each case trade takes off with a region once bilateral trade agreements have been
reached.
[Figure 3 about here]
[Figure 4 about here]
Figure 3 illustrates that well before tariff reductions occurred in 2001 under
CEPT/AFTA, trade with ASEAN partners increased significantly. Trade with Vietnam’s most
important ASEAN partner, Singapore actually began increasing in 1994, just prior to Vietnam’s
entry into ASEAN. Trade with other ASEAN partners started to grow in the mid to late nineties,
with obvious limits due to the Asian financial crisis, and with resurgence to Singapore and
several other ASEAN partners after 2000. Since 1999, exports to Singapore, Thailand and the
Philippines, now Vietnam’s most important ASEAN export destinations, increased at least four-
fold, well beyond any model predictions of exports to these countries. Exports to Singapore
reached $1.8 billion in 2004, with exports to Thailand and the Philippines nearing $1 billion and
Page 8
8
to Malaysia reaching $600 million. It should be noted that exports to these destinations did not
fall as exports surged to the U.S. following the BTA.
Figure 4 shows that trade between the EU and Vietnam increased rapidly from a very low
level immediately following the 1992 bilateral agreement. Exports grew rapidly again from $4.5
billion in 2002 to $7 billion in 2004, at the same time the U.S. BTA went into effect, and when
the EU completed its WTO accession negotiations with Vietnam. Vietnam exported essentially
nothing to the U.S. until the mid 1990s and just prior to implementation of the BTA in 2002 had
exported at most $1 billion per year. Those exports increased to over $6.5 billion in 2005,
making the U.S. Vietnam’s second most important export destination. Exports to Japan started
earlier than to most of these other destinations, and yet showed another significant increase
following the ASEAN-Japan agreement in 2002, going from about $2.5 billion and then to $4
billion in 2004. Trade with China did not grow to significant levels until 2000, reaching $1
billion, and then more than doubled to $2.5 billion in 2004. Again it is noteworthy that during
periods where there were significant bilateral negotiations and institutional reforms, particularly
after 2001, rapid increases in exports occurred to nearly all destinations.
A common result seen in these data is that as new agreements are reached, trade to that
destination increases, often dramatically. These increases apparently do not come at the expense
of exports to other destinations. There is little evidence that export surges to one region diminish
exports elsewhere. Region specific exports are never seen to fall, except for a few instances
explained by economic problems of partners in 1998 as a result of the Asian financial crisis. It is
also generally the case that trade was initially at very low levels, and increased by orders of
magnitude, posing problems for our standard analytical methods.
Table 1 shows the mix of goods Vietnam has been exporting and importing as of 2003.
About a fifth of Vietnam’s exports are of food and live animals, with fish, crustaceans, and
mollusks accounting for over half of the exports in this category, and cereals, vegetables, fruits,
and coffee also contributing significant exports. Petroleum accounts for an additional 20% and
labor intensive manufactured goods represent about a third of Vietnam’s exports. Almost half of
those manufactured goods exports are clothing while furniture and footwear are also a large
fraction. Vietnam’s imports have complemented those exports, including mostly either
intermediate inputs (fertilizer, plastics, leather, textiles, iron and steel) or capital goods
(machinery and transport equipment). Some have raised concerns as to the highly specialized
Page 9
9
nature of Vietnam’s exports and its dependence on only a few labor intensive sectors for its
growth (Roland-Holst et al., 2002). Concerns have also been voiced that some labor intensive
industries (e.g. electronics) have not grown as fast as clothing. Consumer goods have been only a
small part of Vietnamese imports.
[Table 1 about here]
In light of the highly specialized nature of Vietnam’s exports, and given concerns to be
raised later on modeling predictions of Vietnam’s trade, we look in Table 2 at Vietnam’s
bilateral trade by commodity at a level of disaggregation corresponding to three digit SITC
commodities. For each of the key regions with whom bilateral trade agreements have been
reached we report the extent of specialization and the number of three digit commodities traded
in years before and after trade agreements were reached as well as in the most recent year for
which detailed data was available, 2004. In the case of exports to the EU, in 1990 prior to the
bilateral agreement the top five commodities accounted for 60.8% of exports and the top 20 for
89%. After the agreement in 1996, similar specialization remained in spite of an increase in trade
levels by a factor of 24, from $74 million to $1.8 billion. But the number of three digit
commodities exported doubled from 93 to 185. Exports to the EU quadrupled again to $6.9
billion in 2004, and the top 20 commodities still accounted for 88% of exports, while the number
of three digit commodities exported increased to 203. In the case of exports to the US, prior to
the BTA the top 20 commodities accounted for 98.5% of $342 million in exports in 1996 and
97.2% of $885 million in exports in 2000. But in 2004, the number of commodities exported had
increased from 108 to 138, and exports had increased 7.5 times, to $6.6 billion. The U.S. has
remained a relatively specialized destination, as the top 20 commodities accounted for 94.4% of
imports in 2004. Singapore and China present similar stories. While substantial growth in
exports following trade agreements (ASEAN entry) are found, the top five commodities account
for around 80% of exports and the top 20 for over 90%. The number of three digit commodities
exported increased, substantially so in China’s case, reaching 171 to China and 182 to Singapore,
more than to the U.S. but less than to the EU.
[Table 2 about here]
Page 10
10
The data describing Vietnam’s economic and trade experience following the opening of
its markets and more specifically following its major trade agreements tells a compelling story
about the correlation between institutional reforms, trade performance and economic growth.
Typically, most critical tariff reductions are delayed in these agreements, and yet trade has taken
off with a region, sometimes even before those reductions go in force.
The lessons which seem to emerge are that bilateral trade agreements in the past have
generated new trade flows well beyond the levels likely to follow from modest tariff reductions.
So based on history, it is reasonable to expect that WTO accession will continue to reinforce
Vietnam’s trade based growth trajectory. Trade patterns that emerged in the past have been
somewhat specialized, but emergence of new traded products has been a key feature of
successful agreements. In addition, it was difficult to see competition for resources resulting in
gains from trade from an agreement reached with a specific partner coming at the expense of
trade with other partners. Often as major new bilateral agreements were arrived at, trade flows to
other destinations expanded as well. Model results compared to these actual outcomes will
highlight the importance of widely applied institutional reforms and bring us to raise questions as
to which constraints actually limited Vietnam’s trade and economic expansion.
WTO accession in early 2007 is the next step in this process of legal and economic
reform. Multilateral negotiations began in 1995 with establishment of a working party composed
of 63 WTO member countries. Separate bilateral agreements concerning Vietnam’s WTO
accession have been reached with a total of 20 countries, including the U.S., EU China, Japan,
India, Korea and Australia. WTO accession will insure multilateral application of the reforms
negotiated with each region individually – both tariff reductions and institutional reforms.
Vietnamese officials and observers of these negotiations have argued that concessions required
of Vietnam have gone well beyond existing member practices and requirements in other recent
accession agreements (e.g. China’s accession to the WTO), dubbing these requirements as
“WTO-Plus”. In particular, agricultural reforms have gone beyond the requirements of the
Uruguay Round Agreement on Agriculture, and the scope of bilateral negotiations has gone well
beyond tariff reductions and includes concessions on public subsidies, further legal reform,
services trade, state trading enterprises, and Vietnam’s status as a non-market economy.5 In
Page 11
11
predicting effects of this agreement, account must be taken of these substantial institutional
reforms which continue the process ongoing since 1986.
In debate in Vietnam on potential impacts, discussion quickly moves from tariff
commitments to finance and insurance, telecommunications, wholesale and retail trade, and
energy, where foreign firm operation in Vietnam rather than cross border trade is the focus of the
debate. We believe the critical questions that need answers to assess the likely impacts of WTO
accession are whether the continuing legal reforms take Vietnam significantly beyond changes
already made, and what effects on investment and productivity greater presence of foreign firms
may bring. Vietnam’s tariffs were low when negotiations began, and only small further
reductions have been taken, though there may be some key sectors where foreign interests have
gained increased market access. We contrast below the most important changes which are
emerging from these negotiations and the changes which are the focus of modeling efforts as
background for a discussion of the consequences of increased international economic integration.
3. MODELING VIETNAM’S TRADE AGREEMENTS
A number of modeling exercises have attempted to quantify the impacts of both bilateral
trade agreements and Vietnam’s accession to the WTO. Rama and Sa (2005) have carefully
reviewed 26 such studies, including a study establishing an underlying database for modeling.
We subsequently found another four studies which have addressed the likely economic impacts
of trade liberalization in Vietnam. Several of the studies examined by Rama and Sa were partial
equilibrium evaluations of likely WTO impacts on key sectors – rice, sugar, maize, livestock,
textiles, and clothing. Sixteen of the 29 impact studies, however, utilized computable general
equilibrium (CGE) models and provided quantitative predictions of the economy-wide impacts
of trade policy reform.
Specifications of the CGE models used to investigate trade liberalization by Vietnam
mostly follow either the GTAP model (Hertel and Tsigas, 1997) or the World Bank’s Linkage
model (van der Mensbrugghe, 2005). Such models capture economy-wide relationships among
the different sectors, factor markets, households and government, allocating scarce capital and
labor to the most productive uses as dictated by incentives influenced by tariffs. Most assume
perfectly competitive, efficient markets. None of these studies allowed for scale economies.
Sectoral aggregation varied somewhat, with few studies utilizing the detail of the existing 100
Page 12
12
plus sector IO table, and most limiting analysis to under 20 aggregate sectors. Minor
modifications to those very similar specifications have not incorporated the recent additions to
the Linkage model to allow dynamic simulations, focusing rather on static long run outcomes.
The length of that long run period is not specified, an issue in evaluating results against actual
performance, but we assume that a ten year time horizon is relevant, and the projected impacts
are a one time change in any case, not an increase in growth rates.
Base data for those models typically come from the official 1996 Vietnam IO table, with
a SAM either updated using 1997 macroeconomic information as in the GTAP based models
(Hertel, 1997), or in a few cases using more current SAMs (see Tarp et al. 2001, 2002 and
Jensen et al., 2004). All are based on the Vietnam Living Standards Surveys, done in 1992/93 or
1997/98. Thus, base data differ little from one model to another.
Following academic tradition, each study tends to focus on one aspect of the model, with
most emphasis placed on characterizing model related policy reforms. Differences in
assumptions on likely tariff reductions account for much of the differences found in results.
Issues beyond tariff reduction were also addressed. For example, Ianchovichina (2003) modifies
tariff data to account for duty drawbacks on re-exported intermediate imports. Huong and
Vanzetti (2006) consider simulations which permit unemployment. Roland-Holst et al. (2002)
examine complementary domestic reform which they posit brings substantial productivity gains.
Dee et al. (2005) explicitly includes pro-competitive effects of service sector reform, and is the
one study allowing for imperfect competition. Several studies address poverty reduction by
disaggregating households. And several studies examine replacement taxation strategies to cope
with lost tariff revenue, which has accounted for over one-third of Vietnam’s government
revenue recently. But each study characterizes their results as a quantitative prediction of the
likely impact of either WTO accession or earlier bilateral trade agreement adoption.
The general contention of the CGE studies is that Vietnam’s trade regime misallocates
resources. Tariff reductions will free resources now going to protected industries, and so
generate greater gains from trade and expansion of export industries, so increasing GDP. But
these effects are typically small, especially on aggregate economic activity. Table 3 summarizes
results for 30 scenarios from seven studies which recently explicitly examined WTO accession
by Vietnam. Maximum GDP increases, due to the gains from trade, were less than 3.3% until
two studies after 2005 got somewhat larger impacts. Huong and Vanzetti (2006) realize a 15
Page 13
13
percent increase in GDP when labor constraints are relaxed to account for unemployment, but
their prediction is in the range of other studies when employment is constrained. Dimaranan et
al. (2005) realize in one scenario a 7.88% increase in total output, about one year’s growth, but
in a scenario which did not take duty drawbacks into account. Taking those into account reduces
their predicted impact by 70%. Nguyen and Ezaki (2005) argue that they expect liberalization to
increase household consumption and reduce poverty, but their trade WTO accession/ multi-
lateral liberalization scenarios actually show declines in GDP.
[Table 3 about here]
Rama and Sa (2006) observe that these models may be manipulated to obtain desired
results, as most changes are the result of exogenous assumptions of the authors, who have great
freedom in setting scenarios. In our review we found GDP impacts tended to grow in later
studies, supporting this concern. But these are quite small impacts on long run GDP, relative to
the observed average 7.5% per annum growth rate that would have increased GDP 106% over
ten years. This suggests that serious constraints in this framework limit its ability to capture the
rapid growth of the Vietnamese economy, over which study authors have little control.
Trade impacts from the predictions of these models in Table 3 are somewhat larger than
are GDP impacts, with studies typically showing 10 to 20 percent increases in exports over the
long run. Actual exports increased more than 100% from 1993 to 2002, and grew even faster
afterwards. Once again, the one instance in which large trade growth is predicted is for the
unemployment scenario of Huong and Vanzetti (2006). Also, later studies found somewhat
larger trade impacts within the above range.
The other key findings of these studies concerned poverty impacts, and the consequences
of changes in taxation regimes to make up for lost tariff revenue. Not surprisingly, low GDP
impacts make poverty predictions from trade liberalization inconclusive. Even the direction of
the effect of trade liberalization on poverty varied among these studies, as did the GDP impact
direction. Especially in cases where trade liberalization could lead to a decline in GDP, the
effects of consumption goods for the poor (e.g. food) becoming more expensive are more likely
to dominate. Authors’ predictions on poverty were conditional on their fiscal policy adjustments,
which had at least as large an impact on GDP as did tariff reductions. Thus, losses from tax
Page 14
14
changes could overwhelm the gains from trade, leading to the scenarios where GDP fell. These
results are consistent with the findings on poverty impacts of trade liberalization of Hertel and
Winters (2005), where proper modeling of microeconomic distortions is the key to getting
appropriate impacts on poverty, and the effects of those distortions dominate tariff effects.
Comparisons of results from studies projecting impacts of bilateral agreements to actual
outcomes are more direct because those agreements have been in force for several years, so
relevant time periods exist over which observed trade and modeling results can be compared.
Two studies done at the World Bank looked at impacts of Vietnam’s relationship with ASEAN
(Fukase and Martin, 1999b) and at the U.S. Bilateral trade agreement (Fukase and Martin,
1999a). In the case of the U.S. BTA, sectoral impacts for the successful sectors are also
examined. Those studies were also done much earlier, and so anticipated lower impacts in line
with typical outcomes from this type of study.
In Table 4 we compare predicted changes from the study examining trade with ASEAN
partners after 1996, when Vietnam joined ASEAN.6 Fukase and Martin (1999b), the authors of
that study, had anticipated little impact because tariff changes under CEPT/AFTA would be
small and delayed over a long implementation period, and there was little scope for comparative
advantage among the similar countries of the region. Their long run predictions in Table 4 seem
larger than this analysis suggests, but those changes were from a very low base level of trade. In
the eight years from 1996 to 2004, their prediction underestimated actual increases in exports
from Vietnam to Indonesia by a factor of four, and to Malaysia and Thailand by a factor of six.
In the one case where they expected a large increase, the Philippines, actual exports fell from
1996 to 2000 and then increased to nearly the predicted level by 2004. In the case of Singapore,
Vietnam’s largest ASEAN partner, their export prediction was a 0.4% increase, yet actual
exports increased over 200%. As we saw earlier in Figure 3, exports to ASEAN partners
accelerated after Vietnam’s entry into that association. While the model failed to capture
observed export increases, we would argue that this failure was foreordained by the structure of
that model, which prevents trade flows increasing much from small initial levels.
[Table 4 about here]
Page 15
15
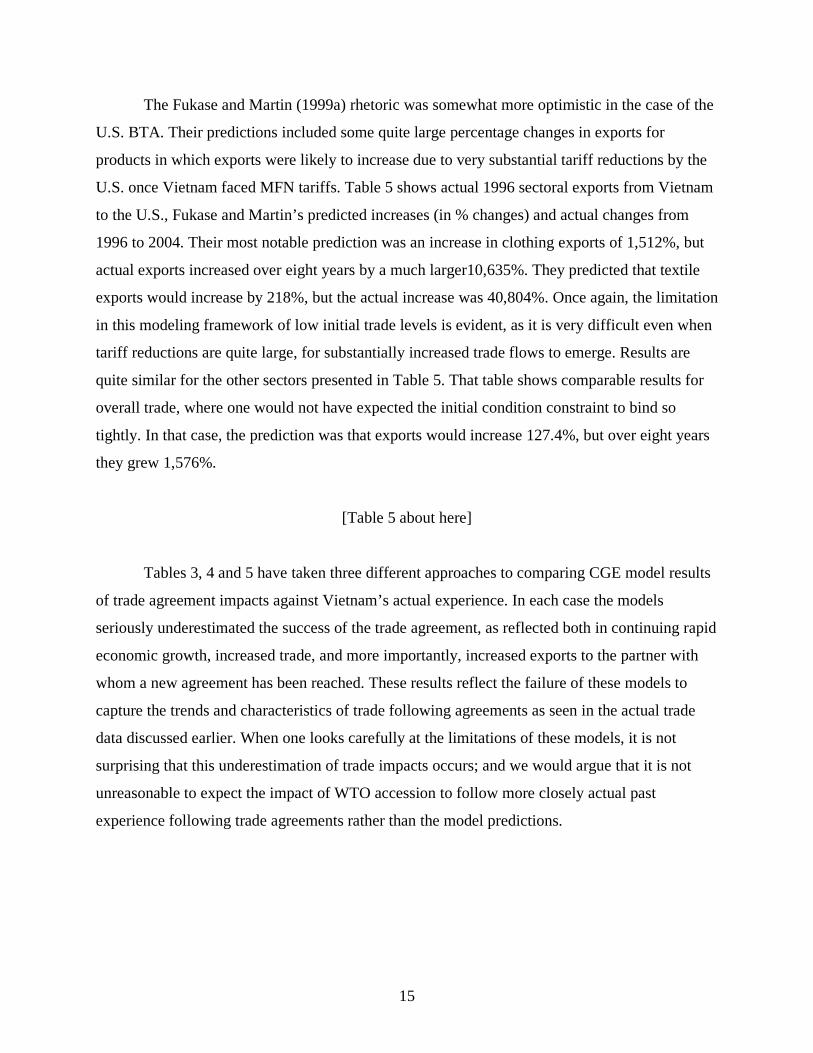
The Fukase and Martin (1999a) rhetoric was somewhat more optimistic in the case of the
U.S. BTA. Their predictions included some quite large percentage changes in exports for
products in which exports were likely to increase due to very substantial tariff reductions by the
U.S. once Vietnam faced MFN tariffs. Table 5 shows actual 1996 sectoral exports from Vietnam
to the U.S., Fukase and Martin’s predicted increases (in % changes) and actual changes from
1996 to 2004. Their most notable prediction was an increase in clothing exports of 1,512%, but
actual exports increased over eight years by a much larger10,635%. They predicted that textile
exports would increase by 218%, but the actual increase was 40,804%. Once again, the limitation
in this modeling framework of low initial trade levels is evident, as it is very difficult even when
tariff reductions are quite large, for substantially increased trade flows to emerge. Results are
quite similar for the other sectors presented in Table 5. That table shows comparable results for
overall trade, where one would not have expected the initial condition constraint to bind so
tightly. In that case, the prediction was that exports would increase 127.4%, but over eight years
they grew 1,576%.
[Table 5 about here]
Tables 3, 4 and 5 have taken three different approaches to comparing CGE model results
of trade agreement impacts against Vietnam’s actual experience. In each case the models
seriously underestimated the success of the trade agreement, as reflected both in continuing rapid
economic growth, increased trade, and more importantly, increased exports to the partner with
whom a new agreement has been reached. These results reflect the failure of these models to
capture the trends and characteristics of trade following agreements as seen in the actual trade
data discussed earlier. When one looks carefully at the limitations of these models, it is not
surprising that this underestimation of trade impacts occurs; and we would argue that it is not
unreasonable to expect the impact of WTO accession to follow more closely actual past
experience following trade agreements rather than the model predictions.
Page 16
16
4. MODEL LIMITATIONS
Several limitations of the CGE methodology typically employed to predict outcomes
from Vietnam’s past and future trade agreements are well known. For example, most models
predict (only) static and long run one time reallocations of resources as a consequence of price
adjustments following tariff changes (Rodrik and Rodriguez, 1999). Hence, the effects of trade
agreements do not influence the path of development. While dynamic specifications are at the
frontier of CGE modeling (e.g. van der Mensbrugghe, 2005), none of the studies reviewed in the
background survey underlying the present paper were dynamic. That literature is still wrestling
with short run macroeconomic closure issues and inability to predict the evolution of capital
stock over time. Moreover, the underlying assumption that capital will reallocate to the sectors
yielding highest returns, the presumption of long run static models, has not served well in
predicting short to medium run investment allocations (Ianchovichina et al., 2000). In our view,
models will need to do a better job of explaining short to medium run sectoral capacity evolution
before they can be expected to adequately address development implications of trade
liberalization.
In dynamic CGE models as well as in static models, macroeconomic performance
including economic growth is assumed (not endogenously predicted) based on an external
forecast. So the only mechanism by which trade can affect GDP is via gains from trade generated
by resource reallocations. It is also well understood that the Harberger triangles of net surplus
gains from tariff changes can be quite small. This is why results from CGE models of WTO trade
liberalization impacts have generally been found to be small relative to the size of economies
examined (Ackerman, 2005).
In the mid 1990s, the notion emerged that “dynamic gains” from trade liberalization were
necessary to identify large impacts. The two key concepts put forward then were the pro-
competitive effects of trade liberalization and productivity gains resulting from greater openness
(USITC, 1997). These changes are “dynamic” only in the sense that they go beyond tariff
barriers, and have not fully included a growth model or explained the processes that give rise to
productivity changes over time (Piermartimi and Teh, 2005).
Only the Dee et al. (2005) study on Vietnam’s services trade examined potential pro-
competitive effects in the Vietnamese context as trade in general or opening service sectors to
foreign firms prevent domestic firms from exploiting market power. It is unlikely, however, that
Page 17
17
significant reductions in monopoly rents will occur as Vietnam moves from a state controlled
economy to an open, market oriented economy. This is especially so since it has been common
elsewhere for state enterprises to be replaced by oligopolistic multinational firms. Efficiency
gains as state enterprises are replaced by private firms may be more likely to occur.
Roland-Holst et al. (2002) included productivity gains, which they attributed to
complementary domestic policy reform, and which were essentially exogenously imposed in
their model. Nevertheless, the econometric literature on the relationship between trade
liberalization and growth remains controversial and inconclusive. The presumption that a
systematic relationship between the level of trade and productivity in a sector, commonly used in
CGE models to capture dynamic gains, has yet to be conclusively supported econometrically.
The broader literature shows that development and growth are due as much due to technological
progress or productivity gains resulting from other efficiency enhancing factors as to capital
accumulation (Andersen and Dalgaard, 2006). A more solid basis for understanding the
relationship between sectoral productivity, capital accumulation and trade policy is needed to
capture the effects of institutional changes.
The key mechanism in existing trade models driving changes after reform is tariff
reductions and subsequent price changes, but even setting tariff change assumptions for an
aggregate model is problematic. One problem is that tariff equivalents of NTBs must be
established. Thus, modeling exercises show an increase in Vietnamese tariffs, as a result of
tariffication of NTBs, following several reforms in the late 1990s, when trade levels were
increasing. A second problem is aggregation. Negotiations involve compromises at a highly
disaggregated level, and critical products and corresponding tariff lines in negotiations can be for
very narrowly defined sectors. In evaluating the potential outcome from the Doha Round, the
World Bank (Anderson and Martin, 2005) noted that exempting just 5% of tariff lines from
reduction could eliminate potential gains from Doha Round trade liberalization. None of the
Vietnam studies we have reviewed are sufficiently disaggregated to overcome problems of
missing critical detailed information relevant to negotiations. Rather, simplistic tariff changes,
such as projecting free trade outcomes, are assumed since details of the outcome of WTO
accession negotiations were not yet available at the time of writing. So, likely tariff changes are
overestimated while the projected trade and economic outcomes are underestimated. This again
Page 18
18
reinforces the notion that tariff changes, especially as equivalents of NTBs, are far from all that
matters.
Some of the specific modeling choices in typical trade models have also been subject to
considerable criticism (Ackerman, 2005; Taylor and von Arnim, 2006), and this includes the
functional form determining how tariff reductions are translated into market access
improvements. One of the most important features of these models is the Armington
specification of international market share determination. In this approach, imported
intermediates (by source) are assumed to be separable from domestically produced intermediate
inputs. That is, firms first decide on the sourcing of their imports. Then, based on the resulting
composite import price, they determine the optimal mix of imported and domestic goods (Hertel,
1997). The specific functional forms used (i.e. the constant elasticity of substitution or CES
types) have the virtue of allowing observed two way trade, and they constrain base solutions and
simulations of small shocks to stay near the base case outcomes, so model results appear
realistic. Yet, they must essentially be seen as an ad hoc feature to cope with aggregation
problems that exaggerate market power in trade and more importantly, they limit the potential
for new markets to emerge.
Historically, the values of the Armington substitution elasticities were simply assumed,
yet these parameters are critically important in determining the magnitude and nature of changes
that occur in CGE models. We know of no studies estimating these parameters for Vietnam.
Furthermore, if initial international market shares are zero, the Armington functions must keep
shares at zero, and where shares are low initially, very large price differentials and/or substitution
elasticities are needed to allow those sectors to grow to any appreciable size. In contrast, trade
data for Vietnam following each of its major trade agreements show, at least when viewed at a
reasonable degree of disaggregation, that small sectors become large and new products emerge.
Table 2 demonstrated that for trade with the EU, China and Singapore, the number of three digit
SITC commodities exported to those destinations from Vietnam doubled from about 100 to
about 200 commodities. In the case of the BTA with the U.S., the number of commodities
increased from 88 to 138, but the value of trade increased more than six-fold.
The Armington/CES functional form prevents observed increases in the number of
commodities traded and in the magnitude of trade flows unless unrealistically large parameter
values are chosen. Use of those large parameters would only be sensible for a brief period after
Page 19
19
the beginning of a trade agreement. To show this, we imputed the Armington elasticities of
substitution necessary to capture the observed increases in Vietnam’s share of the U.S. market
following the BTA for seven of the more successful commodities (Table 6). This is a
straightforward case to model – if tariffs are all that drive trade. In most cases Vietnamese
exports can be considered small relative to the U.S. market. We assume that U.S. import prices
for other exporters and on average remain fixed, so tariff changes closely approximate relative
price changes faced by Vietnamese exporters. We then imputed the Armington elasticities
reported in Table 6 using the following formulae:
Eclothing, Vietnam-US = Mclothing, US (ShareVietnam)o((PUS +Tmfn)/(PUS + To, Vietnam))ε
(ShareVietnam)o = (Eclothing, Vietnam-US / Mclothing, US )o
where Eclothing, Vietnam-US is exports of clothing (or some other good) from Vietnam to the U.S.,
Mclothing, US is total clothing imports from all exporters by the U.S., PUS is the world price of
clothing at the U.S. border, Tmfn is the ad valorem MFN tariff applied by the U.S. to most
imports, To, Vietnam is the higher tariff paid by Vietnam prior to the BTA, o denotes the year before
the BTA went into effect, and ε is the Armington elasticity of substitution to be imputed.
For some sectors – cashews, fish, crustaceans, and coffee – tariffs were initially very
small, and Armington elasticities need to be over 100 for the assumed model structure to capture
the successful increases in these sectors. For other sectors – apparel, clothing, electronics
footwear, and furniture – tariff reductions were quite substantial yet substitution elasticities
greater than eight and as high as 20 were needed to capture the big increases in Vietnam’s share
of the U.S. market.
[Table 6 about here]
The results from Fukase and Martin (1999a) on the U.S. BTA highlight this problem. The
small initial share of Vietnam in the U.S. clothing market dooms that model to under predict the
effects of that agreement, even in the sectors where tariff changes were large. While their
prediction of changes in clothing exports seemed large at 1,512%, the actual change was
10,635%, both from a very small base (Table 5). The results for electronics were comparable,
even though that sector has not (yet) been as successful as clothing.
Page 20
20
The extremely large elasticities, and very large new exports in sectors where tariffs were
almost zero before an agreement suggest that other, institutional factors, not tariff changes, are
what drive export success after a trade agreement. Even in cases where tariff changes are
significant, the Armington elasticities must be quite large to explain observed trade changes.
This highlights that movements along a restrictive demand function cannot explain the
improvements in market access that these trade agreements bring. Accordingly, whatever
approach is used to predict the consequences of trade agreement, it should not rely on the
Armington specification, and must take into account both openings in market access (demand
pull or constraints on exports) and institutional changes which affect market access, productivity
and incentives to invest in the exporting country.
Labor market assumptions have also been a focus of criticism of the CGE models
(Polanski, 2006; Stiglitz and Charlton, 2005). In the studies reviewed, only Huong and Vanzetti
(2006) model closures permitting unemployment, but they identified only one such case, which
they characterized as extreme. However, Vietnam’s experience with past agreements and
economic growth more generally has shown only modest employment gains (Yoko,Winters and
Dutta, 2003), so the unemployment closure of Huong and Vanzetti (2006) may not be as extreme
as they suggest. While still quite low relative to history, this closure finds the most reasonable
trade and GDP impacts. It may also be the case that education levels constrain employment
growth from some activities but not for others, suggesting that a more detailed look at labor
markets is required than found in these models. At a minimum, relationships between urban and
rural labor markets and the constraints they imply for particular sectors need to be better
understood.
A fundamental concern in assessing alternative future model specifications is to ask what
constrains sectoral growth. In most CGE models, and all those examined as part of this paper,
gains for one country typically come at the expense of losses for other countries as fixed capital
and labor endowments are reallocated across sectors. In the Vietnamese case, however, it is hard
to argue that labor has to this point been a serious constraint on growth. The effect of FDI in
augmenting capital is not apparent in determining growth either (Figure 1), and the literature has
had difficulty in attributing productivity gains to the presence of FDI. Yet, it must be the case
that capacity constrains growth, subject to productivity enhancing effects of institutional reforms
and to demand constraints that may be relaxed as new market access opportunities arise.
Page 21
21
Institutional changes, improved market access, and domestic reform all change the
incentives to invest in particular sectors following trade agreements. Those investments together
with the institutional changes both increase capacity and enhance productivity. A successful
trade model would need to predict both any changes in investment patterns and productivity
increases sector by sector as a consequence of all aspects of trade agreements. It is likely that
high fixed (initial) costs of those investments mean that trade liberalization may facilitate the
exploitation of significant scale economies. Sectoral estimates of likely capacity expansions
provide better information than aggregated CGE models now do. Current models can
accommodate the national accounting constraints within which such capital allocations occur,
but they can capture endogenously neither the allocation of investment nor the increase in
productivity that have apparently followed past trade agreements.
The earlier comparison of actual outcomes versus model predictions demonstrated that
future trade liberalization is likely to have larger effects than CGE models predict; and the above
model limitations help to explain why underestimation is common and inevitable. A better
understanding of the mechanisms by which trade liberalization, and trade agreements in all their
aspects, influences economic outcomes therefore needs to be developed. Those mechanisms
must be incorporated into models intended to predict trade outcomes for them to be relevant to
policy makers.
5. CONCLUSION
Vietnam has since 1986 experienced rapid economic growth and important reductions in
poverty incidence. This economic performance has been accompanied by continuous, if not
smooth, institutional reforms, which have substantially increased the extent of integration of
Vietnam’s economy into world markets. Each time Vietnam has negotiated a major trade
agreement with an important partner, the extent of trade with that partner has expanded, and it
would appear to never have been at the expense of trade with other regions. Agreements with the
EU, ASEAN and the U.S. had already before WTO accession in early 2007 reduced tariffs to a
relatively low average level. More significantly, they had helped encourage the economic, legal
and administrative reforms that have formed an integral part of the Vietnamese Doi Moi market
oriented restructuring process.
Page 22
22
Existing studies have based predictions of the impact of WTO accession by Vietnam on
analytical modeling frameworks, which are similar to those that have failed to predict the past
success of bilateral trade agreements. There is no shortage of alternative economy wide studies
utilizing CGE models to examine trade policy impacts in Vietnam. We considered 16 such
studies in this research, with background documentation and further review available in Abbott
et al. (2006). These models find small endogenously generated changes in trade and GDP, and
they must resort to exogenous productivity shocks to get results that seem qualitatively more in
line with historical experience. Moreover, it is far from apparent that the theoretical resource
constraints applied in existing models reflect Vietnamese reality. Actual experience shows that
trade flows to partners not participating in an agreement in a particular period expand, and that
trade flow expansion in one sector does not appear to carry with it declines in other sectors. In
contrast, models are typically built so that expansion of one sector (e.g. textiles and clothing) and
to one partner (e.g. the U.S.) come at the expense of other sectors and other partners. Past
experience generated only limited employment expansion, and models which permit
unemployment provide somewhat more realistic results. More generally, it would appear that the
predictions of existing modeling exercises have been largely irrelevant to the likely future
Vietnamese trade experience after joining WTO. The reasons for this are embedded in the fact
that tariff reform and associated price changes are of limited importance and the problems
associated with low initial shares, under and unemployment, and foreign capital inflows. The
same goes for market access improvements leading to demand driven outcomes, and the failure
to capture endogenously the impacts of institutional changes and productivity improvements.
It is clear from our review of past studies that many authors are aware of the limitations
of the basic methods applied, and yet difficulty in getting simulation results to conform to
expectations as to trade reform impacts abound. The rhetoric of some studies evolves into more
optimistic conclusions, but they actually involve a disconnection between the small numbers
emerging from the models and the larger impacts experienced and anticipated in reality. A
common strategy elsewhere has been to exogenously shift production functions outward. The
claim that such shifts capture the link between trade and development highlights the inability of
models (and existing theory) to represent endogenously the mechanisms by which trade may
foster development and reduce poverty. There is conflicting evidence on poverty reduction as
well – with some models showing trade liberalization leading to worsening poverty in Vietnam.
Page 23
23
More importantly the impact of trade liberalization appears small relative to the effects of
revenue replacement assumptions incorporated in modeling of alternative tax regimes (see
Jensen and Tarp, 2005). In sum, most authors detail the important institutional changes underway
in Vietnam by way of introduction, but refrain from incorporating them effectively into the
subsequent analysis.
History following the implementation of past trade agreements, not model based results,
would appear to justify the belief that WTO accession will lead to more rapid economic
development and poverty alleviation. Vietnam’s experience, especially when the effects of past
bilateral trade agreements are examined, shows the potential power of trade reform, broadly
considered, in helping foster development. Our analysis of model revisions necessary to make
tariff changes induce observed, detailed sector outcomes demonstrates that institutional changes
beyond tariffs must lie behind the changes observed in the past in Vietnam. More simply, the fact
that large new trade flows appear following bilateral agreements in sectors where tariffs were
previously insignificant strongly suggests something else is going on.
Policy makers on the ground in Vietnam are already grappling with the importance of
these institutional changes. Discussions of the prospects and challenges from Vietnam’s WTO
accession invariably move towards discussion of services trade, legal reform, and the role of the
state in the economy. But it is difficult to foresee quantitatively the impacts of reforms from
those discussions. In the sector studies reviewed as background for this paper, authors tended to
shy away from quantitative conclusions. Instead, recommendations for further institutional
reforms are emphasized, while offering a simple indication of the anticipated direction of
changes in competitive advantage.
The key puzzle for all those engaged in ongoing, policy relevant trade policy analysis
(including academic researchers and development practitioners more broadly) is to identify the
mechanisms through which trade influences development and so determine what limits the
expansion of trade and growth, in particular sectors and overall. Vietnamese experience is clearly
consistent with the trend toward developing dynamic versions of economy wide models (van der
Mensbrugghe, 2005; and Ianchovichina et al., 2000). Dynamic development questions have to be
captured in short to medium run models for them to be of interest in the above endeavor. Rapid
growth and especially the limited employment generation of this experience highlight the
limitations of analysis based on traditional clearing of factor markets, and under and
Page 24
24
unemployment of labor are clearly significant in Vietnam. Demand constraints are also evident
in the form of reemergence of textile quotas on Vietnam from the U.S. Finally, capital
constraints are more puzzling, as Vietnam’s recent experience with foreign direct investment
shows no consistent pattern related to economic performance.7 Accordingly, an important key to
understanding the link between trade and development is to better understand the role of trade
incentives on investment.
Cross country studies of trade and growth highlight the need to uncover better the
relationship between trade and productivity, as well (Hall and Jones, 1999; Andersen and
Dalgaard, 2006). The results of this paper are also consistent with the recent poverty research at
the World Bank (Hertel and Winters, 2005), which highlight market imperfections such as price
transmission and employment to get the linkages between trade and poverty right.
Any path forward to quantitatively assessing the potential impacts of trade agreements in
Vietnam and elsewhere will evidently need to respect the fundamental national accounting
identities of the social accounting matrices (SAMs) that are the foundation of model based
approaches to quantitative trade reform assessment. These incorporate the basic supply-demand
balances and macroeconomic consistency that must hold. Development is a dynamic process,
however, and we find that the key behavioral relationships which are in need of explanation are
three-fold. They include (i) uncovering the factors that determine the evolution of the capital
stock, hence capacity, by sector; (ii) establishing how productivity by sector evolves in response
to trade incentives and institutional reforms; and (iii) determining how factors outside the
country shape developments in market access (demand). Investment incentives from both price
(tariff) changes and institutional changes – both foreign and domestic – may lead to new
products, expanded capital accumulation, and higher productivity. These factors must be
properly integrated for the analysis to be of relevance.
Vietnam is an important case illustrating successful economic development and poverty
alleviation from a low income level. The extensive involvement of the state in the Vietnamese
economy may make it a special case in some respects. Yet, the institutional reforms undertaken
(particularly in preparation to join the WTO and as a consequence of past bilateral agreements)
are commonly found in other developing countries, or are part of reform packages widely
promoted by international organizations and in bilateral aid and policy negotiations. We believe
the lessons from Vietnam have broad application in terms of the methodology employed to
Page 25
25
examine trade liberalization as well as in assessing the linkages between international trade
liberalization, development and poverty.
NOTES 1 See Thang (2004a, b). 2 See for example Thanh (2005). 3 Rama and Sa (2005) provide a useful overview of existing studies. See also Abbott et al. (2006) and references cited therein. 4 It is a common practice in cross country growth regressions to utilize dummy variables dating trade regime changes (e.g. Sachs and Warner, 1995). Vietnam’s timeline shows the danger in trying to construct such a dummy variable in a meaningful way. 5 See McCarty and Kalapesi (2003) for interesting background on this issue. 6 1996 is the base year in both studies by Fukase and Martin (1999a, b), so we compare actual outcomes from that base year. ASEAN partnerships began in 1996, and U.S. trade started to expand in 1996 as well, but the real expansion came after the 2000 BTA was reached. 7 This is consistent with the cross country regression literature on the relationship between FDI and growth, where a robust general relationship has not been found (Javorcik, 2004 and Keller, 2004)
Page 26
26
REFERENCES Abbott, P. Bentzen, J., Pham Thi Lan Huong, and Tarp, F. (2006) A Critical Review of Studies
on the Social and Economic Impacts of Vietnam’s International Economic Integration,
Central Institute of Economic Management (CIEM), Hanoi, Vietnam, Mimeo.
Ackerman, F. (2005) The Shrinking Gains from Trade: A Critical Assessment of Doha Round
Projections, GDEI Working Paper 05-01, Medford, Tufts University.
Andersen, T.B. and C.J. Dalgaard (2006) Cross Border Flows of People, Technology Diffusion
and Aggregate Productivity, Discussion Paper 06-04, Department of Economics,
Copenhagen University.
Anderson, K. and W. Martin, editors (2005) Agricultural Trade Reform and the Doha
Development Agenda, Palgrave Macmillan, for the World Bank, Washington DC.
Armington, P. S. (1969) A Theory of Demand for Products Distinguished by Place of
Production, International Monetary Fund Staff Papers 16, 159-78.
Centre for International Economics (CIE) (2002) Integration and Poverty: An Economy-wide
Analysis, Canberra, Report prepared for the World Bank, November.
Dee, P., L. T. Duc, and D. T. Hiep (2005) Evaluating Vietnam’s WTO accession in Services,
World Bank.
Dimaranan, B., L. T. Duc, and W. Martin (2005) Potential Economic Impacts of Merchandise
Trade Liberalization under Viet Nam’s Accession to the WTO, GTAP Resource Center,
Purdue University.
Fukase, E. and W. Martin (1999a) The Effect of the United States’ Granting Most Favored
Nation Status to Vietnam, World Bank PRWP 2219.
Fukase, E. and W. Martin (1999b) A Quantitative Evaluation of Vietnam’s Accession to the
ASEAN Free Trade Area, World Bank PRWP 2220.
Hall, R. and C. Jones (1999) Why do some countries produce so much more output than others?
Quarterly Journal of Economics 114, 83-116.
Hertel, T. W. (1997) Global Trade Analysis: Modelling and Applications, Cambridge:
Cambridge University Press.
Hertel, T. W. and M. E. Tsigas (1997) Structure of GTAP, Chapter in Global Trade Analysis:
Modelling and Applications, Cambridge: Cambridge University Press.
Page 27
27
Hertel, T.W. and L.A. Winters (2005) Poverty and the WTO: Impacts of the Doha Development
Agenda, Palgrave Macmillan, for the World Bank, Washington DC.
Huong, P.L. and Vanzetti, D. (2006) Vietnam’s Trade Policy Dilemmas, The Ninth Annual
Conference on Global Economic Analysis, Addis Ababa, Ethiopia.
Ianchovichina, E. (2003) GTAP-DD: A Model for Analyzing Trade Reforms in the Presence of
Duty Drawbacks, GTAP Technical Paper 21, Center for Global Trade Analysis, Purdue
University.
Ianchovichina, Elena, Robert McDougall and Thomas Hertel (2000) Disequilibrium Model of
International Capital Mobility, GTAP Working Paper No. 10 presented at the Second Annual
Conference on Global Economics Analysis, Denmark, June 20-22.
Javorcik, B.S. (2004) Does Foreign Direct Investment Increase the Productivity of Domestic
Firms? In Search of Spillovers Through Backward Linkages American Economic Review
94(3) 605-627.
Jensen, H. T., J. Rand, F. Tarp, P. L. Huong, and D. H. Minh (2004) A New Social Accounting
Matrix for the Year 2000. Hanoi: Science and Technics Publishing House.
Jensen, H. T. and F. Tarp (2005) Trade Liberalization and Spatial Inequality: Methodological
Innovations in Vietnamese Perspective, Review of Development Economics 9(1), 69-86.
Keller, W. (2004) International Technology Diffusion Journal of Economic Literature XLII
752–782.
McCarty, A. and Kalapesi (2003) The economics of the “non-market economy” issue: Vietnam
catfish case study, Mekong Economics, available at
http://www.eldis.org/fulltext/vietnam.pdf.
Nguyen, T. D. and M. Ezaki (2005) Regional Economic Integration and its Impacts on Growth,
Poverty and Income Distribution: The Case of Vietnam, Review of Urban and Regional
Development Economics 17(3), 117-215.
Piermartini, R. and R. Teh (2005) Demystifying Modelling Methods for Trade Policy, WTO
Discussion Paper 10.
Polanski, Sandra (2006) “Winners and Losers: Impact of the Doha Round on Developing
Countries”, Carnegie Endowment for International Peace, Washington D.C., 2006
Page 28
28
Rama, M. and K. L. Sa (2005) Impacts of WTO Accession: Can They be Predicted? What to Do
about Them? Paper Presented at the Workshop on ‘Growth and Social Impacts of WTO
Accession’, Vietnamese Academy of Social Sciences, Hanoi.
Rodrik, D. and F. Rodriguez (1999) Trade Policy and Economic Growth: A Skeptic's Guide to
Cross-National Evidence, NBER Working Paper No. 7081, April.
Roland-Holst, D., Tarp, F., An, D. V., Thanh, V. T., Huong, P. L. and Minh, D. H. (2002)
Vietnam’s Accession to the World Trade Organization: Economic Projections to 2020,
CIEM/NIAS Discussion Paper DP0204.
Sachs, J.D. and Warner, A. (1995) Economic Reform and the Process of Global Integration,
Brookings Papers on Economic Activity 1995(1), 1-118.
STAR-Vietnam (2002) An Assessment of the Economic Impact of the United States – Vietnam
Bilateral Trade Agreement, Annual Economic Report, The National Political Publishing
House.
Stiglitz, J. and A. Charlton (2005) Fair Trade for All: How Trade Can Promote Development,
Oxford University Press, Oxford and New York.
Tarp, F., D. Roland-Holst, J. Rand, P. L. Huong, and V. T. Thanh (2001) 1999 Social
Accounting Matrix for Vietnam, Hanoi: The Gioi Publishers.
Tarp, F., D. Roland-Holst, J. Rand, and D. Roland-Holst (2002) A Social Accounting Matrix for
Vietnam for the Year 2000: Documentation, CIEM/NIAS.
Taylor, Lance and Rudiger von Arnim (2006) Computable General Equilibrium Models of Trade
Liberalization: The Doha Debate, New School for Social Research, New York. Paper
prepared for Oxfam GB.
Thang, N. (2004) Vietnam, a study funded by Department for International Development, UK,
under contract CBTR 03 4777.
Thanh, V. T. (2005) Vietnam’s Trade Liberalization and International Economic Integration:
Evolution, Problems and Challenges, ASEAN Economic Bulletin 22(1), 75-91.
Toan, N. M. (2005) The Effect of Trade Liberalization on Income Distribution in Vietnam –
Dynamic Computable General Equilibrium Approach, Preliminary Draft of PhD dissertation.
UN comtrade (2006), United Nations Commodity Trade Statistics Database, Statistics Division,
United Nations, New York. Available at: http://comtrade.un.org/
Page 29
29
United States International Trade Commission (USITC) (1997) The Dynamic Effects of Trade
Liberalization: An Empirical Analysis, Investigation No. 332-375, Washington, DC 20436
Publication 3069 October.
van der Mensbrugghe, D. (2005) LINKAGE Technical Reference Document, Version 6.0,
Development Prospects Group (DECPG), World Bank.
Yoko, N., A. Winters and P. Dutta. (2003) Trade Liberalisation and Poverty Dynamics in
Vietnam. Poverty Research Unit at Sussex, University of Sussex / PRUS Working Papers.
RePEc:pru:wpaper:17. Available at: http://www.sussex.ac.uk/Units/PRU/wps/wp17.pdf
World Bank (2006) World Development Indicators, Data CD.
Page 30
30
TABLES AND FIGURES
Page 31
31
Figu
re 1
. E
cono
mic
Gro
wth
, Tra
de, F
DI,
and
Pov
erty
in V
ietn
am
0102030405060
1985
1990
1995
2000
2005
constant $US billions
01530
% headcount
GD
PT
rade
FDI (
* 10
)E
xpor
tsPo
vert
y
Sour
ce:
Wor
ld D
evel
opm
ent I
ndic
ator
s (W
orld
Ban
k, 2
006)
Page 32
32
1986 Doi Moi (the Rennovation) -- Economic reforms begin
1987
1988 Import tariffs introduced
1989 Market oriented reforms, Unified exchange rateState monopoly of foreign trade eliminated
1990 Export Processing zones established
1991 Law on Import and Export Duties - established Preferential tariffs
1992 European Union trade agreement
1993
1994 Quotas introduced
1995 WTO Accession Working Party establishedJoined ASEAN
1996
1997 Asian Financial Crisis beginsReduced requirements on firms to enter foreign trade
1998 Joined APEC (Asian Pacific Economic Cooperation)
1999 MFN agreement with Japan
2000 US -Vietman Bilateral Trade Agreement (BTA ) signed
2001 CEPT/AFTA implementation plan under ASEAN beginsNew Trade Policy Roadmap - most QRs removed
2002 ASEAN China Free trade areaImplementation of US-BTA begins
2003 ASEAN Japan Comprehensive economic partnershipTRQs introduced
2004 EU -Vietnam bilateral agreement on WTO AccessionCompetition Law
2005 29 new or amended Laws on Commerce and Trade
2006 Final bilateral agreements for WTO Accession reachedCEPT/AFTA under ASEAN implementation to be completed
Source: Adapted mostly from Thanh (2005) and www.WTO.org
Figure 2. Timeline for Vietnam's Trade Agreements and Economic Reforms - 1986 to 2006
Page 33
33
Figu
re 3
. Vie
tnam
ese
Exp
orts
to A
SEA
N c
ount
ries
Fol
low
ing
Doi
Moi
(19
86)
and
Join
ing
ASE
AN
(19
95),
Mil
lion
$U
S
0
200
400
600
800
1000
1200
1400
1600
1800
2000
1986
1988
1990
1992
1994
1996
1998
2000
2002
2004
Million $U.S.
Bru
nei
Cam
bodi
aIn
done
sia
Mal
aysi
a
Phi
llipi
nes
Tha
iland
Sin
gapo
re
Sour
ce:
UN
com
trad
e (2
006)
Page 34
34
Figu
re 4
. Val
ue o
f tot
al V
ietn
ames
e E
xpor
ts to
Var
ious
Tra
ding
Par
tner
s
0
1000
2000
3000
4000
5000
6000
7000
8000
1986
1988
1990
1992
1994
1996
1998
2000
2002
2004
Million $U.S.
EU
-15
US
Ch
ina
Jap
an
So
uth
Ko
rea
Sour
ce:
UN
com
trad
e (2
006)
Page 35
35
Food and Live Animals 4,384 Chemicals, Reltd.prod.nes 3,606Fish, Crustaceans, Mullucs 2,196 Medicinal, Pharm.products 506Cereals, Cereal preprtns. 767 Fertilizer except GRP272 630Vegetables and Fruit 503 Plastics in primary form 829Coffe, Tea, Cocoa, Spices 682
Fuels, Lubricants etc. 4,151 Manufactured goods 6,641Petroleum, Petrol. products 3,962 Leather, Leather goods 504
Textile yarn, Fabric etc. 2,441Iron and Steel 1,896
Misc manufactured articles 7,226 Machines, Transport Equipment 7,977Furniture, Bedding etc. 644 Power generating machines 920Clothing and Accessories 3,467 Special.indust.machinary 1,521Footwear 2,299 Generel industl.mach.nes 953
Telecomm. sound equipment ect. 568Elec. mch. appar, Parts.nes 1,284Road vehicles 1,293Other transport equipment 681
Other Exports 4,388 Other Imports 7,032
Total Exports 20,149 Total Imports 25,255
Leading Exports Leading Imports
Table 1. Key Vietnamese Imports and Exports in 2003, $U.S. million
Source: UN comtrade (2006)
Page 36
36
EU - 15 $US million % $US million % $US million % Top 5 commodities 45.0 60.8 1283.1 71.9 4546.5 65.3 10 commodities 55.4 74.8 1504.1 84.3 5297.6 76.1 15 commodities 61.7 83.3 1602.7 89.9 5791.5 83.2 20 commodities 65.9 89.0 1660.3 93.1 6144.7 88.3 Total 74.0 1783.7 6962.7 No. of 3 Digit SITC Commodities 93 185 203
US $US million % $US million % $US million % Top 5 commodities 306.2 89.6 671.8 75.9 5231.2 78.9 10 commodities 328.8 96.2 820.5 92.7 5925.9 89.4 15 commodities 333.6 97.6 849.9 96.0 6127.2 92.4 20 commodities 336.5 98.5 860.2 97.2 6260.9 94.4 Total 341.7 885.2 6630.1 No. of 3 Digit SITC Commodities 88 108 138
Singapore $US million % $US million % $US million % Top 5 commodities 100.7 77.9 660.0 80.6 1157.0 83.2 10 commodities 116.7 90.2 699.8 85.5 1220.6 87.8 15 commodities 121.0 93.6 726.3 88.7 1256.7 90.4 20 commodities 123.5 95.5 748.0 91.3 1282.1 92.2 Total 129.3 818.9 1390.5 No. of 3 Digit SITC Commodities 104 182 184
China $US million % $US million % $US million % Top 5 commodities 10.0 92.0 8.2 88.3 1946.8 78.4 10 commodities 10.7 98.8 8.6 92.4 2147.8 86.5 15 commodities 10.8 99.7 8.8 94.4 2230.4 89.9 20 commodities 10.8 100.0 8.9 95.8 2287.3 92.2 Total 10.8 9.3 2482.0 No. of 3 Digit SITC Commodities 19 139 171
1992 2000 2004
1991 2000 2004
1996 2000 2004
Table 2. Vietnamese Exports to the EU, U.S., Singapore and China Around Bilateral Agreements
1990 1996 2004
Source: UN comtrade (2006)
Page 37
37
Table 3. Predictions Based on 30 Scenarios of CGE Studies of the Impact of WTO Accession on Vietnam, Percentage Change
Study GDP Export Import
Number of scenarios
min
max
min
max
min
max
Fukase and Martin (1999b)a)
5 -4.7 1.0 3.9 15.2 3.1 12.8
CIE (2002)b) 7 0.2 3.3 0.6 12.1 N/A N/A Dee et al. (2005) 4 0.03 2.44 N/A N/A N/A N/A Toan (2005)c) 1 fall 0.13 0.4 Nguyen and Ezaki (2005)
5 -0.06 -0.68 1.73 18.24 3.15 15.39
Dimaranan et al. (2005)a)
2 6.74 7.88 15.22 18.81 N/A N/A
Huong and Vanzetti (2006)
6 1 15 -2 57 -1 37
Source: Authors’ review of cited references above and Abbott et al. (2006) Notes: a) These effects are reported in output, not GDP. Since only the sector-disaggregated predicted effects on output were reported in the paper, the numbers reported here are calculated averages of the predicted effects. b) The effects on GDP and exports were not calculated in scenarios (ii) and (iii). c) Since all predicted effects in the paper are only reported disaggregated into agriculture, service, and manufacturing, the numbers reported here are averages. The paper by Toan (2005) only has one scenario. d) Since all predicted effects are only reported as disaggregated into 22 sectors, the numbers reported here are calculated averages of these.
Actual value Predicted changes1996 1996-2000 1996-2004 2000-2004
$US million % % % % Indonesia 204.4 25 48.1 103.5 37.1 Malaysia 150.4 59 202.9 285.7 27.3 Philippines 196.9 226 -11.0 124.0 151.7 Singapore 436.0 0.4 87.8 218.9 69.8 Thailand 65.7 98 403.5 568.4 32.7Source: Predictions are from Fukase and Martin (1999b)
Table 4. Model Predictions Versus Actuel Exports to ASEAN Partners after 1996 Actual changes
Page 38
38
Actual value Predicted changes1996 1996-2000 1996-2004 2000-2004
$US million % % % % Agriculture and Forestry 56.1 -1 575 1383 120 Basic manufacturing 1.6 329 826 5596 515 Beverages and Tobacco 0.6 125 13 317 270 Clothing 25.7 1512 106 10635 5113 Coal, Oil, Gas 0.01 4 -49 1424 2888 Chemical, Rubber, Plastic 1.5 64 400 2140 348 Electronics & Machinery 0.4 284 737 29865 3478 Others 5.1 N/A 180 594 148 Processed Ag 119.5 19 28 44 13 Petroleum & Coal 85.8 N/A 11 340 298 Textiles 0.2 241 718 40804 4902 Transport Equipment 0.02 N/A 559 63877 9613 Light Manufacturing 45.1 147 263 2601 643 Furniture & Footwear 42.8 233 2182 584 Rest of Light Manufact. 2.3 811 10255 1037 Total 341.7 127.4 159 1576 547Source: Predictions are taken from Fukase and Martin, World Bank, W PS2219, Nov 1999
Table 5. Model Predictions Versus Actual Exports to the U.S. Following the BTA Implemented in 2002 Actual changes
2000 2004 2000 2004% % % %
Cashews 11.5 30.4 0.9 0.0 -114 Apparel and Clothing 0.1 3.8 38.7 15.4 -20 Electronics 0.002 0.02 28.7 2.0 -11 Fish, Crustaceans 3.0 5.1 0.5 0.3 -375 Footware 1.0 2.9 26.3 10.6 -8 Furniture 0.07 1.53 26.2 0.02 -13 Coffee 4.6 5.5 0.008 0.005 -5468
Imputed Armington Elasticity
Vietnam's Share of U.S. Market
Table 6. Tariff Changes and Imputed Armington Elastiticies for Selected Commodities Following the U.S. BTA Tariff paid
Source: UN comtrade (2006) and author’s calculations.