Journal of Solid State Chemistry 180 (2007) 420–431 Local structure and influence of bonding on the phase-change behavior of the chalcogenide compounds K 1x Rb x Sb 5 S 8 J.B. Wachter a , K. Chrissafis b , V. Petkov d , C.D. Malliakas a , D. Bilc d , Th. Kyratsi a,1 , K.M. Paraskevopoulos b , S.D. Mahanti c , T. Torbru¨gge e , H. Eckert e , M.G. Kanatzidis a, a Department of Chemistry, Michigan State University, East Lansing, MI 48824, USA b Department of Physics, Aristotle University of Thessaloniki, 54124 Thessaloniki, Greece c Department of Physics, Michigan State University, East Lansing, MI 48824, USA d Department of Physics, Central Michigan University, Mount Pleasant, MI 48859, USA e Institut fu ¨ r Physikalische Chemie, Westf. Wilhelms-Universita ¨t Mu ¨ nster, Germany Received 17 October 2006; received in revised form 24 October 2006; accepted 24 October 2006 Available online 6 November 2006 Abstract KSb 5 S 8 and its solid solution analogs with Rb and Tl were found to exhibit a reversible and tunable glass-crystal-glass phase transition. Selected members of this series were analyzed by differential scanning calorimetry to measure the effect of the substitution on the thermal properties. The solid solutions K 1x Rb x Sb 5 S 8 exhibited clear deviations in melting and crystallization behavior and temperatures from the parent structure. The crystallization process of the glassy KSb 5 S 8 as a function of temperature could clearly be followed with Raman spectroscopy. The thermal conductivity of both glassy and crystalline KSb 5 S 8 at room temperature is 0.40 W/ m K, among the lowest known values for any dense solid-state material. Electronic band structure calculations carried out on KSb 5 S 8 and TlSb 5 S 8 show the presence of large indirect band-gaps and confirm the coexistence of covalent Sb-S bonding and predominantly ionic K(Tl)?S bonding. Pair distribution function analyses based on total X-ray scattering data on both crystalline and glassy K 1x Rb x Sb 5 S 8 showed that the basic structure-defining unit is the same and it involves a distorted polyhedron of ‘‘SbS 7 ’’ fragment of 7A ˚ diameter. The similarity of local structure between the glassy and crystalline phases accounts for the facile crystallization rate in this system. r 2006 Elsevier Inc. All rights reserved. Keywords: Glasses; Non-volatile memory 1. Introduction Phase-change materials are gaining increasing interest because of their use in the data storage media crucial to the information technology industry [1,2]. These materials exhibit reversible glass-to-crystal phase transitions and can be used in applications as diverse as non-volatile memory [3], digital video disks [4], polarized holograms [5], opto-mechanical actuators [6] and infrared optical wave- guides [7]. There are two major classes of phase-change materials: stoichiometric and non-stoichiometric. Stoichio- metric phase-change materials, such as the industry standard Ge 2 Sb 2 Te 5 [8], consist of a single crystallogra- phically distinct structure, which is recovered in pure form upon recrystallization. Non-stoichiometric glasses tend to crystallize into a mixture of two or more structures. An example of this is the (Li 2 S) x (Sb 2 S 3 ) 1x , x ¼ 0–0.17 system, which crystallizes into a mixture of a-LiSbS 2 and Sb 2 S 3 [9]. Stoichiometric materials are preferable due to faster crystallization rates, better cyclability and long lifetimes. The compound KSb 5 S 8 is isostructural to TlSb 5 S 8 , the mineral parapierrotite, and is a phase-change material with a rapid and reversible glass-to-crystal transition [10]. The crystalline phase melts at 441 1C and can be quenched to a glass. Upon subsequent heating, there is a glass transition ARTICLE IN PRESS www.elsevier.com/locate/jssc 0022-4596/$ - see front matter r 2006 Elsevier Inc. All rights reserved. doi:10.1016/j.jssc.2006.10.027 Corresponding author. Fax: +1 847 491 5937. E-mail address: [email protected] (M.G. Kanatzidis). 1 Present address: Department of Mechanical and Manufacturing Engineering, University of Cyprus, Nicosia, Cyprus.
Transcript
ARTICLE IN PRESS
0022-4596/$ - se
doi:10.1016/j.jss
�CorrespondE-mail addr
1Present add
Engineering, U
Journal of Solid State Chemistry 180 (2007) 420–431
www.elsevier.com/locate/jssc
Local structure and influence of bonding on the phase-change behaviorof the chalcogenide compounds K1�xRbxSb5S8
J.B. Wachtera, K. Chrissafisb, V. Petkovd, C.D. Malliakasa, D. Bilcd, Th. Kyratsia,1,K.M. Paraskevopoulosb, S.D. Mahantic, T. Torbruggee, H. Eckerte, M.G. Kanatzidisa,�
aDepartment of Chemistry, Michigan State University, East Lansing, MI 48824, USAbDepartment of Physics, Aristotle University of Thessaloniki, 54124 Thessaloniki, Greece
cDepartment of Physics, Michigan State University, East Lansing, MI 48824, USAdDepartment of Physics, Central Michigan University, Mount Pleasant, MI 48859, USA
Received 17 October 2006; received in revised form 24 October 2006; accepted 24 October 2006
Available online 6 November 2006
Abstract
KSb5S8 and its solid solution analogs with Rb and Tl were found to exhibit a reversible and tunable glass-crystal-glass phase
transition. Selected members of this series were analyzed by differential scanning calorimetry to measure the effect of the substitution on
the thermal properties. The solid solutions K1�xRbxSb5S8 exhibited clear deviations in melting and crystallization behavior and
temperatures from the parent structure. The crystallization process of the glassy KSb5S8 as a function of temperature could clearly be
followed with Raman spectroscopy. The thermal conductivity of both glassy and crystalline KSb5S8 at room temperature is �0.40W/
mK, among the lowest known values for any dense solid-state material. Electronic band structure calculations carried out on KSb5S8and TlSb5S8 show the presence of large indirect band-gaps and confirm the coexistence of covalent Sb-S bonding and predominantly
ionic K(Tl)?S bonding. Pair distribution function analyses based on total X-ray scattering data on both crystalline and glassy
K1�xRbxSb5S8 showed that the basic structure-defining unit is the same and it involves a distorted polyhedron of ‘‘SbS7’’ fragment of
�7 A diameter. The similarity of local structure between the glassy and crystalline phases accounts for the facile crystallization rate in this
system.
r 2006 Elsevier Inc. All rights reserved.
Keywords: Glasses; Non-volatile memory
1. Introduction
Phase-change materials are gaining increasing interestbecause of their use in the data storage media crucial to theinformation technology industry [1,2]. These materialsexhibit reversible glass-to-crystal phase transitions andcan be used in applications as diverse as non-volatilememory [3], digital video disks [4], polarized holograms [5],opto-mechanical actuators [6] and infrared optical wave-guides [7]. There are two major classes of phase-change
e front matter r 2006 Elsevier Inc. All rights reserved.
materials: stoichiometric and non-stoichiometric. Stoichio-metric phase-change materials, such as the industrystandard Ge2Sb2Te5 [8], consist of a single crystallogra-phically distinct structure, which is recovered in pure formupon recrystallization. Non-stoichiometric glasses tend tocrystallize into a mixture of two or more structures. Anexample of this is the (Li2S)x(Sb2S3)1�x, x ¼ 0–0.17 system,which crystallizes into a mixture of a-LiSbS2 and Sb2S3 [9].Stoichiometric materials are preferable due to fastercrystallization rates, better cyclability and long lifetimes.The compound KSb5S8 is isostructural to TlSb5S8, the
mineral parapierrotite, and is a phase-change material witha rapid and reversible glass-to-crystal transition [10]. Thecrystalline phase melts at 441 1C and can be quenched to aglass. Upon subsequent heating, there is a glass transition
ARTICLE IN PRESSJ.B. Wachter et al. / Journal of Solid State Chemistry 180 (2007) 420–431 421
at 223 1C followed by a rapid crystallization at 287 1C. Itsstructure is made of undulating [Sb5S8]
� layers with K+
ions seated in between the layers. The layers, however,interact strongly with one another forming essentially athree-dimensional [Sb5S8]
� network, Fig. 1(a) [11]. Thissystem is an interesting study case because it presents anintimate combination of covalent bonding (i.e. Sb–Sbonds) and ionic K–S bonding, both of which can influencethe phase-change behavior. Understanding glass crystal-lization in pure phases and the relationship of structure andbonding to the rates of phase change will lead to a betterdesign of phase-change materials for specific applications.Almost all materials that have been studied so far possessexclusively covalent bond frameworks. KSb5S8 is asemiconductor with a band gap of 1.82 eV for the crystal-line phase and 1.67 eV for the glass. The activation energy
0 20 40 60 80 100 120
(iii)
(d)
(ii)
(i)
Inte
nsity (
arb
. units)
2θ, deg
a
b
Fig. 1. (a) Structure of KSb5S8 viewed down the [101] direction. (b)
Powder X-ray diffraction patterns of as-synthesized glasses of
KxRb1�xSb5S8 (i–iii, x ¼ 0.25, 0.5, 0.75, respectively) and TlSb5S8 (iv),
showing their amorphous nature.
of crystallization for KSb5S8 is �16773 kJ/mol and therate constant for the peak temperature was found to becomparable to that of Ge2Sb2Te5 [12]. The crystallizationprocess appears to proceed via a bulk multi-step crystal-lization mechanism, where the nucleation rate increaseswith time [13].To further understand the KSb5S8 system, we investi-
gated the isostructural solid solutions of the typeK1�xRbxSb5S8. By partially substituting K for Rb, theproperties can be subtly altered while preserving thestructure and the phase-change capacity. For example,the same structure forms with K+, Rb+, and Tl+ and thusit is possible to prepare solid solutions of the typeK1�xRbxSb5S8 and K1�xTlxSb5S8 [11]. These representsmall but significant perturbations on the parent phase thatcould allow a better assessment of how changes in ionicbonding affect the phase change and other properties ofKSb5S8. Such studies could lead to a deeper understandingof the relationship of ionic vs. covalent bonding andcrystallization kinetics in phase-change materials.Here, we report on the evolution of physical, thermal,
and phase-change properties of a representative set ofK1�xRbxSb5S8 solid solutions. The Tl analog showedmarked differences in chemical phase change behavior vis-a-vis KSb5S8. Using bulk samples we also performedRaman and optical spectroscopic studies recorded during aphase-change event. We discuss structure–property rela-tionships through local structure studies using pairdistribution function analysis (PDF), electronic structure,and bonding analysis using density functional theory(DFT) band structure calculations. In addition, we reportthermal conductivity measurements for both forms ofKSb5S8. Generally, the thermal conductivity of phase-change switching materials needs to be low to avoid crosstalk during read/write events and in the case ofK1�xRbxSb5S8 we show that it is one of the lowest valuesknown for dense solid-state materials.
2. Experimental section
2.1. Reagents
K2S and Rb2S were prepared by the reaction of astoichiometric mixture of potassium or rubidium metal andsulfur in liquid ammonia at �78 1C until no trace of themetal was left (approx. 12 h). The ammonia was thenallowed to evaporate and the resulting pale yellow powderwas dried under vacuum for 24 h.Sb2S3 was prepared by reacting a stoichiometric mixture
of Sb and S powders in an evacuated silica tube at 750 1Cfor 24 h, then quenched in air to room temperature.K1�xRbxSb5S8 solid solutions were prepared by a
stoichiometric combination of potassium sulfide, rubidiumsulfide, and antimony sulfide, where the potassium sulfideto rubidium sulfide ratio was allowed to vary. A mixture ofK2S (1�xmmol, 0oxo1), Rb2S (xmmol), and 1.698 gSb2S3 (5.00mmol) was loaded in a silica tube under a dry
ARTICLE IN PRESSJ.B. Wachter et al. / Journal of Solid State Chemistry 180 (2007) 420–431422
nitrogen atmosphere in a Vacuum Atmospheres Dri-Labglovebox and flame-sealed under reduced pressure(o10�4mbar). The mixture was heated in a flame until ahomogeneous, orange melt was achieved, which was thenquenched in air to form a silver, glassy ingot. The yield wasquantitative. Crystalline K1�xRbxSb5S8 was formed byannealing the glassy ingot above the crystallization point,which ranged from 278 to 314 1C depending on composi-tion.
Glassy TlSb5S8 was prepared by the reaction of astoichiometric combination of Tl metal, Sb2S3, and sulfurpowder. The reactants were loaded into in a silica tubeunder a dry nitrogen atmosphere in a Vacuum Atmo-spheres Dri-Lab glovebox and flame-sealed under reducedpressure (o10�4mbar). The mixture was heated in afurnace at 800 1C for 1 d, then quickly removed andquenched in ice water to afford the TlSb5S8 glass.
2.2. Electron microscopy
Quantitative microprobe analyses of the compoundswere performed with a JEOL JSM-35C scanning electronmicroscope (SEM) equipped with a Tracor Northernenergy-dispersive spectroscopy (EDS) detector. Datawere acquired using an accelerating voltage of 25 kV anda 1-min acquisition time.
2.3. Powder X-ray diffraction
The samples were examined by X-ray powder diffractionfor identification and to assess phase purity. Powderpatterns were obtained using a CPS 120 INEL X-raypowder diffractometer with Ni-filtered Cu Ka radiationoperating at 40 kV and 20mA and equipped with aposition-sensitive detector. The purity of phases wasconfirmed by comparison of the X-ray powder diffractionpatterns to ones calculated from single crystal data usingthe NIST Visualize 1.0.1.2 software.
Synchrotron radiation scattering experiments werecarried out at the beamline 11-ID-C at the AdvancedPhoton Source at Argonne National Laboratory usingX-rays of energy 115.68 keV (l ¼ 0.1072 A). The higherenergy X-rays were used to obtain diffraction data tohigher values of the wave vector, Q, which is important forthe success of atomic PDF analysis. The measurementswere carried out in symmetric transmission geometry andscattered radiation was collected with an intrinsic germa-nium detector connected to a multi-channel analyzer.
2.5. Thermal analysis
Differential thermal analysis (DTA) was performed witha computer-controlled Shimadzu DTA-50 thermal analy-zer. The crushed powders (�25mg total mass) were sealed
in silica ampoules under reduced pressure (o10�4mbar).A silica ampoule of equal mass was sealed and placed onthe reference side of the detector. The samples were heatedto 850 1C at a rate of 10 1C/min where they wereisothermed for 5min followed by cooling at 10 1C/min toroom temperature.The differential scanning calorimetric (DSC) measure-
ments were carried out with a Setaram DSC141 calori-meter. Temperature and energy calibrations of theinstrument were performed, for different heating rates,using the well-known melting temperatures and meltingenthalpies of high-purity zinc and indium supplied with theinstrument. Bulk-shaped specimens weighing about 7mgwere crimped in aluminum crucibles; an empty aluminumcrucible was used as reference. A constant flow of nitrogenwas maintained to provide a constant thermal blanketwithin the DSC cell, thus eliminating thermal gradients andensuring the validity of the applied calibration standardfrom sample to sample. In the DSC measurements, theheating rate was 10 1C/min.
2.6. Raman scattering
Raman spectra were measured on a Jobin-YvonLABRAM 28 spectrometer equipped with a LINKAMhigh-temperature cell. To eliminate artifacts from oxidativesample decomposition, all the experiments were repeatedwith the samples sealed in silica ampules. A solid-statediode laser was used for all measurements, generating10mW power at an excitation wavelength of 785 nm.Scattered radiation was collected with a CCD. For eachrun, two scans were accumulated at a scanning time of 60 s,generating a spectrum with a resolution of 0.7 cm�1.Raman spectra were also obtained with a HoloprobeRaman spectrograph equipped with a CCD cameradetector using 633 nm radiation from a HeNe laser forexcitation and a resolution of 1 cm�1.
2.7. Thermal conductivity measurements
The thermal conductivity was determined with a long-itudinal steady-state method over the temperature range4–300K. In this case, samples were attached (using either alow melting point solder or silver-loaded epoxy) to the coldtip of the cryostat, while the other end of the sample wasprovided with a small strain gauge resistor (thin film),which serves as a heater. Temperature difference across thesample was measured using differential chromel-constan-tan thermocouple. Both crystalline and glassy KSb5S8materials were measured. The polycrystalline samples werecylindrical in shape with diameter 4mm and length about5mm. Radiation loss is an unavoidable error in all thermalconductivity measurements made using a longitudinalsteady-state technique manifested in deviations from thetrue value that increase with temperature above about200K. In order to determine the radiation loss experimen-tally, we made a subsequent measurement with the sample
synthesized. (b) K0.25Rb0.75Sb5S8 after annealing for 2 h at 300 1C. (c)
KSb5S8 calculated from crystal structure (monoclinic Pn; a ¼ 8.1374 A;
b ¼ 19.5013 A; c ¼ 9.0620 A) [11]. The difference in low-angle peak ((020)
reflection) between the pure K structure and the 75% Rb structure is
0.4021 in 2y.
J.B. Wachter et al. / Journal of Solid State Chemistry 180 (2007) 420–431 423
detached from the heat sink (sample hangs by thinconnecting wires). We determined the amount of heatneeded to supply to the heater that raises the temperatureof the entire sample to the same average temperature asduring the actual measurement of the thermal conductivity.The values of the thermal conductivity were then correctedfor this radiation loss.
2.8. Electronic structure calculations
Electronic structure calculations were performed usingthe self-consistent full-potential linearized augmentedplane wave (LAPW) method [14] within DFT [15], usingthe generalized gradient approximation (GGA) of Perdewet al. [16] for the exchange and correlation potential.Convergence of the self-consistent iterations was per-formed for 20 k points inside the irreducible Brillouin zoneto within 0.0001Ry with a cutoff of �6.0Ry between thevalence and the core states. Scalar relativistic correctionswere included and a spin–orbit interaction was incorpo-rated using a second variational procedure [17]. Thecalculations were performed using WIEN2K program [18].
3. Results and discussion
3.1. Phase-change behavior
Solid solutions of the form K1�xRbxSb5S8 were synthe-sized with x ¼ 0, 0.25, 0.5 and 0.75 by quenching thecorresponding melts in air or water. They were obtained asshiny, gray metallic-like glasses, which are red-purple infine powdered form and are amorphous by powder X-raydiffraction (Fig. 1(b)). The crystalline phases exhibit thesame color difference between bulk and powder, thoughthe crystalline form is a dull, silvery ingot rather thanmirror-like. Powder X-ray diffraction of these samplesobtained after annealing above the crystallization tempera-ture showed them to be isostructural to the parent KSb5S8[19]. The increasing incorporation of the larger Rb atom inK1�xRbxSb5S8 is confirmed by the shift of the (200)reflection in the X-ray diffraction pattern from 9.031 to8.601 in 2y (Fig. 2).
The effect of this substitution on the thermal propertiesof the materials was measured with DTA and DSCexperiments. We observe systematic evolution of thecrystallization as a function of temperature, and in somecases incongruent melting as indicated by the two meltingendotherms. The thermograms of the four differentsamples with x ¼ 0, 0.25, 0.50 and 0.75 are presented inFig. 3 where the glass transition (Tg), the crystallizationpeak (Tp) and the melting point (Tm), considered as theonset of melting peak, temperatures are shown. There is apronounced differentiation in phase-change behavior asthe Rb fraction increases in the compound. As shown bythe sharp exothermic crystallization peaks in the range280–310 1C, each of these glasses is a phase-change materialwith a well-defined crystallization process.
The melting point decreases with Rb enrichment (Fig. 4),which is most probably due to the larger size of Rb+ ascompared to K+ (1.60 A vs. 1.51 A) giving rise to longerand weaker Rb?S bonds thereby softening the lattice.This follows the general trend in alkali metal chalcogenidesof a decrease in melting point with increasing alkali metalsize [20]. This trend is followed until x ¼ 0.50 (eutecticpoint) and then it reverses as we move towards pureRbSb5S8. A similar trend is observed in the crystallizationpeaks. The increase of x (Rb content) up to 0.25 results inquite a small shift of the crystallization peak to lowertemperatures, and then for x40.25 is observed a shift tohigher temperatures, indicating a minimum value at aboutx ¼ 0.25. The shifts in crystallization temperature could beattributed to a destabilization of the glass up to a minimumbetween x ¼ 0.25 and 0.50 (melting point temperaturetrend), and then a ‘‘locking in’’ of the structure nearingtotal K occupancy leading to the increase in the crystal-lization temperature.The compounds TlSb5S8 and RbSb5S8 were not exam-
ined in-depth because of their propensity to phase separatewhen undergoing transitions, both in melting and crystal-lization. The glass formed by melting a stoichiometricmixture of Rb2S and Sb2S3 and quenching it in water wasfound to recrystallize incongruently at 311 and 391 1C,respectively, before melting at 421 1C (Fig. 5(a)). Annealingthe Rb-containing glass at 320 1C showed crystallization toRbSb5S8, RbSbS2, and Sb2S3, as determined with X-raydiffraction.The initial glass of TlSb5S8 crystallizes at 294 1C and
melts rather congruently at 417 1C (Fig. 5(b) and 5(c)).Upon cooling, however, a mixture of the crystalline phasesTlSbS2, Sb2S3, and TlSb5S8 were identified. This is
ARTICLE IN PRESS
200 250 300 350 400 450 500
heat
flo
w (
a.u
.)
T (°C)
200 250 300 350 400 450 500
heat
flo
w (
a.u
.)
T (°C)
200 250 300 350 400 450 500
heat
flo
w (
a.u
.)
T (°C)
200 250 300 350 400 450 500
heat
flo
w (
a.u
.)
T (°C)
Tg
Tp
TmTg
Tp
Tm
Tg
Tp
TmTm
Tp
Tg
a b
c d
Fig. 3. (a) DSC thermograms of K1�xRbxSb5S8 amorphous alloys with heating rate 10 1C/min. (a) x ¼ 0.0, (b) x ¼ 0.25, (c) x ¼ 0.5, and (d) x ¼ 0.75. The
glass transition (Tg) was determined by the intersection of the curve and the half-way line between the two base lines.
x (Rb content)
Tp
Tg
T (
°C)
T (
°C)
0.0 0.2 0.4 0.6 0.8
220
240
260
280
300
380
390
400
410
420
430
440
450
Tm
Fig. 4. Dependence of the glass transition (Tg), crystallization peak (Tp)
and the onset of melting point (Tm) on the Rb content (x).
J.B. Wachter et al. / Journal of Solid State Chemistry 180 (2007) 420–431424
consistent with the phase diagram of the Tl2S/Sb2S3reported previously [21].
3.2. Glass-forming ability (GFA)
GFA as related to the ease of devitrification is a crucialproperty for understanding the origins of glass formationand also important for designing and developing new bulkglasses [22]. In K1�xRbxSb5S8, following the initial heatingtreatment, the samples were cooled from 500 1C to RT atrates 10 and 25 1C/min. It was observed that the parent
KSb5S8 phase (x ¼ 0) crystallizes completely upon slowcooling (10 or 25 1C/min) from 500 1C, whereas forx ¼ 0.25 and 0.50 the compound crystallizes partiallyunder these conditions and complete vitrification wasobserved for x ¼ 0.75. Thus, the incorporation of Rbtends to enhance GFA.The GFA of a melt is evaluated in terms of critical
cooling rate (Rc) for glass formation, which is the minimumcooling rate necessary to keep the melt amorphous withoutprecipitation of crystals during solidification. The smallerthe Rc, the higher the GFA of a system; however, Rc is aparameter that is difficult to measure precisely. As a result,many criteria have been proposed to reflect the relativeGFA on the basis of the characteristic temperaturesmeasured by DTA [23]. The most extensively used criteriaare the reduced glass transition temperature Trg (glasstransition temperature Tg over liquidus temperature Tl ormelting temperature Tm) and the supercooled liquid regionDTxg (the temperature difference between the onset crystal-lization temperature Tx and the glass transition tempera-ture Tg). Generally, the larger the temperature intervalDTxg the higher the GFA. Another parameter Kgl
suggested by Hruby [24] is also used as a measure of theglass-forming tendency of materials:
Kgl ¼ ðTx � TgÞ=ðTm � TxÞ (1)
or K’gl where Tl instead of Tm is used [25]. According toHruby, the higher the value of Kgl in a glass, the higher is
TlSb5S8 first heating, and (c) TlSb5S8 second heating.
Table 1
Dependence on the reduced glass transition temperature Trg, the super-
cooled liquid region DTxg and Hruby parameters Kgl and K0gl from Rb
content for K1�xRbxSb5S8a
K1�xRbxSb5S8 x(Rb) Trg DTxg (K) Kgl K0gl
0.00 0.68 52.7 0.31 0.29
0.25 0.69 58.5 0.48 0.37
0.50 0.71 65.9 0.58 0.48
0.75 0.72 69.9 0.61 0.56
aAt a heating rate of 10 1C/min.
J.B. Wachter et al. / Journal of Solid State Chemistry 180 (2007) 420–431 425
its stability against crystallization on heating and, pre-sumably the higher its vitrifiability on cooling.
In Table 1, we present the values of all the characteristicparameters (Trg, DTxg, Kgl, K0gl) for the K1�xRbxSb5S8system. All the calculated parameters increase with thedecrease in the K+ ion fraction, indicating that glassstability and GFA increase with an increase in x. This
stabilization means that the melt need not be cooled asquickly to afford the glass and implies a much higherenergy barrier of atomic realignment towards the crystalresulting in a slower crystallization speed. This effect isbelieved to be caused by the greater polarizability andlarger size of the Rb atom as compared to K, which resultsin lower mobility in the lattice and slows down theconversion process to the ordered crystalline phase.Furthermore, the longer Rb?S bonds and increasedstructural disorder of the solid solution result in adecreased absolute lattice energy compared to the pristineKSb5S8. This diminishes the thermodynamic driving forceto transform from the higher energy glass state to the lowerlying crystalline state.
3.3. Local structure: crystal versus glass
The structures of crystalline and glassy KSb5S8 andseveral K1�xRbxSb5S8 compositions were probed with X-ray scattering using PDF analysis [26]. Deeper structuralclues were sought as to the nature of glass vis-a-vis crystalby investigating similarities and differences in the structureof both forms at the atomic level. The atomic PDFtechnique has emerged recently as a powerful tool for thecharacterization and structure refinement of materials withintrinsic disorder. The utility of the technique stems fromthe fact that it takes into account the total diffraction, thatis Bragg as well as diffuse scattering, and so it can beapplied to both crystalline [27] and amorphous materials[28]. Therefore, the technique is both a local and anextended structure probe and thus a powerful tool that canbe used to identify differences in structural featuresbetween the crystalline and glassy versions of thesematerials [29].The PDF, G(r), is obtained from the experimentally
determined total-scattering structure function, S(Q), by asine Fourier transform
GðrÞ ¼2
p
Z 10
Q½SðQÞ � 1� sinðQrÞdQ
¼ 4pr½rðrÞ � r0�,
where r is the distance between two atoms and Q themagnitude of the scattering vector, and S(Q) is thecorrected and properly normalized powder diffraction
ARTICLE IN PRESSJ.B. Wachter et al. / Journal of Solid State Chemistry 180 (2007) 420–431426
pattern of the material (also called the structure function).r(r) and r0 are the local and average atomic numberdensities, respectively, and r is the radial distance.Experimental structure functions S(Q) for crystalline andglassy KSb5S8 are shown in Fig. 6 on an absolute scale. Thestructure of crystalline KSb5S8 was analyzed and refinedbased on the PDF data to obtain a basis for the structuralcomparisons of the glass forms and the results were inexcellent agreement with those of the single crystalrefinement [11]. In the glass, the Bragg peaks are lackingand only diffuse scattering is observed; however, the
0 3 6 9 12 15 18 21 24 27 30-0.12
0.00
0.12
0.24
0.36
0.48
0.60
Wavevector Q, Å-1
Q [
S (Q
)-1] KSb5S8 (crystalline)
KSb5S8 (glass)
Fig. 6. Experimental structure functions of crystalline and glassy KSb5S8.
2 4 6 8 10 12 14 16-0.10
-0.05
0.00
0.05
0.10
0.15
2 4 6 8 10 12 14 16-0.10
-0.05
0.00
0.05
0.10
0.15
2 4 6 8 10 12 14 16
0.0
0.5
1.0
1.5
2.0
PDF
G (
r)PD
F G
(r)
PDF
G (
r)
Radial distance r, Å
Fig. 7. (a) PDF plot of crystalline KSb5S8, experimental: black dots, calculated
in KSb5S8.
scattering profile tracks closely the profile of the crystallineform. Beyond 8 A�1, both scattering patterns merge into aslowly oscillating diffuse component.The experimental PDFs for both forms of KSb5S8 are
shown in Fig. 7(a) and (b), respectively. They wereobtained from the synchrotron radiation diffraction datafollowing the usual data reduction procedures describedpreviously [27]. As can be seen in Fig. 7 the experimentalPDFs peak at characteristic distances separating pairs ofatoms and thus reflect the local atomic-scale structure. Inthe crystalline phase, these molecular units are arrangedinto a 3D periodic structure and the correspondingexperimental PDF oscillates out to high interatomicvectors (see Fig. 7(a)). In particular, the first peak in bothPDFs is located between 2.4 and 2.8 A reflecting the Sb–Sbonds in the sample. As determined from the crystalstructure of KSb5S8, there are several SbS6 and SbS7coordination polyhedra with a spread of Sb–S bondlengths. One typical such fragment is shown in Fig. 7(d).The second and third PDF peaks occur at approximately 4and 6 A and reflect mostly the nearest Sb–Sb and S–Satomic neighbor distances and possibly some longer Sb–Sdistances. The three PDF peaks, which occur within thefirst 7 A, correspond to a well-defined and compactstructural fragment of ‘‘SbS7’’ shown in Fig. 7(d). Thecalculated PDF of the molecular ‘‘SbS7’’ fragment is shownfor comparison in Fig. 7(c). It is clear that the threecorrelation peaks due to Sb–S bond and S–S secondneighbor distances are very similar to those observedexperimentally (Fig. 7(a) and (b)). The PDFs of the
18 20
18 20
18 20
3.485 3.739
2.750
2.754
2.438
2.658
2.774
a
b
c
d
: red line, (b) PDF plot of glassy KSb5S8, (c) Sb coordination environment
ARTICLE IN PRESS
100 150 200 250 300 350 400 450 500
-1.0
-0.5
0.0
0.5
1.0
1.5
2.0
(b)
Wavenumber (cm-1)
(a)
343
311
Inte
nsity
282299
325
166
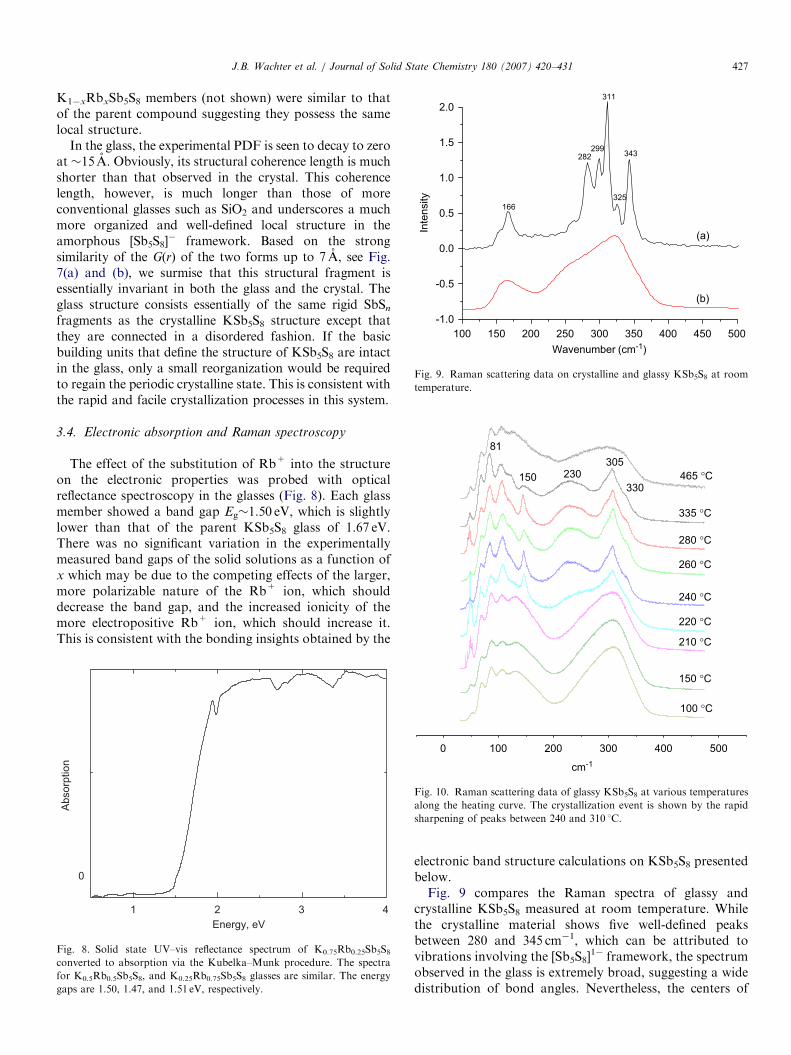
Fig. 9. Raman scattering data on crystalline and glassy KSb5S8 at room
temperature.
210 °C
220 °C
240 °C
260 °C
280 °C
335 °C
465 °C150
81
230305
330
J.B. Wachter et al. / Journal of Solid State Chemistry 180 (2007) 420–431 427
K1�xRbxSb5S8 members (not shown) were similar to thatof the parent compound suggesting they possess the samelocal structure.
In the glass, the experimental PDF is seen to decay to zeroat �15 A. Obviously, its structural coherence length is muchshorter than that observed in the crystal. This coherencelength, however, is much longer than those of moreconventional glasses such as SiO2 and underscores a muchmore organized and well-defined local structure in theamorphous [Sb5S8]
� framework. Based on the strongsimilarity of the G(r) of the two forms up to 7 A, see Fig.7(a) and (b), we surmise that this structural fragment isessentially invariant in both the glass and the crystal. Theglass structure consists essentially of the same rigid SbSn
fragments as the crystalline KSb5S8 structure except thatthey are connected in a disordered fashion. If the basicbuilding units that define the structure of KSb5S8 are intactin the glass, only a small reorganization would be requiredto regain the periodic crystalline state. This is consistent withthe rapid and facile crystallization processes in this system.
3.4. Electronic absorption and Raman spectroscopy
The effect of the substitution of Rb+ into the structureon the electronic properties was probed with opticalreflectance spectroscopy in the glasses (Fig. 8). Each glassmember showed a band gap Eg�1.50 eV, which is slightlylower than that of the parent KSb5S8 glass of 1.67 eV.There was no significant variation in the experimentallymeasured band gaps of the solid solutions as a function ofx which may be due to the competing effects of the larger,more polarizable nature of the Rb+ ion, which shoulddecrease the band gap, and the increased ionicity of themore electropositive Rb+ ion, which should increase it.This is consistent with the bonding insights obtained by the
1 3
Absorp
tion
Energy, eV
0
2 4
Fig. 8. Solid state UV–vis reflectance spectrum of K0.75Rb0.25Sb5S8converted to absorption via the Kubelka–Munk procedure. The spectra
for K0.5Rb0.5Sb5S8, and K0.25Rb0.75Sb5S8 glasses are similar. The energy
gaps are 1.50, 1.47, and 1.51 eV, respectively.
0 100 200 300 400 500
100 °C
150 °C
cm-1
Fig. 10. Raman scattering data of glassy KSb5S8 at various temperatures
along the heating curve. The crystallization event is shown by the rapid
sharpening of peaks between 240 and 310 1C.
electronic band structure calculations on KSb5S8 presentedbelow.Fig. 9 compares the Raman spectra of glassy and
crystalline KSb5S8 measured at room temperature. Whilethe crystalline material shows five well-defined peaksbetween 280 and 345 cm�1, which can be attributed tovibrations involving the [Sb5S8]
1� framework, the spectrumobserved in the glass is extremely broad, suggesting a widedistribution of bond angles. Nevertheless, the centers of
ARTICLE IN PRESSJ.B. Wachter et al. / Journal of Solid State Chemistry 180 (2007) 420–431428
gravity of both spectra roughly coincide, supporting theclose structural resemblance of both phases inferred fromthe PDF study discussed above. The amorphous KSb5S8phase at room temperature shows Raman shifts on top of abroad feature centered at �100–150 cm�1 and a character-istic broad peak in the 250–350 cm�1 range. Essentiallyidentical room temperature spectra were observed for themixed-alkali K1�xRbxSb5S8 glasses, further supporting theinterpretation that all of these spectral features can beattributed to vibrations involving only the frameworkatoms of antimony and sulfur.
To obtain further insight into the local structure of theglass and the phase-change process, we conducted tem-perature-dependent Raman scattering experiments in anattempt to observe the crystallization process in situ. TheRaman spectra as a function of temperature of a KSb5S8glass sample are shown in Fig. 10. As long as thetemperature remained below the glass transition tempera-ture of 220 1C, no significant changes were observed in theRaman spectra of the glass. Above Tg, well-definedfeatures are observable, which are successively developedabove 240 1C. The new features include intense peaks at 81and 150 cm�1, as well as features near 230 and 305 cm�1
with a shoulder near 330 cm�1. When the temperatureexceeded the compound’s melting point, this spectrumdisappeared giving rise to a similar one observed for theglass at room temperature.
While the nucleation of crystals above Tp is easilydetected in the Raman spectra, the comparison of thespectra above 240 1C (Fig. 10) with that of the fully
0 100 200 300 400 500
200 °C
300 °C
cm-1
400 °C
338321
310
298
280
Fig. 11. Raman scattering data of KSb5S8 cooled from the molten state.
Crystallization is evidenced by the sharpened features near 338, 321, 310,
298, and 280 cm�1.
crystallized material (Fig. 9(a)) reveals that the sharpeningof these Raman peaks is only gradual. That the Ramanpeaks do not entirely sharpen in this temperature regionindicates that the nucleated material is still stronglydisordered above Tp, and extra energy is needed to fullycrystallize and ‘‘lock’’ the atoms into their crystallographiccoordinates. DTA studies conducted on KSb5S8 duringmelt cooling reveal no crystallization exotherms, suggestingthe formation of glassy material under these conditions[10]. Nevertheless, Raman spectra obtained during meltcooling (Fig. 11) reveal the same features as those obtainedabove Tp during the heating cycle, indicating that smallcrystalline nuclei have formed under these (relatively slow)cooling conditions. This is most clearly seen by theappearance of peaks near 338, 321, 310, 298, and280 cm�1 (reflecting peak positions observed in crystallineKSb5S8) which become increasingly well-defined withdecreasing temperature. The sizes of the nuclei generallydepend on the cooling rate and in the case of the Ramanexperiments the cooling rate was considerably slower thatthose used in the DTA experiments (101/min).
3.5. Thermal conductivity
In phase-change materials, besides optical response, thethermal behavior is important for reasons involvingheating, quenching and switching speeds, cyclability andsuppression of thermal cross talk [30]. A low thermalconductivity is necessary to ensure fast, localized heatingover a minimum area. Optimization for thermal perfor-mance requires accurate knowledge of the thermal con-ductivity of both glass and crystalline states and it istherefore imperative to have an accurate estimation of thethermal transport properties of these materials. Thethermal conductivity of bulk crystalline and glassy KSb5S8was measured with a steady-state technique over the
0
0.5
1
1.5
2
2.5
0 50 100 150 200 250 300
glassy
crystalline
κ (W
/m.K
)
T (K)
Fig. 12. Temperature dependence of thermal conductivity of the crystal-
line and glassy KSb5S8 (4–300K).
ARTICLE IN PRESSJ.B. Wachter et al. / Journal of Solid State Chemistry 180 (2007) 420–431 429
temperature range of 4–300K (Fig. 12). Because bothforms of KSb5S8 have a very low electrical conductivity(e.g. o10�8 S/cm) the data shown essentially represent thelattice thermal conductivity.
The thermal conductivity of crystalline KSb5S8 exhibitsthe expected Umklapp peak at low temperatures (about8K) and is characteristic of crystalline materials [31]. It iscaused by the competition between the phonon-boundaryscattering and Umklapp phonon–phonon interactions. Onthe other hand, glassy KSb5S8 shows no such peak at lowtemperatures, which is a typical behavior for amorphousmaterials and presents significantly lower values asexpected due to the structural disorder [32].
At higher temperatures, the thermal conductivity forboth samples is similar regarding both magnitude andtrend. The thermal conductivity of crystalline KSb5S8 atroom temperature is an amazingly low 0.4W/mK. Thisvalue in fact represents an upper bound in this family ofmaterials as we expect the solid solutions K1�xRbxSb5S8 tobe even less thermally conducting.
The thermal conductivity of KSb5S8 is lower than that ofGe2Sb2Te5, which is 0.55W/mK [33]. This may appearsurprising since KSb5S8 consists of lighter elements thanGe2Sb2Te5 and is generally expected to have higher latticethermal conductivity [34]. The lower values in the sulfidecompound can be attributed to the characteristically lowercrystal symmetry, the relatively large unit cell, and thepresence of weakly bound K atoms (i.e. K?S ionicbonding). All these are absent in Ge2Sb2Te5. This findingimplies that in certain cases KSb5S8 may have anadvantage over Ge2Sb2Te5 in sustaining smaller spot sizes,and higher packing densities without thermal cross talk.
4. Electronic structure calculations
Electronic structure calculations were performed forKSb5S8 and TlSb5S8 in order to investigate the effect of theK and Tl atoms on the electronic properties of the [Sb5S8]
�
Fig. 13. Electronic band structure o
framework. The band structure results show that bothsystems are indirect band gap semiconductors with similarband gap sizes and assess the extent of ionic bonding. Thegap in KSb5S8 is 1.55 eV, whereas TlSb5S8 has a slightlylower value of 1.50 eV, see Fig. 13. This suggests that thecovalent interaction of Tl atoms with the [Sb5S8]
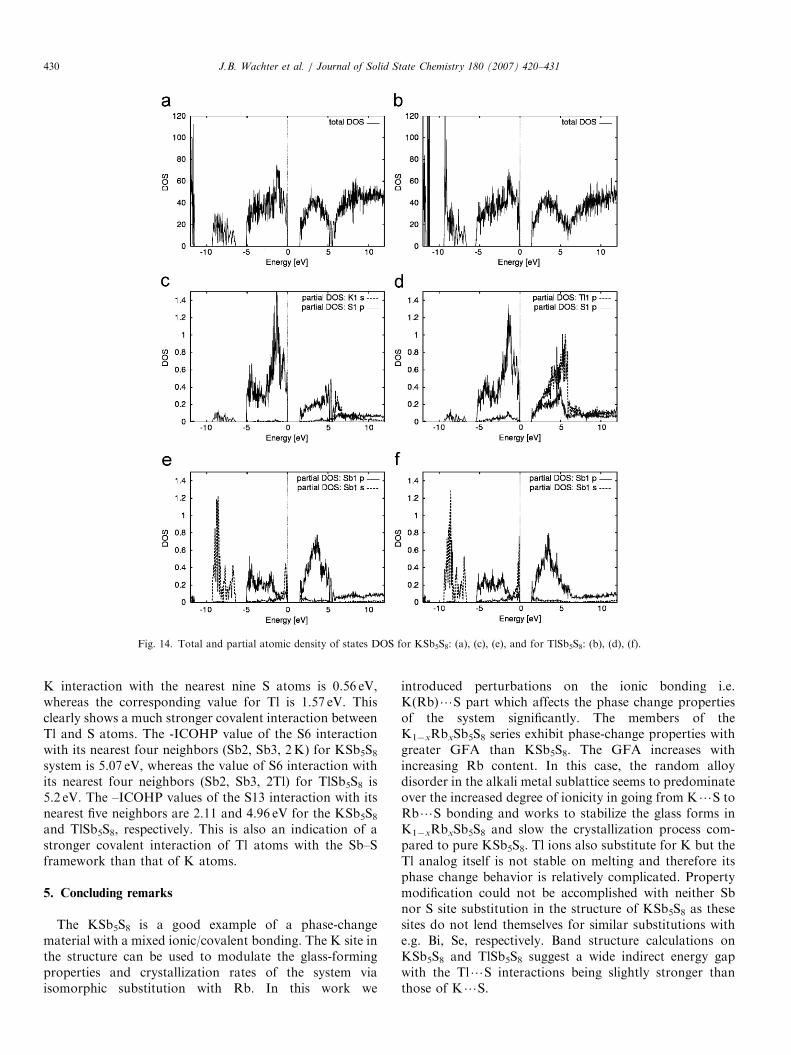
� frame-work is slightly stronger than that of K atoms.Density of states (DOS) analysis shows that the valence
bands for both the systems consist mostly of sulfur porbitals, which hybridize with the Sb p and s orbitals(Fig. 14(c)–(f)). In KSb5S8, the conduction band stateslying below 5 eV consist mostly of hybridized Sb p and S p
orbitals and the K s orbitals are located well above 5 eV(Fig. 14(c) and (e)), consistent with primarily ionic K?Sinteractions. On the other hand, the conduction bandbelow 5 eV of TlSb5S8 consists of Sb p, S p, and Tl p
hybridized orbitals. This shows that the covalent interac-tion between Tl and Sb–S framework is more significantthan the K?S interaction (Fig. 14(d) and (f)) [35].In order to quantitatively describe the covalent interac-
tions between the K and Tl atoms with the Sb–S frame-work, we performed crystal orbital Hamilton population(COHP) analysis, which is a bond-detecting tool for solidsand molecules. COHP partitions the band structure energy(in terms of the orbital pair contributions) into bonding,non-bonding, and antibonding energy regions within aspecified energy range [36]. Positive values of –COHPdescribe bonding energy regions whereas negative valuesdescribe antibonding energy regions. The integrated valuesof –COHP (–ICOHP) up to the Fermi energy give theenergy contribution of the bonds to the total energy. Largepositive values for –ICOHP correspond to strong covalentbonding interaction.We have considered the bonding interactions of K and
Tl atoms with the nearest S atoms up to a distance of 3.4 A.For the S6 and S13 atoms, which are two of the nearest toK and Tl atoms, we have also considered the bondinginteractions up to 3.4 A. The value of the –ICOHP for the
f (a) KSb5S8, and (b) TlSb5S8.
ARTICLE IN PRESS
Fig. 14. Total and partial atomic density of states DOS for KSb5S8: (a), (c), (e), and for TlSb5S8: (b), (d), (f).
J.B. Wachter et al. / Journal of Solid State Chemistry 180 (2007) 420–431430
K interaction with the nearest nine S atoms is 0.56 eV,whereas the corresponding value for Tl is 1.57 eV. Thisclearly shows a much stronger covalent interaction betweenTl and S atoms. The -ICOHP value of the S6 interactionwith its nearest four neighbors (Sb2, Sb3, 2K) for KSb5S8system is 5.07 eV, whereas the value of S6 interaction withits nearest four neighbors (Sb2, Sb3, 2Tl) for TlSb5S8 is5.2 eV. The –ICOHP values of the S13 interaction with itsnearest five neighbors are 2.11 and 4.96 eV for the KSb5S8and TlSb5S8, respectively. This is also an indication of astronger covalent interaction of Tl atoms with the Sb–Sframework than that of K atoms.
5. Concluding remarks
The KSb5S8 is a good example of a phase-changematerial with a mixed ionic/covalent bonding. The K site inthe structure can be used to modulate the glass-formingproperties and crystallization rates of the system viaisomorphic substitution with Rb. In this work we
introduced perturbations on the ionic bonding i.e.K(Rb)?S part which affects the phase change propertiesof the system significantly. The members of theK1�xRbxSb5S8 series exhibit phase-change properties withgreater GFA than KSb5S8. The GFA increases withincreasing Rb content. In this case, the random alloydisorder in the alkali metal sublattice seems to predominateover the increased degree of ionicity in going from K?S toRb?S bonding and works to stabilize the glass forms inK1�xRbxSb5S8 and slow the crystallization process com-pared to pure KSb5S8. Tl ions also substitute for K but theTl analog itself is not stable on melting and therefore itsphase change behavior is relatively complicated. Propertymodification could not be accomplished with neither Sbnor S site substitution in the structure of KSb5S8 as thesesites do not lend themselves for similar substitutions withe.g. Bi, Se, respectively. Band structure calculations onKSb5S8 and TlSb5S8 suggest a wide indirect energy gapwith the Tl?S interactions being slightly stronger thanthose of K?S.
ARTICLE IN PRESSJ.B. Wachter et al. / Journal of Solid State Chemistry 180 (2007) 420–431 431
In-depth studies are needed in chalcogenide systems inwhich the ionic/covalent bonding ratio can be varied. Inthis regard, KSb5S8 and related A/Sb/Q (A ¼ alkali metal,Q ¼ S, Se) phases could be excellent study cases. Ofparticular interest would be to compare the behavior of K/Sb/S systems to that of K/Sb/Se counterparts and suchstudies are currently under way. The glass possessesrelatively long-range order (up to 7 A) compared to mostknown glasses. The glassy and the crystalline states sharelarge, well-defined local coordination polyhedral ‘‘SbS7’’fragments of an approximate length scale of �7 A. Thisrepresents a substantial degree of built-in pre-organizationin the amorphous form that sets the stage for facilecrystallization. Finally, the thermal conductivity of bothglass and crystalline KSb5S8 is among the lowest known forany dense inorganic solid-state material.
Acknowledgments
Support from the NSF (DMR-0443785, NIRT-0304391)is gratefully acknowledged. Thanks are due to M. Benoand Y. Ren from APS, Argonne National Laboratory forthe help with the synchrotron experiments. The AdvancedPhoton Source is supported by DOE under contract W-31-109-Eng-38. We thank Prof. C. Uher and Dr. J. Dyck atthe University of Michigan for the use of their thermaltransport measurement system and for useful discussions.M.K. acknowledges support from the Alexander-von-Humboldt Foundation. The Raman studies are supportedfrom the SFB 458 program of the Deutsche Forschungs-gemeinschaft. T.T. acknowledges a stipend from the NRWGraduate School of Chemistry.
References
[1] (a) L. Hesselink, A. Mijiritskii (Eds.), Advanced data storage
materials and characterization techniques, MRS Proceedings
2003, 803, references therein;
(b) H.J. Borg, R.J. van Woudenberg, Magn. Magn. Mater. 193
(1999) 519–525;
(c) M. Popescu, F. Sava, A. Anghel, A. Lorinczi, I. Kaban, W.J.