j our na l ho me pa g e: www.elsev ier .com/ locate / landurbplan
esearch paper
iew on outdoor vegetation reduces noise annoyance for dwellersear busy roads
imothy Van Renterghem ∗, Dick Botteldoorenhent University, Department of Information Technology, Sint Pietersnieuwstraat 41, B- 9000 Gent, Belgium
i g h l i g h t s
View on vegetation through the living room window strongly reduces noise annoyance.Neighborhood vegetation or indoor plants are not sufficient to reduce annoyance.This perceptional measure is applicable to highly noise exposed dwellers along roads.
r t i c l e i n f o
rticle history:eceived 12 June 2015eceived in revised form 30 October 2015ccepted 29 December 2015
The effect of outdoor vegetation, as seen from the living room’s window facing an inner-city ring road,on the self-reported noise annoyance, was studied. Face-to-face surveys were taken at 105 participantsat their homes in the city of Ghent (Belgium). The living room window, facing the road, was in all caseshighly exposed to road traffic noise and characterized by Lden levels between 65 and 80 dBA, as takenfrom the official European Environmental Noise Directive’s city road traffic noise map. All houses wereselected to have a pronounced front-back level difference to rule out this effect. The self-reported extentto which vegetation is visible through the living room window was shown to be a strong and statisticallysignificant predictor of the self-reported noise annoyance. The complete absence of view on vegetationresults in a 34% chance of being at least moderately annoyed by noise, while this chance reduced to 8%
for respondents answering to have a very pronounced vegetation view, notwithstanding median Ldenlevels of 73 dBA at the street-facing facade of the dwelling. Real vision on outdoor vegetation was shownto be essential - living room (indoor) plants and the mere presence of vegetation in the neighborhood isinsufficient. Road traffic noise facade insulation, measured in-situ at each dwelling, could not be linkedto the self-reported noise annoyance.
Along major arterial roads and city ring roads, the noise levelso which dwellers are exposed can be very high, leading to seri-us health risks (Fritschi, Brown, Kim, Schwela, & Kephalopoulos,011). As the basic function of such roads is providing sufficientraffic throughput, this leads to inevitably high noise levels. Inase of optimal urban environmental planning, dwellers shouldot appear there. However, in many countries, mainly due to city
xpansion, such zones become inhabited to an increasing extent.
The traditional measures to deal with road traffic noise prob-ems, more precisely source level reduction (quieter engines, tire
optimization, low-noise pavements, . . .) (Sandberg & Ejsmont,2002), achieving noise reduction during propagation betweensource and receiver (Kotzen & English, 2009; Van Renterghemet al., 2015) (noise walls, earth mounds, exploiting ground-relatedeffects, . . .), and providing sufficient acoustical fac ade insulation,all have their merits. But clearly, there are many issues with thesefor the specific application along city ring roads: there is often alack of available space for propagation related measures or thesemight be visually intrusive, and the technological improvementwith relation to the noise emission of individual vehicles and roadcoverings is a steady but slow process. In addition, low-noise pave-ments typically need maintenance, regular replacement and onlyreduce rolling noise, making this often a less attractive solution.
Even fac ade insulation is only part of the solution: people openwindows resulting in an almost complete loss of insulation (Jean,2009). This means that additional approaches are needed to com-
lement these traditional measures to improve the noise climatet such highly exposed dwellings.
An approach that has been successfully applied is providingwellers with a quiet side, either by building and street design (e.g.nsuring connected building rows (Gidlöf-Gunnarsson, Öhrström,
Forssén, 2012) and by traffic management (Salomons et al.,009)). Essential in this respect is a pronounced front-back fac ade
evel difference (END, 2002), compensating for the exposure at theoud side (Öhrstrom, Skanberg, Svensson, & Gidlöf-Gunnarsson,006). Clearly, some limits have to be set regarding the maxi-um level at the shielded fac ade as discussed by Öhrstrom et al.
2006). The presence of such a non-directly exposed fac ade washown to significantly reduce the self-reported noise annoyancend self-reported sleep disturbance based on surveys in differ-nt European countries (Bodin, Björk, Ardö, & Albin, 2015; deluizenaar, Salomons, & Janssen, 2011; Gidlöf-Gunnarsson et al.,012; Gidlöf-Gunnarsson & Öhrström, 2010; Öhrstrom et al., 2006;an Renterghem & Botteldooren, 2012).
In general, the human perception of noise is strongly influencedy the visual scenery (see e.g. Fastl, 2004). Also for the specific casehen vegetation is involved, positive effects have been reported.iollon, Lavandier, & Drake (2002) showed that artificial sounds like
oad traffic noise are perceived less stressful and less unpleasanthen the visual setting was less urban or greener. Attractiveness
f courtyards, e.g. linked to the presence of vegetation, was foundo be an important modifier when studying the aforementioneduiet side effect (Bodin et al., 2015; Gidlöf-Gunnarsson & Öhrström,007). Li, Chau, & Tang (2010) held surveys indicating that vis-
ble greenery is able to reduce noise annoyance for residents ofigh-rise buildings overlooking urban parks and wetlands. Visibleatural features were shown to be relevant predictors of tranquilityPheasant, Horoshenkov, Watts, & Barrett, 2008; Watts, Pheasant,
Horoshenkov, 2011). In another study, it was reported that land-cape plants provide excess noise attenuation through the subjects’motional processing based on analysis of electroencephalogramsYang, Bao, Zhu & Yang, 2011). Aylor & Marks (1976) and Aylor1977) concluded that as long as the source of sound can be seen,eduction in the visibility of the source, amongst others by vegeta-ion, is accompanied by a reduction in apparent loudness. However,hen vegetation fully visually screens the source there is a reversed
ffect namely an increase in noisiness, the latter consistent withndings by Watts, Chinn, & Godfrey (1999). Zhang, Shi, & Di (2003)eported that hedges that make passing vehicles invisible resultedn significantly less noise annoyance, and that such improvementsre even more pronounced at higher noise levels. Vegetation onoise walls not only improved the overall environmental quality,ut also enhanced the perceived noise attenuation performanceHong & Jeon, 2014).
In addition to the potential of improving the perceived noisenvironment, there is an extended evidence base that a nat-ral and green urban scenery is beneficial for general humanealth (De Vries, Verheij, Groenewegen, & Spreeuwenberg, 2003;aplan & Kaplan, 1989; Thompson, 2011; Thompson, Roe, Aspinall,itchell, Clow, & Miller, 2012; Tzoulas, Korpela, Venn, Yli-
The main aim of this study is to see how the self-reportedmount of visible vegetation through the living room window influ-nces the dweller’s self-reported noise annoyance. Many studiesiming at elucidating the audio-visual interactions are typicallyell controlled but rather artificial in their setup by using pro-
ections on screens in laboratories and/or by offering (very) short
coustic stimuli (e.g. Hong & Jeon, 2013; Hong & Jeon, 2014; Joynt
Kang, 2010; Preis, Kocinski, Hafke-Dys, & Wrzosek, 2015; Viollont al., 2002; Watts et al., 1999; Yang, Bao, & Zhu, 2011). In suchxperiments, soundscape characteristics like noisiness, pleasant-
and Urban Planning 148 (2016) 203–215
ness, stressfulness, comfort, harmony and others are then assessed.The focus in the current study is on the residents’ experiencesin their ordinary living environments, ensuring ecological validityand allowing to assess (long-term) self-reported noise annoyance.Noise annoyance is an important noise policy indicator, and oneof the health-endpoints of environmental noise as identified byFritschi et al. (2011). Furthermore, the focus is here on the effect ofthe mere presence of vegetation in a zone highly exposed to roadtraffic noise and not necessarily vegetation as a means of hiding thenoise source or in relation to traditional noise walls (Aylor, 1977;Aylor & Marks, 1976; Hong & Jeon, 2014; Joynt & Kang, 2010; Wattset al., 1999; Zhang et al., 2003).
2. Methodology
2.1. Participant selection
Participants were selected along different sections of a highlynoise-exposed inner city ring road in Ghent, Belgium, characterizedby either an abundance of vegetation (street trees, parks borderingthe road, vegetation on the central reservation, etc.) or a lack ofvegetation. Such sufficiently contrasting parts of the ring road wereselected in advance based on aerial photographs.
Dwellings directly bordered the ring road and were part ofclosed-row building blocks with enclosed backyards and shouldtherefore have a similar and pronounced front-back level differ-ence. Corner houses were not selected. Given the high road trafficnoise levels at the front fac ade, it can reasonably be assumed thatthe ring road dominates the soundscape at the shielded fac ade aswell.
Participants were directly contacted, without prior announce-ment, by knocking on doors. The survey was announced as generalresearch on the living environment. The minimum age for respon-dents was 18 years. Before starting the survey, the number of yearsliving at the dwelling was asked for and it was checked that theparticipants were living at least 1 year at their current location.It was ensured by the interviewer that the dwelling had a livingroom window facing the ring road. A single interviewer performedall 105 face-to-face questionnaires. The surveys were taken duringsummer in a two week’s period. Multiple participants were allowedper dwelling, but interviewed separately. No informed consent wasasked from the respondents.
2.2. Noise exposure assessment
2.2.1. Most exposed fac ade level LdenThe noise exposure at the most exposed fac ade was extracted
from the road traffic noise map approved by the Flemish regionalgovernment for the agglomeration of Ghent, which has beenreported to the European Commission in the framework of the Envi-ronmental Noise Directive (END, 2002). Such strategic noise mapspredict long-term yearly-averaged noise indicators. For the currentstudy, Lday (i.e. the equivalent sound pressure level during daytime,from 7.00 h until 19.00 h) and Lden (i.e. the equivalent sound pres-sure level over a 24-hour period, including penalties for the eveningand night period) were considered. The front-door position of thedwelling was taken as a reference point, and the average of the noiselevels within 7.5 m was calculated since sound pressure levels couldvary along longer fac ades.
Although often concerns are raised related to the accuracy ofsuch strategic noise maps, levels near busy roads, as those con-
sidered in the current study, are reasonably accurate since noiselevels are strongly source driven there. Only large deviations fromthe actual traffic intensity or composition would lead to significanterrors in the predictions. For less trafficked roads or at shielded
scape
uBÖ
2
tatlmfi(pafo1icq&lct
wslidwmctdimaoTsi0
2
icgbpedawIba
ssIo1
T. Van Renterghem, D. Botteldooren / Land
rban locations, predictions are typically much less accurate (Wei,otteldooren, Van Renterghem, Hornikx, Forssén, Salomons, &gren, 2014).
.2.2. Living room window insulationFac ade/window insulation was measured at each dwelling after
he survey was taken by simultaneous short-term measurementst the front door (microphone membrane facing the road) and inhe living room (microphone membrane facing the window over-ooking the street). Two identical type-1 accredited sound level
easurement chains were used, consisting of an ½” electret free-eld microphone (type MK250B, Microtech Gefell), a pre-amplifier
SV12, Svantek) and a logging unit (SV959, Svantek). The micro-hone capsule used has a flat frequency response over the fulludible frequency range, with deviations less than 1 dB up to 15 kHzor normal incident sound. Both measurement chains were placedn a tripod with the microphone membrane at a height of about.5 m above the floor/ground. The sound level meters were cal-
brated at the start of each day with a 94-dB type-1 acousticalibrator (SV30A, Svantek), producing a pure tone at a sound fre-uency of 1 kHz. A 90-mm diameter windscreen (UA0237, Bruel
Kjaer) was used to limit wind-induced microphone noise. Theoggers were manually time-synchronized, and before further pro-essing, the 1/3-octave band sound pressure levels were aggregatedo 5-s periods.
Based on the measurements near the front-door, car passagesere selected and the difference between the indoor and outdoor
ound pressure levels at the corresponding moments were calcu-ated as an indicator for the fac ade/window insulation. As theres some inherent variation in the insulation calculated in this wayuring various car passages at a single survey point, the mediansere used for further analysis. True fac ade insulation measure-ents (see e.g. ISO 10140-2, 2010) are too time-consuming to
onduct at 105 dwellings. The proposed methodology has never-heless some advantages: the real road traffic noise sources andriving conditions at the specific location are considered, the typ-
cal range of angles of incidence on the window are included (thatight alter the acoustic response), and such relative measurements
llow estimating the spectral insulation properties. The influencef the acoustic response of the living room has not been assessed.he current level difference approach is therefore equivalent to thetandardized airborne sound insulation indicator DnT, as describedn ISO 140-4, with a reverberation time T0 (in the receiver room) of.5s.
.3. Survey description
The survey started with a number of general questions concern-ng the quality of the living environment, and possible annoyancesaused by environmental stressors. The first question looked at theeneral satisfaction regarding the quality of living in the neigh-orhood of the dweller, with indication of some examples ofarameters to be taken into account (“e.g. safety, child-friendly,nvironment, . . .”). A 5-point categorical scale was offered asetailed in Table 1. Next, it was asked if the respondent woulddvise friends or relatives to come live in his or her neighborhoodhen considering the quality of the living environment. Then, the
SO-standardized question (2003) was asked regarding annoyancey noise, odor, light and street littering (see Table 1). Finally, it wassked to rate neighborhood safety.
In a second part, more detailed information about possibleources of noise annoyance was looked for (see Table 1) and the
ame scale was used as for the general noise annoyance question.n addition, noise sensitivity was assessed using a Dutch adaptationf the widely used Weinstein’s noise-sensitivity scale (Weinstein,978), used previously in large-scale Flemish quality-of-life stud-
and Urban Planning 148 (2016) 203–215 205
ies. This part contained 10 questions, and some questions werereversed to keep the respondents attentive.
In a third part, it was asked to rate the view from the living roomwindow towards the street on a 5-point categorical scale rangingfrom ”extremely green” to “no green at all”, followed by a simi-lar question concerning the presence of plants in the living room.A next question asked for neighborhood greenery. A last ques-tion regarding vegetation assessed how important neighborhoodor street green is for the respondent.
Next it was announced that the fac ade insulation would be mea-sured, and it was asked how often the living room window, facingthe road, was opened in general and during hot weather. In addi-tion, it was asked how many hours the dweller typically spends inhis living room during weekdays and weekends.
To finish, some personal questions were asked about gender,age, education and professional activities. A picture was taken fromthe front-door position facing the street.
2.4. Statistical analysis
Given the rather limited number of respondents in the dataset(N = 105), classification to dichotomous variables has been per-formed in order to have sufficient occurrences in the differentcells when using frequency tables. The Chi-square test has beenapplied to check dependency between variables. Odds Ratios (OR)have been calculated, and logistic regression is used to predictconfidence intervals on these. Logistic regression with a dichoto-mous outcome (true or false) has been used, based on continuous,dichotomous, or categorical independent variables. In order to bestatistically sound, 95% confidence intervals on the ORs should notcontain 1. Effect modifiers have been studied by multiple logis-tic regression. Statistical significance of model deviance reductionwhen including an additional variable has been checked by likeli-hood ratio testing (based on the Chi-square distribution).
3. Results
3.1. Respondents’ characteristics
An overview of the dwelling’s and respondents’ characteristicsis shown in Table 2. In the current dataset, 57 respondents (54%)were female, 48 respondents (46%) were male. 55 persons (52%)were under the age of 50, 50 participants (48%) were older. 62% ofthe dwellers reported to have received higher education (after sec-ondary school). The aforementioned noise sensitivity test indicatedmainly noise-insensitive persons; only 23 persons (22%) gave, onaverage, an answer larger than or equal to 3 on the 1-to-5 scale usedto assess noise sensitivity. Dwellers living between 1 and 5 years attheir current location were most frequently met (40%); those liv-ing between 5 and 15 years, and more than 15 years, are of equalimportance (30%). Most respondents were full time working (35%)or retired (31%), the percentage students (13%) and those in the restgroup (20%) show that a good social mix is present in the dataset.The 105 persons interviewed originated from 75 unique dwellings.
3.2. Noise exposure characteristics
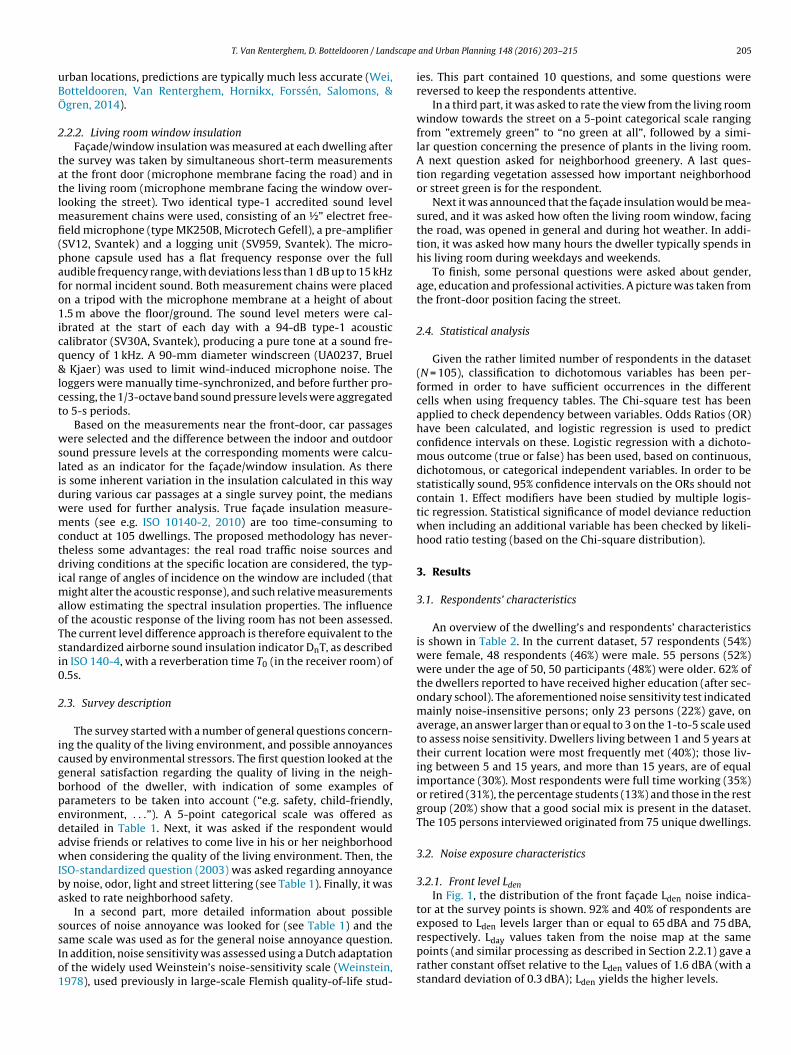
3.2.1. Front level LdenIn Fig. 1, the distribution of the front fac ade Lden noise indica-
tor at the survey points is shown. 92% and 40% of respondents areexposed to Lden levels larger than or equal to 65 dBA and 75 dBA,
respectively. Lday values taken from the noise map at the samepoints (and similar processing as described in Section 2.2.1) gave arather constant offset relative to the Lden values of 1.6 dBA (with astandard deviation of 0.3 dBA); Lden yields the higher levels.
206 T. Van Renterghem, D. Botteldooren / Landscape and Urban Planning 148 (2016) 203–215
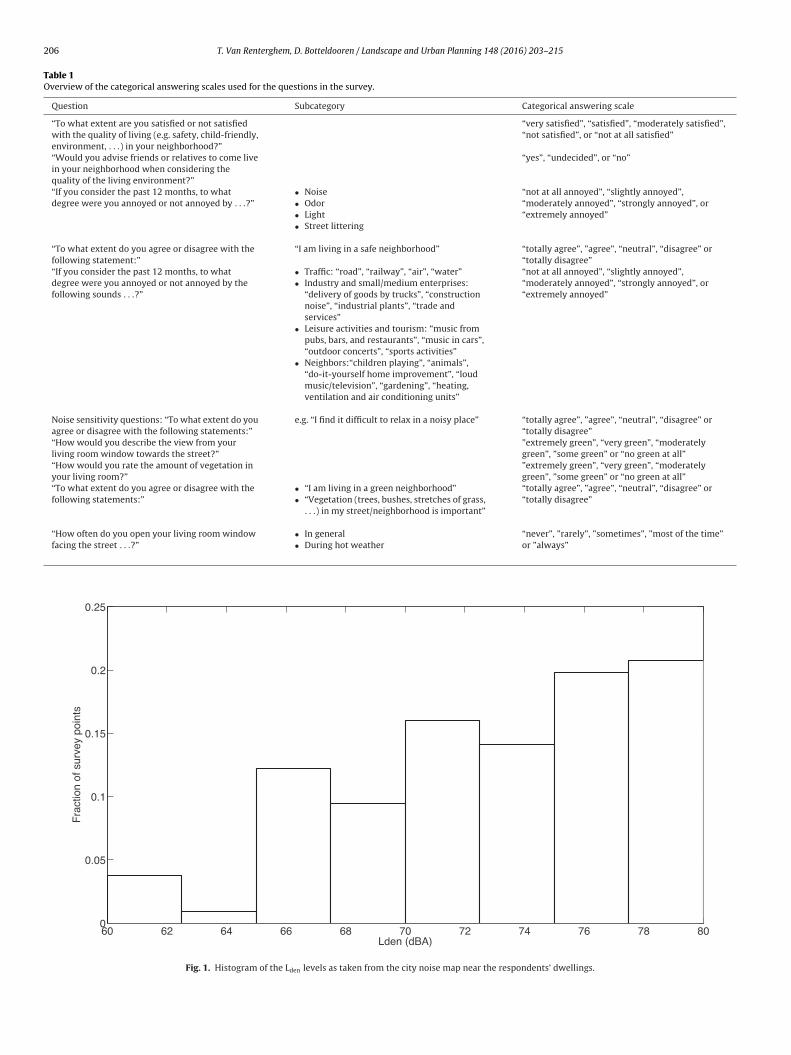
Table 1Overview of the categorical answering scales used for the questions in the survey.
Question Subcategory Categorical answering scale
“To what extent are you satisfied or not satisfiedwith the quality of living (e.g. safety, child-friendly,environment, . . .) in your neighborhood?”
“very satisfied”, “satisfied”, “moderately satisfied”,“not satisfied”, or “not at all satisfied”
“Would you advise friends or relatives to come livein your neighborhood when considering thequality of the living environment?”
“yes”, “undecided”, or “no”
“If you consider the past 12 months, to whatdegree were you annoyed or not annoyed by . . .?”
• Noise• Odor• Light• Street littering
“not at all annoyed”, “slightly annoyed”,“moderately annoyed”, “strongly annoyed”, or“extremely annoyed”
“To what extent do you agree or disagree with thefollowing statement:”
“I am living in a safe neighborhood” “totally agree”, ”agree”, “neutral”, “disagree” or“totally disagree”
“If you consider the past 12 months, to whatdegree were you annoyed or not annoyed by thefollowing sounds . . .?”
• Traffic: “road”, “railway”, “air”, “water”• Industry and small/medium enterprises:
“delivery of goods by trucks”, “constructionnoise”, “industrial plants”, “trade andservices”
• Leisure activities and tourism: “music frompubs, bars, and restaurants”, “music in cars”,“outdoor concerts”, “sports activities”
• Neighbors:“children playing”, “animals”,“do-it-yourself home improvement”, “loudmusic/television”, “gardening”, “heating,ventilation and air conditioning units”
“not at all annoyed”, “slightly annoyed”,“moderately annoyed”, “strongly annoyed”, or“extremely annoyed”
Noise sensitivity questions: “To what extent do youagree or disagree with the following statements:”
e.g. “I find it difficult to relax in a noisy place” “totally agree”, ”agree”, “neutral”, “disagree” or“totally disagree”
“How would you describe the view from yourliving room window towards the street?”
”extremely green”, “very green”, “moderatelygreen”, ”some green” or “no green at all”
“How would you rate the amount of vegetation inyour living room?”
”extremely green”, “very green”, “moderatelygreen”, ”some green” or “no green at all”
“To what extent do you agree or disagree with thefollowing statements:”
• “I am living in a green neighborhood”• “Vegetation (trees, bushes, stretches of grass,. . .) in my street/neighborhood is important”
“How often do you open your living room windowfacing the street . . .?”
• In general• During hot weather
“never”, ”rarely”, ”sometimes”, ”most of the time”or ”always”
60 62 64 66 68 70 72 74 76 78 800
0.05
0.1
0.15
0.2
0.25
Lden (dBA)
Fra
ctio
n of
sur
vey
poin
ts
Fig. 1. Histogram of the Lden levels as taken from the city noise map near the respondents’ dwellings.
T. Van Renterghem, D. Botteldooren / Landscape and Urban Planning 148 (2016) 203–215 207
Table 2Overview of the dwelling and respondent characteristics/answers grouped by self-reported vegetation view; “green view” means an at least moderate degree of vegetationas seen from the living room window towards the street, while “no green visual” groups the “some green” and “no green at all” answers. The number of respondents is givenin each category (N = 105).
Yes 37 28Noise sensitivity Not sensitive (<3.0) 49 33
Sensitive (≥3.0) 12 11Employment Full-time 17 20
Student 6 8Retired 27 6Part-time, unemployed and housewife/man 11 10
3
degg(aflsoiTtha
Years living at location Less than 5 years
Between 5 and 15 years
More than 15 years
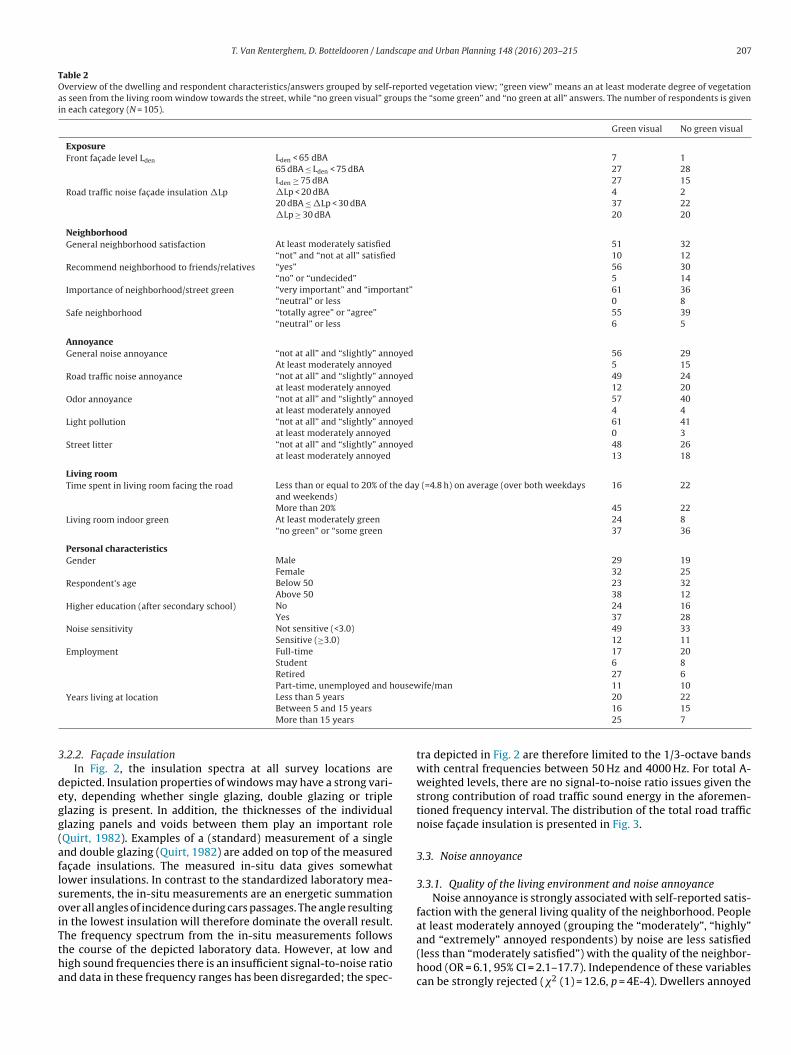
.2.2. Fac ade insulationIn Fig. 2, the insulation spectra at all survey locations are
epicted. Insulation properties of windows may have a strong vari-ty, depending whether single glazing, double glazing or triplelazing is present. In addition, the thicknesses of the individuallazing panels and voids between them play an important roleQuirt, 1982). Examples of a (standard) measurement of a singlend double glazing (Quirt, 1982) are added on top of the measuredac ade insulations. The measured in-situ data gives somewhatower insulations. In contrast to the standardized laboratory mea-urements, the in-situ measurements are an energetic summationver all angles of incidence during cars passages. The angle resulting
n the lowest insulation will therefore dominate the overall result.
he frequency spectrum from the in-situ measurements followshe course of the depicted laboratory data. However, at low andigh sound frequencies there is an insufficient signal-to-noise rationd data in these frequency ranges has been disregarded; the spec-
20 2216 1525 7
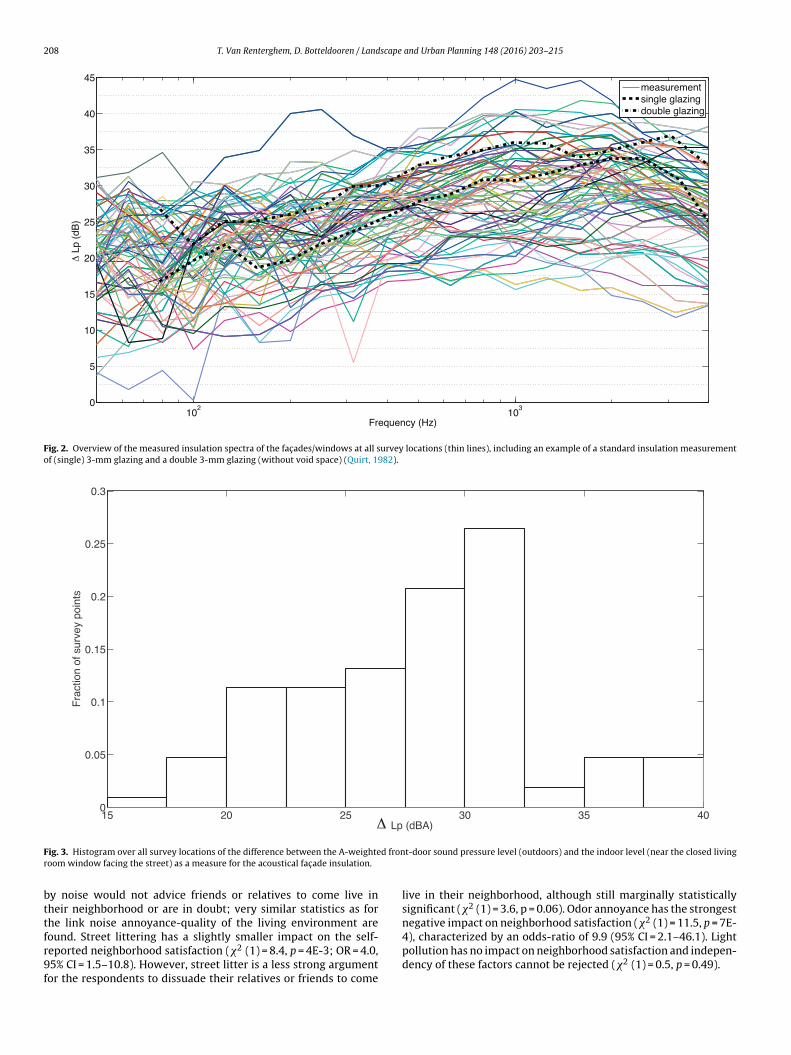
tra depicted in Fig. 2 are therefore limited to the 1/3-octave bandswith central frequencies between 50 Hz and 4000 Hz. For total A-weighted levels, there are no signal-to-noise ratio issues given thestrong contribution of road traffic sound energy in the aforemen-tioned frequency interval. The distribution of the total road trafficnoise fac ade insulation is presented in Fig. 3.
3.3. Noise annoyance
3.3.1. Quality of the living environment and noise annoyanceNoise annoyance is strongly associated with self-reported satis-
faction with the general living quality of the neighborhood. Peopleat least moderately annoyed (grouping the “moderately”, “highly”
and “extremely” annoyed respondents) by noise are less satisfied(less than “moderately satisfied”) with the quality of the neighbor-hood (OR = 6.1, 95% CI = 2.1–17.7). Independence of these variablescan be strongly rejected (�2 (1) = 12.6, p = 4E-4). Dwellers annoyed
208 T. Van Renterghem, D. Botteldooren / Landscape and Urban Planning 148 (2016) 203–215
102
10 3
0
5
10
15
20
25
30
35
40
45
Frequency (Hz)
Lp
(dB
)
measurementsingle glazingdouble glazing
Fig. 2. Overview of the measured insulation spectra of the fac ades/windows at all survey locations (thin lines), including an example of a standard insulation measurementof (single) 3-mm glazing and a double 3-mm glazing (without void space) (Quirt, 1982).
15 20 25 30 35 400
0.05
0.1
0.15
0.2
0.25
0.3
Lp (dBA)
Fra
ctio
n of
sur
vey
poin
ts
F d fronr
bttfr9f
ig. 3. Histogram over all survey locations of the difference between the A-weighteoom window facing the street) as a measure for the acoustical fac ade insulation.
y noise would not advice friends or relatives to come live inheir neighborhood or are in doubt; very similar statistics as forhe link noise annoyance-quality of the living environment are
ound. Street littering has a slightly smaller impact on the self-eported neighborhood satisfaction (�2 (1) = 8.4, p = 4E-3; OR = 4.0,5% CI = 1.5–10.8). However, street litter is a less strong argumentor the respondents to dissuade their relatives or friends to come
t-door sound pressure level (outdoors) and the indoor level (near the closed living
live in their neighborhood, although still marginally statisticallysignificant (�2 (1) = 3.6, p = 0.06). Odor annoyance has the strongestnegative impact on neighborhood satisfaction (�2 (1) = 11.5, p = 7E-
4), characterized by an odds-ratio of 9.9 (95% CI = 2.1–46.1). Lightpollution has no impact on neighborhood satisfaction and indepen-dency of these factors cannot be rejected (�2 (1) = 0.5, p = 0.49).
scape
t“aeCwnlesal
3
asa4asrastuw
wwsfootnpc
3
ba0ffaLrrNfevl
relprat
a
T. Van Renterghem, D. Botteldooren / Land
The self-reported neighborhood safety (“fully agree” or “agree”o live in a safe neighborhood versus being “neutral”, “disagree” ortotally disagree”) is a strong predictor of the general neighborhoodppreciation (�2 (1) = 13.5, p = 2E-4) and has a strong dissuadingffect towards friends and relatives to come live there (OR = 7.5, 95%I = 2.0–28.1). There is a tendency towards more noise annoyancehen respondents feel unsafe, but the latter is not statistically sig-
ificant. The links between odor annoyance and safety, and streetittering and safety, are statistically significant at the 5% level. How-ver, some care is needed when analyzing links with neighborhoodafety as only 10% of the respondents declares to be neutral or dis-gree with living in a safe neighborhood; some combinations haveess than 5 occurrences in the corresponding frequency tables.
.3.2. Noise annoyance sourcesThere is a strong link between (general) environmental noise
nnoyance, and noise annoyance by road traffic noise. Both aretrongly linked (�2 (1) = 23.1, p = 2E-6). The general noise annoy-nce question reveals that 53% of the respondents are not annoyed,7% are at least slightly annoyed, 19% are at least moderatelynnoyed, and 8% are at least highly annoyed (see Table 3). Thepecific question on road traffic noise yields 47% not-annoyedespondents, 53% at least slightly annoyed, 30% at least moderatelynnoyed, and 8% at least highly annoyed answers. A linear (Pear-on’s) correlation coefficient R = 0.66 between general and roadraffic noise annoyance is obtained (p < 1E-6). Clearly, this is notnexpected as survey locations with a high road traffic fac ade loadere deliberately looked for.
Other types of traffic noise annoyance sources (aircrafts, rail-ay traffic and ships) were fully absent (100% of the respondentsere not annoyed by these). All other potential noise annoyance
ources like neighborhood noise and recreational noise ended upor 95% in the “not annoyed” or “slightly annoyed” class. There isnly one exception namely construction noise (see Table 3); 11%f the respondents call themselves at least moderately annoyed byhis type of sound. However, construction noise annoyance couldot be convincingly linked to general noise annoyance (�2 (1) = 1.8,
= 0.18) in the studied area. Consequently, the linear (Pearson’s)orrelation coefficient is limited (R = 0.26, p = 0.01).
.3.3. Noise annoyance and front fac ade LdenLogistic regression between continuous Lday or Lden and the
inary-coded self-reported noise annoyance (at least moderatelynnoyed versus “slightly” and “not” annoyed) gives p-values of.24 and 0.25, respectively. This indicates that the most exposedac ade road traffic noise level indicators have no predicting poweror annoyance in this study. The most probable reason is that almostll levels at the survey points can be considered as high; 63% of theday levels and 71% of the Lden levels exceed 70 dBA. Therefore, theange of levels in this study is too narrow to derive standard dose-esponse relationships between fac ade level and noise annoyance.ote, however, that the survey points were deliberately selected
or high noise levels in a range as narrow as possible to rule out thisffect; the main interest in this study is analyzing self-reportediew on vegetation on the self-reported noise annoyance with aimited number of interviewed respondents.
Using either Lden or Lday as noise indicator yields very similaresults given the aforementioned rather constant offset. One couldxpect that Lden would be a more appropriate choice when ana-yzing general noise annoyance, while Lday would be the suitablearameter for looking at the visual aspect of perception since lesselevant at night. Lden has been used in the remainder of this article
nd this choice does not influence the findings and hardly changeshe reported odds-ratios and p-values.
In the Lden-level range below 65 dBA, more respondents report high degree of vegetation as seen from the living room window
and Urban Planning 148 (2016) 203–215 209
(see Table 2). However, only 8 respondents fall in this level category.Between 65 and 75 dBA, the number of respondents in the “green”and “no green” class is nearly the same. At the highest level class,above 75 dBA, more persons indicate to be looking at vegetation. Alinear regression between (continuous) Lden and vegetation view(using the original 5-point scale) shows that with increasing levelthe self-reported view moves to more vegetation, but the Pearson’scorrelation coefficient is rather limited (R = 0.14) and the model isnot statistically significant at the 5% significance level (p = 0.26).A positive association between a vegetation view and low levels,that could bias conclusions drawn from this survey, is clearly notpresent.
3.3.4. Noise annoyance and living room window insulationFac ade insulation was shown be an irrelevant predictor for noise
annoyance in this study. Logistic regression between insulation(continuous variable, total A-weighted insulation for road trafficpresent near the dwelling) and the dichotomous noise annoyanceindicator (at least moderately annoyed versus “slightly” and “not”annoyed) yields a p-value of 0.37. Using a sub-selection of per-sons that at maximum sometimes open their living room window(N = 55), this p-value further increases to 0.80, indicating that apossible association between insulation and annoyance would by(nearly) purely random. Only considering the low-frequency insu-lation performance at the dwellings, here (arbitrary) defined from50 Hz to 200 Hz, yields a similar p-value of 0.78. It was further con-firmed that the obtained insulation parameter does not dependon the front-level Lden; correlation between these two is nearlyabsent (R = − 0.01, p = 0.94). This gives confidence in the measure-ment technique and signal processing.
The experimentally obtained insulation parameter and thedichotomous self-reported view on vegetation are negatively asso-ciated (logistic regression p-value of 0.02); there is a slightly higherinsulation appearing in dwellings without view on vegetation(OR = 1.1, 95% CI = 1.0–1.3). A positive association between vegeta-tion view and high fac ade insulation, which could bias conclusionsdrawn from this survey, is not present.
3.3.5. Noise annoyance and personal characteristicsDiploma (dichotomously coded in “higher education” versus “at
maximum secondary school finished”), noise sensitivity (dichoto-mously coded, linearly averaged noise sensitivity responses smallerthan or equal to 3 versus larger than 3) and gender show no statis-tically significant dependence with the dichotomous self-reportednoise annoyance. Although typically some associations betweenpersonal characteristics and noise annoyance are found in largescale surveys (see e.g. Van Gerven, Vos, Van Boxtel, Janssen, &Miedema, 2009), the limited number of respondents in the cur-rent study is not suited for such analysis. In addition, the currentsurvey was not designed to reveal such personal links with noiseannoyance. For a discussion of the effect of age and years living atthe dwelling, the reader is referred to Section 3.3.6.
3.3.6. Noise annoyance and view on vegetationThe chance of being at least moderately annoyed by noise in
presence of an at least moderate view on vegetation through the liv-ing room window in the current dataset is only 8%, while this chanceincreases to 34% when there is at maximum some vegetation visiblethrough the window. Although the front fac ade exposure, follow-ing the noise map that was used, is high at all survey locations,view on vegetation could strongly reduce self-reported annoyanceto an acceptable level. It has to be stressed that all dwellings were
selected to have a pronounced quiet side, a factor of importanceas found in other studies (see Introduction), and also in the sameregion (Van Renterghem & Botteldooren, 2012). But even underthese conditions, the view on vegetation could further reduce envi-
210 T. Van Renterghem, D. Botteldooren / Landscape and Urban Planning 148 (2016) 203–215
Table 3Noise annoyance sources for which at least 5% of the respondents report to be at least moderately annoyed.
Not annoyed Slightly annoyed Moderately annoyed Highly annoyed Extremely annoyed
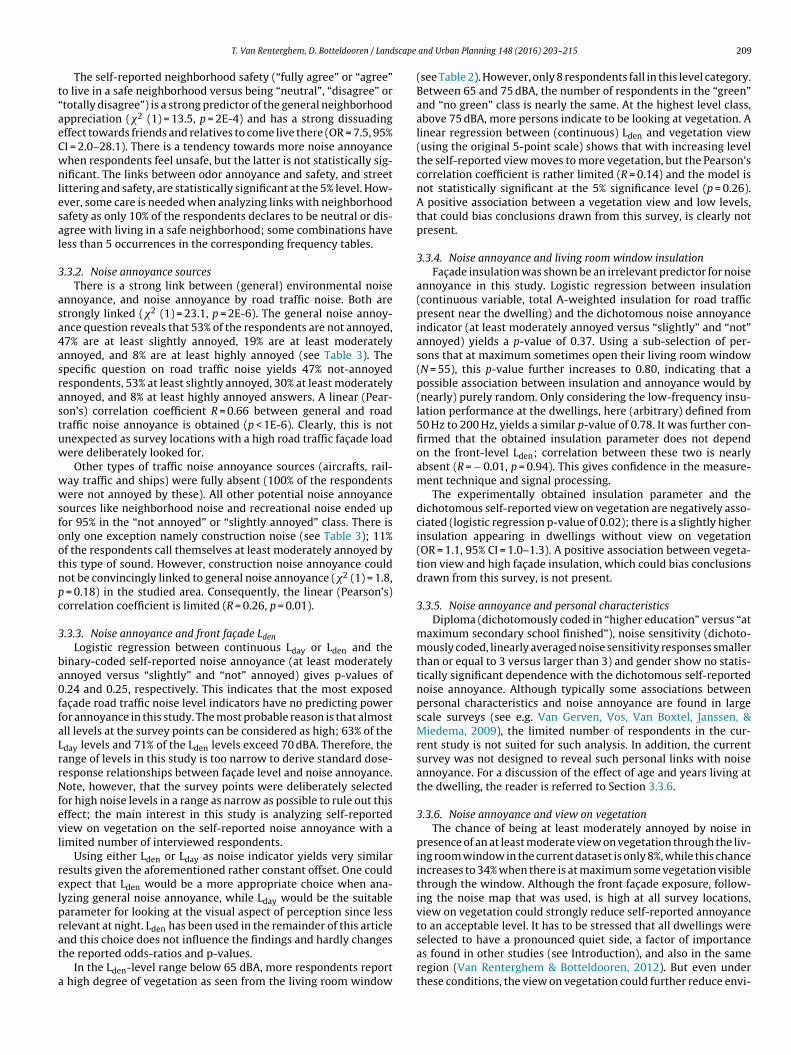
ig. 4. Lden noise map (in dBA) near the survey points, showing the buildings withere taken, are in red (indicating an “at least moderately annoyed” inhabitant) or g
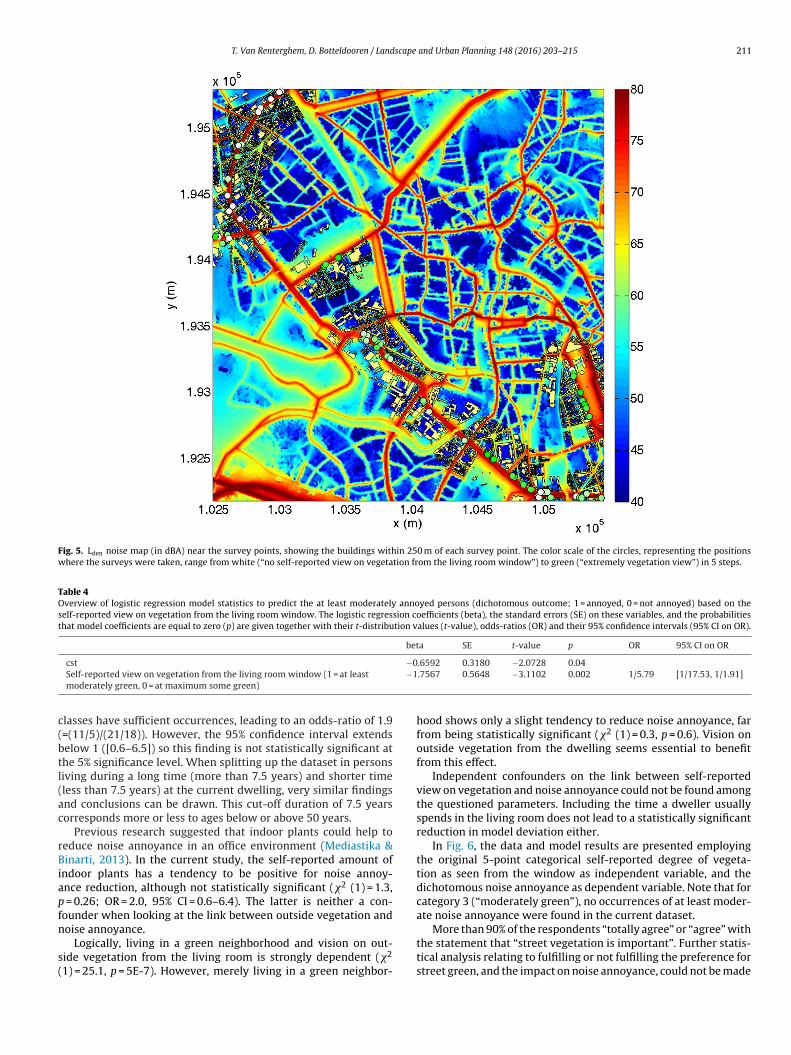
onmental noise annoyance significantly. The spatial distribution ofoise annoyance (dichotomously coded) and view on vegetation (5-oint categorical scale) is illustrated with the maps in Figs. 4 and 5.
Logistic regression shows that view on vegetation from the liv-ng room window is an important predictor of the self-reportedoise annoyance in this highly exposed noise environment. Therude OR equals 5.8 (95% CI = 1.9–17.5), meaning that dwellers thatave at least a moderately green view are more than 5 times lessat least moderately) annoyed by noise than those that report toee at maximum some vegetation through their living room win-ow. Their dependency is strong (�2 (1) = 11.1, p = 9E-4). Logisticegression statistics are summarized in Table 4.
In the current dataset, older persons (age above 50) have a higherhance of a pronounced view on vegetation. More precisely, 38lder persons see a lot of vegetation versus 12 older persons see-
ng none. As a result, age and vegetation view are strongly linked.irectly related to this, the number of years living at the dwelling
2
s logically influenced by the age of the participant (� (1) = 37.7, = 8E-10), and therefore also to having a vegetation view. Althoughhe effects of age and years of living at the current location, and veg-tation view, cannot be disentangled based on the current dataset,
m of each survey point. The circles, representing the positions where the surveys“not at all annoyed” or “slightly annoyed”).
the strong effect described in the previous paragraph cannot beassigned to the age effect and years living at the location. In a sim-ilar study (also consisting of face-to-face interviews in the city ofGhent, see Van Renterghem & Botteldooren, 2012), the dependencyof the respondent’s age or years living at the dwelling, and self-reported noise annoyance, was rejected (�2 (1) = 4.24, p = 0.38 and�2 (1) = 2.88, p = 0.58, respectively). Vegetation as seen through thewindow was not asked for in that study. In general, based on largerscale surveys, there is some tendency for somewhat less annoyancewith increasing age (Van Gerven et al., 2009) and the longer a per-son lives at a specific location, but the strong effect observed herecannot be brought down to age effect alone.
Splitting up in younger (below 50) and older (above 50) respon-dents does not allow to draw statistically sound conclusions due tocategories with too few occurrences, enhancing uncertainty. In theolder class, the major portion of the respondents (76%) appears inthe “vegetation view-no noise annoyance” class, while the “vegeta-
tion view-noise annoyance” category becomes empty. Therefore, itis not possible to draw statistics or calculate odds-ratios, althoughthe latter could suggest a very strong positive effect of view onvegetation. In the younger category (55 respondents in total), all
T. Van Renterghem, D. Botteldooren / Landscape and Urban Planning 148 (2016) 203–215 211
Fig. 5. Lden noise map (in dBA) near the survey points, showing the buildings within 250 m of each survey point. The color scale of the circles, representing the positionswhere the surveys were taken, range from white (“no self-reported view on vegetation from the living room window”) to green (“extremely vegetation view”) in 5 steps.
Table 4Overview of logistic regression model statistics to predict the at least moderately annoyed persons (dichotomous outcome; 1 = annoyed, 0 = not annoyed) based on theself-reported view on vegetation from the living room window. The logistic regression coefficients (beta), the standard errors (SE) on these variables, and the probabilitiesthat model coefficients are equal to zero (p) are given together with their t-distribution values (t-value), odds-ratios (OR) and their 95% confidence intervals (95% CI on OR).
beta SE t-value p OR 95% CI on OR
−0−1
c(btl(ac
rBiapfn
s(
cst
Self-reported view on vegetation from the living room window (1 = at leastmoderately green, 0 = at maximum some green)
lasses have sufficient occurrences, leading to an odds-ratio of 1.9=(11/5)/(21/18)). However, the 95% confidence interval extendselow 1 ([0.6–6.5]) so this finding is not statistically significant athe 5% significance level. When splitting up the dataset in personsiving during a long time (more than 7.5 years) and shorter timeless than 7.5 years) at the current dwelling, very similar findingsnd conclusions can be drawn. This cut-off duration of 7.5 yearsorresponds more or less to ages below or above 50 years.
Previous research suggested that indoor plants could help toeduce noise annoyance in an office environment (Mediastika &inarti, 2013). In the current study, the self-reported amount of
ndoor plants has a tendency to be positive for noise annoy-nce reduction, although not statistically significant (�2 (1) = 1.3,
= 0.26; OR = 2.0, 95% CI = 0.6–6.4). The latter is neither a con-ounder when looking at the link between outside vegetation andoise annoyance.
Logically, living in a green neighborhood and vision on out-ide vegetation from the living room is strongly dependent (�2
1) = 25.1, p = 5E-7). However, merely living in a green neighbor-
hood shows only a slight tendency to reduce noise annoyance, farfrom being statistically significant (�2 (1) = 0.3, p = 0.6). Vision onoutside vegetation from the dwelling seems essential to benefitfrom this effect.
Independent confounders on the link between self-reportedview on vegetation and noise annoyance could not be found amongthe questioned parameters. Including the time a dweller usuallyspends in the living room does not lead to a statistically significantreduction in model deviation either.
In Fig. 6, the data and model results are presented employingthe original 5-point categorical self-reported degree of vegeta-tion as seen from the window as independent variable, and thedichotomous noise annoyance as dependent variable. Note that forcategory 3 (“moderately green”), no occurrences of at least moder-ate noise annoyance were found in the current dataset.
More than 90% of the respondents “totally agree” or “agree” with
the statement that “street vegetation is important”. Further statis-tical analysis relating to fulfilling or not fulfilling the preference forstreet green, and the impact on noise annoyance, could not be made
212 T. Van Renterghem, D. Botteldooren / Landscape and Urban Planning 148 (2016) 203–215
1 2 3 4 50
0.1
0.2
0.3
0.4
0.5
Visual from window (1="extremely green", 5="no green at all")
Cha
nce
of a
t lea
st m
oder
ate
anno
yanc
e
F ment( eratet egres
dtvp
3
lipwd
clw(C&Gnts2brsv
ltdArtoa
ms
ig. 6. The chance of being at least moderately annoyed (self-reported) by environon a 5-point categorical scale with 1 = ”extremely green”, 2 = ”very green”, 3 = ”modhe survey, the squares connected with full lines are the predicted results (logistic r
ue to the near absence of persons disagreeing with or being neu-ral to previous statement. Self-reported neighborhood safety andegetation view from the window are not at all linked (�2 (1) = 0.06,
= 0.8).
.3.7. Objective versus subjective view on vegetationIn this section, the self-reported view on vegetation through the
iving room window is opposed to the percentage greenish pixelsn digital photographs taken at each dwelling from the front-doorosition towards the street. For fear of burglary, taking pictures ofindows facing the street was not allowed by almost all respon-
ents. As a proxy, the front-door position was therefore considered.Photographs were taken with a Panasonic dmc-fz18 with the
amera held horizontally at eye height (about 1.7 m above streetevel). Each digital picture consisted of 3264 × 2448 pixels and
as saved in .jpeg format. The “RGB greenness” parameter GRGBAhmad, Muhamin Naeem, Islam, & Nawaz, 2007; Crimmins &rimmins, 2008; Richardson, Jenkins, Braswell, Hollinger, Ollinger,
Smith, 2007) is used and calculated as GRGB = (G-R) + (G-B), where, R and B are the relative intensities of the green, red and blue chan-els in the RGB picture, respectively. In a next step, an appropriatehreshold was set. The .jpeg picture format was found to be welluited for such an image processing analysis (Lebourgeois et al.,008). A more robust assessment of green vegetation is the (broad-and) normalized difference vegetation index (NDVI), however,equiring a measurement of near infrared light. RGB greenness washown to perform quite similar to NDVI in capturing the amount ofegetation as concluded by Richardson et al. (2007).
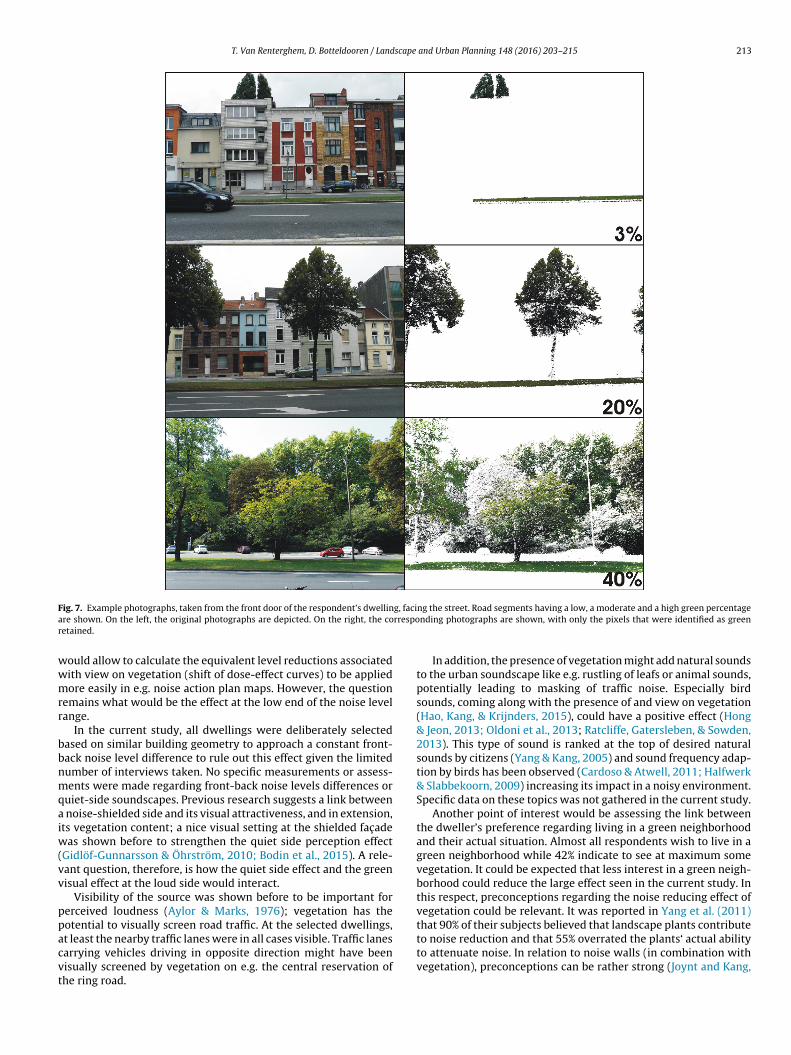
Note that all green is included when calculating GRGB; so not onlyeafs from trees and bushes but also grass zones. Non-green vegeta-ion is missed in this assessment. However, in the zone under study,uring high summer, vegetation is predominantly green colored.ccidental non-vegetation green-colored objects were manuallyemoved, typically accounting for only small zones in the pho-ographs taken. Such a manual action was needed in less than 15%f the pictures. In Fig. 7, examples are shown for a low, a moderate
nd a high vegetation percentage.
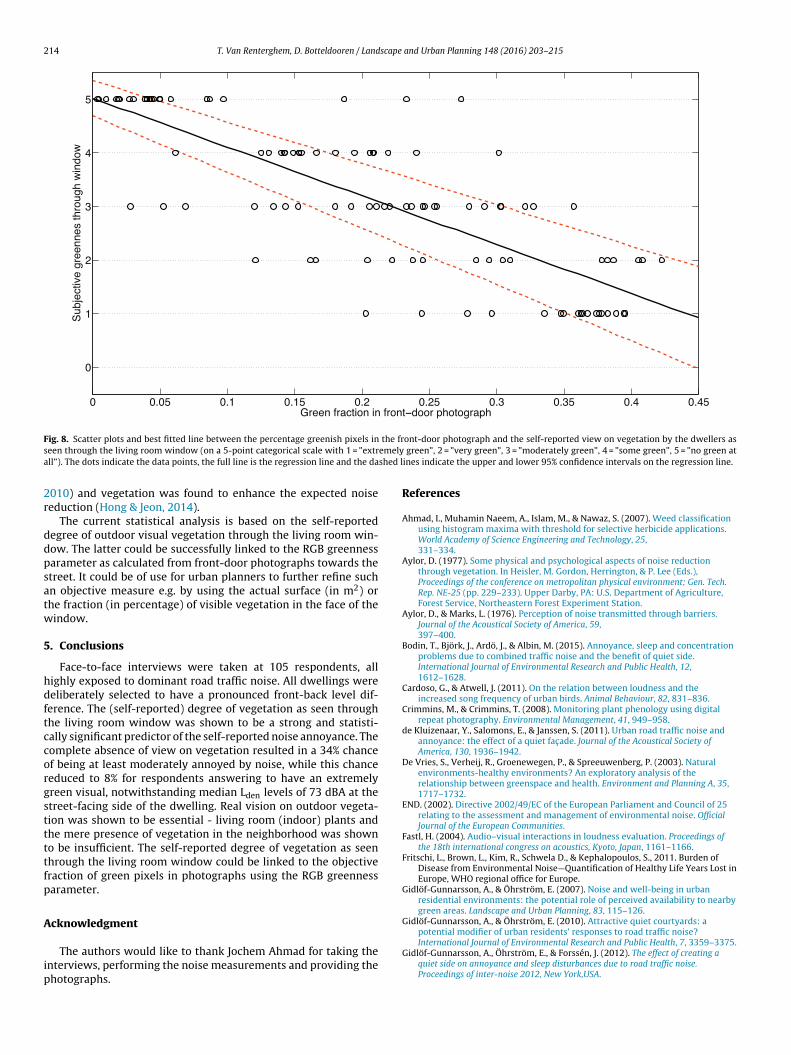
The linear regression in Fig. 8 proves to be a statistically soundodel to link the percentage greenish pixels in photographs and
ubjective view on vegetation; the categorical 5-point scale is used
al noise versus the self-reported view on vegetation from the living room windowly green”, 4 = ”some green”, 5 = ”no green at all”). The open circles are the data fromsion); the dashed lines indicate the 95% confidence intervals on the predictions.
as a continuous variable here (in approximation). A correlationcoefficient of 0.79 was obtained, with a p-value of less than 0.001.The dwellers are capable of correctly evaluating vegetation viewfrom their living room window. In the zone under study, thereis a high variation in the degree of vegetation at road segmentswithin short distance that could help respondents in getting sucha classification reasonably accurate.
However, the rating of vegetation view stays a subjective mea-sure, as shown by the relative broad range of objective assessmentscorresponding to a single subjective class. To some extent, therecould also be differences between the living room window viewand the front-door position, especially in case of living rooms athigher storeys.
4. Discussion
The current survey was held in an area highly-exposed to roadtraffic noise, and a strong self-reported noise annoyance reductionby the self-reported presence of visible outdoor vegetation has beenobserved. This finding confirms previous work showing that viewon gardens and parks moderate noise annoyance ratings by indi-viduals at their homes (Li et al., 2010). In that study, predicted levelswere mostly in the 65 dBA noise level class. Current results are alsoconsistent with those reported by Zhang et al. (2003), where vege-tation was shown to have a pronounced positive perception effectmainly at high (70 dBA) and not at low road traffic noise levels(55 dBA). Somewhat related, Hong & Jeon (2014) concluded thatat 65 dBA aesthetic preference of noise barriers is more importantthan at 55 dBA. In their study, the aesthetics of a barrier could belinked to the presence of vegetation.
Somewhat contrasting, Hong, & Jeon (2013) indicate that theoverall environmental quality could benefit from an improvedvisual environment mainly at lower levels around 55 dBA, whileat 70 dBA the acoustic environment would be dominant. FollowingViollon (2003), high road traffic noise levels could be incongru-ent with view on vegetation, potentially degrading the soundscape
quality. Such mechanisms did not seem to apply to the currentstudy.
Combining the effect of view on vegetation in combination witha wide range of front fac ade noise levels could be interesting. This
T. Van Renterghem, D. Botteldooren / Landscape and Urban Planning 148 (2016) 203–215 213
F g, facia rrespor
wwmrr
bbnmqaiw(vv
ppacvt
ig. 7. Example photographs, taken from the front door of the respondent’s dwellinre shown. On the left, the original photographs are depicted. On the right, the coetained.
ould allow to calculate the equivalent level reductions associatedith view on vegetation (shift of dose-effect curves) to be appliedore easily in e.g. noise action plan maps. However, the question
emains what would be the effect at the low end of the noise levelange.
In the current study, all dwellings were deliberately selectedased on similar building geometry to approach a constant front-ack noise level difference to rule out this effect given the limitedumber of interviews taken. No specific measurements or assess-ents were made regarding front-back noise levels differences or
uiet-side soundscapes. Previous research suggests a link between noise-shielded side and its visual attractiveness, and in extension,ts vegetation content; a nice visual setting at the shielded fac ade
as shown before to strengthen the quiet side perception effectGidlöf-Gunnarsson & Öhrström, 2010; Bodin et al., 2015). A rele-ant question, therefore, is how the quiet side effect and the greenisual effect at the loud side would interact.
Visibility of the source was shown before to be important forerceived loudness (Aylor & Marks, 1976); vegetation has theotential to visually screen road traffic. At the selected dwellings,
t least the nearby traffic lanes were in all cases visible. Traffic lanesarrying vehicles driving in opposite direction might have beenisually screened by vegetation on e.g. the central reservation ofhe ring road.
ng the street. Road segments having a low, a moderate and a high green percentagending photographs are shown, with only the pixels that were identified as green
In addition, the presence of vegetation might add natural soundsto the urban soundscape like e.g. rustling of leafs or animal sounds,potentially leading to masking of traffic noise. Especially birdsounds, coming along with the presence of and view on vegetation(Hao, Kang, & Krijnders, 2015), could have a positive effect (Hong& Jeon, 2013; Oldoni et al., 2013; Ratcliffe, Gatersleben, & Sowden,2013). This type of sound is ranked at the top of desired naturalsounds by citizens (Yang & Kang, 2005) and sound frequency adap-tion by birds has been observed (Cardoso & Atwell, 2011; Halfwerk& Slabbekoorn, 2009) increasing its impact in a noisy environment.Specific data on these topics was not gathered in the current study.
Another point of interest would be assessing the link betweenthe dweller’s preference regarding living in a green neighborhoodand their actual situation. Almost all respondents wish to live in agreen neighborhood while 42% indicate to see at maximum somevegetation. It could be expected that less interest in a green neigh-borhood could reduce the large effect seen in the current study. Inthis respect, preconceptions regarding the noise reducing effect ofvegetation could be relevant. It was reported in Yang et al. (2011)that 90% of their subjects believed that landscape plants contribute
to noise reduction and that 55% overrated the plants‘ actual abilityto attenuate noise. In relation to noise walls (in combination withvegetation), preconceptions can be rather strong (Joynt and Kang,
214 T. Van Renterghem, D. Botteldooren / Landscape and Urban Planning 148 (2016) 203–215
0 0.05 0.1 0.15 0.2 0.25 0.3 0.35 0.4 0.45
0
1
2
3
4
5
Sub
ject
ive
gree
nnes
thro
ugh
win
dow
Green fraction in front−door photograph
F the frs emelya shed l
2r
ddpsatw
5
hdftccorgsttttfp
A
ip
ig. 8. Scatter plots and best fitted line between the percentage greenish pixels ineen through the living room window (on a 5-point categorical scale with 1 = ”extrll”). The dots indicate the data points, the full line is the regression line and the da
010) and vegetation was found to enhance the expected noiseeduction (Hong & Jeon, 2014).
The current statistical analysis is based on the self-reportedegree of outdoor visual vegetation through the living room win-ow. The latter could be successfully linked to the RGB greennessarameter as calculated from front-door photographs towards thetreet. It could be of use for urban planners to further refine suchn objective measure e.g. by using the actual surface (in m2) orhe fraction (in percentage) of visible vegetation in the face of theindow.
. Conclusions
Face-to-face interviews were taken at 105 respondents, allighly exposed to dominant road traffic noise. All dwellings wereeliberately selected to have a pronounced front-back level dif-
erence. The (self-reported) degree of vegetation as seen throughhe living room window was shown to be a strong and statisti-ally significant predictor of the self-reported noise annoyance. Theomplete absence of view on vegetation resulted in a 34% chancef being at least moderately annoyed by noise, while this chanceeduced to 8% for respondents answering to have an extremelyreen visual, notwithstanding median Lden levels of 73 dBA at thetreet-facing side of the dwelling. Real vision on outdoor vegeta-ion was shown to be essential - living room (indoor) plants andhe mere presence of vegetation in the neighborhood was showno be insufficient. The self-reported degree of vegetation as seenhrough the living room window could be linked to the objectiveraction of green pixels in photographs using the RGB greennessarameter.
cknowledgment
The authors would like to thank Jochem Ahmad for taking thenterviews, performing the noise measurements and providing thehotographs.
ont-door photograph and the self-reported view on vegetation by the dwellers as green”, 2 = ”very green”, 3 = ”moderately green”, 4 = ”some green”, 5 = ”no green atines indicate the upper and lower 95% confidence intervals on the regression line.
References
Ahmad, I., Muhamin Naeem, A., Islam, M., & Nawaz, S. (2007). Weed classificationusing histogram maxima with threshold for selective herbicide applications.World Academy of Science Engineering and Technology, 25,331–334.
Aylor, D. (1977). Some physical and psychological aspects of noise reductionthrough vegetation. In Heisler, M. Gordon, Herrington, & P. Lee (Eds.),Proceedings of the conference on metropolitan physical environment; Gen. Tech.Rep. NE-25 (pp. 229–233). Upper Darby, PA: U.S. Department of Agriculture,Forest Service, Northeastern Forest Experiment Station.
Aylor, D., & Marks, L. (1976). Perception of noise transmitted through barriers.Journal of the Acoustical Society of America, 59,397–400.
Bodin, T., Björk, J., Ardö, J., & Albin, M. (2015). Annoyance, sleep and concentrationproblems due to combined traffic noise and the benefit of quiet side.International Journal of Environmental Research and Public Health, 12,1612–1628.
Cardoso, G., & Atwell, J. (2011). On the relation between loudness and theincreased song frequency of urban birds. Animal Behaviour, 82, 831–836.
Crimmins, M., & Crimmins, T. (2008). Monitoring plant phenology using digitalrepeat photography. Environmental Management, 41, 949–958.
de Kluizenaar, Y., Salomons, E., & Janssen, S. (2011). Urban road traffic noise andannoyance: the effect of a quiet fac ade. Journal of the Acoustical Society ofAmerica, 130, 1936–1942.
De Vries, S., Verheij, R., Groenewegen, P., & Spreeuwenberg, P. (2003). Naturalenvironments-healthy environments? An exploratory analysis of therelationship between greenspace and health. Environment and Planning A, 35,1717–1732.
END. (2002). Directive 2002/49/EC of the European Parliament and Council of 25relating to the assessment and management of environmental noise. OfficialJournal of the European Communities.
Fastl, H. (2004). Audio–visual interactions in loudness evaluation. Proceedings ofthe 18th international congress on acoustics, Kyoto, Japan, 1161–1166.
Fritschi, L., Brown, L., Kim, R., Schwela D., & Kephalopoulos, S., 2011. Burden ofDisease from Environmental Noise—Quantification of Healthy Life Years Lost inEurope, WHO regional office for Europe.
Gidlöf-Gunnarsson, A., & Öhrström, E. (2007). Noise and well-being in urbanresidential environments: the potential role of perceived availability to nearbygreen areas. Landscape and Urban Planning, 83, 115–126.
Gidlöf-Gunnarsson, A., & Öhrström, E. (2010). Attractive quiet courtyards: a
potential modifier of urban residents’ responses to road traffic noise?International Journal of Environmental Research and Public Health, 7, 3359–3375.
Gidlöf-Gunnarsson, A., Öhrström, E., & Forssén, J. (2012). The effect of creating aquiet side on annoyance and sleep disturbances due to road traffic noise.Proceedings of inter-noise 2012, New York,USA.
alfwerk, W., & Slabbekoorn, H. (2009). A behavioural mechanism explainingnoise-dependent frequency use in urban birdsong. Animal Behaviour, 78,1301–1307.
ao, Y., Kang, J., & Krijnders, J. (2015). Integrated effects of urban morphology onbirdsong loudness and visibility of green areas. Landscape and Urban Planning,137, 149–162.
ong, J., & Jeon, J. (2013). Designing sound and visual components forenhancement of urban soundscapes. Journal of the Acoustical Society of America,134, 2026–2036.
ong, J., & Jeon, J. (2014). The effects of audio–visual factors on perceptions ofenvironmental noise barrier performance. Landscape and Urban Planning, 125,28–37.
SO 10140-2. (2010). Acoustics—laboratory measurement of sound insulation ofbuilding elements—part 2: measurement of airborne sound insulation. Geneva,Switzerland: International Standards Organization.
SO 140-4. (1998). Acoustics—measurement of sound insulation in buildings and ofbuilding elements—part 4: field measurements of airborne sound insulationbetween rooms. Geneva, Switzerland: International Standards Organization.
SO/TS 15666. (2003). Acoustics—assessment of noise annoyance by means of socialand socio-acoustic surveys. Geneva, Switzerland: International StandardsOrganization.
ean, P. (2009). Sound transmission through opened windows. Applied Acoustics,70, 41–49.
oynt, J., & Kang, J. (2010). The influence of preconceptions on perceived soundreduction by environmental noise barriers. The Science of the TotalEnvironment, 408, 4368–4375.
aplan, R., & Kaplan, S. (1989). The experience of nature: a psychological perspective.New York: Cambridge University Press.
otzen, B., & English, C. (2009). Environmental noise barriers—a guide to theiracoustic and visual design (Second ed.). London: Taylor and Francis.
ebourgeois, V., Bégué, A., Labbé, S., Mallavan, B., Prévot, L., & Roux, B. (2008). Cancommercial digital cameras be used as multispectral sensors? A cropmonitoring test. Sensors, 8, 7300–7322.
i, H., Chau, C., & Tang, S. (2010). Can surrounding greenery reduce noiseannoyance at home? The Science of the Total Environment, 408, 4376–4384.
ediastika, C., & Binarti, F. (2013). Reducing indoor noise levels using people’sperception on greenery. Scientific Journal of Riga Technical University.Environmental and Climate Technologies, 12 http://dx.doi.org/10.2478/rtuect-2013-0003
hrstrom, E., Skanberg, A., Svensson, H., & Gidlöf-Gunnarsson, A. (2006). Effects ofroad traffic noise and the benefit of access to quietness. Journal of Sound andVibration, 295, 40–59.
ldoni, D., De Coensel, B., Boes, M., Rademaker, M., De Baets, B., Van Renterghem,T., et al. (2013). A computational model of auditory attention for use insoundscape research. Journal of the Acoustical Society of America, 134,852–861.
heasant, R., Horoshenkov, K., Watts, G., & Barrett, B. (2008). The acoustic andvisual factors influencing the construction of tranquil space in urban and ruralenvironments: tranquil spaces-quiet places? Journal of the Acoustical Society ofAmerica, 123, 1446–1457.
reis, A., Kocinski, J., Hafke-Dys, H., & Wrzosek, M. (2015). Audio–visualinteractions in environment assessment. The Science of the Total Environment,523, 191–200.
uirt, J. (1982). Sound transmission through windows I. Single and double glazing.Journal of the Acoustical Society of America, 72, 834–844.
and Urban Planning 148 (2016) 203–215 215
Ratcliffe, E., Gatersleben, B., & Sowden, P. (2013). Bird sounds and theircontributions to perceived attention restoration and stress recovery. Journal ofEnvironmental Psychology, 36, 221–228.
Richardson, A., Jenkins, J., Braswell, B., Hollinger, D., Ollinger, S., & Smith, M. (2007).Use of digital webcam images to track spring green-up in a deciduousbroadleaf forest. Oecologia, 152, 323–334.
Salomons, E., Polinder, H., Lohman, W., Zhou, H., Borst, H., & Miedema, H. (2009).Engineering modeling of traffic noise in shielded areas in cities. Journal of theAcoustical Society of America, 126, 2340–2349.
Thompson, C. (2011). Linking landscape and health: the recurring theme.Landscape and Urban Planning, 99, 187–195.
Thompson, C., Roe, J., Aspinall, P., Mitchell, R., Clow, A., & Miller, D. (2012). Moregreen space is linked to less stress in deprived communities: evidence fromsalivary cortisol patterns. Landscape and Urban Planning, 105, 221–229.
Tzoulas, K., Korpela, K., Venn, S., Yli-Pelkonen, V., Kazmierczak, A., Niemela, J., &James, P. (2007). Promoting ecosystem and human health in urban areas usingGreen Infrastructure: a literature review. Landscape and Urban Planning, 81,167–178.
Van Renterghem, T., & Botteldooren, D. (2012). Focused study on the quiet sideeffect at dwellings highly exposed by road traffic noise. International Journal ofEnvironmental Research and Public Health, 9, 4292–4310.
Van Renterghem, T., Forssen, J., Attenborough, K., Jean, P., Defrance, J., Hornikx, M.,& Kang, J. (2015). Using natural means to reduce surface transport noise duringpropagation outdoors. Applied Acoustics, 92, 86–101.
Ulrich, R. (1984). View through a window may influence recovery from surgery.Science, 224, 420–421.
Van Gerven, P., Vos, H., Van Boxtel, M., Janssen, S., & Miedema, H. (2009).Annoyance from environmental noise across the lifespan. Journal of theAcoustical Society of America, 126, 187–194.
Velarde, M., Fry, G., & Tveit, M. (2007). Health effects of viewinglandscapes—landscape types in environmental psychology. Urban Forestry &Urban Greening, 6, 199–212.
Viollon, S. (2003). Two examples of audio–visual interactions in an urban context.Proceedings of the Euronoise Conference 2003, Naples, Italy.
Viollon, S., Lavandier, C., & Drake, C. (2002). Influence of visual setting on soundratings in an urban environment. Applied Acoustics, 63, 493–511.
Watts, G., Chinn, L., & Godfrey, N. (1999). The effects of vegetation on theperception of traffic noise. Applied Acoustics, 56, 39–56.
Watts, G., Pheasant, R., & Horoshenkov, K. (2011). Predicting perceived tranquilityin urban parks and open spaces. Environment and Planning B: Planning andDesign, 38, 585–594.
Wei, W., Botteldooren, D., Van Renterghem, T., Hornikx, M., Forssén, J., Salomons,E., & Ögren, M. (2014). Urban background noise mapping: the general model.Acta Acustica united with Acustica, 100, 1098–1111.
Weinstein, N. (1978). Individual differences in reactions to noise: a longitudinalstudy in a college dormitory. Journal of Applied Psychology, 63, 458–466.
Yang, F., Bao, Z., & Zhu, Z. (2011). An assessment of psychological noise reductionby landscape plants. International Journal of Environmental Research and Public
Health, 8, 1032–1048.
Yang, W., & Kang, J. (2005). Soundscapes and sound preferences in urban squares.Journal of Urban Design, 10, 69–88.
Zhang, B., Shi, L., & Di, G. (2003). The influence of the visibility of the source on thesubjective annoyance due to its noise. Applied Acoustics, 64, 1205–1215.


![publicaties... · Author: wilmr [ WILMR ] Created Date: 20030625120251Z](https://static.documents.pub/doc/80x56/5c752a6f09d3f2a52b8b7d63/-publicaties-author-wilmr-wilmr-created-date-20030625120251z.jpg)


