State Budget Cuts and Medicaid Managed Care: Case Studies of Four States Prepared for the NASHP by: Michael Bailit, Bailit Health Purchasing Laurie Burgess, Bailit Health Purchasing Tricia Roddy, Consultant June 2004 Prepared with support from the Association for Health Center Affiliated Health Plans, AMERIGROUP Corporation, and Kaiser Permanente. MMC 63
Transcript
State Budget Cuts andMedicaid Managed Care:Case Studies of Four States
Prepared for the NASHP by:
Michael Bailit, Bailit Health Purchasing Laurie Burgess, Bailit Health Purchasing Tricia Roddy, Consultant
June 2004 Prepared with support from the Association for Health Center Affiliated Health Plans, AMERIGROUP Corporation, and Kaiser Permanente.
MMC 63
State Budget Cuts andMedicaid Managed Care:Case Studies of Four States
The authors would like to thank Margaret Murray of the Association for Health Center AffiliatedHealth Plans, Pamela Perry of the Amerigroup Corporation, and Maureen Hanrahan of KaiserPermanente for their generous support of this project. We also thank Neva Kaye and DebbieChang of the National Academy for State Health Policy for their guidance in the development ofthis project.
We also wish to thank the members of the project advisory group; their input along the waymade this a better paper. They are: Barbara Edwards of the Ohio Department of Jobs andFamily Services, Catherine Halverson of Centene Corporation, and Kay Holmes of the DelawareDepartment of Health and Social Services.
In addition, we thank the current and former state staff who participated in interviews andreviewed a draft of this paper. They are:
Florida Ken Thurston and Robert ButlerMassachusetts Doug Brown, Linda Green, Darrin Shaffer, Trisha Spellman, and Kate Willrich-NordahlMichigan Janet Olszewski and Sue MoranOregon Lynn Read and Joan Kapowich
Finally, we thank the staff of the managed care organizations that we interviewed in each state.
Introduction..................................................................................................................................... 3Background on State Medicaid Budget Reduction Strategies .................................................... 3Methodology for Conducting the Four Case Studies .................................................................. 7Table One: Summary of Four States’ Budget Cutting Strategies in 2003 and 2004 .................. 8
Key Findings from Interviews and Discussion............................................................................. 11The Four States’ Medicaid Agencies Have Some Discretion In Proposing Budget CutStrategies ................................................................................................................................... 11The Extent to Which Medicaid Agencies Include the MCOs in Budget Reduction StrategyDevelopment Varies.................................................................................................................. 12State Agencies Have Not Devoted Significant Resources to Identifying the Indirect Effects ofBudget Reduction Strategies on the MCOs or How to Mitigate Them. Such Effects Can BeSignificant. ................................................................................................................................ 12State Agency Staff Expressed Satisfaction with an Arduous Yet Effective Budget ReductionProcess....................................................................................................................................... 14State Agency Staff and MCOs Are Realistic About the State of the Economy........................ 14Most State Agency Staff and MCOs Perceive Medicaid Managed Care as Weaker................ 15
Appendix A: List of State Agency Personnel Interviewed and Advisory Group MembersAppendix B: Background on States’ Strategies for Reducing Medicaid ExpendituresAppendix C: Questionnaire Used to Interview State Agency Staff and MCO Representatives
In the past few years states have experienced profound pressure to control costs and reduce statebudget deficits. Accordingly, states have had to implement changes in their Medicaid budgetsthat include across-the-board provider rate cuts and direct cuts in benefits and eligibility. All ofthese actions have had an impact on states’ Medicaid managed care programs. Using survey dataand interviews with state Medicaid and oversight agency staff in four states—Florida,Massachusetts, Michigan, and Oregon—staff of Bailit Health Purchasing have examined thestrategies states have employed to manage their Medicaid budgets and the policy, programmaticand operational implications these strategies have had for the states’ Medicaid managed careplans. The information in this paper is timely as most states are still facing deficits and will beforced to implement additional cost-cutting strategies in the near future.
To provide a sense of the types of Medicaid budget cutting strategies states are employing acrossthe country, we reviewed the results of surveys conducted of all 50 states and the District ofColumbia by the Kaiser Family Foundation (KFF). Telephone interviews were then conductedusing a NASHP-approved questionnaire. State agency staff and at least one managed careorganization (MCO) in each state were interviewed. In developing this paper, we consulted witha project advisory group and the project funders. Advisory group members provided input onstate selection, reviewed the draft protocol, and reviewed a draft of the paper. State intervieweesall had an opportunity to review the draft of the paper before it was finalized.
Interview Findings
1. Medicaid agencies in the four states have some discretion in proposing budget cutstrategies.In each of the four states, the Medicaid budget cutting strategies that had been implemented or were being implemented by state staff were usually not dictated by the legislature.
2. The extent to which Medicaid agencies include managed care organizations in budgetreduction strategy development varies.Typically, the Medicaid agency staff in the four states use extensive internal processes todevelop their proposals. However, the manner and degree of health plan involvement in theagency’s budget and implementation strategy development processes vary by state. In two ofthe four states, the MCOs were invited to participate before the state agency budget wasproposed to the legislature. In the other two cases, they were excluded until the Medicaidagency’s and the Governor’s proposals had been presented to the legislature.
3. State agencies have not devoted significant resources to identifying the indirect effectsof budget reduction strategies on the MCOs or how to mitigate them, and such effectscan be significant.The state agencies did not devote significant resources to considering the indirect impact ofchanges—such as changes to fee-for-service provider payment rates, eligibility rules, new orincreased beneficiary cost-sharing and state agency staffing—on managed careorganizations. These changes have had a significant adverse administrative and financial
impact on the MCOs. State agency staff, even those who involve the MCOs in budgetcutting strategy development, indicated that they did not spend time projecting the impact ofchanges other than MCO rate changes. The area of greatest contention between the MCOsand state agency staff was whether, how, and when the agencies decreased MCO rates toreflect anticipated saving from the budget cuts.
4. State agency staff expressed satisfaction with an arduous yet effective budget reductionprocessState agencies judged their budget cutting processes successful since they were able toachieve budget passage without fundamentally undermining their programs and negativelyimpacting access to care.
5. The staff of both the state agencies and the managed care plans are realistic about thestate of the economyState agency staff and MCOs both recognize that the economy and the health of state budgetsfluctuate over time. However, some state agency staff worry that little, if anything, remainsto be cut that will not seriously harm the viability of the Medicaid and the Medicaid managedcare programs.
6. State agency staff and plans generally perceive Medicaid managed care as weakenedMost state agency and MCO staff view the Medicaid managed care programs as weaker thanthey were and, in some cases, quite vulnerable. State agency staff expressed the hope thatthey will be able to protect participating MCOs from further cuts in the coming fiscal year, asthey believe that Medicaid managed care improves both access and quality. MCOs reportedthat they continue to be committed to the Medicaid business.
Findings are discussed in greater detail in the Key Findings section of this paper.
In the past few years, states have experienced profound pressure to control costs and reduce statebudget deficits. Accordingly, states have had to implement cuts in their Medicaid budgets thatinclude both across-the-board provider rate cuts and direct cuts in benefits and eligibility. Thepurpose of this report is to provide information about the policy, programmatic, and operationalimplications these budget-cutting strategies have for states’ Medicaid managed care plans.
The paper presents findings from interviews, conducted by Bailit Health Purchasing staff onbehalf of NASHP, with state Medicaid and Medicaid oversight agency staff and Medicaid MCOrepresentatives in Florida, Massachusetts, Michigan, and Oregon. The interview findings arefollowed by a discussion of lessons learned and best practices in the four selected states, lessonsthat may be helpful for any state embarking on new rounds of budget cuts. The paper alsoexplores the impact of a variety of budget cutting strategies on Medicaid managed careprograms. Appendix B contains detailed information on state Medicaid budget reductions andstrategies, information gleaned from a review of reports by the Kaiser Commission and theNational Academy for State Health Policy (NASHP).
Background on State Medicaid Budget Reduction Strategies
Over the last several years, states have faced a deteriorating budget situation. For many states,tax revenue grew strongly in the late 1990s and then crashed in FY 2002.1 Since then, revenueshave remained relatively stagnant while expenditures continue to increase, particularly withinstate Medicaid programs.2 The result is multi-year deficits, deficits that total between $70 billionand $85 billion for FY 2004.3 Double digit increases in the cost of some services, like pharmacy,have also caused Medicaid to swallow increasingly larger portions of all state expenditures.Medicaid is typically the second-largest item on a state’s general fund budget, accounting forroughly 16 percent of expenditures.4 Because total Medicaid spending rose by approximately 25percent between FY 2000 and FY 2002 (almost 12.5 percent per year), states have focusedheavily on containing Medicaid expenditures.5
1 N. Jenny, “Underlying State Revenue Picture Remains Bleak: Preliminary State Tax Revenues.” TheRockefeller Institute State Fiscal News Vol. 3, No. 6, August 2003.2 N. Johnson and B. Zahradnik, “State Budget Deficits Projected for Fiscal Year 2005,” Center on Budgetand Policy Priorities (Washington, DC: The Center, January 30, 2004). After adjusting for inflation andlegislative changes, state revenues grew only slightly (0.4%) in the July to September 2003 quarter.3 I. Lav and N. Johnson, “State Budget Deficits For Fiscal Year 2004 Are Huge And Growing,” Center onBudget and Policy Priorities (Washington, DC: The Center, January 23, 2003).4 National Association of State Budget Officers, “The Fiscal Survey of States” (Washington, DC: TheAssociation, December 2003). Education is the largest component, accounting for 35.4 %.5 J. Holahan and B. Bruen, “Medicaid Spending: What Factors Contributed to the Growth Between 2000and 2002?,” Kaiser Commission on Medicaid and The Uninsured, September 2003.
To address budget deficits, states cut $25.5 billion in spending over FY 2002 and FY 2003. Atthe same time, they raised taxes by nearly $20 billion.6 States’ Medicaid cost-control initiativeshelped to reduce Medicaid’s growth rate from 12.8 percent in FY 2002 to 9.3 percent in FY2003.7 Preliminary FY 2004 expenditure data suggest that states have been able to slowMedicaid’s spending growth to approximately 8.2 percent.8 Over the decade, Medicaid is nowexpected to grow by an average annual rate of 8.5 percent.9 Although an improvement, thisreduction is not enough.10 First, Medicaid costs are still increasing. Second, state revenues areexpected to grow at a rate far less than 8.5 percent. Overall growth in state revenues areprojected to be 5.1 percent in FY 2004.11 The Medicaid program competes with other statepriorities, such as education, transportation, housing, and public health. This indicates thatadditional cuts in state Medicaid programs are likely. The following is a description of theMedicaid cost containment approaches that states have typically employed over the past severalyears. Each of the four case study states has implemented at least some of these types ofstrategies.
Medicaid cost containment approaches employed over the past several years
Since 2001, the Kaiser Family Foundation (KFF) has commissioned a survey of all 50 states andthe District of Columbia to study the relationship between their deteriorating fiscal conditionsand how states are responding with changes to their Medicaid programs and budgets. For FY2003 and FY 2004, the KFF report cited five primary areas where states have been focusing theircost-containment policies: provider payments, pharmacy, benefits, eligibility, and beneficiarycost-sharing.
6 “States’ Fiscal Crises Seem To Be Easing, But Many Still Face Rising Health Care Costs, Report Says,”Kaiser Daily Health Policy Report, December 5, 2003.http://www.kaisernetwork.org/daily_reports/rep_index.cfm?hint=3&DR_ID=211977 Health Management Associates (HMA) and Victoria Wachino, “States Respond to Fiscal Pressure:State Medicaid Spending Growth and Cost Containment in Fiscal Years 2003 and 2004” (Washington,DC: Kaiser Commission on Medicaid and the Uninsured, September 2003).8 Health Management Associates, V. Wachino, and M. O’Malley, “States Respond to Fiscal Pressure: A50-State Update of State Medicaid Spending Growth and Cost Containment Actions” (Washington, DC:Kaiser Commission on Medicaid and the Uninsured, January 2004). See also: National Association ofState Budget Officers, “The Fiscal Survey of States,” December 2003 (indicating relatively constantgrowth of 8.5% for the decade).9 National Association of State Budget Officers, “The Fiscal Survey of States,” December 2003.10 Center On Budget And Policy Priorities, “State Budget Deficits Projected for Fiscal Year 2005,”January 30, 2004. (Thirty states already estimate budget shortfalls for FY 2005, totaling some $39 billionto $41 billion.)11 National Association of State Budget Officers, “The Fiscal Survey of States,” December 2003.
Provider paymentsFor FY 2003, all but one state cut or froze Medicaid payment rates for at least one providergroup—hospitals, physicians, nursing homes, or managed care organizations—and 39 states hadplans to either freeze or reduce provider payment rates in FY 2004.12
Interviewees report that because new federal requirements specify that managed care capitationrates must be actuarially sound, states are limited in whether managed care rates can be reducedor frozen. For some states, the new federal requirements even require substantial increases incapitation rates. As some of the interviewed MCO staff pointed out, an MCO’s ability to achievecost reductions depends largely on its provider and vendor contracts. For example, managedcare organizations may not be able to quickly or automatically reduce provider rates; they mustwait until their provider contracts are up for renewal and then negotiate with providers to acceptlower reimbursement. Depending on how much notice is provided to managed care organizationsprior to any cuts taking effect, managed care organizations may need to continue paying higherrates or providing benefits for which there is no or only partial reimbursement under existingcapitation rates.
PharmacyIn FY 2003, 46 states implemented cost containment initiatives directed at reducing pharmacyexpenditures, and 43 states indicated that they would implement new or additional pharmacyrelated initiatives in FY 2004. The most common initiative the states employ is to establish apreferred drug list (PDL), which requires providers to follow an override process in order toprescribe drugs not included on the state’s PDL. PDLs focus on promoting the use of lower-costdrugs.
Some states also negotiate supplemental rebates from drug manufacturers. The state negotiatesfor payment of a supplemental rebate from drug manufacturers, which is an amount that is abovethe standard federally required rebate. In exchange, the state includes the drug manufacturer onthe state's PDL.
Changes to benefitsIn FY 2003, 18 states restricted or reduced the availability of benefits, and in FY 2004, 17 statesplan to reduce or restrict benefits. Most of these states focused on restricting one or two optionalservices, such as adult dental and vision services.13 Depending on how much notice is provided,MCOs may need to continue providing benefits for which there is no, or only partial,reimbursement under the capitation rates. These organizations must provide sufficient notice tobeneficiaries and providers of any benefit changes before they can reconfigure their operationsand services.
12 The national information about specific Medicaid cuts presented in this section was drawn from theDecember 2003 update by Health Management Associates and Wachino: “States Respond to FiscalPressure,” unless otherwise indicated.13 These state numbers are based on the September 2003 report from the Kaiser Commission on Medicaidand the Uninsured: “Medicaid Spending: What Factors Contributed to the Growth Between 2000 and2002?” An updated survey, released in January 2004, does not break out the specific types of benefitcuts.
Changes to eligibilityIn FY 2003, 25 states reduced or cut eligibility for Medicaid enrollees, and in FY 2004, 18 statesplan to implement new eligibility restrictions. The temporary increase in federal matchingdollars for FYs 2003 and 2004 from the federal government (attributable to the Jobs and GrowthTax Relief Reconciliation Act of 2003) limits states’ ability to implement eligibility restrictions.To receive the additional federal funds, states must maintain eligibility at levels in effect as ofSeptember 2, 2003. This “maintenance-of-effort” provision has likely prevented states fromreducing eligibility for the last 15 months. If the higher federal matching rate for Medicaidexpires in 2004, states may consider reductions in eligibility as a way of reducing costs.
Co-paymentsIn FY 2003, 17 states imposed new or higher co-payments, and in FY 2004, 21 states willimplement either new or higher co-payments. These efforts are tempered by federal law, whichprotects beneficiaries from incurring excessive co-payment requirements that would preventthem from receiving necessary care. For instance, without a waiver from the federal government,states cannot apply co-payments to services delivered to children, pregnant women, andinstitutionalized individuals, and co-payments generally cannot exceed $3 per service. Inaddition, even if beneficiaries are unable to afford and do not pay the co-payments, providersstill must provide the service. Some state Medicaid agency staff interviewed reported that—asco-payments have been introduced or increased, providing MCOs and providers with additionalrevenue—they have reduced managed care capitation rates. However, reducing payment rates toreflect expected increases in co-payment collections could create a challenge for MCOs andproviders if they cannot actually collect the co-payment but are still obligated to deliver theservice. In this case, the MCOs/providers may experience a net loss.
Managed careIn the past, state Medicaid agencies turned to managed care to assist with cost containment, aswell as to improve access and quality. Since 1998, more than half of all Medicaid beneficiarieswere enrolled in some form of managed care (an MCO, pre-paid health plan, or primary carecase management program).14 By 2002, 58 percent of Medicaid’s beneficiaries were enrolled inmanaged care arrangements, with the majority of these enrollees—almost 64 percent—incapitated managed care plans.15 Since 1998, however, commercial MCOs have beenwithdrawing from capitated managed care programs, citing inadequate capitation rates.16 Thishas resulted in fewer participating MCOs per state, and the remaining MCOs are mostlyMedicaid-only MCOs. While Medicaid-only MCOs have a different mission from that ofcommercial MCOs, revenue levels and their ability to cover expenses remain a major concern.A small number of states are implementing managed care expansions to control expenditures. In2003, six states implemented such expansions, and the number is expected to grow to 13 in FY2004.
14 Neva Kaye, Medicaid Managed Care: A Guide for States, 5th edition (Portland, ME: National Academyfor State Health Policy, May 2001).15 Neva Kaye, National Academy of State Health Policy, Survey of State Medicaid Programs, 2003.16 R. Hurley and S. Somers, “Medicaid and Managed Care: A Lasting Relationship?” Health Affairs(January/February 2003): 77-88.
Interviews were conducted in each of the four study states to determine how each one hadapproached its Medicaid budget problems and to understand the current and future implicationsof various budget cutting strategies on the Medicaid managed care programs in those states and,potentially, in other states.
Criteria for selecting four case study states
Michigan, Florida, Massachusetts, and Oregon were selected, with the input of the projectadvisory group, primarily based on the application of the following five criteria.
• First, the state had significant deficits in FY 2004 (at least 7.5 percent of their overall statebudget). While states facing a budget deficit can choose to react by increasing revenues orby reducing non-Medicaid expenses, states with larger deficits are more likely to face theneed for substantive budget cuts.
• Second, a large number of the state’s beneficiaries (at least 25 percent) were enrolled in acapitated managed care program as of December 31, 2002. Unless the state had made asignificant investment in managed care, it might be able to look past its managed careprograms when making budget cuts.
• Third, the state had implemented a variety of cuts. By focusing on states that used a numberof different kinds of budget cutting strategies, we hoped to determine how they selectedspecific strategies and to explore the challenges posed by each one.
• Fourth, we sought to include states that represented different parts of the country. In doingso, we hoped to achieve greater representation of diverse populations and needs than mightotherwise have been possible.
• Fifth, we excluded states that were confronted with more than budget cut decisions, such asthose that were in court over policy change or states that were experiencing a change inleadership.
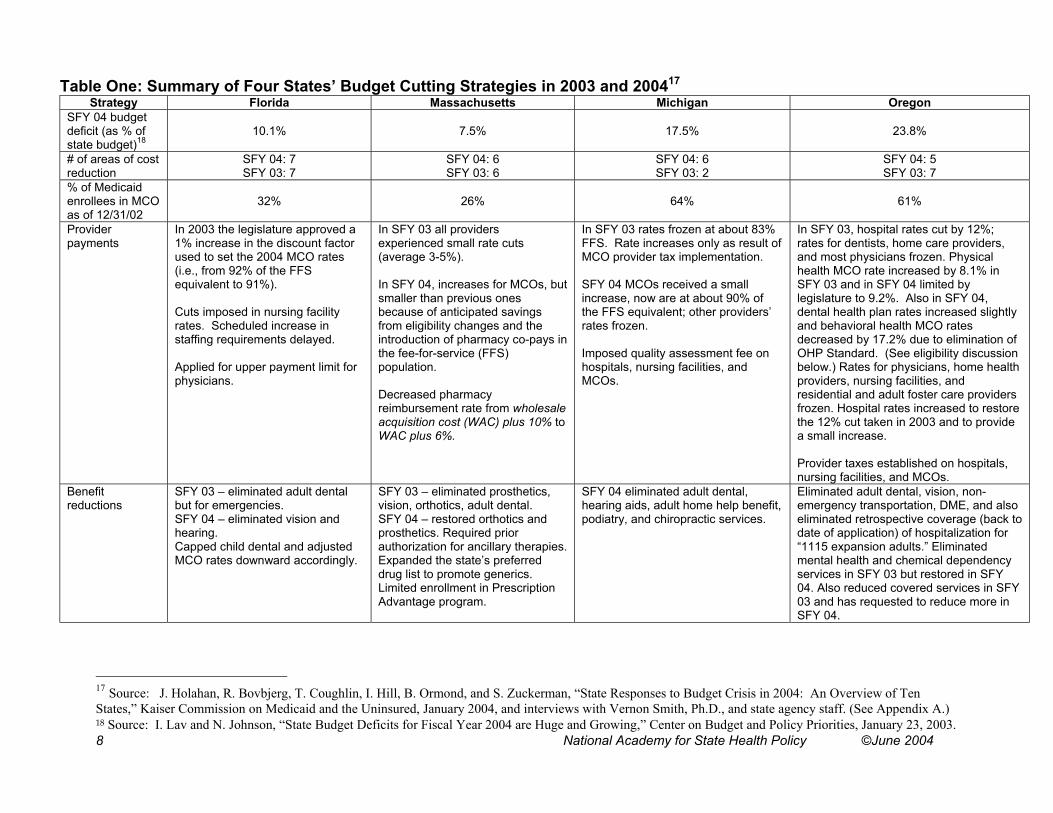
It should be noted that Michigan and Florida MCOs reported that they were in poor fiscal healthprior to the implementation of state budget cutting strategies in 2003 and 2004 because providersand MCOs in these states had not had adequate rate increases in several years. The followingtable depicts the budget cutting strategies used by the four selected states.
In 2003 the legislature approved a1% increase in the discount factorused to set the 2004 MCO rates(i.e., from 92% of the FFSequivalent to 91%).
Cuts imposed in nursing facilityrates. Scheduled increase instaffing requirements delayed.
Applied for upper payment limit forphysicians.
In SFY 03 all providersexperienced small rate cuts(average 3-5%).
In SFY 04, increases for MCOs, butsmaller than previous onesbecause of anticipated savingsfrom eligibility changes and theintroduction of pharmacy co-pays inthe fee-for-service (FFS)population.
Decreased pharmacyreimbursement rate from wholesaleacquisition cost (WAC) plus 10% toWAC plus 6%.
In SFY 03 rates frozen at about 83%FFS. Rate increases only as result ofMCO provider tax implementation.
SFY 04 MCOs received a smallincrease, now are at about 90% ofthe FFS equivalent; other providers’rates frozen.
In SFY 03, hospital rates cut by 12%;rates for dentists, home care providers,and most physicians frozen. Physicalhealth MCO rate increased by 8.1% inSFY 03 and in SFY 04 limited bylegislature to 9.2%. Also in SFY 04,dental health plan rates increased slightlyand behavioral health MCO ratesdecreased by 17.2% due to elimination ofOHP Standard. (See eligibility discussionbelow.) Rates for physicians, home healthproviders, nursing facilities, andresidential and adult foster care providersfrozen. Hospital rates increased to restorethe 12% cut taken in 2003 and to providea small increase.
Provider taxes established on hospitals,nursing facilities, and MCOs.
Benefitreductions
SFY 03 – eliminated adult dentalbut for emergencies.SFY 04 – eliminated vision andhearing.Capped child dental and adjustedMCO rates downward accordingly.
SFY 03 – eliminated prosthetics,vision, orthotics, adult dental.SFY 04 – restored orthotics andprosthetics. Required priorauthorization for ancillary therapies.Expanded the state’s preferreddrug list to promote generics.Limited enrollment in PrescriptionAdvantage program.
SFY 04 eliminated adult dental,hearing aids, adult home help benefit,podiatry, and chiropractic services.
Eliminated adult dental, vision, non-emergency transportation, DME, and alsoeliminated retrospective coverage (back todate of application) of hospitalization for“1115 expansion adults.” Eliminatedmental health and chemical dependencyservices in SFY 03 but restored in SFY04. Also reduced covered services in SFY03 and has requested to reduce more inSFY 04.
17 Source: J. Holahan, R. Bovbjerg, T. Coughlin, I. Hill, B. Ormond, and S. Zuckerman, “State Responses to Budget Crisis in 2004: An Overview of TenStates,” Kaiser Commission on Medicaid and the Uninsured, January 2004, and interviews with Vernon Smith, Ph.D., and state agency staff. (See Appendix A.)18 Source: I. Lav and N. Johnson, “State Budget Deficits for Fiscal Year 2004 are Huge and Growing,” Center on Budget and Policy Priorities, January 23, 2003.
Table One: Summary of Four States’ Budget Cutting Strategies in 2003 and 2004 (continued)Strategy Florida Massachusetts Michigan Oregon
Eligibilitycuts
SCHIP and Healthy Kids programsenrollment capped.
Discontinued outreach services.
SFY 03 cut unemployed adult expansionpopulation.
SFY 04 cut special status immigrants.Outreach services reduced.Eligibility determination process tightened.Non-entitlement program enrollment capand reinstatement of asset test for 19 to65 year olds were approved by legislaturebut will not be implemented in FY04.
During SFY 03/05 biennium, proposed toreplace the Medically Needy program andrestructure the Oregon Health Plan(OHP)19 into three distinct benefit plans:1. OHP Plus (provides a full package of
Medicaid benefits to all mandatoryMedicaid populations);
2. OHP Standard (provides a morelimited benefit package to low-incomeadults up to 100% FPL, who do notqualify for OHP Plus);
3. OHP premium assistance (providesassistance in purchasing privatecoverage for those with incomes up to200% FPL who do not qualify for OHPPlus or OHP Standard.
Also tightened eligibility rules.Co-pays,co-insurance,and premiums
Added 2.5% co-insurance for pharmacyand added 15% co-pay fornon-emergency use of emergency roomby non-pregnant adults.Regarding SCHIP, raised premiums forchildren’s programs ($15 per family permonth for families with income up to150% FPL and $20 per family permonth for families with income between150-200% FPL).
In SFY 04:• Pharmacy co-pay made mandatory
and increased from $.50 to $2.00 withan annual cap. (When it wasvoluntary, most MCOs did not enforce.)
• Added co-pay for inpatient stays.• Implementing small premium for all
Medicaid populations.
SFY 04 co-paymentsimplemented forprescription drugs, officevisits, non-emergency useof emergency room, andoptometry for one group ofeligibles and proposed fora second group.
In SFY 03, added pharmacy co-pays forOHP standard and some Pluspopulations. Mandatory co-payments forpremium assistance population.
Diseasemanagement
Ongoing relationship with twopharmaceutical companies.
Plan to target high cost Medicaidmembers.
Implemented pharmaceutical costmanagement initiatives: preferred druglist, disease management for asthma,diabetes, and congestive heart failure.Case management for high cost eligibles.
Other The legislature directed that managedcare enrollment in MCOs be increasedto 55% in 2003 and to 60% in 2004.Fraud and abuse and long-term carecost reduction strategies implementedin SFY 03 and SFY 04.
Plan to target increased managed careenrollment for SFY 05. ImplementedSenior Care Options to improvemanagement of “dual eligibles.”Expanded estate recovery efforts.Implemented fraud and abuse reductionstrategies in SFY 03 and SFY 04, andlong-term care cost reduction strategiesimplemented in SFY 04
Fraud and abusereduction strategiesimplemented in SFY 04.
The legislature directed that managedcare enrollment in MCOs be increased to70%.Managed care expansion strategyimplemented in SFY 04.Long-term care cost reduction strategiesimplemented in SFY 03 and SFY 04.
19 Oregon’s Medicaid program operates under an 1115 waiver and is referred to as the Oregon Health Plan.
Bailit staff created a questionnaire, reviewed by the advisory group and approved by NASHP,with which to seek state agency staff and MCO representatives’ thoughts on the following:
• Whether state agency staff participated in and had discretion over what Medicaid budgetcutting strategies would be proposed in state fiscal years 2003 and 2004;
• Whether state agency staff had anticipated the impact of budget cutting strategies— eitherdirect (such as MCO rate cuts) or indirect (such as cuts or increases in other providers’reimbursement)—on its Medicaid-participating MCOs;
• Whether the state’s budget cutting strategies had an impact on Medicaid-participating MCOs;• Whether the MCOs and primary care providers (in the case of state Medicaid agencies with
PCCMs) worked with the state in developing the proposed Medicaid budget cuttingstrategies;
• What budget cutting strategies might be proposed for the coming state fiscal year andwhether the state agency staff anticipated that these strategies would have an impact on theMedicaid-participating MCOs;
• Whether the state agency staff believed the Medicaid-participating MCOs were stronger orweaker as a result of the budget cutting strategies implemented; and
• What the state Medicaid and oversight agency staff sentiment was regarding the importanceof maintaining the Medicaid managed care program.
The questionnaire is included here as Appendix C.
Bailit staff first contacted Medicaid directors or directors of the Medicaid oversight agencies ineach of the four selected states and conducted telephone interviews using the questionnaire.Bailit then scheduled follow-up interviews with the state agency staff charged with MCOoversight in each state to get more detailed information on the nature of the discussion betweenthe state agency staff and the Medicaid-participating MCOs regarding budget cutting strategies.
The state personnel who were interviewed for this project are included in Appendix A, as are themembers of the project’s advisory group. We have withheld the names of the MCOrepresentatives we interviewed and the MCOs they represent in order to ensure confidentiality.
The following findings are based on interviews with state Medicaid and Medicaid MCOoversight agency staff, and with MCO representatives of at least one health plan in each of thefour states. It should be noted that references to the “state” or “state staff” refer to the stateagencies that employ those who were interviewed and not to the Governor’s office or thelegislature.
The Four States’ Medicaid Agencies Have Some Discretion InProposing Budget Cut Strategies
In each of the states in which we interviewed state agency staff, the Medicaid budget cuttingstrategies that had been implemented or were being implemented by agency staff were usuallynot strategies that had been dictated by the legislature. At the Medicaid program level, the staffhave the discretion to propose budget cut strategies to the Governor’s office and the legislature.Furthermore, the four states’ Medicaid agencies and Medicaid oversight agencies reported strongcommitment to their managed care programs and sought to protect them during budgetdevelopment. They all indicated that they value their managed care programs, and particularlytheir capitated health plans, as a means to manage costs, and ensure access and quality. Stateagency representatives in two states stated that it was only through the managed care plans thatthey were able to ensure that Medicaid-participating providers were paid adequately and that thishad been a key motivator in moving to managed care in the first place. Agency staff in all fourstates reported that, among other objectives, they had wanted to avoid a negative impact on thefinancial viability of the MCOs. This was borne out by the types of budget cutting strategies theyproposed.
Most of the four states had already experienced several years of budget cutting, and so provider-based cuts, usually the first target of systemic budget reductions, had already been exhausted. Inall four cases, the state agencies first targeted cuts on optional benefits and implemented verymodest co-payments for some services or premiums. In some cases the proposed benefit cuts didnot apply to the Medicaid MCO enrollees, while in most cases, the co-payments or premiumsdid. In addition, in most cases, the state agencies proposed providing rate increases for theMCOs, albeit modest ones, even, in some cases, when other providers’ rates were frozen.
In a couple of states, the legislature was, or ultimately became, directive about one or twospecific cuts, but in general, legislatures granted the Medicaid agencies considerable flexibility indetermining the array of budget cutting and implementation strategies they would employ. In thecase of the agencies that ultimately received legislative directives that affected the Medicaidbudget, in general, the directives focused on the calculation of specific Medicaid providers’ rateincreases and whether, and by how much, Medicaid managed care enrollment in MCOs shouldbe increased. In general, the legislative directives resulted after extensive sessions with the stateagency staff and external stakeholders, including Medicaid-participating providers andadvocates, during which the anticipated impact of a variety of budget cutting strategies,including their impact on managed care, were debated.
The Extent to Which Medicaid Agencies Include the MCOs in BudgetReduction Strategy Development Varies
Typically, in the four states, the Medicaid agency staff use extensive internal processes todevelop their proposals. However, the manner and degree of health plan involvement in thestate’s budget and implementation strategy development processes varies by state. In two cases,the MCOs were invited to participate before the state agency’s budget was proposed to thelegislature, and in the other two cases, external parties including the MCOs were excluded anddid not participate in the budget discussions until the Medicaid agency’s and the Governor’sproposals had been presented to the legislature. In all four states, the MCO operational staffmeet fairly regularly with the state Medicaid managed care operations staff.
Also in all four states, regardless of whether the plans had input into the cost cutting strategiesproposed by the state agency, opportunities did exist for the MCOs to comment on how a newbudget initiative might be implemented in order to minimize any negative effects on the MCOs.One state, for example, included MCO representatives in the planning for the implementation ofa premium. The MCO representative was able to work with the state agency staff to ensure thatthe proposed implementation procedures would not be too complex and administrativelyburdensome on the MCOs or the MCOs’ participating providers.
The MCOs expressed appreciation for the opportunity to participate in budget discussionswhether their involvement begins within the state agency or occurs only in the legislativeprocess.
State Agencies Have Not Devoted Significant Resources to Identifyingthe Indirect Effects of Budget Reduction Strategies on the MCOs orHow to Mitigate Them. Such Effects Can Be Significant.
The state agencies reported that they did not devote significant resources to considering theindirect impact of changes on the MCOs, such as changes to fee-for-service (FFS) providerpayment rates, eligibility rules, new or increased cost-sharing and state agency staffing. Interviewed MCOs reported that these changes have had a significant adverse administrative andfinancial impact on the MCOs. The most significant indirect effects reported by the MCOs wereas follows:
Decrease in MCO rates to reflect budgeteddecrease in fee-for-service provider paymentrates.
Rate basis, and thus rates, decreased,although MCOs were unable to realize thesame amount of savings. In addition, somesavings have not materialized.
Eligibility changes including:• Tighter rules• Elimination of some covered
populations.
Need to reduce MCO staff.Increase in membership churning.Reduction in membership.Increased administrative burden.
Increased or new premiums and co-pays Reduction in membership.Increased administrative burden.
State staff reduction Increased administrative burden.
Benefit reductions Managing fewer benefits makes it harder forplans to manage members’ care cost-effectively.
State agency staff, even those who were involved in budget cutting strategy development,indicated that they, themselves, did not spend time projecting the impact of non-rate changes onthe MCOs. In most cases, the state agency staff indicated that even had they contemplated doingso, they did not have sufficient data from the MCOs nor the time required to project the impact.In the two states in which MCOs participated with the state staff in the development of possiblebudget cutting strategies, MCO staff were able to identify potential impacts fairly early in theprocess, and the agency staff considered these impacts sooner than in other states.
The area of greatest contention between the MCOs and state agency staff was around whether,and how, the states factored projected savings for cost cutting initiatives that targeted the fee-for-service population into the rate basis for the MCOs’ new rates. Arguments most commonly heardfrom the MCOs were:
• The state assumed the MCOs could achieve the same savings projected for the fee-for-service population. For example, one state Medicaid agency imposed a pharmacy co-payment to help contain costs on the fee-for-service program and reduced the capitation ratepaid to the MCOs to reflect the same level of savings as that projected for the FFSpopulation. The MCOs, however, had a contractual provision in place that prohibited themfrom collecting a co-payment, which prevented them from obtaining any savings from theimplementation of a co-payment. Furthermore, although the contractual provision can bechanged, it cannot be changed without renegotiating the contract, which is typically notsomething that can be quickly achieved.
• One MCO reported that sometimes the state Medicaid agency projected an amount of savingsfrom a policy change that the MCOs believed could not, in fact, be achieved. Becausecapitation payments are calculated prospectively, the full amount of anticipated savings wasbuilt into the MCO rate-setting calculations, thus reducing the MCO’s capitation rate by anamount of savings that the MCO could not achieve.
• MCOs also argued that the savings produced by some changes might be offset by increasesin utilization of other services and that these potential increases in cost were not taken intoaccount in the rate-setting process. Some MCOs reported that they believed that thisthreatened their financial viability. A couple of MCOs indicated that they were not confidentthat the state Medicaid agency’s actuary would develop an actuarially sound rate and soughta fuller understanding of how the rates were developed.
State Agency Staff Expressed Satisfaction with an Arduous YetEffective Budget Reduction Process
States agencies judged their budget cutting processing successful since they were able to achievebudget passage without fundamentally undermining their programs and negatively impactingaccess to care. In at least one case, this was accomplished with no legislative alteration. In allfour cases, the state agency staff described the sessions with the legislature to be longer and moreinvolved than usual. Despite the process being so time-consuming, states expressed satisfactionthat they had done the best that they could in a bad situation. One state agency representativesuggested that the process had resulted in a legislature that is now much better educated aboutthe Medicaid program.
State Agency Staff and MCOs Are Realistic About the State of theEconomy
State agency staff and MCOs both recognize that the economy, and hence the health of the state'sbudget, fluctuates over time. Still, despite all the budget cutting strategies that have beenimplemented, the states are all concerned that they may not yet be able to manage expenseswithin the approved budget and that they will be obligated to find more to cut. Some within thestates believe there is nothing left to cut without seriously harming the viability of the Medicaidprogram and the Medicaid managed care program. In states that had some idea of the cuts thatwould be sought for 2005, the agency staff thought that efforts would be made to protectMedicaid and the Medicaid managed care programs.
Most State Agency Staff and MCOs Perceive Medicaid Managed Careas Weaker
Staff members of both the state agencies and MCOs interviewed for this report view theMedicaid managed care programs as weaker than they were and, in some cases, quitevulnerable. Despite an awareness of the states’ financial problems and concern about the impactcost cutting will continue to have on them, the MCOs report that they remain committed to theMedicaid business. They perceive the Medicaid budget as a target for cost cutting andsympathize with the difficult position of the state Medicaid staff. They did not suggest that stateagency staff have targeted savings initiatives at the MCOs. Still, some MCOs have left Medicaidentirely, unable to bear the rates of its hospital providers given the capitation rate. Others havedropped coverage of the disabled population, suggesting that the cushion once built into the non-disabled rate, a cushion used to offset inadequate rates for the disabled population, is no longerthere.
State agency staff expressed the hope that they will be able to protect MCOs participating inMedicaid managed care from further cuts. In cases in which an MCO has left, has threatened toleave Medicaid, or has dropped a population, the state agency staff have been able or willattempt to find arrangements that will enable the MCO to continue to participate. Sucharrangements in the future include, in one state, creating a contract with the MCO as a partiallycapitated organization that excludes inpatient hospital coverage. This action minimizes the riskthat the MCO will have to bear, a necessary arrangement in this state because of pending stateeligibility changes that will result in uncertain enrollment volumes.
It is apparent that the magnitude of cost cutting in the Medicaid budget in each of the four stateshas been great and may continue to be so. In each state the legislature has generally afforded theagencies the opportunity to propose their Medicaid budgets prior to mandating any Medicaidcuts. In only two of the states did the legislatures weigh in and direct two specific changes, bothof them pertaining to MCO rates. Most of the Medicaid budget reduction strategies in the fourstates, even if not directed at MCOs, appeared to have implications for the MCOs, typically interms of decreasing the plans’ membership or in decreasing the fee-for-service base used incalculating the MCO rates.
In two states, Oregon and Michigan, the development of the Medicaid and the Medicaidmanaged care budget is a more inclusive process than in the other two states, and the MCOs inOregon and Michigan clearly appreciate the sense of collaboration with the state. However, stateagency staff in all four states generally indicated that when developing the Medicaid andMedicaid managed care cost projections and budget reduction strategies, they did notcomprehensively analyze the potential negative indirect impact on the MCOs. In Oregon, thestate did not have the data or the resources to do so. Because they were included in at least partof the cost cutting process, the MCOs in Michigan and Oregon may have had more opportunityto provide input on, and possibly prevent, budget cutting strategies that would have asignificantly negative indirect impact on them, but it cannot be concluded from the interviewsconducted that this was so.
The state staff interviewed in all four states expressed strong support for Medicaid managed careand an emphasis on MCOs over PCCM programs. In three of the four states, strategies will beimplemented to increase MCO enrollment.
In determining future budget cuts, it is recommended that state agencies that seek to sustain thehealth of MCOs participating in Medicaid managed care and to facilitate their successfulparticipation in the program carefully consider the potential effects on the MCO of proposed costcutting strategies. In particular, states may wish to assess the impact of strategies of savingsprojections in fee-for-service that will be factored into the calculation of MCO rates. In addition,states might also consider consulting the MCOs in the early development of their budgetreduction strategies so that the plans may raise issues and offer suggestions before strategies areadopted.
National Academy for State Health Policy @June 2004
Appendix A
National Academy for State Health Policy @June 2004
STATE AGENCY PERSONNEL INTERVIEWED ANDADVISORY GROUP MEMBERS
During December 2003 and January 2004 the following state staff were interviewed:
FloridaKen Thurston, Chief Financial Officer, MedicaidRobert Butler, Bureau Chief for Medicaid Program Analysis
MassachusettsDoug Brown, ex-Medicaid directorLinda Green, responsible for all Medicaid managed care rate analysis and developmentDarrin Shaffer, Chief Financial Officer, MedicaidTrisha Spellman, ex-Medicaid budget directorKate Willrich-Nordahl, the state’s HMO program director
MichiganJanet Olszewski, Director of the Michigan Department of Community HealthSue Moran, Director of the Bureau of Medicaid Programs and Quality Assurance
OregonLynn Read, Administrator of the Oregon Medical Assistance ProgramJoan Kapowich, Manager of the Program and Policy Unit
The following were advisory group members to the project:
Barbara EdwardsDeputy DirectorOffice of MedicaidOhio Department of Jobs and Family Services
Catherine HalversonSenior Vice PresidentBusiness Development and Government RelationsCentene Corporation
Kay HolmesChief AdministratorManaged Care Claims and Quality AssuranceDivision of Social ServicesDelaware Department of Health and Social Services
National Academy for State Health Policy @June 2004
Appendix B
National Academy for State Health Policy @June 2004
BACKGROUND ON STATES’ STRATEGIES FOR REDUCING MEDICAIDEXPENDITURES
Medicaid Cost Containment Approaches Employed Over the PastSeveral Years
For FY 2003 and FY 2004, the Kaiser Family Foundation report cites five primary areas wherestates are focusing their cost-containment policies: provider payments, pharmacy, benefits,eligibility, and beneficiary cost-sharing.
Provider payments
For FY 2003, all but one state cut or froze Medicaid payment rates for at least one providergroup—hospitals, physicians, nursing homes, or managed care organizations—and 39 states hadplans to either freeze or reduce provider payment rates in FY 2004.20
Because new federal requirements specify that managed care capitation rates must be actuariallysound, states are limited somewhat in precisely how much managed care rates can be reduced orfrozen. (Of course, actuarially sound rates do not guarantee positive operating margins.) Forsome states, the new federal requirements even require substantial increases in capitation rates.For instance, Michigan Medicaid staff reported that they competitively bid their 2000 managedcare contracts based largely on price. Health plan officials noted this resulted in very low rateswith no rate adjustments for future years.21 Going forward, however, given the new federalrequirements, state agency staff report that it is likely Michigan will need to evaluate bids onfactors other than price, such as quality of care.
Even with the new federal requirements, 14 states planned to freeze their managed care rates inFY 2004; five other states planned to reduce rates, reflecting either benefit or provider ratereductions or capitation rates that were too high.22 A managed care organization’s ability torealign its operations depends largely on its provider and vendor contracts. For example,managed care organizations may not be able to simply reduce provider rates; more than likelythey must wait until their provider contracts are open for renewal. Depending on how muchnotice is provided to managed care organizations prior to any cuts taking effect, managed careorganizations may need to continue paying higher rates or providing benefits for which there isno or only partial reimbursement under existing capitation rates. Finally, freezing or reducing 20 Unless otherwise noted: Health Management Associates, V. Wachino, and M. O’Malley. StatesRespond to Fiscal Pressure: A 50-State Update of State Medicaid Spending Growth and CostContainment Actions. Kaiser Commission on Medicaid and the Uninsured, January 2004.21 K. Morris, “4 Medicaid HMOs mired in insolvency; If they lose deal, patients lose too,” Detroit FreePress, September 12, 2003.22 See note 1. The January 2004 updated survey results do not break out the type of provider paymentcuts. Please note, though, the total number of states indicating provider payment reductions for fiscalyear 2004 fell from 49 to 39 between the September 2003 report and the January 2004 update.
National Academy for State Health Policy @June 2004
reimbursement rates magnifies the administrative burden and the cost of increased reportingrequirements for managed care organizations.
Pharmacy
In FY 2003, 46 states implemented cost-containment initiatives directed at reducing pharmacyexpenditures, and 43 states indicated that they would implement new or additional pharmacyrelated initiatives in FY 2004. The most common initiative is establishing a preferred drug list(PDL), which requires providers to follow an override process in order to prescribe drugs notincluded on the state’s PDL. PDLs focus on promoting the use of lower-cost drugs.
Many states also negotiate supplemental rebates from drug manufacturers. The state negotiatesfor payment of a supplemental rebate from drug manufacturers, which is an amount that is abovethe standard federally required rebate. In exchange, the state includes the drug manufacturer onthe state's PDL.
The savings achieved from PDLs and supplemental rebates have sparked an ongoing debateregarding whether or not states would be more successful than managed care organizations atcontrolling pharmacy expenditures. Arizona commissioned The Lewin Group to analyze theeffectiveness of carving out pharmacy from its managed care program. Lewin concludedultimately that a carve-out option would not create additional savings.23
Changes to benefits
In FY 2003, 18 states restricted or reduced the availability of benefits, and in FY 2004, 17 statesplan to reduce or restrict benefits. Most of these states focused on restricting one or two optionalservices, such as adult dental and vision services.24 A few states made more severe changes. Forinstance, although they will increase some benefits, Oregon and Utah applied to the federalgovernment for a waiver to reduce benefits for select eligibility groups while increasing otherbenefits. Oregon, for instance, wants to eliminate non-emergency hospital services and insteadprovide expanded mental health and substance abuse services.
Depending on how much notice is provided, MCOs may need to continue providing benefits forwhich there is no or only partial reimbursement under the capitation rates. These organizationsmust provide sufficient notice to beneficiaries of any benefit changes before they can reconfiguretheir operations and services. Similarly, MCOs must honor contractual obligations withproviders, the provisions of which may not change until the contracts are renegotiated.
23 The Lewin Group, Analysis of Pharmacy Carve-Out Option for the Arizona Health Care CostContainment System (Center for Health Care Strategies, Inc., November 2003).24 Health Management Associates (HMA) and Victoria Wachino, “States Respond to Fiscal Pressure:State Medicaid Spending Growth and Cost Containment in Fiscal Years 2003 and 2004” (Washington,DC: Kaiser Commission on Medicaid and the Uninsured, September 2003). The January 2004 updatedsurvey does not break out the specific types of benefit cuts.
National Academy for State Health Policy @June 2004
Changes to Eligibility
In FY 2003, 25 states reduced or cut eligibility for Medicaid enrollees, and in FY 2004, 18 statesplan to implement new eligibility restrictions. The temporary increase in federal matchingdollars for FY 2003 and FY 2004 from the federal government (attributable to the Jobs andGrowth Tax Relief Reconciliation Act of 2003) limits states’ ability to implement eligibilityrestrictions. To be eligible, states must maintain eligibility at levels in effect as of September 2,2003. This “maintenance-of-effort” provision—although offset by the higher federal match—has the potential to compound the financial strain on states’ Medicaid budgets.
Eligibility restrictions can have a ripple effect on MCOs’ operations. MCO financial projectionsare based on serving a certain level and distribution of enrollees. A significant decrease in thenumber of enrollees (which could result from new eligibility restrictions) may affect an MCO’sability to achieve economies of scale and thereby cover operating costs. In addition, someMCOs use payment for lower-cost enrollees to help sustain the costs of higher costs enrollees.Should enrollment fall disproportionately, leaving a disproportionately higher volume of highercost Medicaid managed care enrollees enrolled than previously, managed care organizations mayfind covering Medicaid managed care enrollees to be too great a financial burden.
Co-payments
In FY 2003, 17 states imposed new or higher co-payments, and in FY 2004, 21 states willimplement either new or higher co-payments. These efforts are tempered by federal law, whichprotects beneficiaries from incurring excessive co-payment requirements that would preventthem from receiving necessary care. For instance, co-payments cannot apply to children,pregnant women, and institutionalized individuals, and they generally cannot exceed $3 perservice. In addition, even if beneficiaries are unable to afford the co-payments, providers stillmust provide the service.
In essence, states are reducing managed care capitation rates to account for the collection of co-payments. But not every beneficiary can afford the co-payments. Because providers are unableto deny services to beneficiaries for this reason, providers must pick up this cost; they are nottypically reimbursed by the state or managed care organizations. Accordingly, providers mayeither not accept Medicaid patients or attempt to negotiate an arrangement with the managed careorganization to ensure they receive appropriate compensation. For these reasons, rather thanimplementing co-payments, managed care organizations often opt instead to operate with lowercapitation rates.
The KFF report notes in passing that a small number of states are implementing managed careexpansions to control expenditures. Six states did so in FY 2003, and the number is expected togrow to 13 in FY 2004. Some states are also restructuring their existing managed care programs.For example, Delaware is saving money by switching from a managed care program with two
National Academy for State Health Policy @June 2004
outside contracts to a program with only one contract, operated in combination with a state-operated PCCM program.25
Temporary federal fiscal relief also allowed 27 states to minimize or delay some of their FY2004 cuts.26 When federal matching rates return to normal levels in FY 2005, however, statesmost likely will have to implement deeper cuts in order to keep pace with the rise in Medicaidexpenditures over the prior two fiscal years.
Finally, as states move toward difficult and politically-sensitive cuts, like provider rates orbenefits and eligibility requirements, interested parties are turning to the courts. For instance,when California announced an across-the-board reimbursement cut of five percent for allproviders (except for inpatient and outpatient services, nursing homes, and county clinics),twelve provider groups filed a lawsuit claiming that the measure violates the Social Security Act,which requires that Medicaid rates “attract enough doctors to serve the program’s patients.”27
How involved the courts will be in these types of issues has yet to be determined.
The following table summarizes the strategies adopted by each of the 50 states to reduceMedicaid expenditures in FY 2003 and FY 2004.
25State of Delaware. Governor Ruth Ann Minnor. Remarks to the U.S. House Budget Committee,www.state.de.us, Friday, October 17, 2003.26 Health Management Associates, V. Wachino, and M. O’Malley. “States Respond to Fiscal Pressure: A50-State Update of State Medicaid Spending Growth and Cost Containment Actions.” KaiserCommission on Medicaid and the Uninsured, January 2004.27 “12 Groups Representing Medicaid Providers In California File Suit Against State To Prevent PaymentReductions,” Daily Health Policy Report (Nov. 11, 2003) <<http://www.kaisernetwork.org/daily_reports/rep_index.cfm?hint=3&DR_ID=20804>>.
National Academy for State Health Policy @June 2004
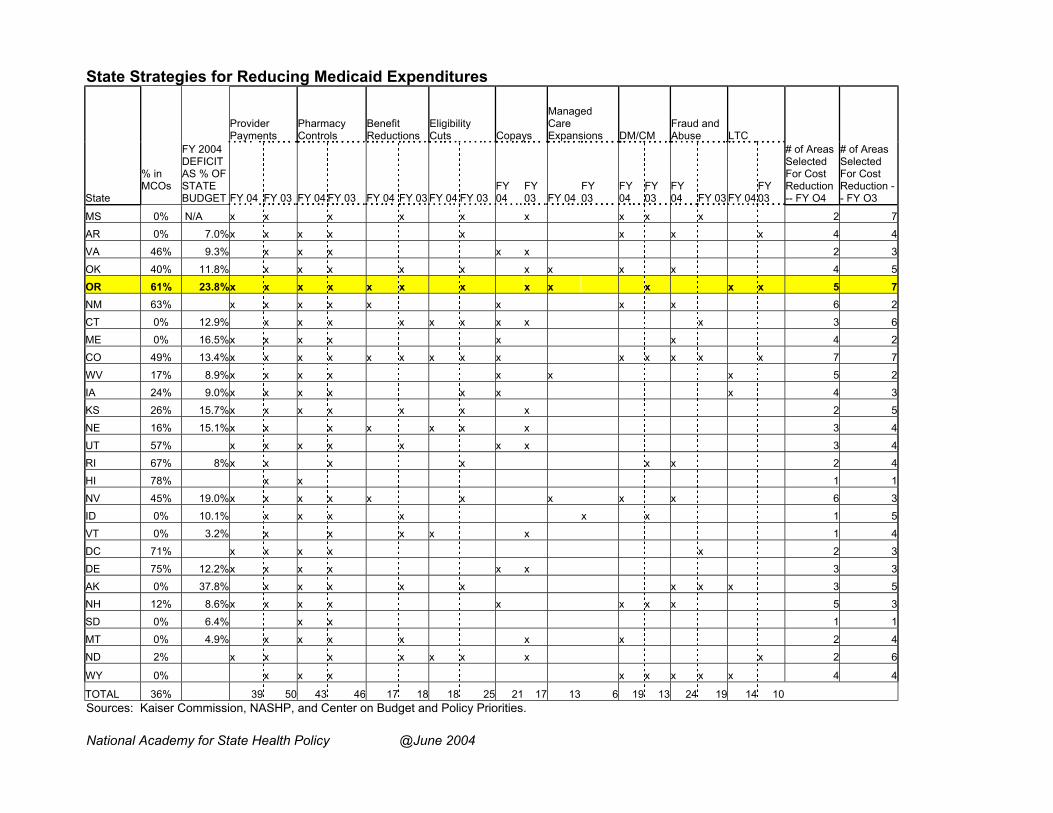
State Strategies for Reducing Medicaid Expenditures(States listed in order of the size of their Medicaid population, from largest to smallest)
CA 48% 28.6%28 x x x x x x x x x 5 4NY 13% 26.7% x x x x x x 3 3FL 32% 10.1% x x x x x x x x x x x x x x 7 7TX 30% 19.3% x x x x x x x x x x 7 3IL 8% 14.8% x x x x x 1 4OH 26% 9.2% x x x x x x x x x x x 7 4PA 70% 6% x x x x x x x 2 5TN 100% 6.6% x x x x x 3 2MI 64% 17.5% x x x x x x x x x 6 2GA 0% 5.8% x x x x x x x x x x 6 4NC 1% 14.6% x x x x x x x x x 5 4MA 26% 7.5% x x x x x x x x x x x x 6 6WA 49% 10.4% x x x x x x x x x x x x 7 5MO 44% 13.1% x x x x x x x x x 4 5NJ 74% 19% x x x x x x x 5 2SC 6% 13.6% x x x x x x x x x x 5 5LA 0% N/A x x x x x x x x x x x x 6 6AZ 100% 15.3% x x x x x x x 4 3AL 0% 9.3% x x x 0 3IN 36% 8.8% x x x x x x x x x x x x x x x 8 7WI 48% 17.6% x x x x x x x x x x x 9 2MD 75% 11% x x x x x x x x 5 3KY 19% 5.1% x x x x x x x x x x 4 6MN 68% 18.7% x x x x x x x x 6 2
28 The percent noted for CA, NY, TX, PA, MA, OR, ME, NE, and RI represent the midpoint of the range of the estimated budget deficit as a percent of the state budget.
National Academy for State Health Policy @June 2004
State Strategies for Reducing Medicaid Expenditures
MS 0% N/A x x x x x x x x x 2 7AR 0% 7.0%x x x x x x x x 4 4VA 46% 9.3% x x x x x 2 3OK 40% 11.8% x x x x x x x x x 4 5OR 61% 23.8%x x x x x x x x x x x x 5 7NM 63% x x x x x x x x 6 2CT 0% 12.9% x x x x x x x x x 3 6ME 0% 16.5%x x x x x x 4 2CO 49% 13.4%x x x x x x x x x x x x x x 7 7WV 17% 8.9%x x x x x x x 5 2IA 24% 9.0%x x x x x x x 4 3KS 26% 15.7%x x x x x x x 2 5NE 16% 15.1%x x x x x x x 3 4UT 57% x x x x x x x 3 4RI 67% 8%x x x x x x 2 4HI 78% x x 1 1NV 45% 19.0%x x x x x x x x x 6 3ID 0% 10.1% x x x x x x 1 5VT 0% 3.2% x x x x x 1 4DC 71% x x x x x 2 3DE 75% 12.2%x x x x x x 3 3AK 0% 37.8% x x x x x x x x 3 5NH 12% 8.6%x x x x x x x x 5 3SD 0% 6.4% x x 1 1MT 0% 4.9% x x x x x x 2 4ND 2% x x x x x x x x 2 6
WY 0% x x x x x x x x 4 4
TOTAL 36% 39 50 43 46 17 18 18 25 21 17 13 6 19 13 24 19 14 10 Sources: Kaiser Commission, NASHP, and Center on Budget and Policy Priorities.
National Academy for State Health Policy @June 2004
Appendix C
National Academy for State Health Policy @June 2004
QUESTIONNAIRE USED TO INTERVIEWSTATE AGENCY STAFF AND MCO REPRESENTATIVES
Questions for State Agency Personnel
Origins of Budget-Driven Program Changes
1. Did you receive a legislative or administrative mandate to cut a specific amount fromyour Medicaid managed care budget in FY03? In FY04?If so, who mandated the cut(s) and what was the budget percentage and/or dollar amountyou were mandated to cut each year? (If a dollar amount, what percentage of the budgetcut does that equate to?)
Basis for Determining Specific Program Changes (both for deciding to make a certainchange and for implementation of changes)
2. In both FY03 and FY04, how did you determine where to make program changes in orderto achieve net expenditure reductions?
------- the legislature specified------- the Governor’s office specified------- we were given discretion as to how to reduce expenditures------- a combination of the above (please explain)
If the legislature and/or Governor’s office specified, was the potential direct and indirectimpact on the managed care system considered by them?
3. If you were given partial or full discretion regarding how the savings would be achieved,explain the process that you followed to develop your recommendations and whether thedirect or indirect impact on your managed care program was considered. (probe: Who,both inside and outside of the agency, participated in the policy development anddecision-making process, especially whether representatives interested in managed carewere part of the process? Probe for MA, OR and FL: ask interviewees to delineate theirresponses by the PCCM vs. MCO programs)
4. Did you employ any overarching principles when deciding where and how to makeexpenditure reductions? If so, what were they? (probe: Did any of the principles includeconsiderations relative to the managed care program, e.g., ensuring adequate rates?(forFL, MA and OR ask interviewees to speak about MCOs and PCPs)
5. How well do you think the decision-making process worked?
National Academy for State Health Policy @June 2004
Impact of Program Changes
6. Have you assessed the impact of the changes made in FY03? If so, what were the directand indirect impacts? Did they achieve budgetary objectives? (ask FL, MA and OR tospeak in terms of PCPs vs. MCOs)
7. Were there indirect effects of FY03 changes that were not anticipated? For example:a. if there were changes in eligibility, did it make HMO or PCCM contractors less
viable due to loss of volume?b. if provider rates were changed, what impact did it have:
on plan rates? on the provider rates used by the plans? on PCP reimbursement? (for FL, MA and OR)
c. if cost-sharing increased or was imposed, how did the HMOs and state decide tohandle this?
d. if benefits changed, for example if your pharmacy carve-out moved to aformulary, how did this affect HMO programs, such as disease management?How did it affect the PCPs?
8. What impact are the FY04 changes having on your Medicaid managed care programs?
a. Capitated MCO program(s)b. PCCM program
9. As you went through the implementation process, what issues came up (both from theagency and the plans) and how did you work with the plans to address the issues?
10. (For FL, MA, OR) What issues came up with PCPs and how did you work with them toaddress the issues?
Prospects for Medicaid Managed Care
11. Is your state’s Medicaid managed care program stronger or weaker as a result of theseprogram changes? Will it continue to be an important part of your Medicaid program?Why?
12. Looking ahead, do you believe that managed care will be an important cost managementstrategy for your agency?
13. What cuts do you anticipate making in FY05? What impact will it have on your managedcare program?
National Academy for State Health Policy @June 2004
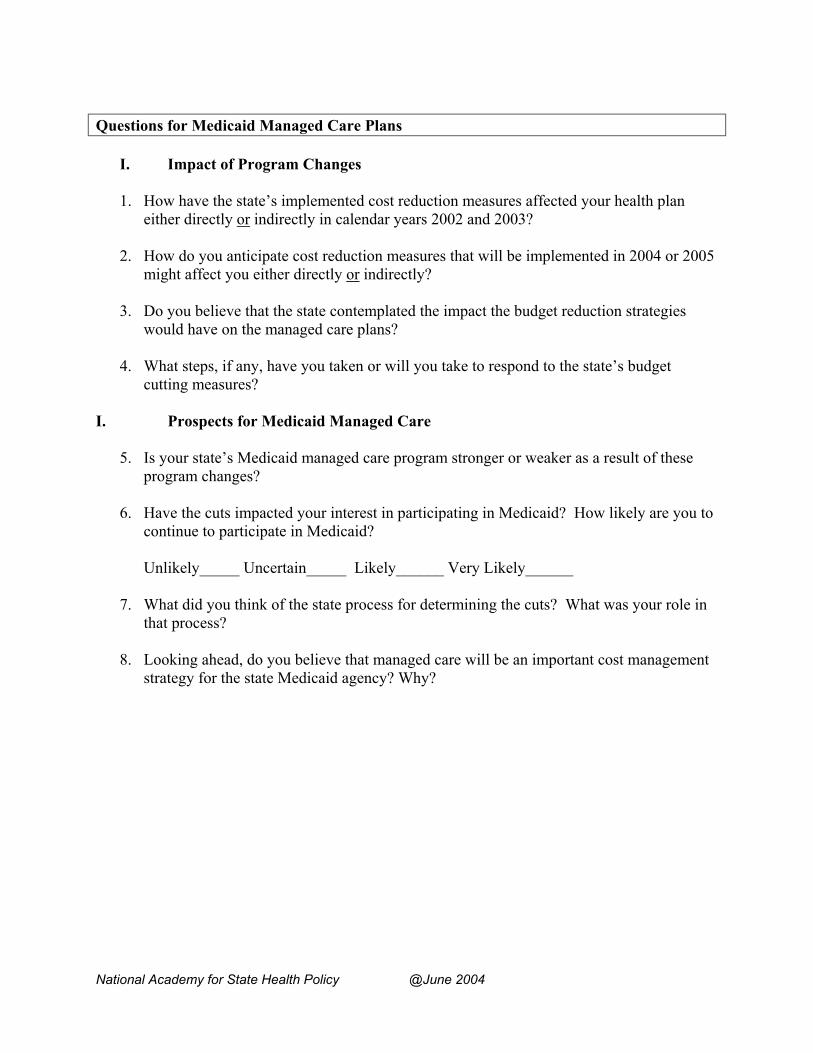
Questions for Medicaid Managed Care Plans
I. Impact of Program Changes
1. How have the state’s implemented cost reduction measures affected your health planeither directly or indirectly in calendar years 2002 and 2003?
2. How do you anticipate cost reduction measures that will be implemented in 2004 or 2005might affect you either directly or indirectly?
3. Do you believe that the state contemplated the impact the budget reduction strategieswould have on the managed care plans?
4. What steps, if any, have you taken or will you take to respond to the state’s budgetcutting measures?
I. Prospects for Medicaid Managed Care
5. Is your state’s Medicaid managed care program stronger or weaker as a result of theseprogram changes?
6. Have the cuts impacted your interest in participating in Medicaid? How likely are you tocontinue to participate in Medicaid?
Unlikely_____ Uncertain_____ Likely______ Very Likely______
7. What did you think of the state process for determining the cuts? What was your role inthat process?
8. Looking ahead, do you believe that managed care will be an important cost managementstrategy for the state Medicaid agency? Why?