Appendix H. Hospitals: Quantitative Evidence Section A Table H1. Hospital quantitative studies: columns 1-8 of 18 (pages H-1 to H-18) Author, Year (QA) 1. Study Purpose and/or a priori Hypothesis: 2. Geographic Location 3. Study design 4. Sample/ Population 5. Primary Comparison 6. Outcomes 7. Public Report Name and Description * 8. Context: Environment Characteristics Apolito 2008 3 (Good) To investigate the management and outcomes of patients with AMI complicated by cardiogenic shock in New York and other states enrolled in the SHOCK registry. H1: (Public) Reporting system may have a negative influence on the management of these patients. New York Compariso n Groups (s) Post test Only American patients in the SHOCK registry with AMI complicated by cardiogenic shock primarily due to left ventricular pump failure (n= 545) Public Report: Patients treated at 11 participating New York centers (n=220) No Public Report: Patients treated at 12 non-New York centers (n=325) rates of cardiac catheterizati on, revasculariza tion (PCI and/or CABG), and in- hospital mortality NY CSRS New York hospitals required to report; other hospitals not required/no public reporting for them. Risk-adjusted mortality rates above the confidence interval for the statewide mean in NY results in audits by the NYSDOH and can include penalties and probation. H-1
Transcript
Appendix H. Hospitals: Quantitative Evidence Section ATable H1. Hospital quantitative studies: columns 1-8 of 18 (pages H-1 to H-18)
Author, Year (QA)
1. Study Purpose and/or a priori Hypothesis:
2. Geographic Location
3. Study design
4. Sample/ Population
5. Primary Comparison 6. Outcomes
7. Public Report Name and Description*
8. Context: Environment Characteristics
Apolito 20083
(Good)To investigate the management and outcomes of patients with AMI complicated by cardiogenic shock in New York and other states enrolled in the SHOCK registry.
H1: (Public) Reporting system may have a negative influence on the management of these patients.
New York Comparison Groups (s) Post test Only
American patients in the SHOCK registry with AMI complicated by cardiogenic shock primarily due to left ventricular pump failure (n= 545)
Public Report: Patients treated at 11 participating New York centers (n=220)
No Public Report: Patients treated at 12 non-New York centers (n=325)
rates of cardiac catheterization, revascularization (PCI and/or CABG), and in-hospital mortality
NY CSRS New York hospitals required to report; other hospitals not required/no public reporting for them.
Risk-adjusted mortality rates above the confidence interval for the statewide mean in NY results in audits by the NYSDOH and can include penalties and probation.
H-1
Table H1. Hospital quantitative studies: columns 1-8 of 18 (pages H-1 to H-18) (continued)
Author, Year (QA)
1. Study Purpose and/or a priori Hypothesis:
2. Geographic Location
3. Study design
4. Sample/ Population
5. Primary Comparison 6. Outcomes
7. Public Report Name and Description*
8. Context: Environment Characteristics
Baker 20025
(Fair)To examine temporal trends in risk-adjusted mortality between 1991 and 1997 for Medicare patients hospitalized in Northeast Ohio for six medical conditions: acute MI, CHR, gastrointestinal hemorrhage, COPD, pneumonia, and stroke.
Northeast Ohio/Cleveland metropolitan area
Interrupted Time Series (this article doesn’t say, another does. CHQC public reporting started 1993)
Hospitals in Northeast Ohio
30 nonfederal hospitals in Cleveland, OH were compared on 3 measures of mortality rates (In hospital death, 30 day death, and Early post discharge death) of Medicare patients across multiple years.
Mortality: In-hospital death: Death during the index admission
30-day death: Death within 30 days of admission (including in-hospital and post discharge deaths)
Early post discharge death: Discharged alive after the index hospitalization but dying within 30-days of admission.
Cleveland Health Quality Choice (CHQC)
None
Baker 20034
(Fair)(1) To examine whether hospitals that were identified as mortality outliers were more likely to lose or gain market share compared with hospitals with average mortality.(2) To examine whether hospitals with higher than expected mortality had greater declines in 30-day mortality over time compared with hospitals with average mortality rates.
Cleveland, OH Interrupted Time Series
Nonfederal Hospitals, N=30(Outliers, n=17) participating in the Cleveland health Quality Choice public reporting program.
12 six-month CHQC study periods between July 1991 and December 1997 (no data for January-June 1992). Comparison: Change in market share during outlier time period vs. non-outlier time period.
Market Share: The number of discharges for 6 general medical conditions at a hospital divided by the total number of general medical admissions at all hospitals participating in CHQC.
Cleveland Health Quality Choice (CHQC)
30 hospitals, with 12 six-month periods of mortality data.
H-2
Table H1. Hospital quantitative studies: columns 1-8 of 18 (pages H-1 to H-18) (continued)
Author, Year (QA)
1. Study Purpose and/or a priori Hypothesis:
2. Geographic Location
3. Study design
4. Sample/ Population
5. Primary Comparison 6. Outcomes
7. Public Report Name and Description*
8. Context: Environment Characteristics
Bridgewater 20076
(Good)
To study changes in coronary artery surgery in years spanning publication of cardiac surgery mortality data in the UK.
Northwest England
Interrupted Time Series
Data collected on 25,730 consecutive patients undergoing adult cardiac surgery (isolated coronary artery surgery) between April 1, 1997 and March 31, 2005 in the northwest of England.
Pre-public reporting period: April 1997 to March 2001; Post-public reporting period: April 2001-March 2005
Observed Mortality: Any in-hospital deathPredicted Mortality: Risk adjusted mortality based on EuroSCORE.
Changes in the number of very high risk patients undergoing coronary artery surgery: Stratified risk spectrum of patients undergoing surgery: low risk <6 EuroSCORE, high risk >=6 EuroSCORE, and very high risk >=11 EuroSCORE
Multiple Reports on named Surgeon and Hospital outcomes in UK
Policy requiring public reporting of hospital specific morality data
Carey 20067
(Fair)To study the impact of public reporting and changes in the incidence of PCI and CABG procedures in California.
California One Group Pretest Posttest
Hospitals in California performing CABG and PCI operations
Pre public report: 1998-2002 Post public report: 2003-2004Hospitals in both groups: N = 115
Hospitals performing CABG and PCI: N~120 (6 stopped performing during study period and 7 started performing sometime during study period)
Mortality: In-hospital death and 30 day mortality or readmission for repeat procedure
Volume: Number of given procedures (CABG vs PCI)
California Coronary Artery Bypass Graft Mortality Reporting Program
Public reporting prior to 2002 voluntary, after mandatory in CA
H-3
Table H1. Hospital quantitative studies: columns 1-8 of 18 (pages H-1 to H-18) (continued)
Author, Year (QA)
1. Study Purpose and/or a priori Hypothesis:
2. Geographic Location
3. Study design
4. Sample/ Population
5. Primary Comparison 6. Outcomes
7. Public Report Name and Description*
8. Context: Environment Characteristics
Caron 19999
(Poor)To identify whether hospitals in the Cleveland, Ohio area have responded to public concern about improving their cesarean section and VBAC rates.
Greater Cleveland, OH
One Group, Post Only
Hospitals after publication of CHQC, with 3 in depth case reports, n=18.Also survey of quality management directors or personnel deemed appropriate by the director, obstetricians, or labor and delivery nurses.
Cesarean rates after CHQC report
Cesarean section rates, VBAC rates
Cleveland Health Quality Choice (CHQC)
None
Caron 20048
(Fair)To assess whether improvement in one clinical area was associated with improvements in other areas.
Greater Cleveland, OH
Time Series post only
Hospitals in the Greater Cleveland area. n=27 hospitals for non-obstetrics outcomes. n=20 for obstetrics outcomes.
Comparison across 4 or 5 time points on CHQC outcomes: Acute MI: Length of stay, Mortality; CHF: Length of stay, Mortality; Stroke: Length of stay, Mortality; Obstetrics: Total caesarean delivery rate, primary caesarean delivery rate, vaginal birth after caesarean delivery rate
Acute MI: Length of stay, Mortality; CHF: Length of stay, Mortality; Stroke: Length of stay, Mortality; Obstetrics: Total caesarean delivery rate, primary caesarean delivery rate, vaginal birth after caesarean delivery rate.
CHQC None
Clough 2002(Fair)10
To determine whether the CHQC had a beneficial effect on inpatient mortality in Cleveland.
Cleveland, OH vs. rest of Ohio
Comparison Group (s) Interrupted Time Series
Hospital mortality rates in Cleveland and Hospital mortality rates in the rest of Ohio
30 hospitals in Cleveland area participated in CHQC vs. hospitals in the rest of Ohio that did not participate in public reporting.Mortality data from 1992 to 1995.
Inpatient mortality CHQC None
H-4
Table H1. Hospital quantitative studies: columns 1-8 of 18 (pages H-1 to H-18) (continued)
Author, Year (QA)
1. Study Purpose and/or a priori Hypothesis:
2. Geographic Location
3. Study design
4. Sample/ Population
5. Primary Comparison 6. Outcomes
7. Public Report Name and Description*
8. Context: Environment Characteristics
Cutler 200411
(Fair)To examine the impact of report cards on the allocation of patients across hospitals.
New York Time Series post only
Cardiac surgery hospitals on New York states report card
Mortality level of hospitals in high-mortality and low-mortality hospitals.
To develop a framework and test three potential effects of report cards on the treatment of cardiac illness.
New York and Pennsylvania
Interrupted Time Series
Cohorts of Acute Myocardial Infarction (AMI) patients and patients receiving CABG in New York and Pennsylvania from 1987-1994
Assuming NY introduced report cards in 1991 and PA in 1993:NY: 4 years Pre and 3 years PostPA: 6 years Pre and 1 year Post
Also Compare NY to other states that do not have public reporting.
Hospital Level Analysis: 1. Mean of the illness severity before admission or treatment of hospital. This outcome is estimated by:A. Mean of Patient’s total hospital expenditures one year prior to admissionB. Mean of patients’ total days in hospital one year prior to admissionPatient Level Analysis:1. Illness severity in the year prior to treatment2. Overall intensity of treatment in the year after admission3. Whether patients received CABG, PTCA or Cath in the year after admission with AMI
NY CSRS and PA CABG Guide
None
H-5
Table H1. Hospital quantitative studies: columns 1-8 of 18 (pages H-1 to H-18) (continued)
Author, Year (QA)
1. Study Purpose and/or a priori Hypothesis:
2. Geographic Location
3. Study design
4. Sample/ Population
5. Primary Comparison 6. Outcomes
7. Public Report Name and Description*
8. Context: Environment Characteristics
4. All-case mortality and cardiac complications such as readmission for heart failure in the year after admission
Dranove 200812
(Good)
To propose and implement a methodology to assess the effectiveness of the “news” that report cards provide to the market.
New York Interrupted Time Series
Hospitals (n=18) in the NYC metropolitan area and CABG patients from the counties in the same area (1989, n=6978; 1990, n=7916; 1991, n=8960).
Hospital demand pre and post report card implementation;Pre: 1989, Post: 1991
Hospital Demand NY CSRS None
Elliott 201014
(Good)To assess how patients’ experiences with inpatient care are changing since public reporting
Across USA One Group Pretest Posttest
Hospitals reporting on the Hospital Compare website between 2006 and 2008 with reporting in 2008 and 2009
1) Reporting at 2008 vs. reporting at 20092) Newly participating hospitals vs. original participating hospitals3) Hospitals with <100 beds vs. hospitals with >100 beds
HCAHPS survey completed by patients
HCAHPS Annual reporting, 2008 and 2009All hospitals participating
H-6
Table H1. Hospital quantitative studies: columns 1-8 of 18 (pages H-1 to H-18) (continued)
Author, Year (QA)
1. Study Purpose and/or a priori Hypothesis:
2. Geographic Location
3. Study design
4. Sample/ Population
5. Primary Comparison 6. Outcomes
7. Public Report Name and Description*
8. Context: Environment Characteristics
Evans 199715
(Fair)To document responses of Pennsylvania hospitals to the public dissemination by the Pennsylvania Health Care Cost Containment Council (PHC4) of mandated hospital disclosures of financial and nonfinancial information.
Pennsylvania One Group Posttest Only
All Pennsylvania acute care hospitals
One year to another: 1990 vs. 1992
Change in hospital efficiency measures (length of stay and charges)Changes in outcome measures
PHC4: HER None
Foreman 199516
(Poor)
To examine whether Pennsylvania’s Health Care Cost Containment Council (PHC4) public reports led to market changes. Specifically, to determine whether hospitals that received high or low quality ratings experienced growth or decline in patient admissions
Pennsylvania One Group Posttest Only
Hospitals in Pennsylvania n=156 (27 of 183 excluded due to missing data)
Pre: fully released data (for 1989 or 1990, released in 1991 or 1992) Post: Publicly released data (for 1990, released in 1992)
Note: not all data in the post group were public.
Change in Yearly Number of Hospital Patients by high or low quality (Quality determined by mortality rates)
Hospital Effectiveness Report (HER)
Consumer Guide to Coronary Artery Bypass Graft Surgery (CABG Guide)
Only one year of publicly reported data for some of the hospitals. Other hospitals did not have any publicly reported data, but privately/internally reported data were available to physicians for referrals.
H-7
Table H1. Hospital quantitative studies: columns 1-8 of 18 (pages H-1 to H-18) (continued)
Author, Year (QA)
1. Study Purpose and/or a priori Hypothesis:
2. Geographic Location
3. Study design
4. Sample/ Population
5. Primary Comparison 6. Outcomes
7. Public Report Name and Description*
8. Context: Environment Characteristics
Friedberg 200917
(Good)
To determine whether public reporting has been associated with overdiagnosis of pneumonia, excessive antibiotic use, or inappropriate prioritization of patients with respiratory symptoms.
USA Interrupted Time Series
Patients at least 18 years old visiting EDs between 2001-2005 with primary respiratory symptoms (excluding conditions limited to upper respiratory tract) at hospitals with Antibiotic Timing Scores for at least 25 observations
Pre-Public Report: Before January 1, 2004Post-Public Report: After January 1, 2004
ED diagnosis: Pneumonia, Bronchitis, Congestive heart failure (CHF), OtherAntibiotic use: first dose of antibiotics within 4 hours of hospital arrival; inappropriate use of antibiotics classified as antibiotic use in visits for asthma and CHF when pneumonia not presentWaiting time to see a physician: not described
One of 10 Hospital-level performance measures reported by the Hospital Quality Alliance
Began public reporting in 2004; HQA receives performance data from more than 98% of US acute care hospitals
H-8
Table H1. Hospital quantitative studies: columns 1-8 of 18 (pages H-1 to H-18) (continued)
Author, Year (QA)
1. Study Purpose and/or a priori Hypothesis:
2. Geographic Location
3. Study design
4. Sample/ Population
5. Primary Comparison 6. Outcomes
7. Public Report Name and Description*
8. Context: Environment Characteristics
Ghali, 199718
(Fair)To compare trends in mortality after CABG surgery in Massachusetts with the decreases in New York and northern New England
Massachusetts Comparison Group (s) Time Series Post Only
All CABG cases from fiscal years 1990, 1992, and 1994 in Massachusetts at all 12 hospitals performing CABG surgeries: Case Selection from New York and northern New England included cases having undergone isolated CABG procedure. 1990 N=5395; 1992 N=5,818; 1994 N=5,915 from 12 hospitals
No Report: Massachusetts CABG patientsPublic report and outcomes feedback: New York and Northern New England CABG patients
Observed and risk-adjusted in-hospital mortality
Changes in Patient Care linked to Performance Information
NY CSRS and Northern New England
None
Guru 200619
(Fair)To evaluate the differences in patient characteristics and outcomes observed during the transition from no reporting to confidential, and ultimately public perform report cards for CABG surgery in Ontario
Ontario, Canada
Interrupted Time Series
All patients undergoing isolated CABG surgery at 9 cardiac surgery institutions in Ontario between Sept. 1, 1991 and March 31, 2002 (n = 67,693
No Report: 1991 to 1994 (n = 12691)Confidential Report: 1995-1998 (n = 32,272)Public Report: 1999-2001 (n = 22,730)
thirty-day adjusted mortality
Ontario Cardiac Reports
All CABG surgeons agreed to publicly report outcomes (i.e., not mandated, voluntary). Confidential reporting instituted prior to public reporting
H-9
Table H1. Hospital quantitative studies: columns 1-8 of 18 (pages H-1 to H-18) (continued)
Author, Year (QA)
1. Study Purpose and/or a priori Hypothesis:
2. Geographic Location
3. Study design
4. Sample/ Population
5. Primary Comparison 6. Outcomes
7. Public Report Name and Description*
8. Context: Environment Characteristics
Hannan 199421
(Good)
1) To examine changes in the risk-adjusted CABG outcomes among providers that occurred during 1989-1992 as a function of the risk-adjusted mortality in 1989.
2) To examine changes in the volume of patients undergoing CABG as a function of the performance of providers in 1989.
New York Interrupted Time Series
30 providers (hospitals and surgeons) performing CABG surgeries in New York state
Baseline: Three different groups of ten created using RAMR prior to public release. Then look at performance before and after public report.
Intra-group changes in RAMR: RAMR for each tercile (Group 1= lowest RAMR, Group 2 = middle RAMR, Group 3 = Highest RAMR) in initial period (1989 for hospitals; 1989 to 1990 for surgeons) compared to RAMR for same tercile in 1992.
For surgeons: Same breakdown of terciles, but groups 1 and 2 have an N of 32 each, while group 3 has an N of 31
Outlier status (high outliers, non-outliers, and low outliers, with low outliers having significantly lower than expected mortality rates)
Volume of procedures: tracked using same tercile and outlier groupings.
NY CSRS Public Reporting of CABG for Hospitals and Surgeons required in NY
H-10
Table H1. Hospital quantitative studies: columns 1-8 of 18 (pages H-1 to H-18) (continued)
Author, Year (QA)
1. Study Purpose and/or a priori Hypothesis:
2. Geographic Location
3. Study design
4. Sample/ Population
5. Primary Comparison 6. Outcomes
7. Public Report Name and Description*
8. Context: Environment Characteristics
Hannan 1994b22
(Good)
To assess changes in outcomes of CABG surgery in NY related to CABG report card from 1989 through 1992.
New York Interrupted Time Series
30 New York Hospitals. 57,187 patients undergoing CABG surgery in New York between 1989 and 1992
Change over time after the release of report cards. Baseline: 1989
Risk-adjusted mortality rate, Expected mortality rate, CABG surgery volume, Relationship between hospital RAMR and average severity of illness of patients
NY CSRS Public reporting mandatory
Hannan 200320
Good)
To compare CABG mortality rates and changes in CABG mortality rates in regions with quality improvement/public dissemination efforts with the rest of the country
USA Multiple Group Time Series
Outcomes of Medicare patients undergoing CABG procedures between 1994 and 1999 who were 65 or older (n=911,407)
Hospitals participating in public reporting efforts in NY, PA, NJ, and OH and internal quality improvement efforts in New England compared to the rest of the United States between 1994 and 1999
In-hospital, 30-day, and risk adjusted in-hospital/30-day mortality, changes in out-of-region CABG surgery
NYS CSRS; PA HC4; NJ Department of Health and Senior Services Registry; CHQC; Northern New England Cardiovascular Study Group (not public)
Hibbard 200324
(Fair)
To evaluate the impact on quality improvement of reporting hospital performance publically versus privately back to the hospital.
Wisconsin Comparison Groups (s) Pretest Posttest (2 of 3 groups Randomly Assigned)
Wisconsin hospitals-24 hospitals utilizing public reporting-98 hospitals randomized to either private reporting or no reporting
Public reporting hospitals (n=24)Private reporting hospitals (n=41)No reporting hospitals (n=46)
Increase in QI activities in obstetrics and cardiac care (0-7 possible QI activities)Public image perception (0-5 scale)
QualityCounts None
H-11
Table H1. Hospital quantitative studies: columns 1-8 of 18 (pages H-1 to H-18) (continued)
Author, Year (QA)
1. Study Purpose and/or a priori Hypothesis:
2. Geographic Location
3. Study design
4. Sample/ Population
5. Primary Comparison 6. Outcomes
7. Public Report Name and Description*
8. Context: Environment Characteristics
Hibbard 200523 (Fair)
To assess hospital’s’ performance in the 2 years following the release of the report
Wisconsin Comparison Groups (s) Pretest Posttest (2 of 3 groups Randomly Assigned)
24 hospitals in south central Wisconsin. And survey on long term impacts among community members (n = 803).
Hospitals in report vs. hospitals given a report of just their performance vs. hospitals that received no report
Improvements in performance overall and in clinical areas
QualityCounts None
Hollenbeak 200825
(Good)
To identify associations between intensive public reporting and in-hospital mortality.
Pennsylvania Comparison Groups (s) Pretest Posttest
Patients treated for 6 acute conditions: AMI, congestive heart failure, hemorrhagic stroke, ischemic stroke, pneumonia, and sepsis.
Group 1, Time 1: Pennsylvania patients during period of ‘limited’ public reporting, from 1997-1999 (n=515,266; 206 hospitals)Group 1, Time 2: Pennsylvania patients during period of ‘intensive’ public reporting, from 2000-2003 (n=689,006; 200 hospitals)
Comparison (Propensity matched to Pennsylvania): Group 2, Time 1: Patients in different states with limited public reporting, from 1997-1999 (propensity matched to Pennsylvania) (n=103,864; 53 hospitals)Group 2, Time 2: Patients in different states with limited public reporting, from 2000-2003
In-hospital mortality
PA Hospital Effectiveness/ Performance Report
None
H-12
Table H1. Hospital quantitative studies: columns 1-8 of 18 (pages H-1 to H-18) (continued)
Author, Year (QA)
1. Study Purpose and/or a priori Hypothesis:
2. Geographic Location
3. Study design
4. Sample/ Population
5. Primary Comparison 6. Outcomes
7. Public Report Name and Description*
8. Context: Environment Characteristics
(n=59,239; 34 hospitals)Group 3: Limited reporting in CO and TX, from 1997-1999 (only 3 outcomes measures: AMI, CHF, pneumonia; n=21,952; 8 hospitals)Group 4: Intensive reporting in CO, TX, and CA from 200-2003 (only 3 outcomes measures: AMI, CHF, Pneumonia; n=9,456; 7 Hospitals)
4 Major comparisons:
1) Intensive Pennsylvania vs limited non-Pennsylvania2) Limited Pennsylvania vs limited non-Pennsylvania (see note)3) Limited PA vs Limited CO and TX (3 Outcomes)4) Intensive PA vs Intensive CA, CO, TX (3 Outcomes)
N=168,104 Matched patient pairs
H-13
Table H1. Hospital quantitative studies: columns 1-8 of 18 (pages H-1 to H-18) (continued)
Author, Year (QA)
1. Study Purpose and/or a priori Hypothesis:
2. Geographic Location
3. Study design
4. Sample/ Population
5. Primary Comparison 6. Outcomes
7. Public Report Name and Description*
8. Context: Environment Characteristics
Howard 200626
(Fair)
To determine whether report cards influence the number of kidney transplant waiting list registrations and donor transplants at transplant hospitals.
USA Time Series post only
Transplant Centers in the US
Post only data comparing patient transplant registrations and hospital performance across timeIntervention: Internet reporting of the Scientific Registry of Transplant Recipients
Number of patients choosing transplant center during each report card period.
University Renal Research and Education Association semiannual reports on kidney transplant graph survival
Released every 6 months online.
Jang 201027
(Fair)To assess the impact of reporting performance information on the readmission rate, length of stay and cost of hip hemiarthroplasty.
Korea Pre-Post Hip hemiarthroplasty cases in Korea from January 2006-April 2008 (n=22851 surgeries at 851 medical institutions)
Public report vs no reportPre: January 2006-December 2007Post: December 2007-April 2008
Readmission ratesLength of StayChange in CostPatient selection
Not named, Presented on National Heath Insurance Corporation website and in press
None
Jang 201128
(Fair)To evaluate the effect of Repeated Public Releases (RPR) for reducing adjusted cesarean section rates and to analyze the characteristics of institutions responsive to RPR.
Korea One Group, Pre-Post
Korean hospitals that provide cesarean sections (N=1194)
Cesarean rate; Pre-report: August 2004- July 2005, Post-report: August 2005- June 2007
Cesarean rates Cesarean section rates released by the Health Insurance Review and Assessment Service
None
Jha 200629
(Good)To determine if high or low performance by surgeons or hospitals predicts performance in the period when data are most likely to be used by consumers.
New York Time Series post only
hospitals and cardiac surgeons in New York
Intervention: Public Release of Cardiac Performance for hospitals (yearly) and surgeons (released yearly for three year periods)Baseline: How well hospitals performed on report cards
Performance: each hospital’s or surgeon’s RAMR.
Market Share: number of cases of isolated CABG surgeries performed by a given surgeon or
NY CSRS Required publication of performance data for cardiac surgeries in NY
H-14
Table H1. Hospital quantitative studies: columns 1-8 of 18 (pages H-1 to H-18) (continued)
Author, Year (QA)
1. Study Purpose and/or a priori Hypothesis:
2. Geographic Location
3. Study design
4. Sample/ Population
5. Primary Comparison 6. Outcomes
7. Public Report Name and Description*
8. Context: Environment Characteristics
To determine whether hospital or surgeon performance affects patient market share.
To assess whether surgeon performance is associated with likelihood of ceasing practice.
released in 1995 (performance data for 1993); How well surgeons performed on the 1999 report card (performance Data for 1997) Post: How well hospitals performed in 1996 (a year after release); How well surgeons performed in 2000 (a year after release)
(For Market Share)Pre: Hospital or surgeon market share prior to the release of report cardPost: Hospital or surgeon market share one year after release of report card
(For Surgeons Quitting)Pre: Performing surgeries prior to releasePost: Discontinuing surgeries over the course of two years from release of public data
hospital in a given time period, divided by the total number of isolated CABG surgeries performed by all surgeons/hospitals in NY during that period.
Discontinuation of surgeries: Any surgeon who did not perform a single surgery in a given calendar year assumed to have left the system.
H-15
Table H1. Hospital quantitative studies: columns 1-8 of 18 (pages H-1 to H-18) (continued)
Author, Year (QA)
1. Study Purpose and/or a priori Hypothesis:
2. Geographic Location
3. Study design
4. Sample/ Population
5. Primary Comparison 6. Outcomes
7. Public Report Name and Description*
8. Context: Environment Characteristics
Longo 199730
(Fair)To examine the impact of an obstetrics consumer report developed and issued by the Missouri Department of Health on hospital behavior.
Missouri One Group Pretest Posttest
Hospitals in Missouri, N=82. Response rate=93% (82/88).
Change after release of public report among 82 Hospitals listed in the Show Me Buyer’s Guide: Obstetrical Services published in 1993. Data collected 1994.
Number of facilities that previously did not have service, but instituted service after guide published.
Number of facilities with policies changed, planned to change, or with change under discussion.
Obstetrical outcome trends.
ShowMe Buyers Guide: Obstetrical Services
None
H-16
Table H1. Hospital quantitative studies: columns 1-8 of 18 (pages H-1 to H-18) (continued)
Author, Year (QA)
1. Study Purpose and/or a priori Hypothesis:
2. Geographic Location
3. Study design
4. Sample/ Population
5. Primary Comparison 6. Outcomes
7. Public Report Name and Description*
8. Context: Environment Characteristics
Mennemeyer 199731
(Fair)
To examine whether the HCFA data releases had an impact on community hospital discharges over the period 1984 to 1992.
USA Interrupted Time Series
All community hospitals with a standardized HCFA mortality rate of more than one standard deviation from the mean (outliers) in any year during the period 1984-2002. In addition, 50% sample of hospitals that were never outliers under this definition. Data from 1983 included for changes over time (baseline). Over 9 year period, n= 23,564.
Baseline/Pre-HCFA mortality release: 1983; Intervention: yearly release of HCFA mortality report.Change in hospital discharges attributed to HFCA release of information verses other sources such as: Media attention: Dummy variables relating to newspaper articles reporting either high or low mortality outlier at specific hospitals and whether presence of a favorable story, unfavorable story, government action, and unusual death.
Use of hospital: change in yearly discharges
HCFA mortality report
Media Coverage: whether or not the media (specifically newspapers) report rates and whether or not the media include stories that have positive or negative spins.
H-17
Table H1. Hospital quantitative studies: columns 1-8 of 18 (pages H-1 to H-18) (continued)
Author, Year (QA)
1. Study Purpose and/or a priori Hypothesis:
2. Geographic Location
3. Study design
4. Sample/ Population
5. Primary Comparison 6. Outcomes
7. Public Report Name and Description*
8. Context: Environment Characteristics
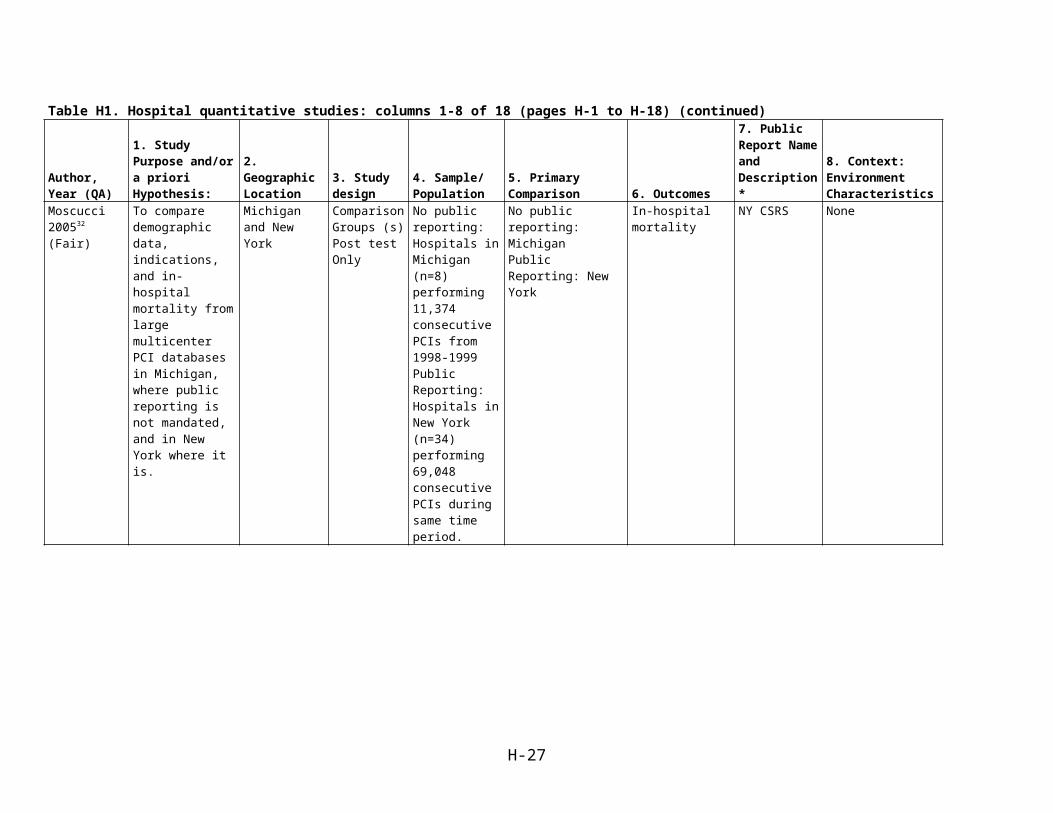
Moscucci 200532
(Fair)
To compare demographic data, indications, and in-hospital mortality from large multicenter PCI databases in Michigan, where public reporting is not mandated, and in New York where it is.
Michigan and New York
Comparison Groups (s) Post test Only
No public reporting: Hospitals in Michigan (n=8) performing 11,374 consecutive PCIs from 1998-1999Public Reporting: Hospitals in New York (n=34) performing 69,048 consecutive PCIs during same time period.
No public reporting: MichiganPublic Reporting: New York
In-hospital mortality
NY CSRS None
Mukamel, 199833 (Fair)
To test the hypotheses that hospitals and surgeons with better outcomes reported in the NYS Cardiac Surgery Reports experience a relative increase in their market share and prices.
New York One Group Posttest Only
Hospitals and surgeons in New York
Compare hospitals over different years (1990 vs. 1991 vs. 1992)
Market shares NY CSRS None
H-18
Table H1. Hospital quantitative studies: columns 1-8 of 18 (pages H-1 to H-18) (continued)
Author, Year (QA)
1. Study Purpose and/or a priori Hypothesis:
2. Geographic Location
3. Study design
4. Sample/ Population
5. Primary Comparison 6. Outcomes
7. Public Report Name and Description*
8. Context: Environment Characteristics
Omoigui 199634
(Poor)
It has been suggested that this program played a significant role in the 41% decrease in the risk-adjusted mortality rate between 1989 and 1992. We hypothesized that some high-risk patients had migrated out of state for surgery.The purpose of this study was to determine whether cross-border risk-shifting resulted in changes in referral source case-mix and outcome from 1989 through 1993 at the Cleveland Clinic, a major regional, national, and international referral center located in the city of Cleveland, Ohio, 110 miles from the western border of New York state.
New York and Cleveland, OH
Multiple Group Time Series
n=9442 isolated CABG operations undertaken at the Cleveland clinic between Jan 1, 1989 to December 31, 1993.
Time trends of mortality, morbidity and referral case-mix at the Cleveland clinic.Post Only - 1989 to 1993
Mortality NY CSRS None
H-19
Table H1. Hospital quantitative studies: columns 1-8 of 18 (pages H-1 to H-18) (continued)
Author, Year (QA)
1. Study Purpose and/or a priori Hypothesis:
2. Geographic Location
3. Study design
4. Sample/ Population
5. Primary Comparison 6. Outcomes
7. Public Report Name and Description*
8. Context: Environment Characteristics
Peterson 199835
(Good)
To examine the effects of provider profiling on bypass surgery access and outcomes in elderly patients in New York
New York Interrupted Time Series
All Medicare patients age >=65 yrs who underwent bypass surgery between 1987 and 1992 in a US hospital.n=39,396 in NY Hospitalsn=662,675 in non-NY (US)
1. Percentage of patients going out-of-state for bypass surgery2. Use of bypass surgery following a MI had declined in NY’s elderly since the initiation of report cards3. Whether bypass surgery outcomes were improving more rapidly in NY that in the rest of the nation.
NY CSRS None
Pope200936
(Fair)
Estimate the effect of the US News and WorldReport hospital rankings on both patient volume and hospital revenues.
CA and rest of USA
Time Series Post Test Only
All hospitalized Medicare patients in California (1998–2004) and a sample of other hospitals around thecountry (1994–2002)N=446
Comparing the USNWR ranking by specialty starting in 1993 to 1994-2002 in rest of the country and 1998 to 2004 in California.
Number of patients (volume) and revenue generated from patients.
USNWR has Specialty and Hospital-level data
None
Romano 200437
(Good)
To determine whether hospitals recognized as performance outliers (either lower or higher than expected) experience volume changes after publication of a report card.
H1: Hospitals with
New York and California
Times Series Post Only
Outlier hospitals in New York and California NY using CSRS report from December 1992, December 1993, and June 1995CA using CHOP report from December 1993 and from
Pre: monthly volume prior to report for each specific hospital Post: monthly volume for each specific hospital up to a year later
Volume: total number of patients with a topic condition or procedure, or related condition or procedure, who were admitted to a specific hospital in a specific calendar month.
CA Hospitals
CHOP (CA) and CSRS (NY)
Both states require public reporting
H-20
Table H1. Hospital quantitative studies: columns 1-8 of 18 (pages H-1 to H-18) (continued)
Author, Year (QA)
1. Study Purpose and/or a priori Hypothesis:
2. Geographic Location
3. Study design
4. Sample/ Population
5. Primary Comparison 6. Outcomes
7. Public Report Name and Description*
8. Context: Environment Characteristics
lower-than-expected mortality or complication rates experience significant volume increases, and hospitals with higher-than-expected mortality or complication rates experience significant volume decreases in the year after publication of a report card.
H2: Hospitals with lower-than-expected mortality or complication rates attract more patients from long distances, or from outside their usual catchment areas, after a report is published. Labeled as “bypass effect,” and vice versa for higher-than-expected hospitals.
May 1996 volume by:AMI, AMI-related procedures (CABG, Percutaneous coronary angioplasty, congestive heart failure), Cervical Diskectomy,Lumbar Diskectomy,Diskectomy-related (Back or neck procedures, Medical back problems, Knee arthroplasty, Hip arthroplasty)
Table H1. Hospital quantitative studies: columns 1-8 of 18 (pages H-1 to H-18) (continued)
Author, Year (QA)
1. Study Purpose and/or a priori Hypothesis:
2. Geographic Location
3. Study design
4. Sample/ Population
5. Primary Comparison 6. Outcomes
7. Public Report Name and Description*
8. Context: Environment Characteristics
Romano 200437
(Good)Cont.
H3: Hospitals with lower-than-expected mortality or complication rates lead to an increased volume of clinically related conditions or procedures, and vice versa for higher-than-expected hospitals.
H4: Certain sociodemographic groups are more likely to hear about the release of a hospital report card and are better able tor more likely to use this information to select a hospital than other groups.
Romano, 201138
(Fair)
To evaluate the impact of 3 reports from the voluntary CA CABG Mortality Reporting Program on hospital market share, hospital mortality, and patient selection for coronary artery bypass graft surgery.
After Public Reporting: H1: Low mortality
California Multiple Group Time Series.
Hospitals in California that perform isolated CABG surgeries:2001: N=79 hospitals2003: N=702005: N=77
Pre and post public data reporting for three data release time points, July 2001, August 2003, and February 2005
Change in Hospital Market Share: The difference in each hospital’s market share between the 6 month periods immediately after and before release of a report. Market share is determined by dividing its number of CABG surgery
California CABG Mortality Reporting Program reports risk adjusted operative mortality for surgeons and hospitals performing isolated CABG surgery.
None
H-22
Table H1. Hospital quantitative studies: columns 1-8 of 18 (pages H-1 to H-18) (continued)
Author, Year (QA)
1. Study Purpose and/or a priori Hypothesis:
2. Geographic Location
3. Study design
4. Sample/ Population
5. Primary Comparison 6. Outcomes
7. Public Report Name and Description*
8. Context: Environment Characteristics
outliers would experience increased CABG market share.
H2: High mortality outliers would experience decreased risk adjusted inpatient CABG mortality (due to enhanced quality improvement efforts.
H3: The CCMRP program would stimulate an overall decrease in risk adjusted inpatient CABG mortality for participants, without a parallel change in mean hospital severity of illness or high risk patient selection.
discharges by the total number of CABG discharges in nonfederal hospitals in California during the same period.
Change in Hospital Mortality: Difference in risk-adjusted hospital mortality between specified periods after and before the release of each public report.
Rosenthal 199739
(Good)
To determine changes in hospital mortality that may have occurred in association with the Cleveland Health Quality Choice (CHQC) Program
Cleveland, OH Interrupted Time Series
30 hospitals in Northern Ohio
Before reporting vs. after reporting
Changes in mortality rates
CHQC None
H-23
Table H1. Hospital quantitative studies: columns 1-8 of 18 (pages H-1 to H-18) (continued)
Author, Year (QA)
1. Study Purpose and/or a priori Hypothesis:
2. Geographic Location
3. Study design
4. Sample/ Population
5. Primary Comparison 6. Outcomes
7. Public Report Name and Description*
8. Context: Environment Characteristics
Shabino 200640
(Poor)
To report on CheckPoint progress and to propose new measures.
Wisconsin One Group Pretest Posttest
Hospitals in Wisconsin, December 2004, n=115; September 2006, n=117
Changes in AMI, CHF, and Pneumonia outcomes between:Early post-public reporting (December 2004) and 2 years after public reporting (September 2006)
Acute MI outcomes: % on aspirin at arrival, % on aspirin at discharge, % beta blocker at arrival, % beta blocker at discharge, % ACEI/ARB Left ventricular systolic dysfunction, smoking counseling.
CHF outcomes:% Left ventricular function assessment, % ACEI/ARB Left ventricular function assessment, % Smoking counseling,% Discharge instructions
Table H1. Hospital quantitative studies: columns 1-8 of 18 (pages H-1 to H-18) (continued)
Author, Year (QA)
1. Study Purpose and/or a priori Hypothesis:
2. Geographic Location
3. Study design
4. Sample/ Population
5. Primary Comparison 6. Outcomes
7. Public Report Name and Description*
8. Context: Environment Characteristics
Tu 2009 (Fair) 41
To evaluate whether the public release of data on cardiac quality indicators effectively stimulates hospitals to undertake quality improvement activities
Ontario, Canada
Randomized Delayed Intervention Trial (hospitals randomized to early public reporting, or reporting 21 months later)
Acute Care Hospitals in Ontario treating more than 15 patients with AMI per year.
Both groups receive feedback. One receives early feedback (January 2004) and then the data are publicly released and the media report the results; the other receives delayed feedback (September 2005) and then public release, but no media feedback.
Primary: Mean performance on each of 2 composite process-of-care indicators: a) percentage of opportunities for applying each of 12 AMI indicators that were fulfilledb) CHF quality indicator “defined in a similar manner” using 6 CHF process-of-care indicators.
Secondary: 1 year and 30 day Hospital mortality; individual indicators creating the primary composite indicators; hospital report card impact survey results.
AMI and CHF Process Measures for acute care hospital
None
H-25
Table H1. Hospital quantitative studies: columns 1-8 of 18 (pages H-1 to H-18) (continued)
Author, Year (QA)
1. Study Purpose and/or a priori Hypothesis:
2. Geographic Location
3. Study design
4. Sample/ Population
5. Primary Comparison 6. Outcomes
7. Public Report Name and Description*
8. Context: Environment Characteristics
Vladeck 198842
(Poor)
Hypothesize that occupancy in hospitals with higher-than-expected death rates would decline after public release; occupancy in hospitals with as-expected death rates would not change; and occupancy in hospitals with lower-than-expected mortality would rise.
New York One Group Pretest Posttest
Occupancy rates for all New York City general acute care hospitals; n=70
Group 1: NY Hospitals with higher-than-expected mortality rates (n=14); Group 2: NY Hospitals with as-expected mortality rates (n= 47); Group 3: NY Hospitals with lower-than-expected mortality rates (n=9)
Pre: five calendar quarters preceding March 12, 1986 release of HCFA dataPost: three calendar quarters following release
Occupancy rates HCFA mortality report
New York City metropolitan hospitals overrepresented among 269 outlier hospitals: 45 were from New York City or from surrounding counties; two-thirds had higher than expected mortality, one-third had lower-than-expected rates.
Wang 201143
(Good)Examines the impact of CABG report cards on a provider’s aggregate volume and volume by patient severity and then employ a mixed logit model to investigate the matching between patients and providers
Pennsylvania Times Series Post Only
PA residents (aged 30 and above) who were undergoing an isolated CABG procedure in PA hospitals and who were admitted between Q3 1998 and Q1 of 2006. N= 114,039)
Post Only: 1998 to 2006
Hospital Quarterly VolumeSurgeon Quarterly Volume
PA CABG Guide
None
H-26
Table H1. Hospital quantitative studies: columns 1-8 of 18 (pages H-1 to H-18) (continued)
Author, Year (QA)
1. Study Purpose and/or a priori Hypothesis:
2. Geographic Location
3. Study design
4. Sample/ Population
5. Primary Comparison 6. Outcomes
7. Public Report Name and Description*
8. Context: Environment Characteristics
Werner 201044
(Good)To examine changes in hospital process performance in the first three years after Hospital Compare was initiated and test whether these changes in performance were correlated with changes in hospital mortality rates, length of stay, and readmission rates
USA Times Series Post Only
3476 acute care non federal US hospitals that publicly reported quality information on the CMS Hospital Compare website from 2004-2006
Change in performance level between 2004 and 2006 of low vs. low-middle vs. middle-high vs. high performing hospitals
Performance on individual and composite performance measuresChange in hospital performance from 2004 to 2006
CMS Hospital Compare
None
H-27
Table H1. Hospital quantitative studies: columns 1-8 of 18 (pages H-1 to H-18) (continued)
Author, Year (QA)
1. Study Purpose and/or a priori Hypothesis:
2. Geographic Location
3. Study design
4. Sample/ Population
5. Primary Comparison 6. Outcomes
7. Public Report Name and Description*
8. Context: Environment Characteristics
Wuebker 200845
(Fair)
H1: The publication of quality information has reduced patient uncertainty. Therefore published hospitals extend their market share or case numbers when compared with competing- non- publishing- hospitals
H2: From the total of publishing hospitals, those hospitals with overaverage quality tend to be preferred to competing hospitals with a quality below average. In other words: “good hospitals: should be able to extend their market shares or case numbers in comparison to “poor hospitals”
Rhine-Ruhr area and Colgne-Bonn area, Germany
Multiple Groups, Time Series
157 German hospitals in two regions, Rhine-Ruhr (study group) and Cologne-Bonn (control group)
Case numbers, market share and quality before (2003-2005) and after public reporting (2005-2006)
Case Numbers: Hospital case numbersMarket share 35: Hospital market share for the market delineation of 35km; Market share 50: Hospital market share for the market delineation of 50km; Log_Distance: Average logarithmized distance of the treated patient to the hospital
Klinikfuhrer Rhein-Ruhr (Clinic Guide), 74 hospitals in the Rhine-Ruhr region voluntarily participated. Contains patient satisfaction, case numbers, process, and outcome indicators.


![Marissa Balme RN, BSN. Background Number of coronary artery bypass graft surgeries (CABG) performed in 2006: 448,000 (American Heart Association [AHA],](https://static.documents.pub/doc/80x56/56649e1a5503460f94b0781f/marissa-balme-rn-bsn-background-number-of-coronary-artery-bypass-graft-surgeries.jpg)


