1 Cone of Safety around a Crane Hook Michigan State University Senior Design-ECE 480 Dec 09, 2015 Project Sponsor: ArcelorMittal Sponsor Representative: James Lang Faculty Facilitator: Dr. Hayder Radha Team Members: Xue Cheng Samuel Falabi Charlie Nguyen Richard Szink Lanea Williamson
Transcript
1
Cone of Safety around a Crane Hook
Michigan State University Senior Design-ECE 480
Dec 09, 2015
Project Sponsor:ArcelorMittal
Sponsor Representative:James Lang
Faculty Facilitator:Dr. Hayder Radha
Team Members:Xue Cheng
Samuel FalabiCharlie NguyenRichard Szink
Lanea Williamson
2
Executive Summary
This report has been assigned by Michigan State University and sponsored by ArcelorMittal to provide an analysis and evaluation on the implementation of safety on remote control cranes at ArcelorMittal. Statistics of injuries in the steel industry has motivated ArcelorMittal to implement a design to improve safety in the Finishing Department.
Research shows that safety can be improved by alerting the crane operator when they are within the vicinity of the crane’s “danger zone.” To achieve this, Team 5 from ECE 480 in the fall of 2015 at MSU had to research and develop a solution to build a “cone of safety” to determine the danger zone around the crane’s load, detect the operator’s presence, and act upon the information by alerting the operator. The team was tasked to build a solution to meet certain criteria and implement a prototype.
This report will include an introduction to ArcelorMittal, background information on current industry standards safety system, procedures on how the design team approach to the final design, hardware and software of the final design, proof of a functional design, design issues, and overall conclusion.
3
Acknowledgments
James Lang: Special thanks to the team’s corporate sponsor ArcelorMittal and especially James Lang. James Lang provided great insight toward project goals and expectations. He also provided the team with necessary information and resources along with feedback and suggestions to the design which allowed the team to achieve the project’s objectives and to reach expectations.
We would also like to thank our facilitator, Dr. Hayder Radha, for his guidance, mentoring and feedback which kept Team 5 on track throughout the project and contributed greatly to our project’s success.
Furthermore, our appreciation goes to our ECE 480 professors, Dr. Timothy Grotjohn and Dr. Lalita Udpa, for their help and insight throughout the semester. We want to also thank the ECE shop specialists and Roxanne Peacock for providing us with all our parts in a timely manner.
Our gratitude also goes to senior Mechanical Engineering student Evan Boyers for helping with the 3D modelling of our project’s component housing.
4
Table of Contents
Chapter 1: Introducing and background 5 ● 1.1 Introduction 5
● 1.2 Background 5
● 1.3 Objective 6
● 1.4 Effect on Industry 7Chapter 2: Exploring a Solution and Selecting an Approach 8
2.1 Exploring the Solution 8
2.2 Selecting a Solution 9
2.3 Budget 13
2.4 Product Schedule 15
Chapter 3: Technical Work Performed 16● 3.1 Hardware 16● 3.2 Software 21
Chapter 4: Test Data and Proof of Design 39● 4.1 Testing of Ultrasonic Sensor 39● 4.2 Testing of Thermal Sensor 39
● 4.3 Testing of MicroSD Card 40● 4.4 Testing of Entire System 40
Chapter 5: Design Issues 44 5.1 Improvement in System Housing – Product Safety 44 5.2 Power Supply – Standards 44 5.3 Panasonic Thermal Sensor – Product Liability 45
Chapter 6: Summary, Final Costs and Future Improvements 46● 6.1 Summary 46● 6.2 Schedule and Final Costs 46● 6.3 Thank You 47
Appendix 1 48Appendix 2 55
5
Appendix 3 56
Chapter 1: Introduction and Background
1.1 Introduction
ArcelorMittal is the world’s leading steel and mining company with presence in 60 countries and an industrial footprint in 19 countries. They are guided by a philosophy to produce safe and sustainable steel. ArcelorMittal also prides themselves in providing a conducive and safe work environment for employees. To further accomplish their commitments for safety of their employees, ArcelorMittal is proud to be the sponsor of this Safety System Design project at Michigan State University. At ArcelorMittal, Electric Overhead Cranes (EOT) are used for transporting heavy products, parts, and materials. They are operated remotely by a Remote Control Crane Operator (RCCO). Crane operators and other employees that come in near proximity of the cranes are exposed to safety hazards that could lead to serious injuries or loss of life throughout the course of the work day. Due to this problem, safety measures have to be put in place to reduce such accident risks to the most minimum level. When a crane is in use, there is a minimum safe distance that must be observed to avoid pinch points and loads of steel as it moves. Areas of space too close to the cranes are considered danger zones, which increase whenever the crane moves vertically. The Safety System Design involves placing sensors above the load of the crane. The sensors are to be configured in such a way that when a body part comes into the danger zone, it automatically triggers an alarm that sounds over 80 dB to alert the crane operators of a potential accident so they can take safety measures to ensure no human part is within the danger zone. Also the Safety System must also include data recording of every instance an operator comes within the danger zone so ArcelorMittal can analyze the data and constantly improve safety in the workplace.
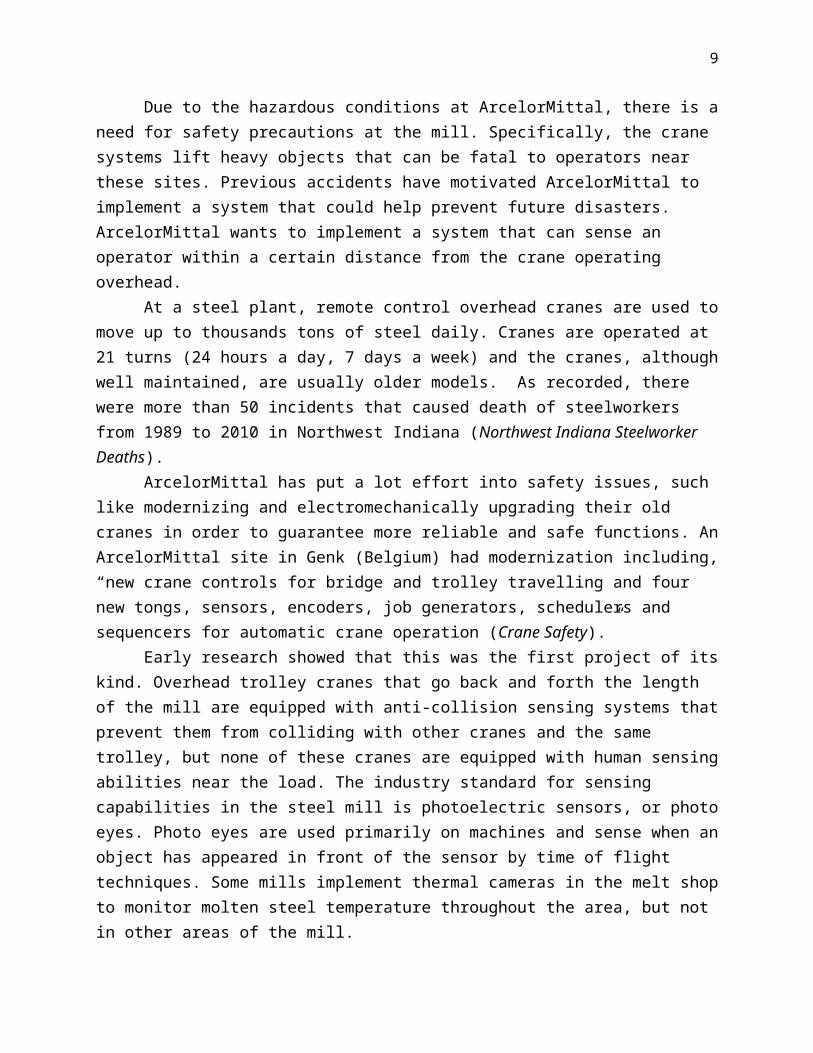
1.2 BackgroundDue to the hazardous conditions at ArcelorMittal, there is a need for safety precautions
at the mill. Specifically, the crane systems lift heavy objects that can be fatal to operators near these sites. Previous accidents have motivated ArcelorMittal to implement a system that could
6
help prevent future disasters. ArcelorMittal wants to implement a system that can sense an operator within a certain distance from the crane operating overhead.
At a steel plant, remote control overhead cranes are used to move up to thousands tons of steel daily. Cranes are operated at 21 turns (24 hours a day, 7 days a week) and the cranes, although well maintained, are usually older models. As recorded, there were more than 50 incidents that caused death of steelworkers from 1989 to 2010 in Northwest Indiana (Northwest Indiana Steelworker Deaths).
ArcelorMittal has put a lot effort into safety issues, such like modernizing and electromechanically upgrading their old cranes in order to guarantee more reliable and safe functions. An ArcelorMittal site in Genk (Belgium) had modernization including, “new crane controls for bridge and trolley travelling and four new tongs, sensors, encoders, job generators, schedulers and sequencers for automatic crane operation (Crane Safety).”
Early research showed that this was the first project of its kind. Overhead trolley cranes that go back and forth the length of the mill are equipped with anti-collision sensing systems that prevent them from colliding with other cranes and the same trolley, but none of these cranes are equipped with human sensing abilities near the load. The industry standard for sensing capabilities in the steel mill is photoelectric sensors, or photo eyes. Photo eyes are used primarily on machines and sense when an object has appeared in front of the sensor by time of flight techniques. Some mills implement thermal cameras in the melt shop to monitor molten steel temperature throughout the area, but not in other areas of the mill.
Electrical power to machines in a steel mill is provided by running cables through conduits either under the floor or high on the wall. Since the sensor will bolted to somewhere on the crane’s arm or hook, providing the sensor with power without interfering without the operation of the crane is crucial. Recording each occurrence of entering the “cone of safety” is another important design goal. The industry standard for interfacing with electronic devices are programmable logic controllers, or PLCs. A PLC is programmed using ladder logic and is fed by wires in a conduit to a large PLC cabinet.
The steel industry has a very rich history and has been the backbone of the modern world for over a century. Research gave insight into the industry standards that steel mills across the world utilize when completing projects. As the world becomes more technologically advanced, industry slowly becomes more advanced as well. Research, design, and prototyping gave the opportunity to pick the best design to guarantee the safest environment, even if that meant straying from the technology currently being used.
1.3 ObjectiveThe design team’s goal for this project was to provide a solution to improve
ArcelorMittal’s safety of operators around an operating crane hook. The designed system must fulfill the customer’s requirements. The remote control cranes used in ArcelorMittal move
7
heavy steel coil loads both vertically and horizontally. The design team, based on research, design, and testing, implemented a solution to improve safety around remote control cranes. There were several objectives to successfully completing this project. First of all, the designed system will detect any person within a dangerous range of a crane with a suspended load. The design will turn off when the load is suspended higher than 8 ft. in the air in order to reduce power consumption and unnecessary warnings. When the load is within the vertical 8 ft. range, the system will automatically turn on and create a “cone of safety” with varying radii depending on the loads height. Whenever an operator enters the cone of safety, or the danger zone, the system will be able to sense the operator and send a signal to trigger an embedded alarm in the system to warn that person. When the alarm is triggered, the system will record the data to show details of the near-miss accident. This will be useful for ArcelorMittal to improve their safety standards and avoid any future accidents.
1.4 Effect on Industry With the completion of the design, this project became one of the first of its kind in the
steel industry. As discussed in background section, there is no data showing that any similar project has been done in this industry to specifically detect and warn a person in danger operating zone. The designed system will significantly improve the safety of industry workers and as well as bring in new methods of improving safety in industry. The design will also help to reduce future accidents and generate a database to provide future improvements to potential safety issues.
8
Chapter 2: Exploring a Solution and Selecting an Approach
2.1 Exploring the Solution
Figure 1: FAST DiagramThe FAST diagram above in Figure 1 shows the different subsystems required during this
Cone of Safety around Crane Hook project. Different functions need to be involved in this project to achieve the project’s requirement. The main functions are to turn on the system and create a cone of safety with various size when the load of crane hook reaches required height, alert the operator when detected within danger zone, record data when alert is triggered, and withstand the industry environment also to have a long-lasting reliable system.
9
Figure 2: House of Quality
The figure 2 above shows the House of Quality Chart for this project. Since there’s no similar project has been done, it is hard to compare team’s design to any other competitor. According to the House of Quality, team was able to determine the critical customer requirements and the importance of each design criteria, therefore, in order to make process into right direction and successfully accomplish sponsor’s requirements.
2.2 Selecting a Solution
In order to design the best possible engineering solution for ArcelorMittal, a very high level design was agreed upon that satisfied the design specifications. To fulfill the specifications of turning on the “cone of safety”, detecting human presence, and recording the alarm data it was decided to use a combination of sensors, microcontrollers, and an alarm. ArcelorMittal has provided 250VDC power on the crane that will be stepped down to a VDC that will power these
10
aforementioned devices. The design team was challenged to research different sensors that would be best suitable for ArcelorMittal’s situation and then create a conceptual design that took advantage of that sensors technology. Initially the design team came up with five different design solutions to achieve customer’s requirement as shown below.
1. Industry Standard Design The Industry Standard Design consists of 6-8 proximity sensors arranged on the trolley of the crane above the load in an octagon or hexagon shape to simulate a cone. Also, one more proximity sensor would be in the middle of the octagon or hexagon to sense the height of the load. When this proximity sensor outputted that the load was 8 ft. above the floor, a signal is sent to the PLC telling the other 6-8 proximity sensors to turn on. The return sensor will be attached to the remote control worn around the operator’s neck. When the operator enters the danger zone, a signal is sent to the PLC to trigger the alarm. Alarm triggering data would be stored on a memory card in the PLC cabinet.
Figure 3 shows the front view of the design. A hexagon or octagon shape is created with 6-8 sensors and if the operator enters the danger zone an alarm is triggered.
Figure 3: Industry Standard Design
2. Image Processing Design Heat (a moving human). Thermal sensors create a matrix of temperatures so it would be possible to change the radius of the cone as the height changes. The sensor would use the same idea of using a proximity sensor to sense the load’s height and turning the thermal sensor on when it is 8 ft. above the ground. A box containing a thermal sensor, proximity sensor, an alarm, and a microcontroller to control the logic would be mounted on the crane trolley above the load.
Figure 4shows the effectiveness of sensing human presence by using thermal sensor technology.
Figure 4: Thermal Imaging Design
11
3. Motion Sensor Design Much like a motion sensor used to control outdoor lighting, a passive infrared (PIR) sensor would be used to detect human activity. The PIR sensor would work the same as the Thermal Imaging Design, only the thermal sensor is replaced with a PIR sensor. The PIR sensor makes a very good cone shape, but cannot change detection angle easily.
Figure 5 shows how a preset cone is made by a motion sensor that would in turn detect human movement using infrared sensors.
Figure 5: Motion Sensor Design
4. Image Processing Design This design is very similar to the Thermal Imaging Design, but instead the thermal sensor is replaced with a digital camera. Using an open source website, the camera can be programmed to act as a human detection sensor. This technology is not capable of sensing through an object. A microcontroller would turn the camera on and off and process the images using the open source code.
5. Ultrasonic Sensor Design Ultrasonic sensors are sometimes used in industry to detect moving objects. This design would consist of all the same features as the Industry Standard Design, but this sensor makes a cone shape naturally due to the sound field it uses to detect objects. Also, the ultrasonic sensor would be controlled by a microcontroller, not a PLC. Refer to Figure 5 to see how the ultrasonic sensors would be arranged.
12
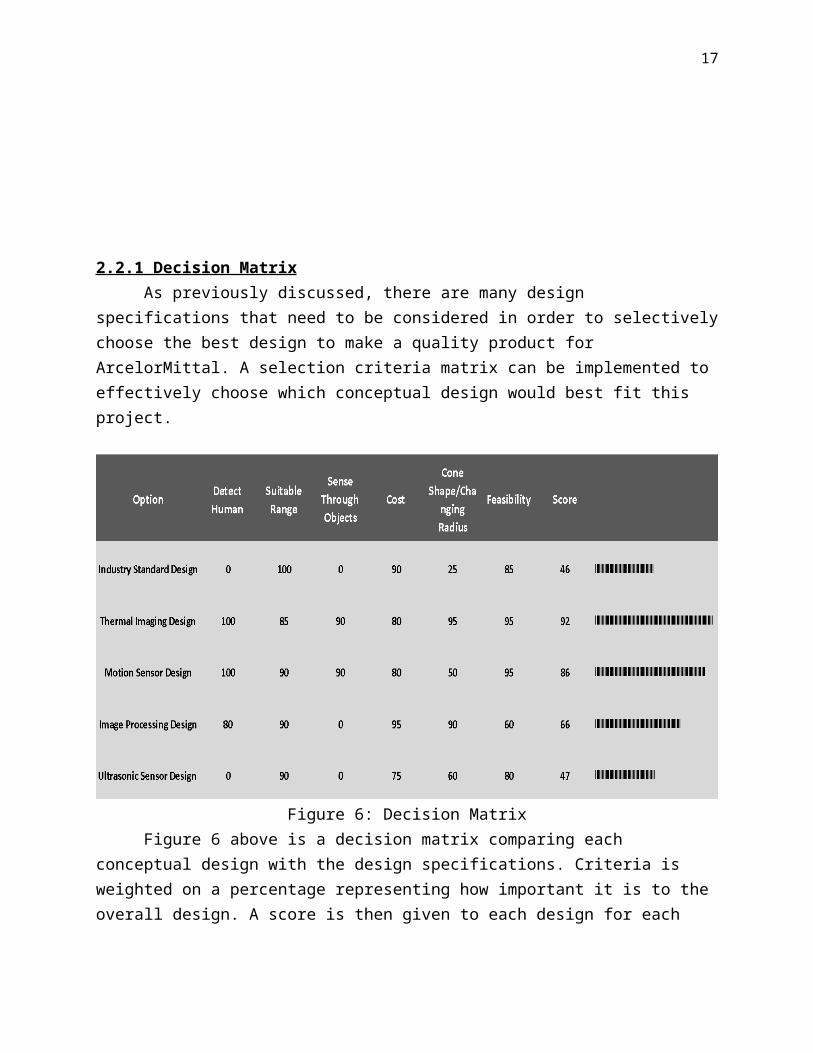
2.2.1 Decision MatrixAs previously discussed, there are many design specifications that need to be
considered in order to selectively choose the best design to make a quality product for ArcelorMittal. A selection criteria matrix can be implemented to effectively choose which conceptual design would best fit this project.
Figure 6: Decision MatrixFigure 6 above is a decision matrix comparing each conceptual design with the design
specifications. Criteria is weighted on a percentage representing how important it is to the overall design. A score is then given to each design for each criteria, where 100 is the highest possible score in each category.
The results of the matrix show that while any of the designs will work, the Thermal Imaging Design and the Motion Sensor Design will follow the specifications most accurately. Taking into account that the Thermal Imaging Design is able to change the radius of the cone effectively makes the Thermal Imaging Design the most feasible design.
Compared to other existed safety systems in industry which mainly focus on avoiding collisions between machines, our approach, on the other hand, focused on how to differentiate a human body from surrounding environment using the thermal imaging method and warn the person when needed.
13
After several weeks’ implementation and testing with the proposed solution, the design team made sure the proposed solution was able to detect a human body presented in measure range and decided to go with the thermal imaging method for project’s final design. The design team believed that this approach would be successful due to its ability to detect human body and to adjust size of measurement range to create various cone size as required by sponsor.
2.2.2 Final Overall Design
Overall Design: Figure 7
Above, Figure 7 proposes the high level design for the implementation of the system. The proximity sensor measures the crane's load distance from the ground and output the information to the micro controller. If the load is above 8 ft. off the ground, then the device is idle and only measure the distance. Once the load is within the 8 ft. range, the microcontroller activates the thermal sensor. If the thermal sensor detects a presence within the temperature range, then the microcontroller outputs to the alarm system and writes data to the data drive.
2.3 Budget
During this project, the design team had a total of $500 budget to use on research,
prototyping, and testing of the designed system. One of the project’s objective was to make a
low-cost while well-performing device which can be mass-produced and implemented into
industry. The cost of the project was optimized throughout this project to reach the mentioned
objective.
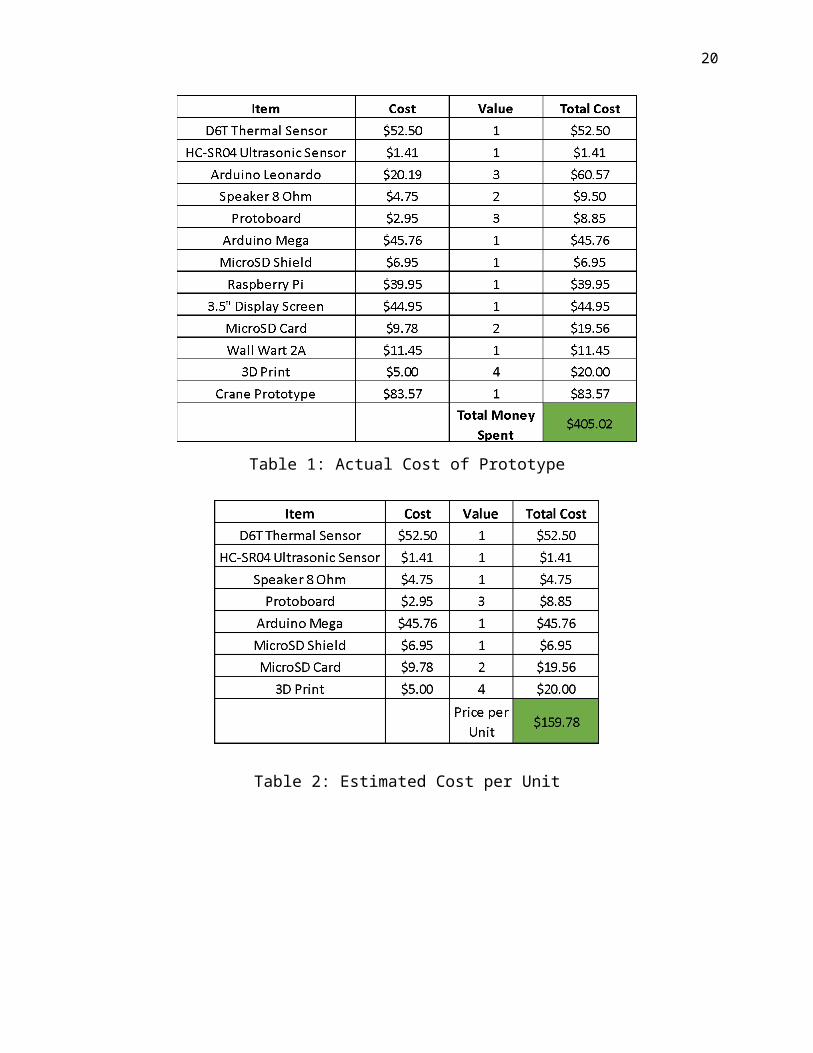
The design team made an initial estimate on the cost of the designed system for $240. A
table breaking down the actual cost of the prototype is shown in Table 1. The design team
believes that the cost of design would be greatly reduced when putting in mass-production,
14
since a prototype would require a higher cost due to the small quantity of components were
being purchased and the purchases that don’t have to do with the component housing. This
price is shown in Table 2.
Table 1: Actual Cost of Prototype
Table 2: Estimated Cost per Unit
15
Figure 8: Pi-Chart Showing Actual Cost
2.4 Product Schedule
A Gantt chart can be found in Appendix 3 carefully outlining what needed to be accomplished at what time. Carefully following this chart is very important for keeping the project on time and on schedule. This also allows group members to very consciously follow the schedule and accomplish what they need to finish in order to not disappoint the rest of the team.
16
Chapter 3 - Technical Description of Work Performed
3.1 Hardware
The primary function of the safety system is to be able to detect any human body part in the danger zone and alert the operator. With this focus in mind, the team had to figure out what sensor(s) would work best to achieve this purpose.
3.1.1 Components
Figure 9: HC-SR04 Ultrasonic Sensor– the HC-SR04 takes advantage of the piezoelectric effect to send waves and record the time it takes that same wave to return. This sensor was chosen to sense the distance from the load to the ground. While the sensor cannot do exactly that, the sensor can sense the distance to the crane’s load. Using:
Distance ¿Ground=SensorHeight−Distance ¿ LoadEquation 1: Distance to Ground
Using this formula, the sensor can then output to the rest of the system what height the load is from the ground.
Figure 10: D6T Thermal Sensor – This sensor uses infrared technology to sense its surrounding and create a 4x4 matrix of surrounding temperatures. The sensor has an appropriate radius for our application and appropriate range. The 4x4 matrix can be manipulated to successfully create a cone shape.
Figure 11: Arduino Mega ADK – This microcontroller was selected because of the high amount of flash memory, the high amount of digital and analog pins, data lines, and USB interface. The microcontroller is successfully able to communicate and control every other component by uploading appropriate code to its board.
17
Figure 12: 1.5W 8Ω Speaker – In order to properly output the 80+ db sound required to alert the operators, a speaker with enough wattage and a driving circuit had to be designed. The circuit takes advantage of a transistor, high-wattage resistors, and a voltage input from both the power supply and the Arduino board.
Figure 13: Raspberry Pi 2 Model B – Quick processing time, a CPU, and 1GB RAM makes this device fully capable of running an operating system on board. Using a 3.5” inch screen compatible with the Raspberry Pi, the temperature matrix, cone, and load distance can be outputted onto the screen and mounted to the prototype. This allows for testing and presentation to be done more easily visually and audibly.
Figure 14: SD card shield combines a SD card slot with a 3.3V – 5V level shifter and a 3.3V voltage regulator. This enables direct hookup to the Arduino’s SPI pins.
Figure 15: SD card need to be formatted into the FAT format before use. A 2 GB or less card can be formatted in FAT or FAT32. Cards larger than 2 GB should be formatted in FAT32. Cards larger than 32 GB should be formatted in exFAT.
Figure 16: A scaled version of an overhead crane was created using PVC pipe, wood, a pulley system, and a simulated load. The crane can move horizontally and vertically. The crane is 7.5’ high by 4’ wide.
18
3.1.1 Thermal Sensor
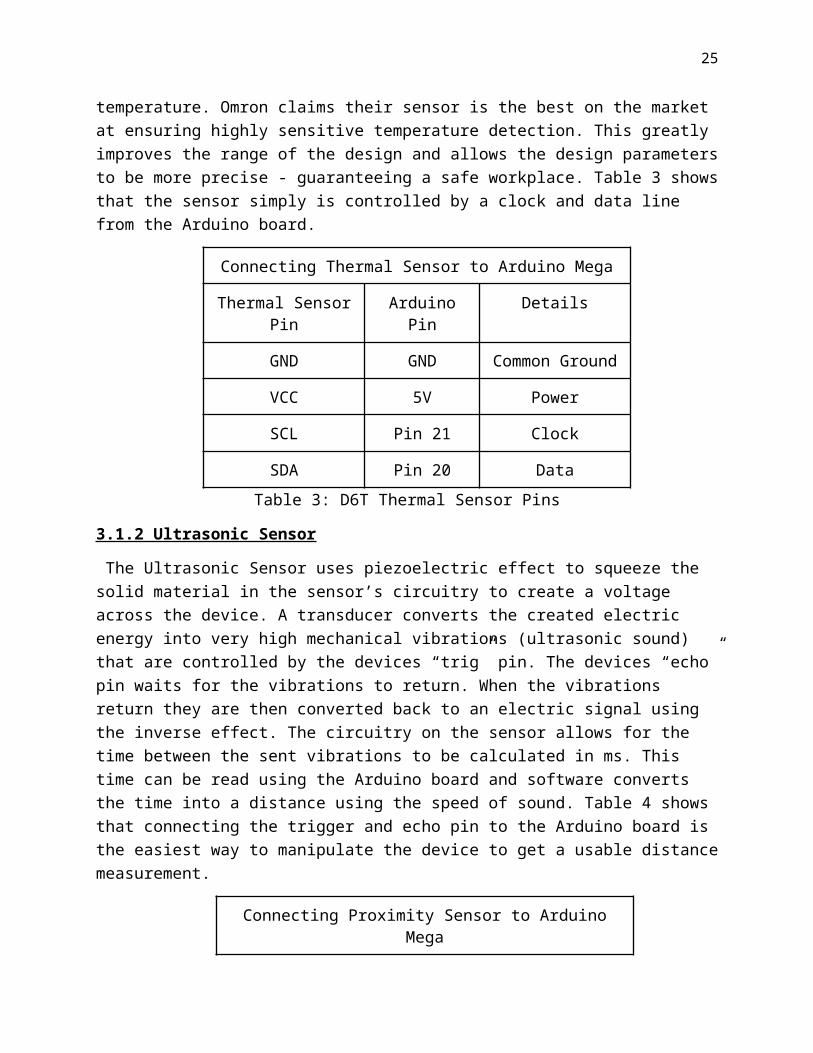
The thermal sensor chosen for this project (Omron D6T), is unlike comparable models on the market. The sensor picks up infrared light, amplifies the signal, and uses calculations to convert it into a useful metric. The difference between the D6T and the rest of the market is the sensor utilizes MicroElectroMechanical (MEMS) technology to contactlessly measure an entire areas temperature. Omron claims their sensor is the best on the market at ensuring highly sensitive temperature detection. This greatly improves the range of the design and allows the design parameters to be more precise - guaranteeing a safe workplace. Table 3 shows that the sensor simply is controlled by a clock and data line from the Arduino board.
Connecting Thermal Sensor to Arduino Mega
Thermal Sensor Pin Arduino Pin Details
GND GND Common Ground
VCC 5V Power
SCL Pin 21 Clock
SDA Pin 20 Data
Table 3: D6T Thermal Sensor Pins
3.1.2 Ultrasonic Sensor
The Ultrasonic Sensor uses piezoelectric effect to squeeze the solid material in the sensor’s circuitry to create a voltage across the device. A transducer converts the created electric energy into very high mechanical vibrations (ultrasonic sound) that are controlled by the devices “trig” pin. The devices “echo” pin waits for the vibrations to return. When the vibrations return they are then converted back to an electric signal using the inverse effect. The circuitry on the sensor allows for the time between the sent vibrations to be calculated in ms. This time can be read using the Arduino board and software converts the time into a distance using the speed of sound. Table 4 shows that connecting the trigger and echo pin to the Arduino board is the easiest way to manipulate the device to get a usable distance measurement.
Logging data was outlined earlier in this report as a crucial way for ArcelorMittal to assess their current practices while operating an overhead crane. The MicroSD Shield easily connects to the Arduino board and can be written to output the required data in an excel spreadsheet (refer to software section of this chapter). The pins used for SD data logging connection are listed in Table 5.
Connecting the SD Card Reader
SD Card Reader Pin Arduino Pin Details
GND GND Common Ground
VCC 5V Power
CS Pin 53 Chip Select
MOSI Pin 51 SPI
MISO Pin 50 SPI
SCK Pin 52 Clock
Table 5: Pin Connections of SD Card Shield
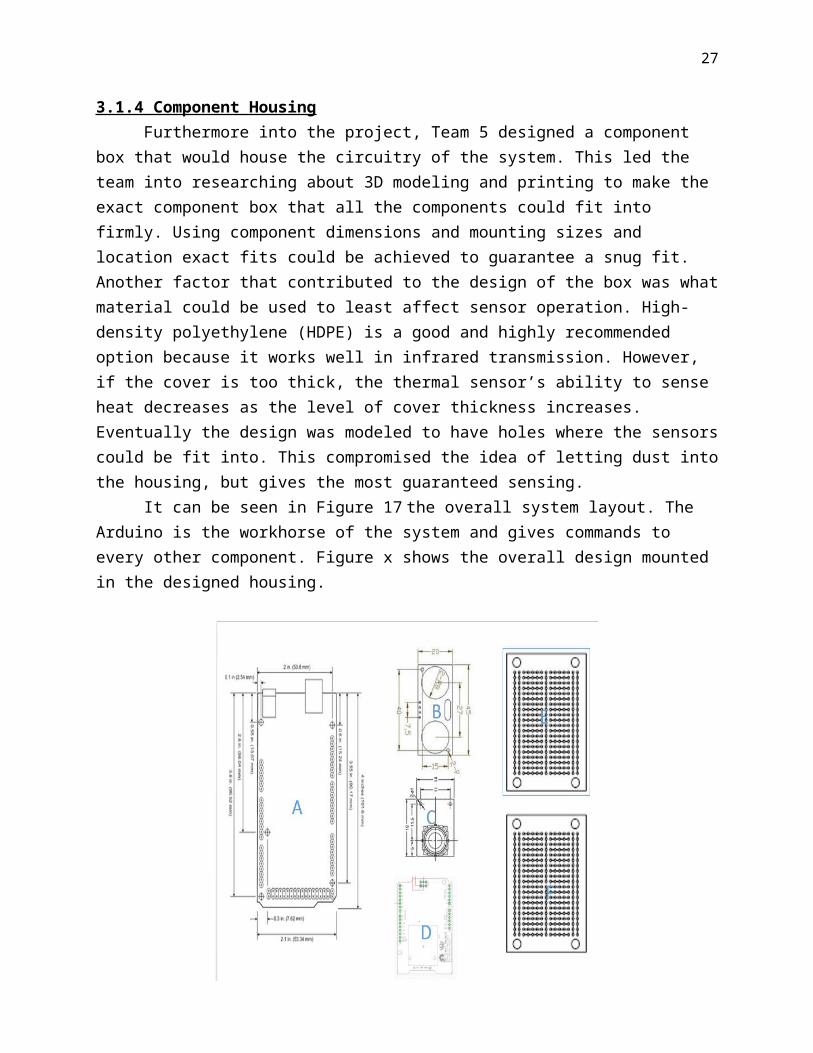
3.1.4 Component HousingFurthermore into the project, Team 5 designed a component box that would house the
circuitry of the system. This led the team into researching about 3D modeling and printing to make the exact component box that all the components could fit into firmly. Using component dimensions and mounting sizes and location exact fits could be achieved to guarantee a snug fit. Another factor that contributed to the design of the box was what material could be used to least affect sensor operation. High-density polyethylene (HDPE) is a good and highly recommended option because it works well in infrared transmission. However, if the cover is too thick, the thermal sensor’s ability to sense heat decreases as the level of cover thickness increases. Eventually the design was modeled to have holes where the sensors could be fit into. This compromised the idea of letting dust into the housing, but gives the most guaranteed sensing.
20
It can be seen in Figure 17 the overall system layout. The Arduino is the workhorse of the system and gives commands to every other component. Figure x shows the overall design mounted in the designed housing.
Figure 17: Components to Fit in Housing
Shown in Figure x is the planned arrangement of the major components in the housing. The sensors were placed in the middle of the housing (locations B and C) so the box could be mounted directly to the crane above the load to ensure proper distance sensing and cone implementation. The MicroSD shield (D) was placed in the front of the housing to allow for easy removal of the MicroSD card when data needs to be read. Two protoboards (E and F) house a power supply circuit that creates 9VDC, 5VDC, and 3.3VDC. The 9VDC is connected to the Arduino board to supply power. The 5VDC is ran to a bus on the protoboard to ensure ample power was available for all the components (every components requires 5VDC). Also soldered on the protoboards is the speaker driving circuit and a few other components needed for proper operation. Lastly, the Arduino board (A) was placed in front of two designed holes in the housing to enter a power jack cable and USB cable to the Arduino. The speaker (not shown) is mounted on the outside of the box to ensure proper decibel level of the speaker. The full housing can be seen in Figure 18, but the figure does not include the Raspberry Pi and screen showing the visual because that is mounted elsewhere on the crane prototype.
21
Figure 18: Design System in Housing (Lid Off)
3.2 Software
On the software side, Arduino provides its own libraries with functions and free codes that make programming the microcontroller easier and save time from building supporting circuitry and writing low level codes. The Arduino software which is called IDE provides libraries with functions that keep Team 5 from writing with C from very low level. Also the functions provided by Arduino is easy to understand. The simplest of these are functions to control and read the I/O pins rather than having to fiddle with the bus/bit masks normally used to interface with the Arduino mega I/O. More useful are things such as being able to set I/O pins to PWM at a certain duty cycle using a single command or doing Serial communication.
3.2.1 Software ImplementationAfter the hardware implementation is complete. The majority of the functions are
achieved through software. The software must achieve these tasks:● Detect load distance● Detect humans● If a human is detected:
22
○ Turn on an alarm○ Record data
The majority of the algorithm relies heavily on the D6T sensor. With that in mind, there are some main constraints that must be achieved:
● Differentiate between static and human objects● Measure the distance of the load from the floor● Create a cone of safety around the crane’s load● Adjust the angle according to the distance of the crane’s load● Sound an alarm to if the operator is within the “cone of safety”
Descriptions of how each part of the software was implemented will be shown below:
3.2.2 Detecting HumansHumans have two definite features that can be measured: temperature and movement.
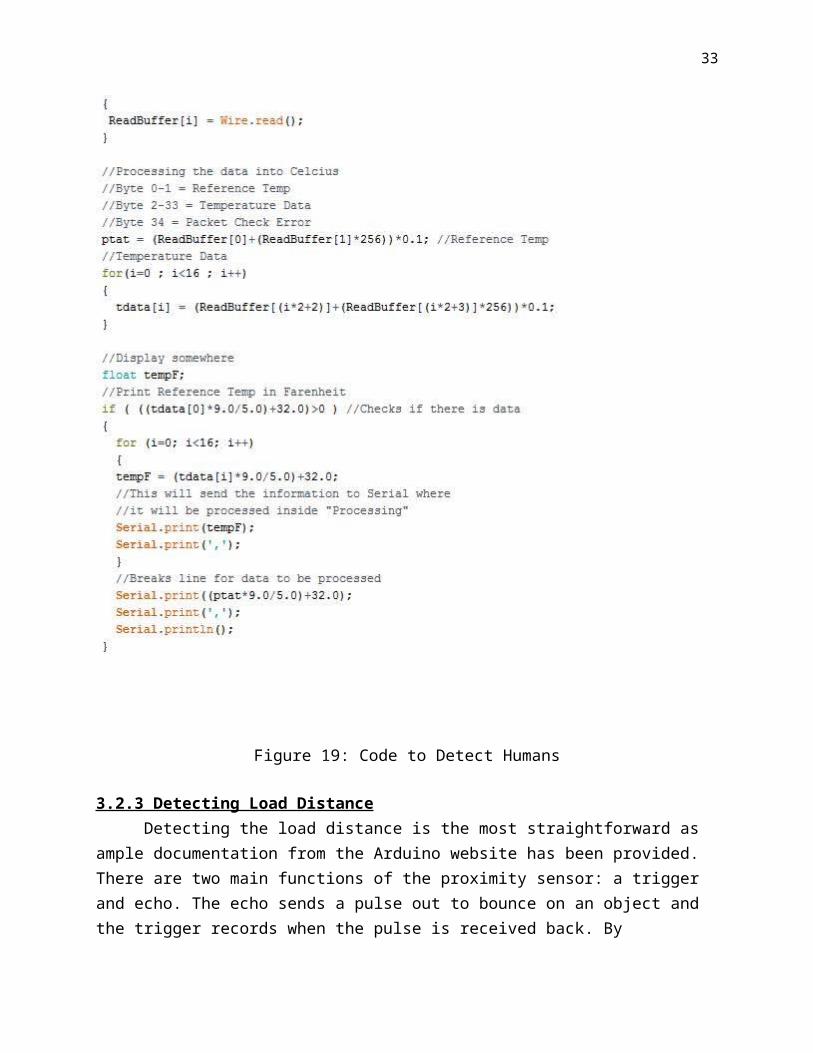
By using a D6T temperature sensor, Team 5 can measure temperature by its own definition and movement can be measured through software. The software implementation for each constraint will be discussed later on but this section will focus on how to use record temperature with the D6T. A great detail on how this is accomplished is on Charlie’s Application Note on implementing an Arduino with the D6T. But, this is section will be greatly simplified to preserve space for this document.
The D6T uses an I2C serial connection to communicate between itself and a controller. There are no libraries written for the Arduino so a new library has been built to support the D6T. When requesting the data, the D6T sends 35 bytes of data. Each data correspond to the high and low bytes of a 16 bit unsigned temperature data. There are 16 pixel data points, an error check byte, and relative temperature point.
Once the data is received, it can then be converted to readable Celsius and Fahrenheit. Each of the 16 data points can be processed inside controller and sent to a CPU to graphically display it neatly on a 4x4 pixel array. The code in figure 19 can show how this can be achieved.
23
24
Figure 19: Code to Detect Humans
3.2.3 Detecting Load DistanceDetecting the load distance is the most straightforward as ample documentation from
the Arduino website has been provided. There are two main functions of the proximity sensor: a trigger and echo. The echo sends a pulse out to bounce on an object and the trigger records when the pulse is received back. By calculating the time, which is provided by the proximity sensor library, the distance can be measured. In figure 20, it shows how the distance is measured and how it is converted to feet.
25
26
Figure 20: Detecting the Load
3.2.4 Code for AlarmThis is very simple as it only requires a tone library and one line of code:
tone(pin,frequency);
The pin is where speaker is connected and the frequency is the sound.
3.2.5 Code for Data Logging
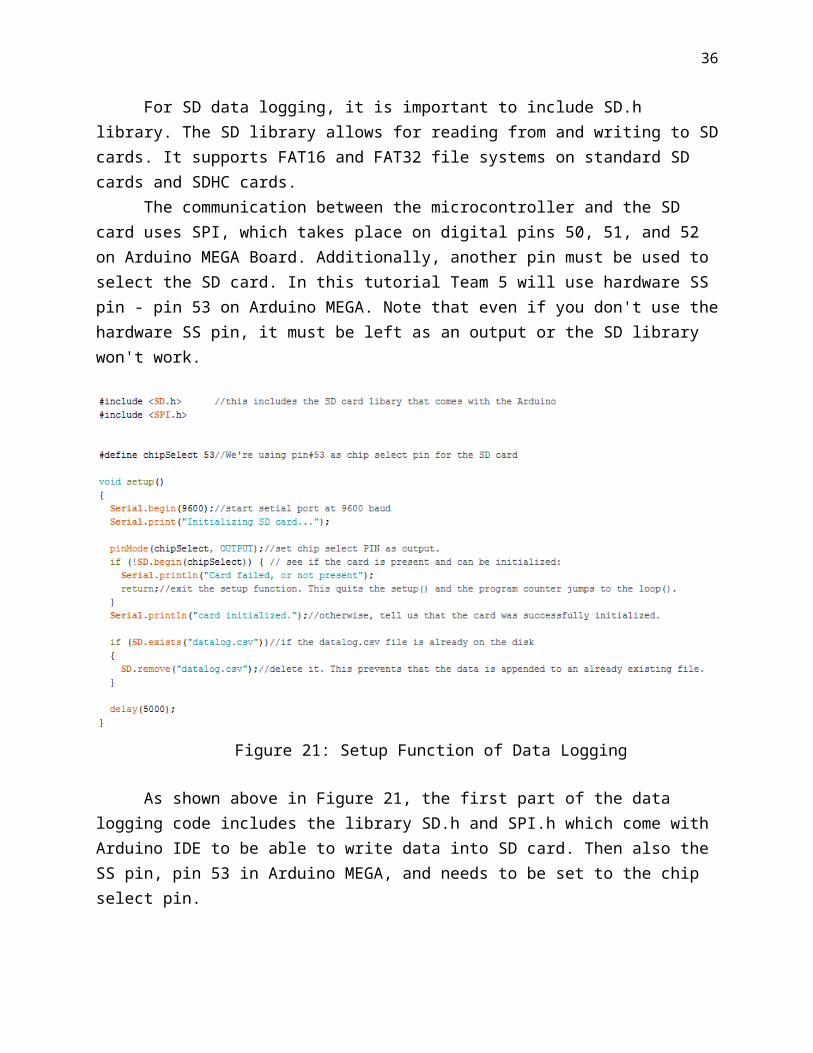
For SD data logging, it is important to include SD.h library. The SD library allows for reading from and writing to SD cards. It supports FAT16 and FAT32 file systems on standard SD cards and SDHC cards.
27
The communication between the microcontroller and the SD card uses SPI, which takes place on digital pins 50, 51, and 52 on Arduino MEGA Board. Additionally, another pin must be used to select the SD card. In this tutorial Team 5 will use hardware SS pin - pin 53 on Arduino MEGA. Note that even if you don't use the hardware SS pin, it must be left as an output or the SD library won't work.
Figure 21: Setup Function of Data Logging
As shown above in Figure 21, the first part of the data logging code includes the library SD.h and SPI.h which come with Arduino IDE to be able to write data into SD card. Then also the SS pin, pin 53 in Arduino MEGA, and needs to be set to the chip select pin.
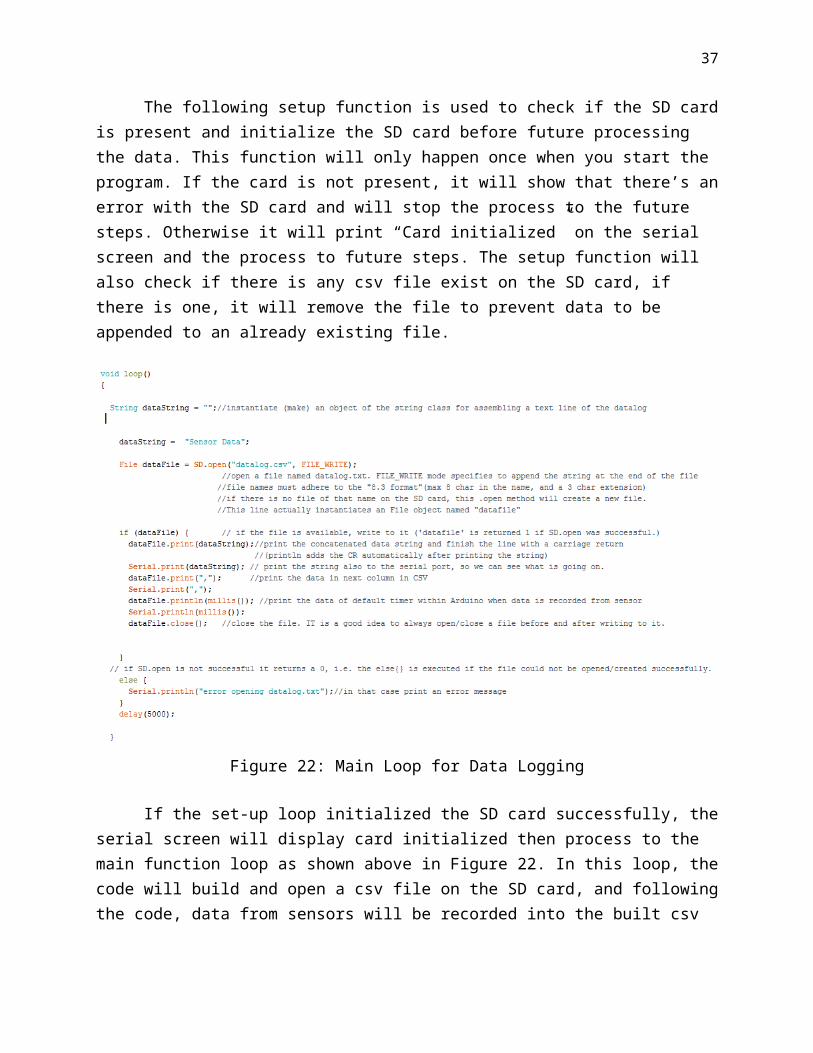
The following setup function is used to check if the SD card is present and initialize the SD card before future processing the data. This function will only happen once when you start the program. If the card is not present, it will show that there’s an error with the SD card and will stop the process to the future steps. Otherwise it will print “Card initialized” on the serial screen and the process to future steps. The setup function will also check if there is any csv file exist on the SD card, if there is one, it will remove the file to prevent data to be appended to an already existing file.
28
Figure 22: Main Loop for Data Logging
If the set-up loop initialized the SD card successfully, the serial screen will display card initialized then process to the main function loop as shown above in Figure 22. In this loop, the code will build and open a csv file on the SD card, and following the code, data from sensors will be recorded into the built csv file. This csv file should be able to open as an excel spread sheet on computer with matrix of well-organized data.
3.2.6 Implementing ConstraintsDetect human presence and static objects:
To detect humans, Team 5 used temperature as the main sensor. By knowing the max temperature and average temperature the software can detect if there is an object that is hotter than its surroundings. Using that information, it can detect a human presence or a hot static object. Using tdata[] as the array that holds all the temperature data (in Fahrenheit) , the temperature max, average, and last max can be processed. If the max temperature is above a certain threshold, which is defined in our testing, then it will trigger an alarm. Figure 23 shows the method for getting data points:
29
30
Figure 23: Detecting Human Presence and Static Objects
31
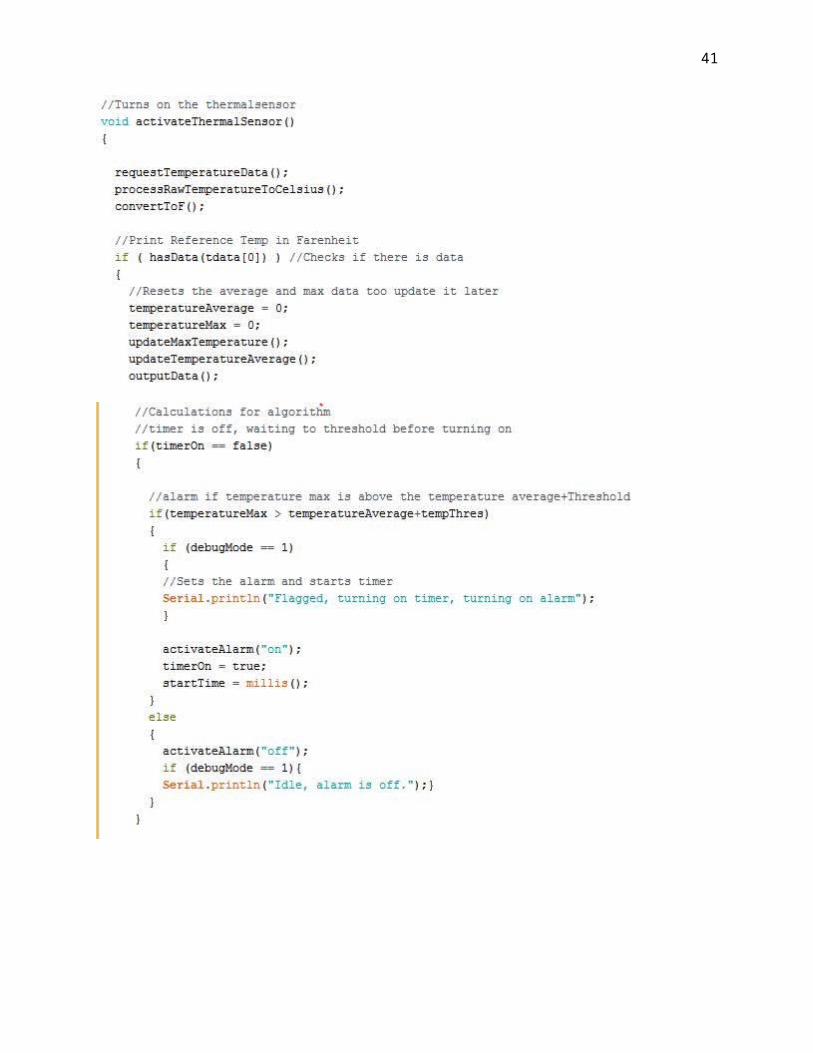
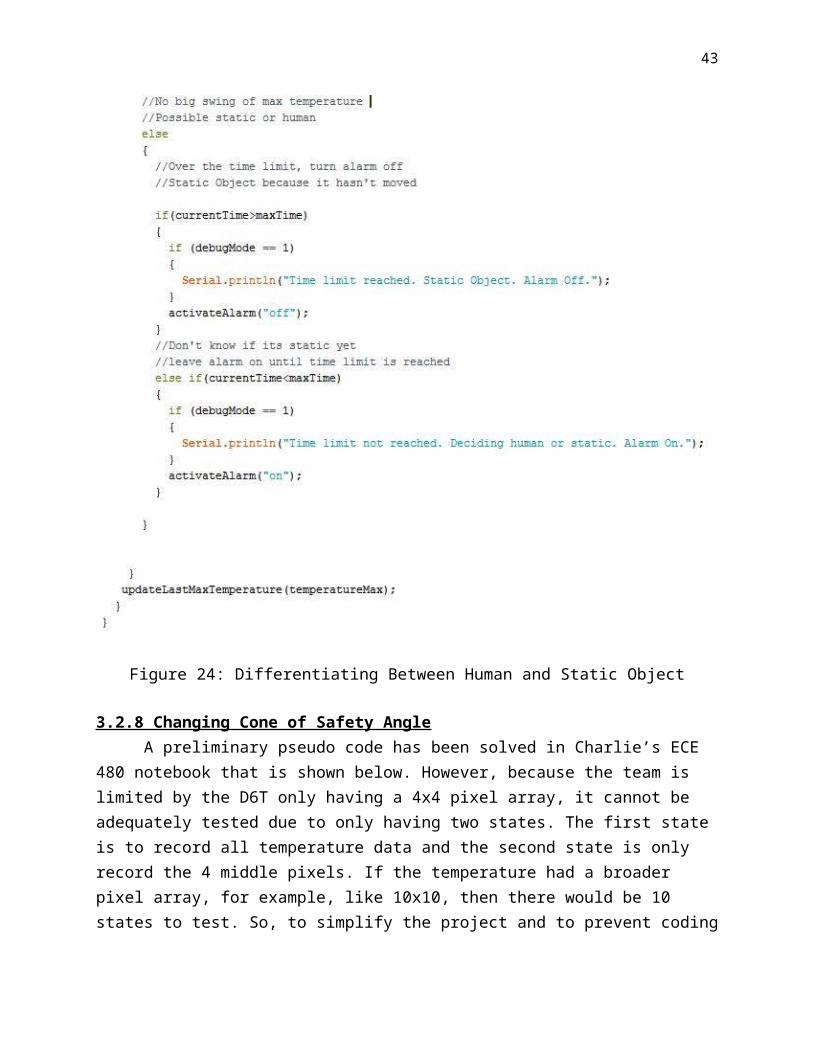
3.2.7 Differentiating Between Human and Static ObjectOne more thing that differentiates between a static object and a human is movement.
When a static object is measured, the temperature only fluctuates under a certain temperature swing: which is defined in the testing process. If a heated object only fluctuates under a certain temperature for a fixed period of time then it is static. Whereas, if it was human, then the temperature would change dramatically due to movement. In the code below, the fixed time period to wait is 5 seconds. The code is accomplished below in Figure 24:
32
33
34
Figure 24: Differentiating Between Human and Static Object
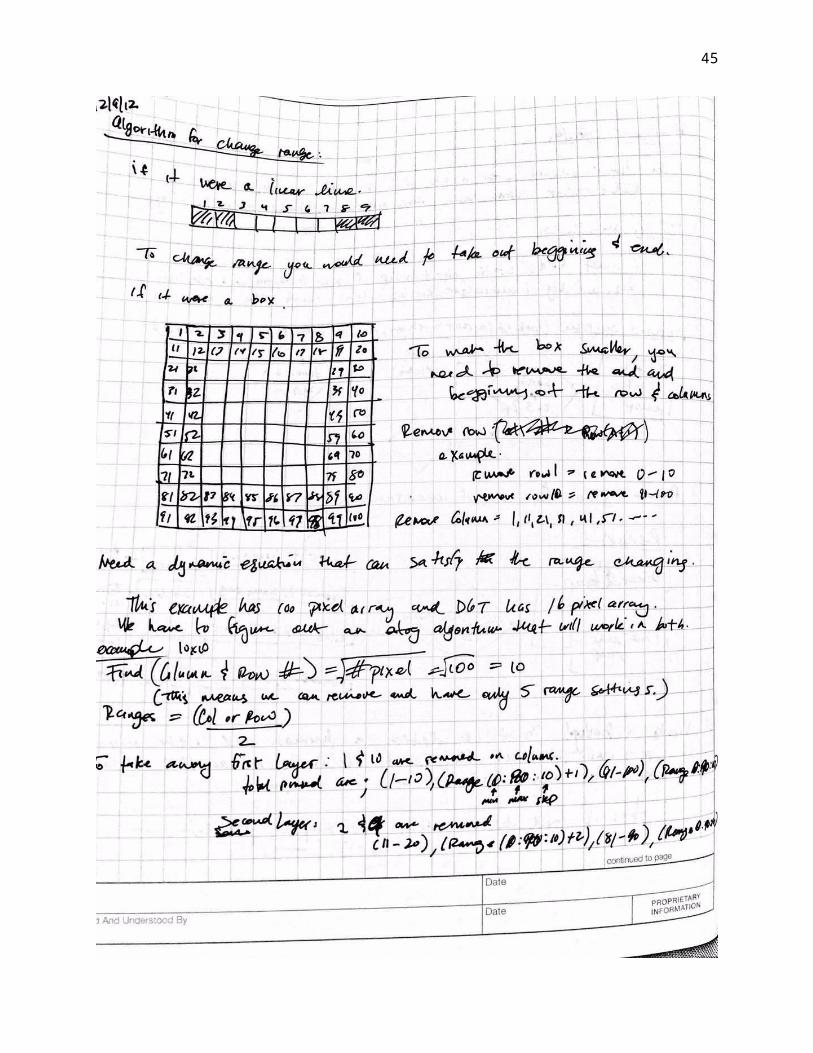
3.2.8 Changing Cone of Safety AngleA preliminary pseudo code has been solved in Charlie’s ECE 480 notebook that is shown
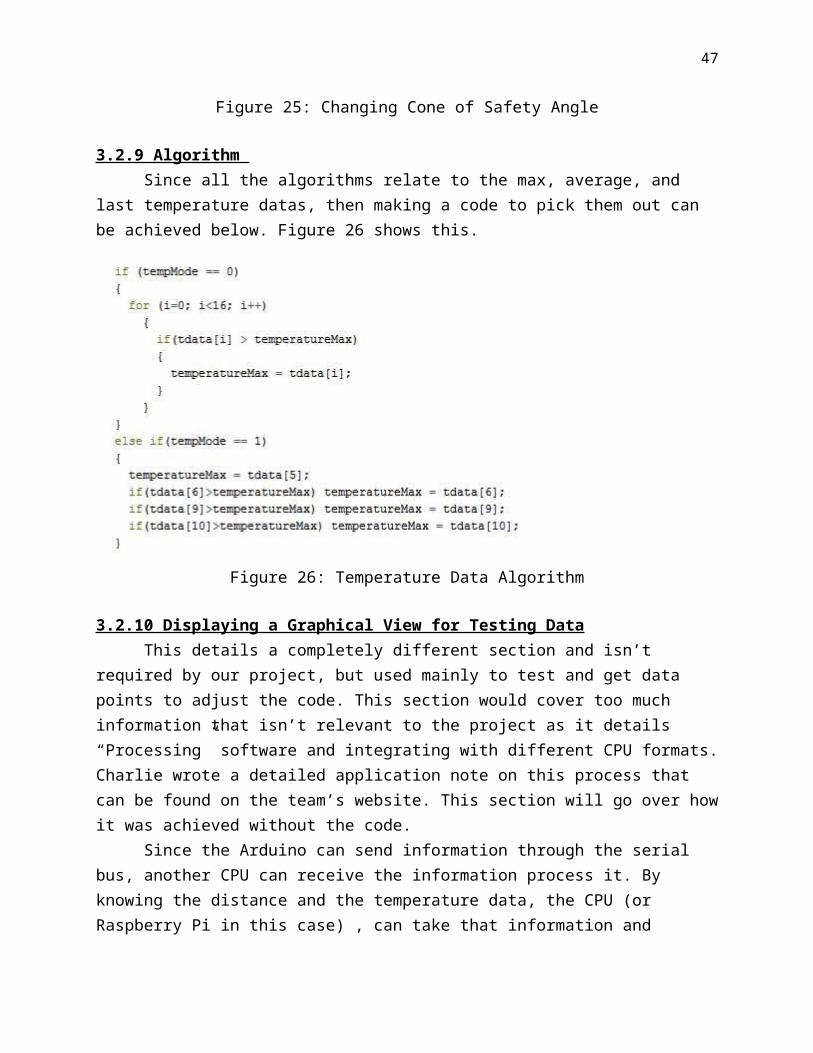
below. However, because the team is limited by the D6T only having a 4x4 pixel array, it cannot be adequately tested due to only having two states. The first state is to record all temperature data and the second state is only record the 4 middle pixels. If the temperature had a broader pixel array, for example, like 10x10, then there would be 10 states to test. So, to simplify the project and to prevent coding inaccurate results, the two angles were hard coded. To use all the temperature data, simply apply the algorithms for detection to all. To only record the next state, pixels 6,7,10, and 11 were picked out for doing the algorithm. To choose between the states, the proximity function will choose it based on the distance of the crane's load. Figure 25 shows this.
35
36
37
Figure 25: Changing Cone of Safety Angle
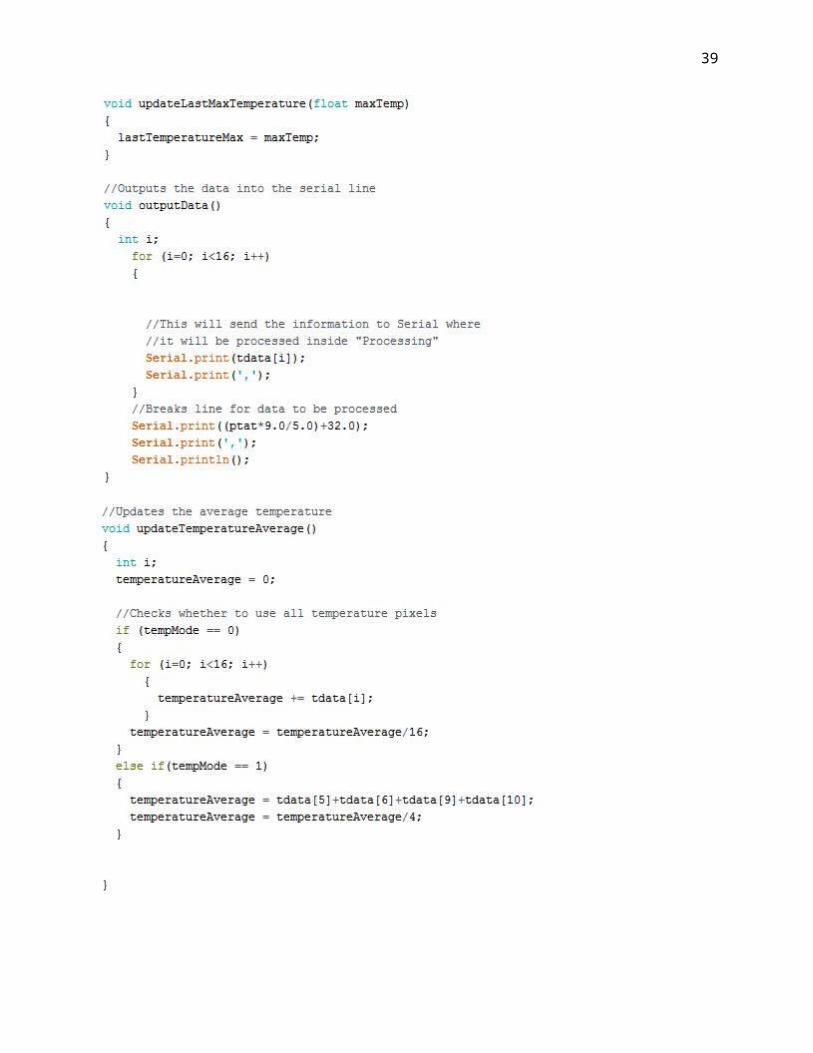
3.2.9 Algorithm Since all the algorithms relate to the max, average, and last temperature datas, then
making a code to pick them out can be achieved below. Figure 26 shows this.
Figure 26: Temperature Data Algorithm
3.2.10 Displaying a Graphical View for Testing DataThis details a completely different section and isn’t required by our project, but used
mainly to test and get data points to adjust the code. This section would cover too much information that isn’t relevant to the project as it details “Processing” software and integrating with different CPU formats. Charlie wrote a detailed application note on this process that can be found on the team’s website. This section will go over how it was achieved without the code.
Since the Arduino can send information through the serial bus, another CPU can receive the information process it. By knowing the distance and the temperature data, the CPU (or Raspberry Pi in this case) , can take that information and display it graphically. It can also process other data like max and average from it. By displaying it, it can be easier to interpret the data. Chapter 4 shows how this process looks when ran.
3.2.11 Combining the Code To bring everything together, the proximity sensor will measure the distance of the load
and turn on the temperature sensor until a certain height. At different heights, the distance function will change the state of the thermal sensor: full angle data, half angle data, and off. While the thermal sensor is on, it will calculate all the temperature data and send it to the
38
controller. The controller will calculate all the relative data like distance, pixel temperature, relative temperature, last max temperature, max temperature, and average temperature. Using the algorithms explained previously, it will detect a heated object and differentiate between human or static object through temperature swings. From there, sound an alarm that will alert the operator and record relative data at the time instant. The source code, appropriately commented, is provided in Appendix 3.Chapter 4 – Test Data with Proof of Functional Design4.1 Testing of Ultrasonic Sensor
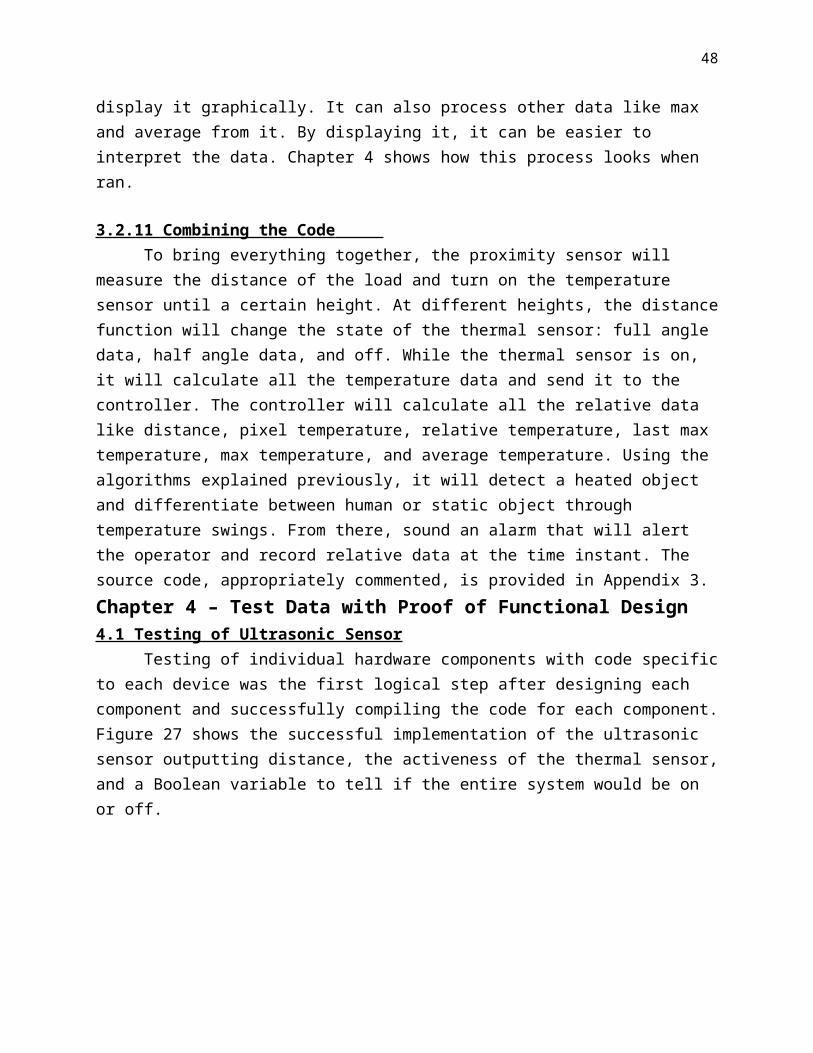
Testing of individual hardware components with code specific to each device was the first logical step after designing each component and successfully compiling the code for each component. Figure 27 shows the successful implementation of the ultrasonic sensor outputting distance, the activeness of the thermal sensor, and a Boolean variable to tell if the entire system would be on or off.
Figure 27: Working Ultrasonic Sensor4.2 Testing of Thermal Sensor
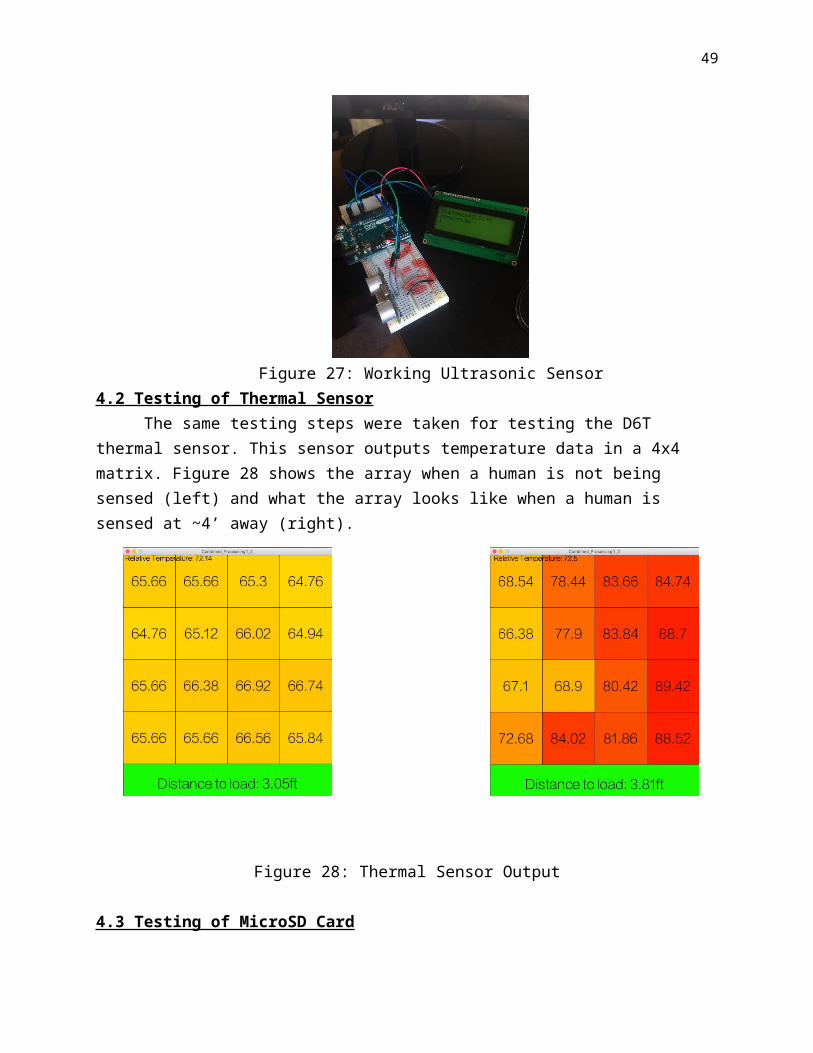
The same testing steps were taken for testing the D6T thermal sensor. This sensor outputs temperature data in a 4x4 matrix. Figure 28 shows the array when a human is not being sensed (left) and what the array looks like when a human is sensed at ~4’ away (right).
39
Figure 28: Thermal Sensor Output
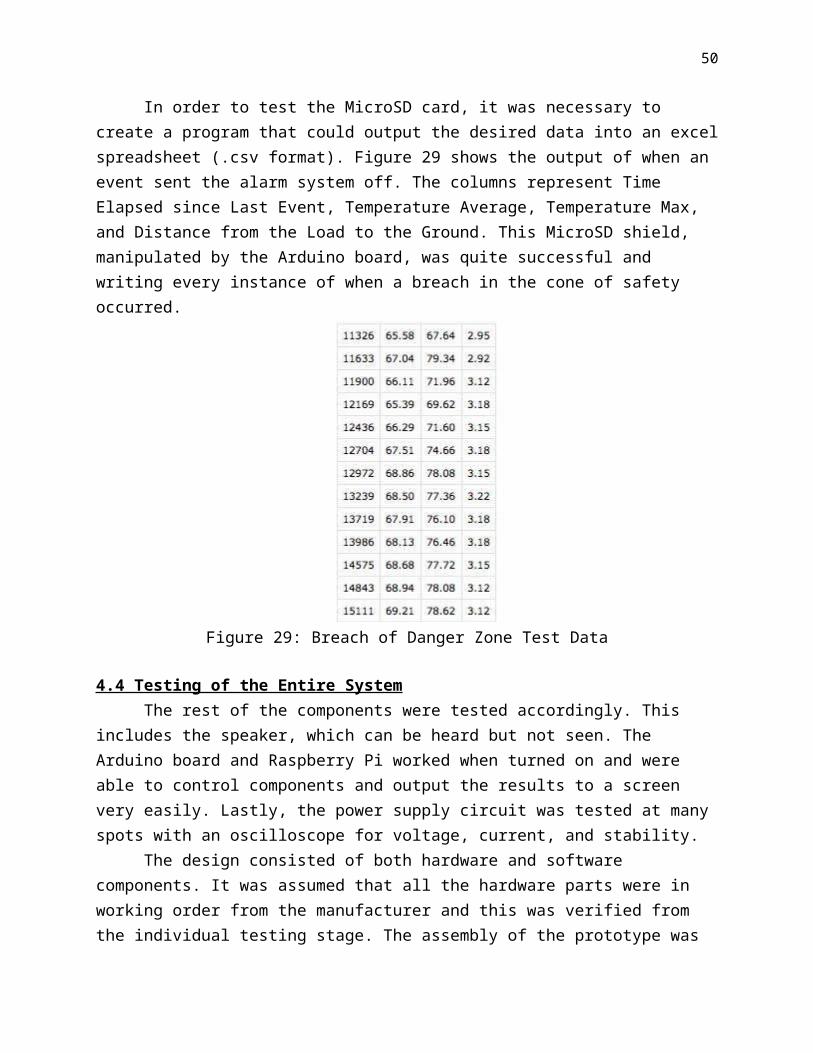
4.3 Testing of MicroSD CardIn order to test the MicroSD card, it was necessary to create a program that could
output the desired data into an excel spreadsheet (.csv format). Figure 29 shows the output of when an event sent the alarm system off. The columns represent Time Elapsed since Last Event, Temperature Average, Temperature Max, and Distance from the Load to the Ground. This MicroSD shield, manipulated by the Arduino board, was quite successful and writing every instance of when a breach in the cone of safety occurred.
Figure 29: Breach of Danger Zone Test Data
4.4 Testing of the Entire SystemThe rest of the components were tested accordingly. This includes the speaker, which
can be heard but not seen. The Arduino board and Raspberry Pi worked when turned on and were able to control components and output the results to a screen very easily. Lastly, the power supply circuit was tested at many spots with an oscilloscope for voltage, current, and stability.
The design consisted of both hardware and software components. It was assumed that all the hardware parts were in working order from the manufacturer and this was verified from the individual testing stage. The assembly of the prototype was one of the most important tasks
40
of the design process. It not only determined if the overall design was working, but also aided in ensuring the success of the software. Compiling the code successfully was the first step in ensuring that the software would successfully manipulate the components as designed.
Testing of the software was crucial to the overall success of project as well as ensuring the prototype was assembled and working properly. Once the program was uploaded and power connected to the microcontroller, testing was performed. The basic code made it possible to verify that the ultrasonic sensor sensed the load, turned on the rest of the system, created a cone, and then alerted the operator and saved the data if the cone was breached.
To make the system more versatile, the code was edited to create a changing radius, sense for static heat objects in the same range as a human’s temperature, set the range of the temperatures that set off the alarm, and more. Since the thermal sensor has a built in relative temperature monitor, it could be determined how the human’s sensed temperature changed with the relative temperature. Figure 30 and Figure 31 show the Distance vs. Temperature at two different relative temperatures. Finding these variations made it possible to set ranges of what a human’s temperature might be (depending on clothing, high body heat from hard work, etc.) at different temperatures. This way, the code would be able to handle any relative temperature. Also, these tests gave insight into how a human’s temperature changes at a distance more realistic to the crane height in a steel mill.
Simple geometry could be done to find how large the radius of the cone should be at different heights so that it only covered the crane’s load and a buffer zone. Making the cone flat into a 2D isosceles triangle and then triangle formulas gave the desired angle of the matrix for different heights of the center of the triangle.
41
Figure 30: Distance vs. Temperature at 44 F
Figure 31: Distance vs. Temperature at 73.22 F
Correctly designing the power supply to be able to handle all the current drawn by the components was important to the design. The power supply could handle 1A current draw and at maximum the system drew ~500mA. Supplying power to the system from a DC power supply
42
set to a 1A max and observing how much current was drawn and if there was a voltage drop guaranteed the success of the power supply. The power supply drew at max ~400mA when the entire system was on (somebody was being sensed by the thermal sensor).
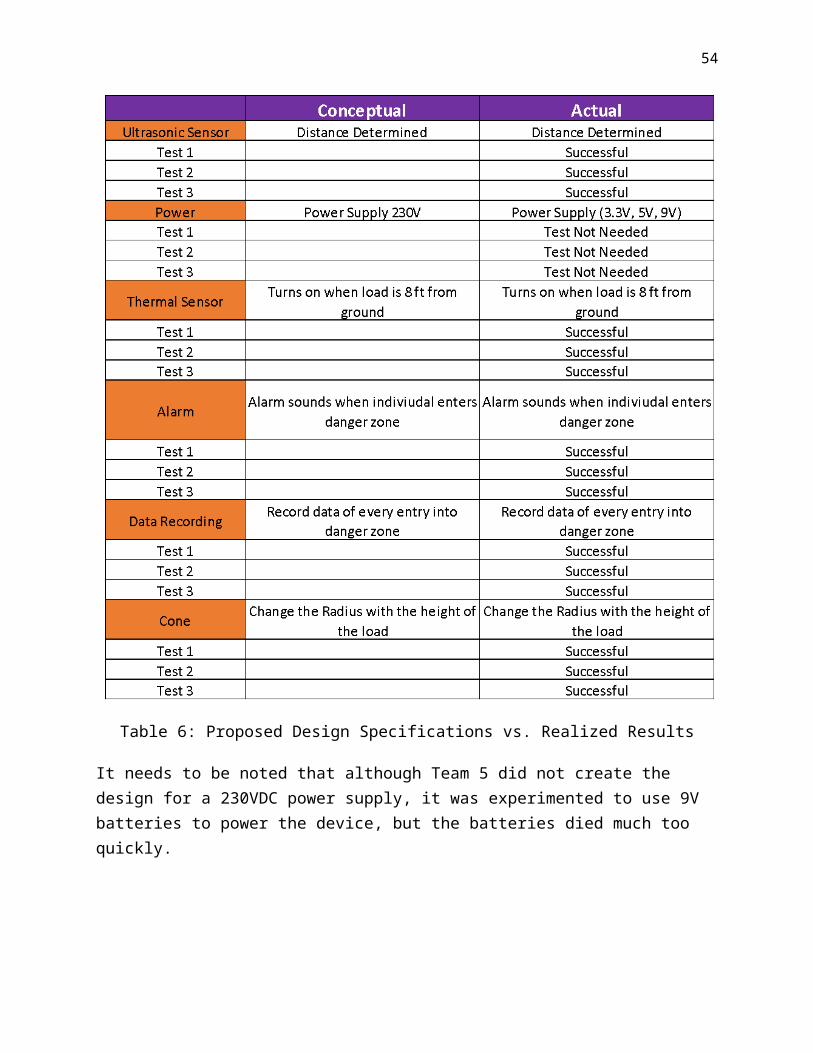
Comparing the assigned and proposed design specifications to the achieved specifications is an important step when assessing how a design performed. Table 6 shows how the design lived up to the proposed design and the scope of the project. Each test in the figure was run differently (for example testing the danger zone was first done with the full body in, then just a hand, then just a gloved hand) to ensure that the first result was not a fluke. In addition these tests, the full prototype has been successfully used many times to test and make changes to the code, if necessary. Although this is not a complete list of everything tested and all the specifications strived to achieve, the list shows how the design matched up against the major specifications.
43
Table 6: Proposed Design Specifications vs. Realized Results
It needs to be noted that although Team 5 did not create the design for a 230VDC power supply, it was experimented to use 9V batteries to power the device, but the batteries died much too quickly.
44
Chapter 5 – Design Issues5.1 Improvement in System Housing – Product Safety
For a successful product that can be used in industry and put in mass-production, it need to be safe to use and its functionality have to be reliable as well as long-lasting.
In current final design, the team used a 3D printed box as the protective case for the designed product. The advantage of a 3D printed case is that the team can customize the dimension and thickness of the box by designing a 3D model with CAD design tool such as NX Unigraphics. In this way, the team would be able to fit all the parts into a perfect scaled case without wasting space and secure them in place. Also, it saved time and cost less for the team to test their prototype using a 3D printed case than fabricated one from a manufacture. However, based on the sensitivity of the sensors used in circuitry part of the designed safety system, the material and thickness used for the component box need to be carefully selected to avoid any interference to the sensors and effects from surrounding environment. Especially for the D6T thermal sensor used in this project which is sensitive to temperature change, its ability to sense accurate radiant heat depends directly on the case material and thickness that covers it. Team 5 need to make sure the case material won’t affect the measurement of thermal sensor, at the same time, be able to dissipate heat generated from working microcontroller and other components.
For a product that will be used in industry environment such as this safety system, it is important to meet industry standard. In this way, product can perform better and survive longer in certain industry environment. For this project, fabricated case following industry standard will be preferred to increase the reliability of the system. Also, in industry environment, the sensors may become dusty after certain time even with the presentence of protective case, it is important to find a convenient way to keep the sensors clean to generate accurate and reliable result.
What’s more, the components in the protective case are relatively fragile. As the designed product moving with the crane hook frequently, there is possibility that the components in the case may break overtime. Therefore, method to improve the protection of components in case is needed for a long-lasting and reliable device.
5.2 Power Supply – Standards The given requirements regarding the power supply were that the system needed to
either use 230-250VDC currently free on the crane or power itself using a battery. Since wall sockets are 120V in America, the circuit was designed around using that as an input. Much design time went into using 9V batteries to power the circuit, but calculations on the mAH proved that it would take many 9V batteries to power the system for the time needed (24/7).
Ultimately this was the only area the design team failed to meet the given design criteria. The circuit could be altered to input 230V, but was not designed this way because it
45
was unfeasible to purchase and integrate a 230V power supply into our circuit. A portable battery would be the easiest way to power the system if a proper design could be created for that.
5.3 Panasonic Thermal Sensor – Product LiabilityThe thermal sensor that was ultimately purchased creates a 4x4 array of the sensed
temperatures and is effective at max 5 meters. Originally, the design team had decided upon a higher model thermal sensor that had better distance, an 8x8 temperature array, better SNR, and many other improvements in the design than the sensor that was finally purchased. The problem occurred when purchasing of this sensor was tried. A part on the sensor is export controlled and a form must be filled out by the end user stating they would not use the sensor for a weapon of mass destruction, chemical warfare, etc. Michigan State could not decide who shall be liable for this and decided it was best to find a different thermal sensor that was not export controlled and would leave Michigan State University liable.
46
Chapter 6 – Final Cost, Schedule, Summary and Conclusions6.1 Summary
Safety in industrial workplaces such as the environment at ArcelorMittal is always the highest priority. Implementing an affordable and compact product such as the one described in the previous chapters is a necessity for safety supervisors in the industry. Not only is implementing products for preventative safety the correct thing to do for human-nature reasons, but employee morale improves greatly when the employer invests in their employees, creating a lucrative and hardworking workforce. Historically, companies do not always possess the cash flow to fund the projects necessary to go above and beyond OSHA standards, but it speaks volumes to the type of company ArcelorMittal is that they are willing to fund a design project to improve their safety rather than their margins.
Tasked with the idea of creating a “cone of safety” surrounding an overhead crane’s load, a prototype was born. Not only did the prototype successfully fulfill all major design specifications, but the design was able to implement a technology rarely used in industry to improve on current sensing techniques used in the field. It was determined during the research phase that infrared light (compared to common industry uses of the piezoelectric effect) was the technology that would most sufficiently detect human movements near the crane’s load. Through much research, design, and testing, the prototype is fully capable of fulfilling the design specifications within budget.
Although the design was successful in fulfilling the specifications, there are some areas of the design that could be improved before mass production and implementation across the industry. The current prototype is housed in a 3D modeled box made of 3D printing materials. This housing is sufficient for a prototype, but a metal-fabricated housing would be required to most greatly reduce vibrations and damages to the design. Also, the sensors lose clarity when covered in dust or grime, which is plentiful in an industrial environment. A small windshield wiper or cleaning device (common on sensors in high dust areas such as the melt shop) would be powered and controlled by the design and attached to the housing. Lastly, a portable power supply, while not a necessity, would eliminate the hassle of power wires.
6.2 Schedule and Final CostsThe steps taken to successfully complete the project include research, product
purchasing and product designing, building and implementing designs, testing designs, making appropriate changes to the design, and final testing. Because of the unfamiliarity to the steel industry some group members possessed, the research stage took more time than originally stated. Initial testing and implementation of individual parts as one design also took longer than initially thought. All other steps were completed in an appropriate time range. The final cost was higher than the quoted budget because the group purchased additional components and
47
devices that were not known to be necessary at the beginning of the project. The final cost of the project is $405.02 and the cost per unit of the design is $159.78 as mentioned in Chapter 2.
6.3 Thank YouOverall, Design Team 5 is thankful for the opportunity to research and learn about a
new field and the design process. Team 5 would like to commend ArcelorMittal for their unending pursuit of the safest possible workplace for their employees.
48
Appendix 1: Technical Roles, Responsibilities and Work Accomplished
Xue Cheng - Presentation Preparation
The technical role of Xue in this design group is information seeker and idea contributor as well as programming the Arduino-MEGA for data logging with SD card.
After doing research on sensors, Xue proposed several design ideas to reach sponsor’s goals by using various type of sensors such as laser sensor, thermal sensor, sonar sensor, ultrasonic sensor, eddy current sensor and magneto-inductive displacement sensor. For each method, she came up with advantage and disadvantage of the design to compare and discuss with teammate for best solution. She also came up with the original idea of using thermal sensor to create a cone of safety which can differentiate human body from surrounding environment. For presentation preparation purpose, Xue also collected information related to the project, organized team’s design ideas to provide clear design process to sponsor and was able to provide suggestions and possible solutions to problems throughout the design process.
Xue also contributed to both hardware and software design of the data logging with SD card to insure that the final design would be able to record data from sensors when alarm is triggered as required by sponsor. The team chose to record data within a SD card for the purpose of easy obtaining and reading the data. Specifically, for hardware, following the datasheet and pin map of Arduino MEGA, a SD shield with microSD card was connected to Arduino MEGA in order to allow microcontroller to write data into the SD card. For software part, by composing code with Arduino IDE , Xue was able to record the data clearly with csv format which can be opened as an excel sheet. This made the recorded data more user friendly for anyone with or without programming background. Also, with the help of Charlie, the data logging code was able to combined with the rest of the code and successfully recording data from proximity and thermal sensors. Overall, the recorded data was useful for customer to check the reason that trigger the safety alarm and improve their safety.
49
Samuel Falabi - Document Preparer
In this project, Samuel was responsible for building the power supply circuit that powers different components in the overall safety system’s circuitry. Samuel was able to apply his knowledge from the lab session of the course for this purpose. This task led to his research about the power supply voltage needed by each component to work while integrating them together. He was also responsible for designing the 3D box that houses the components of the safety system. He worked with Richard Szink to measure the dimensions as required and setting up an overall layout of the system. He researched into different Computer Aided Design software which were available in the industry at the moment and was able to streamline our option to NX 10.0 software for this purpose. Since our system involved the use of D6T thermal sensor and ultrasonic sensor, I had to research into how the material used in making the 3D box could possible affect their sensing ability now or in a later time. I discovered that High-density polyethylene (HDPE) is a good and highly recommended option because it grades high in infrared transmission. However, if the cover is too thick, the thermal sensor’s ability to sense heat decreases.
Furthermore into the project, I also took part in the technical lecture that was required by the team where I got to research in-depth knowledge about ultrasonic sensors and the applications across various industries. This also helped in our choice of transducer for our ultrasonic sensor. I found out that transducer’s ability to transduce depends on its crystalline.
50
Charlie Nguyen – Webmaster
Charlie Nguyen is the lead circuit design and lead software developer.
Charlie researched different types of sensors that could be used to detect human presence: including ultrasonic, thermal camera, thermal sensors, image processing (photo camera), passive infrared, and distance measuring system. Ultimately, a pixel arrayed thermal sensor, the Omron D6T, was chosen for human detection due to its accuracy and simple imaging system. It was also a very good candidate for adjusting and changing the crane safety angle. Even though the thermal sensor is good at detecting human presence, it wasn’t good at detecting the crane’s load. He worked with Richard to research and choose a viable ultrasonic proximity sensor.
Once the sensors were chosen, Charlie built the first conceptual high level design. To achieve this, the project constraints had to be recognized. With the constraints, Charlie was able to pick the Arduino controller, an alarm system,an SD card for data writing, and drew the first conceptual design.
Charlie was able to determine one main objective of the project: creating a cone of safety around the load. By using the pixels like a map contour, a cone can be created through software algorithms by choosing specific pixels for processing. By combining the thermal sensor with a proximity sensor, the distance to the load can be measured and the cone’s angle can be adjusted accordingly.
Using this information, Charlie researched how to send and receive data from the sensor. Then, he created the software to read and display the temperature pixels on a screen while Richard researched how to code the proximity sensor with the Arduino. After those two algorithms were created, Charlie combined the code to create an elementary design of the project. An alpha prototype that can measure temperature and distance.
Assignments were also given to use the Arduino to control an SD card reader and set an alarm to notify the operator. Though not originally the lead, he took over the design of the alarm system and helped Xue with data recording. He designed a preliminary circuit to amplify
51
the signal to the speaker and also helped Xue get the SD card code to combine with the main body.
Soon after, the first real working prototype was achieved: measuring distance, turning on the temperature sensor when the load is a certain distance, and alerting the alarm when a human presence is detected. He helped with input for box design with Richard and Samuel by suggesting how a 3D printed box can be effective and how a demo design to showcase everything can be achieved.
After that, Charlie implemented a graphical output onto an operating system by using the “Processing” software. The design outputted a traditional box pixel array, distance information, and device parameters. With that information, he was able to test for input and output relationships: the max , average, and swing vs distance and relative temperature. Using that data, he was able to build an algorithm that can differentiate between static, human, and moving objects.
Once that was completed, Charlie implemented the last constraint: to change the angle of the cone in relationship to the distance of the load.
Finally, Charlie helped Richard with constructing the demo crane replicator that can showcases the project.
52
Richard Szink – Project Management
Richard Szink was the lead on research and design of sensing how far the crane’s load is from the ground. This portion of the overall design is critical to satisfying the given scope of the project. The design specifications call for the “cone of safety” to only be created when the crane’s load is a certain distance away from the ground, guaranteeing that the radius of the created cone is not infinitely large as the crane’s load is suspended higher and higher into the air. Once the load is within the predetermined distance from the ground, the cone of safety, alarm system, and data logging systems should power on.
The sensing was done by implementing a commonly used ultrasonic distance sensor (model HC-SR04). The sensor is controlled by code written by Richard for the Arduino board. The sensor’s trigger pin is told to ping a waveform and then the echo pin waits for the result. This data is saved in microseconds and can be converted to distance using a formula. The rest of Richard’s code output’s Boolean values to other functions to allow them to run when the load is at a distance where the system needs to be active.
Although not originally the lead, Richard took over the design of the overall design system’s housing. This first included implementing all individual circuits and components into one large circuit, doing calculations on power and current, and then finding a power supply appropriate. The power supply needed to provide 9VDC and 5VDC and at least 1A to power every component without worry of failure. Once the integrated circuit was designed and tested, a housing for the devices was necessary to keep the system free from the debris and dust in the industrial environment it is designed for.
Richard, with the help of a mechanical engineering student, 3D modeled a housing to the correct dimensions of the mounting holes and sizes of the components. Pegs were designed to raise the components off the floor of the housing and small holes were added to help dissipate any heat. The housing was designed to be as compact and take up as little space as possible. Once the box was printed, Richard then used screws and nuts (with plastic covers for protection) to mount all components in the box. Once the components were mounted, Richard
53
soldered the integrated circuit together and ran appropriate power, amperage, and performance tests to guarantee a working circuit.
Lastly, Richard was tasked with building a scaled down model of a crane to show the performance of the overall system. Using PVC pipe and wood, a 7.5’ structure with tracks was built to simulate a crane. A box with wheels (crane’s cab) ran the track horizontally and a pulley system with rope connected to a load was used to simulate a cranes vertical movement. The housing was mounted on the bottom of the crane’s cab and moved horizontally with the crane. As the crane moved horizontally and vertically, the changes in the height and status of the system could be seen. If a human penetrated the cone of safety around the load, the system would alert the human.
54
Lanea Williamson - Lab Coordinator
Lanea supported researching the various things Team 5 could use to provide a cost efficient solution to our assigned project. After researching solutions it was decided Team 5 would use a microcontroller, alarm, proximity sensor, and thermal sensor to design our prototype. Next she supported in determine the most cost efficient way of purchasing things. The microcontroller would be essential in the design because the microcontroller would be the central point for the speaker, thermal sensor, and proximity sensor. She was responsible for building the alarm system that would be integrated with the proximity sensor and thermal sensor. Lanea spent most of the time researching and developing various alarm systems that could be used in our team design. She used an 8 Ohm 1.5W speaker in the design that was purchased. Unfortunately, the first design she used didn’t work properly due to the speakers were clipping. The microcontroller Team 5 used only had a DC current of 40mA per Input Output pin. The design I was using didn’t provide enough resistance so I needed to change determine which proper resistor to use. I utilized knowledge acquired on Arduino devices to assemble a proper circuit that would cause the speaker work properly. I was able to find a code that would generate a sound through the speaker using the Arduino Leonardo microcontroller. Due to finding a similar code it made the coding part less difficult than intended and I only was required to make small amount of modifications.
The next role I played was assisting in testing the proximity sensor and the thermal sensor. Team 5 needed to determine the tolerance level of the proximity sensor by using different objects and individuals moving. Once the proximity was determined to be working properly and the tolerance level was determined, I assisted in testing the thermal sensor in detecting humans up until a specific distance based on the reading of the proximity sensor. I also assisted in converting data into graphical features.
55
Appendix 2 - Literature and Website References"Northwest Indiana Steelworker Deaths." Nwitimes.com. The Times, 09 Jan. 2010. Web. 13 Oct. 2015.
"Crane Safety. General Design." (n.d.): n. pag. KoneCranes. konecranes.com.
Usage of D6T Thermal Sensor. Omron. Data Sheet. 2014.https://www.components.omron.com/components/web/pdflib.nsf/0/305E545BDF3C5FD486257C3C005EF2D0/$file/D6T-01_ThermalIRSensor-Whitepaper.pdf
Ultrasonic Sensor HC-SR04 Distance measuring Module. Universal. Data Sheet.http://www.micropik.com/PDF/HCSR04.pdf
Arduino Mega ADK. Arduino. Data Sheet. 2015.https://www.arduino.cc/en/Main/ArduinoBoardMega2560
"Primary Metals." The Steel Making Industry. Primary Metals, n.d. Web. 13 Oct. 2015.
2035 8ohm 1.5W Small Thin Flat Speaker. FCE. Data Sheet. http://www.alibaba.com/product-detail/2035-8ohm-1-5w-small-thin_60189334597.html?spm=a2700.7724857.29.9.G7tTyT&s=p
Introducing the Raspberry Pi 2 - Model B. Adafruit Learning Systems. Data Sheet. 2015https://learn.adafruit.com/downloads/pdf/introducing-the-raspberry-pi-2-model-b.pdf
Source Code//Integrating D6T with Arduino//Charlie Nguyen - 10/27/2015//Check 1.1 and 1.0 for previous problems//Refer to 1.2 for pretty displays and such for debugging.//1.5 - Revising code to be neater from 1.4//1.6 - Revising code from 1.3 - After the bug// Works with static objects now// First great code//1.7 - Implemented Dynamic Range with Angle// Note, since all the code to turn on alarm is based on // Temperature Max and Temperature Average, by updating // them through the two modes, it can be implemented simpler//1.8 - Added SD card feature
//I2C Library#include <Wire.h>#include <NewPing.h>#include <SD.h> //this includes the SD card libary that comes with the Arduino#include <SPI.h>
//SD Card Variables#define chipSelect 53volatile byte sensorFlag;//this flag is used to communicate to the main loop that a new value was read.
//Thermal Sensor Variables---------------------------------#define D6T_ID 0x0A //Id address for the D6T#define D6T_CMD 0x4C //Command to get information//Determines if temperature is using all pixels or just inside//Default = 0 which is full and 1 = insideint tempMode = 0;//The D6T will return 35 bytes of data to be processed//These vars will store themint ReadBuffer[35]; //D6T Bufferfloat ptat; // reference temperature (inside sensor)float tdata[16]; // temporary temperature data for 16 pixels (4x4)int thermalFullModeDistance = 2;int thermalHalfModeDistance = 3;//float tpec; // packet error check ( may implement in future)float temperatureAverage;float temperatureMax;float lastTemperatureMax;int tempThres = 1.5;float swingThres = 0.5;float staticTemp = 0; //holds temperature to campare when to switch timer
59
//Proximity Sensor Variables-------------------------------#define TRIGGER_PIN 12 // Arduino pin tied to trigger pin on the ultrasonic sensor#define ECHO_PIN 11 // Arduino pin tied to echo pin on the ultrasonic sensor#define MAX_DISTANCE 600 // Maximum distance we want to ping for (in cm)boolean thermalsensor = 10; // Arduino pin tied to thermalsensorbyte twi_addr = 0x50 >> 1; // I2C device address of lcdfloat ftConvert;float distanceThres = 0.01;
NewPing sonar(TRIGGER_PIN, ECHO_PIN, MAX_DISTANCE); // Turn on sonar through NewPing library and set for Trigger, Echo, and Distance
void setup() { //Sets the led to output to test alarm pinMode(ledPin, OUTPUT); //Initiallize the I2C ports Wire.begin(); Serial.begin(9600); delay(500);
//Initiallize SD Reader pinMode(chipSelect, OUTPUT);//set chip select PIN as output. If you use another pin, apparently #10 needs to be an output anyway to be able to use the SD.h library. if (debugMode == 2) { if (!SD.begin(chipSelect)) { // see if the card is present and can be initialized: Serial.println("Card failed, or not present"); return;//exit the setup function. This quits the setup() and the program counter jumps to the loop(). } else { Serial.println("card initialized.");//otherwise, tell us that the card was successfully initialized. }
}
60
//Initiallize Sonar NewPing sonar(TRIGGER_PIN, ECHO_PIN, MAX_DISTANCE); // Turn on sonar through NewPing library and set for Trigger, Echo, and Distance delay(2000);
}
//Turns on the alarm when this is activated//void activateAlarm(String state){ if(state == "on") { //NewTone(speakerPin,262); writeToCSV(); digitalWrite(ledPin, HIGH); } else if(state == "off") { //noNewTone(speakerPin); digitalWrite(ledPin, LOW); } }
/* Requests temperature data and loads buffers */void requestTemperatureData(){ int i; //Asking for data from D6T Wire.beginTransmission(D6T_ID); Wire.write(D6T_CMD); Wire.endTransmission(); //Getting data and processing it Wire.requestFrom(D6T_ID,35); //Putting the data into memory//buffer for (i=0; i<35; i++) { ReadBuffer[i] = Wire.read(); }}
/*takes data from buffer and processes into celcius and puts into the tdata variable*/void processRawTemperatureToCelsius(){ int i = 0; //Processing the data into Celcius //Byte 0-1 = Reference Temp //Byte 2-33 = Temperature Data //Byte 34 = Packet Check Error ptat = (ReadBuffer[0]+(ReadBuffer[1]*256))*0.1; //Reference Temp //Temperature Data for(i=0 ; i<16 ; i++) { tdata[i] = (ReadBuffer[(i*2+2)]+(ReadBuffer[(i*2+3)]*256))*0.1; }
61
}
//Updates the temperature data tdata into farenheitvoid convertToF(){ int i; float tempF; float tempData[16]; for (i=0; i<16; i++) { tdata[i] = (tdata[i]*(9.0/5.0))+32.0; //tdata[i]= tempData[i]; } ptat = (ptat*9.0/5.0)+32.0; //tdata[16] = tempData;}
//Checks if data has databool hasData(float data){ if(data > 0) { return true; } else { return false; }}
//Updates the max temperaturevoid updateMaxTemperature(){ int i; temperatureMax = 0; //Checks wheather to use all temp pixels if (tempMode == 0) { for (i=0; i<16; i++) { if(tdata[i] > temperatureMax) { temperatureMax = tdata[i]; } } } else if(tempMode == 1) { temperatureMax = tdata[5]; if(tdata[6]>temperatureMax) temperatureMax = tdata[6]; if(tdata[9]>temperatureMax) temperatureMax = tdata[9]; if(tdata[10]>temperatureMax) temperatureMax = tdata[10]; }
}
//Updates the average temperature
62
void updateTemperatureAverage(){ int i; temperatureAverage = 0;
//Checks whether to use all temperature pixels if (tempMode == 0) { for (i=0; i<16; i++) { temperatureAverage += tdata[i]; } temperatureAverage = temperatureAverage/16; } else if(tempMode == 1) { temperatureAverage = tdata[5]+tdata[6]+tdata[9]+tdata[10]; temperatureAverage = temperatureAverage/4; }
//Outputs the data into the serial linevoid outputData(){ int i; for (i=0; i<16; i++) {
//This will send the information to Serial where //it will be processed inside "Processing" Serial.print(tdata[i]); Serial.print(','); } //Breaks line for data to be processed Serial.print((ptat*9.0/5.0)+32.0); Serial.print(','); Serial.println();}
//Writes data to CSVvoid writeToCSV(){ sensorFlag = 0; File dataFile = SD.open("datalog.csv", FILE_WRITE); if (SD.exists("datalog.csv"))//if the datalog.csv file is already on the disk { if (debugMode == 2) { Serial.println("datalog.csv exists, appending data"); }
//Writing Initial Data if (dataFile) { if (debugMode == 2) { Serial.println("dataFile successfully opened, writing initial data"); } dataFile.print("Time"); dataFile.print(","); dataFile.print("AverageTemperature"); dataFile.print(","); dataFile.print("MaxTemperature"); dataFile.print(","); dataFile.println("LoadDistance"); } }
if (dataFile) { if (debugMode == 2) { Serial.println("dataFile successfully opened, appending data points"); } dataFile.print(String(millis())); dataFile.print(","); dataFile.print(String(temperatureAverage)); dataFile.print(","); dataFile.print(String(temperatureMax)); dataFile.print(","); dataFile.println(String(ftConvert)); dataFile.close(); }
}
//Turns on the thermalsensor void activateThermalSensor(){ requestTemperatureData(); processRawTemperatureToCelsius(); convertToF();
//Print Reference Temp in Farenheit if ( hasData(tdata[0]) ) //Checks if there is data { //Resets the average and max data too update it later temperatureAverage = 0;
if (debugMode == 1){ Serial.print("Average Temp : "); Serial.println(temperatureAverage); Serial.print("Max Temperature :"); Serial.println(temperatureMax); Serial.print("Last temperature :"); Serial.println(lastTemperatureMax); Serial.print("Temperature Swing :"); Serial.println(temperatureMax-lastTemperatureMax); }
//Calculations for algorithm //timer is off, waiting to threshold before turning on if(timerOn == false) { //alarm if temperature max is above the temperature average+Threshold if(temperatureMax > temperatureAverage+tempThres) { if (debugMode == 1) { //Sets the alarm and starts timer Serial.println("Flagged, turning on timer, turning on alarm"); }
activateAlarm("on"); timerOn = true; startTime = millis(); } else { activateAlarm("off"); if (debugMode == 1){ Serial.println("Idle, alarm is off.");} } } //Timer is on, using static object detecting algorithm else if(timerOn == true) {
currentTime = abs(millis() - startTime);
if (debugMode == 1) { Serial.print("Time elasped: "); Serial.println(currentTime); } //Temperature is below average, turn everything off if(temperatureMax < (temperatureAverage + tempThres)) { if (debugMode == 1)
//Checks whether or not there is a big swing in temperature //Human Presence is detected if(abs(temperatureMax - lastTemperatureMax) > swingThres) { if (debugMode == 1) { Serial.println("Temperature Swing Detected, resetting timer"); } activateAlarm("on"); timerOn = false; } //No big swing of max temperature //Possible static or human else { //Over the time limit, turn alarm off //Static Object because it hasn't moved
if(currentTime>maxTime) { if (debugMode == 1) { Serial.println("Time limit reached. Static Object. Alarm Off."); } activateAlarm("off"); } //Don't know if its static yet //leave alarm on until time limit is reached else if(currentTime<maxTime) { if (debugMode == 1) { Serial.println("Time limit not reached. Deciding human or static. Alarm On."); } activateAlarm("on"); }
}
} updateLastMaxTemperature(temperatureMax); }}
//Turns on the Proximity Sensorvoid activateProximitySensor(){ delay(100); // Wait ()ms between pings unsigned int uS = sonar.ping(); // Send and get ping time in microseconds (uS)
66
ftConvert = (uS / US_ROUNDTRIP_CM)*0.0328084;
//output data only when there is data if(ftConvert > distanceThres){ Serial.print("P, "); // Print P for processing
Serial.print(ftConvert); // Convert ping time to distance in cm and then feet
//activate and deactivate thermal depending on distance //Turning on full mode if ( (ftConvert >= thermalFullModeDistance)&&(ftConvert <= thermalHalfModeDistance)) { tempMode = 0; thermalsensor = true; // Boolean thermal sensor is true Serial.println(", 1");//Serial.println("thermalsensor is on"); // Print thermal sensor is on