+ All Categories
Home > Documents > dspace.brunel.ac.ukdspace.brunel.ac.uk/bitstream/2438/11691/1/Fulltext.docx  · Web viewIn their...

dspace.brunel.ac.ukdspace.brunel.ac.uk/bitstream/2438/11691/1/Fulltext.docx  · Web viewIn their...

Date post: 06-Feb-2018
Category:
Upload: doanthuan
View: 213 times
Download: 0 times
Share this document with a friend
42
Genome wide classification and characterisation of CpG sites in cancer and normal cells. Mohammadmersad Ghorbani 1 , Michael Themis 2 and Annette Payne 1* 1 Department of Computer Science, 2 Department of Biosciences, Brunel University, Uxbridge, Middlesex, UB8 3PH, UK * To whom correspondence should be addressed. [email protected] Key words: motif, pattern identification, methylation in cancer, computational analysis, pattern searching algorithm, CpG, DNA sequence Abstract This study identifies common methylation patterns across different cancer types in an effort to identify common molecular events in diverse types of cancer cells and provides evidence for the sequence surrounding a CpG to influence its susceptibility to aberrant methylation. CpGs sites throughout the genome were divided into four classes: sites that either become hypo or hyper-methylated in a variety cancers using all the freely available microarray data (HypoCancer and HyperCancer classes) and those found in a constant hypo (Never methylated class) or hyper-methylated (Always methylated class) state in both normal and cancer cells. Our data shows that most CpG sites included in the HumanMethylation450K microarray remain unmethylated in normal and cancerous cells; however, certain sites in all the cancers investigated become specifically modified. More detailed analysis of the sites revealed that majority of those in the never methylated class were in CpG islands whereas those in the HyperCancer class
Transcript

Genome wide classification and characterisation of CpG sites in cancer and normal cells.

Mohammadmersad Ghorbani1, Michael Themis2 and Annette Payne1*

1 Department of Computer Science, 2 Department of Biosciences, Brunel University, Uxbridge, Middlesex, UB8 3PH, UK

* To whom correspondence should be addressed. [email protected]

Key words: motif, pattern identification, methylation in cancer, computational analysis, pattern searching algorithm, CpG, DNA sequence

Abstract

This study identifies common methylation patterns across different cancer types in

an effort to identify common molecular events in diverse types of cancer cells and

provides evidence for the sequence surrounding a CpG to influence its susceptibility

to aberrant methylation. CpGs sites throughout the genome were divided into four

classes: sites that either become hypo or hyper-methylated in a variety cancers

using all the freely available microarray data (HypoCancer and HyperCancer

classes) and those found in a constant hypo (Never methylated class) or hyper-

methylated (Always methylated class) state in both normal and cancer cells. Our

data shows that most CpG sites included in the HumanMethylation450K microarray

remain unmethylated in normal and cancerous cells; however, certain sites in all the

cancers investigated become specifically modified. More detailed analysis of the

sites revealed that majority of those in the never methylated class were in CpG

islands whereas those in the HyperCancer class were mostly associated with miRNA

coding regions. The sites in the Hypermethylated class are associated with genes

involved in initiating or maintaining the cancerous state, being enriched for

processes involved in apoptosis, and with transcription factors predicted to bind to

these genes linked to apoptosis and tumourgenesis (notably including E2F). Further

we show that more LINE elements are associated with the HypoCancer class and

more Alu repeats are associated with the HyperCancer class. Motifs that classify the

classes were identified to distinguish them based on the surrounding DNA sequence

alone, and for the identification of DNA sequences that could render sites more

prone to aberrant methylation in cancer cells. This provides evidence that the

sequence surrounding a CpG site has an influence on whether a site is hypo or

hyper methylated.

Author Summary

This study identifies common methylation patterns across different cancer types in

an effort to identify common molecular events in diverse types of cancer cells. In this

paper we describe our meta- analyses of all the CpG sites throughout the genome

from all the studies using the HumanMethylation450K microarray available of both

normal and cancer cells using computational and bioinformatics methods. We

believe that this work provides evidence that certain CpGs are more likely to be

aberrantly methylated than others. Also we have characterised the properties of the

CpGs that are and are not aberrantly methylated to suggest reasons why they

should be so. Our data shows that most of the CpG sites studied remain

unmethylated in normal and cancerous cells; however, certain sites in all the cancers

investigated become specifically modified. Motifs and features that classify the

classes were identified to distinguish them based on the surrounding DNA sequence

alone, and for the identification of DNA sequences and features that could render

sites more prone to aberrant methylation in cancer cells. This showed that the

sequence surrounding a CpG site could have an influence on whether a site is

aberrantly methylated in the oncogenic state and whether that aberrant methylation

is hypo or hyper methylated.

Introduction

DNA methylation involving the addition of methyl groups to CpG sequences is one of

the mechanisms used by the cells to control gene expression gene silencing being a

major biological consequence of DNA methylation. This phenomenon, known as

epigenetic control has been reported to be important to mammalian development, X

inactivation and genomic imprinting [1]. Epigenetic changes have been shown to

occur in both healthy cells, where it assists in regulating gene expression during

development, and diseased cells, where it is associated with aberrant gene

expression, most notably in oncogenesis [2]. Many studies have also shown that

differentially methylated CpG sites can act as a biomarkers in identifying disease and

specific CpG site methylation can be a signature for specific types of tumours [3],[4],

[5], [6], [7]. In tumour development global DNA hypomethylation is often followed by

hypermethylation at specific CpGs [8], [9], [10], [11], [12]. Closer inspection of these

studies and the fact that the cancer phenotype is associated with aberrant

expression of a significant number of the same genes e.g. TP53 and RB1, in

different cancer types, would suggest that there are common pathways and

molecular mechanisms that can be identified across the different types of cancer.

Further the differentially methylated CpGs could be informative in discovering

mechanisms leading to malignancy. Factors that influence CpG methylation include

chromatin accessibility, which have been shown to modulate methylation, DNASE1

footprinting, transcription factor levels and CTCF binding, where higher levels and

the act of binding protect DNA from methylation. [13], [14], [15], [16] [17].

Particular DNA motifs have been identified in previous studies that may be used to

predict the methylation status of DNA sequences in normal cells. Notably

methylation is more prevalent in regions of low CpG density, with regions of

intermediate density being most variably methylated [18]. Yamada and Satou [19]

employed machine learning methods, specifically support vector machine and

random forest methods, using previously reported methylation data, to analyse DNA

sequence features to predict methylation status. They revealed that frequencies of

sequences containing CG, CT or CA are different when they compared

unmethylated and methylated CpG islands. Ali and Seker [20] used an adapted K-

nearest neighbour classifier method to predict the methylation state on

chromosomes 6, 20 and 22 in various tissues. They identified four feature sub-sets

which showed that methylated CpG islands can be distinguished from unmethylated

CpG islands based on DNA sequence. Lastly Previti et al., [21] used a data mining in

the absence of supervised clustering to predict the methylation status of CpG islands

in different tissues. These studies showed that there are significant differences in the

sequences of CpG islands (CGIs) that predisposed them to methylation. Other

studies have identified that the density and spacing of CpGs, the histone code

(methylation of histone 3 at Lysine 4 (H3K4), CTCF protein binding and REST

protein binding can influence DNA methylation [22], [23], [24], [25], [26], [27], [28],

[29]. In their review of computational epigenetics called “Computational Epigenetics”,

Bock and Lengauer [18] highlighted the fact that, although it is clear that much work

has been done to document the epigenetic state of the genome (much of it reported

in the ENCODE project [17]), to date, work in the area of de novo DNA methylation

prediction is limited. One study however has shown that aberrant methylation has

been shown to be associated with mutations where methylation in the MGMT

promoter has been demonstrated to be closely associated with G:C to A:T mutations

[30].

Thus whilst studies have identified motifs associated with normal methylation

patterns few studies have attempted to search for motifs associated with aberrant

methylation using computational techniques, one study by Feltus et al., [31] used

Restriction Landmark Genome Scanning software to identify methylation resistant

and methylation prone motifs based on DNA sequence and another by Lu et al., [32]

has been carried out using word composition computation. Lastly Gorbani et al., [33]

have suggested that the sequence surrounding a CpG can be used to predict

aberrant methylation in trinucleotide repeat diseases using a pattern searching

algorithm. Their results suggest that the sequence surrounding a CpG can be used

to predict aberrant methylation. In another study by McCabe et al., [34] patterns were

identified using machine learning techniques and used for pattern matching where

DNA signatures and a co-occurrence with polycomb binding were found to predict

aberrant CpG methylation in cancer cells. The reason for recruitment of the de novo

DNA methyltransferases to specific genomic targets however remains largely

unknown. Dnmt3 and certain transcription factors have been shown to interact with

each other to target methylation Hervouet et al., 2009 [35] and recently it has been

reported that DNMT3L and the lysine methyltransferase G9a are required for the

initiation of proviral de novo DNA methylation [36], [37]. Lastly Rowe et al., [38] have

shown that ERV sequences are sufficient to direct rapid de novo methylation of a

flanked promoter in embryonic stem (ES) cells.

In this study we have used a pattern searching algorithm to identify motifs in the

DNA surrounding aberrantly methylated CpGs in the DNA of cancer cells from

multiple cancer types and tissues so as to investigate whether common patterns of

methylation across these different cancers can be identified. Previous studies have

concentrated on one cancer or tissue type. Further most former studies that

analysed surrounding DNA sequences are based on the sequences surrounding

CpG islands or two classes of islands, methylation prone and methylation resistant.

CpGs not associated with islands were not included [31]. With more data becoming

publicly available about the methylation status around single CpG sites not

associated with islands, it is now possible to investigate increasing numbers of sites

and more additional classes of DNA methylation. In this study, we examined the

DNA sequences surrounding CpG sites. We divided sites into four classes of DNA

methylation: sites that either become hypo or hyper-methylated in a variety cancers

(HypoCancer and HyperCancer classes) and those found in a constant hypo (Never

methylated class) or hyper-methylated (Always methylated class) state in both

normal and cancer cells. Thus we have divided the CpG sites into four classes:

1. Never methylated in either cancer or normal cells (class NM)

2. Always methylated class in cancer and normal cells (class AM),

3. Hypomethylated in normal and hypermethylated in cancer (class

HyperCancer)

4. Hypermethylated in normal and hypomethylated in cancer (class

HypoCancer).

Then we investigated the DNA sequence flanking these sites to find out if we

could find common sequences or motifs in each class. We have carried out this

work in an attempt to better understand a possible influence of DNA sequence on

aberrant methylation.

Objectives of this work

1. Identify four classes of CpG sites based on data from diverse cancer types

and normal tissue.

2. Identify methylation sites that could act as biomarkers.

3. Analyse the genes and DNA features associated with differentially methylated

CpG sites to identify any links with carcinogenesis.

4. To identify DNA motifs in the DNA sequence surrounding a CpG that could

render a CpG prone to aberrant methylation in cancer.

5. Using these motifs, suggest prediction criteria that could be used to identify

CpG sites that are differentially methylated in normal and cancer cells in silico.

Results

CpG sites and their classes

Using the method described 653 CpG sites were identified that could be divided into

the four classes according to their methylation status: 447 CpG sites in the Never

methylated class (class NM), 148 sites in the Always methylated class (class AM),

51 hypomethylated in normal and hypermethylated in cancer (class HyperCancer)

and 7 sites hypermethylated in normal and hypomethylated in cancer (class

HypoCancer). We mapped the positional relationship of the CpG sites to CpG

islands in the UCSC browser. 81 CpG sites were not in any positional relationship

with a CpG Island. Never methylated sites are predominantly within islands. Most of

the CpGs in the two classes of variably methylated sites have no relationship to any

CpG islands. Always methylated CpGs are spread among the different positional

relationships to UCSC CpG islands. These results are shown in figures 1 and 2.

MicroRNA results

The UCSC table browser was used in order to find out if methylation of these CpG

sites could interfere with the expression of microRNA coding regions since miRNAs

are suggested to interact with epigenetic machinery [39] and are important regulators

of gene expression that are aberrantly regulated in cancer through changes in

methylation [40]. The track “miR Sites High” in table “miRcode Predicted MicroRNA

Target Sites microRNA” was investigated. A total number of 241 of the CpG sites

were shown to overlap with microRNA coding sites. The results are depicted in figure

3. 148 NM class sites overlap (33%), 68 AM class sites (46%), 25 Class

HyperCancer (49%) and 0 Class HypoCancer.

Sixty four of these hits are to unique microRNAs to a class (provided as

supplementary file Table 2).17 are unique to NM class sites, 4 microRNA are unique

to normal_hypomethylated and cancer hypermethylated (HyperCancer), 7 are

unique to AM class sites. Table 2 shows the unique microRNA sites and figure 4

shows the distribution of microRNAs species between the 3 classes they were

identified in.

Genes neighbouring the CpGs in Class HyperCancer

The genes neighbouring the CpGs found in Class HyperCancer are listed in table 3

along with their function as identified by Cormine software

http://www.coremine.com/medical/. This shows that the vast majority have some link

with cancer or tumourgenesis.

On manual, DAVID and IPA (http://www.ingenuity.com/products/ipa) software

functional clustering analysis [41, 42] the most enriched gene cluster was found to

be one with a functional key word of “Apoptosis” indicating that a large proportion of

these genes are involved or predicted to be involved in apoptosis.

DNA binding protein sites near these genes

The genes listed in Table 3 above were analysed for their predicted DNA binding

protein sites including 5Kbp up and down stream of their coding regions using

oPossium transcription factor binding analysis software

(http://opossum.cisreg.ca/oPOSSUM3/) which looks for and reports DNA protein

binding motifs in gene sequences using their consensus binding sites. The most

enriched predicted binding site according to oPossum [43] was for MZF1_1-4, a zinc

finger transcription factor (TF) which is suspected as one regulator of transcriptional

events during hemopoietic development and has been implicated in upregulating

apoptosis by interacting with LDOC1 and enhancing the activity of LDOC1 for

inducing apoptosis [44], thus if methylation in cancer prevents its binding this could

affect the cells ability to enter apoptosis. MZF-1 has also been show to supress

tumourgenicity [45].

The second most enriched, KLF4, contributes to the down-regulation of p53/TP53

transcription [46], which is important in tumorigenesis.

These genes are also enriched for the E2F family of transcription factors as

assessed by oPossum software; 19 of the genes are predicted to bind (equivalent to

55.88%) this compares to 32.77% of all genes in the human genome.

Genes neighbouring the CpGs in Class HypoCancer

The genes neighbouring the CpGs found in Class HypoCancer are listed in table 4

along with their function as described by Cormine software

http://www.coremine.com/medical/.

When analysed for transcription factor binding NOS1AP was the protein which had

the most TF motifs associated with it and these include Sox2, RREB1, Evi1, NR3C1

with the highest z-score as determined by oPossum and notably E2F1. None of the

other genes in this list were predicted to bind E2F type transcription factors.

LINE and Alu repeats

Since methylation changes in cancers have been shown to be associated with

repetitive elements, particularly LINE elements and ALU repeats [47, 48], we

analysed 1000bp of the DNA surrounding the CpGs in class HyperCancer and

HypoCancer for the presence of LINE and ALU repeats using the UCSC [49]

Genome Browser. Using the “custom annotation tracks” feature and reporting we

were able to identify and count the number and position of these repeats. The results

show that proportionally more LINE elements are associated with class HypoCancer,

the hypomethylated group of CpGs and more Alu repeats are associated with class

HyperCancer, the hypermethylated group of CpGs see Table 5.

Discovered motifs

We used MEME software [50] as described in the methods section to identify motifs

that distinguish the 4 classes of CpG sites. Table 6 shows the top 5 motifs, based on

p-value, which were found near the four classes of CpG site and their length and

sequences, as determined by MEME.

These motifs were then compared to known DNA binding protein motifs: The only

one of significance was the M3A motif which binds OCT1 which is methylated in

cisplatin resistant cells [51]. Interestingly STAT3 which is involved in cell division in

cancer cells is moderated by OCT1 [52].

Classification results

WEKA Analysis :

Using 10-fold cross validation methodology we used 3 algorithms to classify the CpG

sites according to their class, based on their motifs. 1) a support vector machine

algorithm resulted in 69.5253 % being correctly classified 2) a logistic algorithm

resulted in 73.9663 % 3) a J48 algorithm resulted in 71.2098 % correct prediction of

each CpG site into one of the 4 classes (NM, AM classes, Hypermethylated in

normal and Hypomethylated in cancer (classes C and A) or vice versa).

Since the CpGs that distinguish between normal and cancer calls are of particular

interest we performed a similar classification analysis using the Hypermethylated in

normal and Hypomethylated in cancer or vice versa only.

Using 10-fold cross validation methodology we used the 3 algorithms to classify the

distinguishing CpG sites according to their class based on their motifs. 1) a support

vector machine algorithm resulted in 98.2759 % correctly classified 2) a logistic

algorithm resulted in 96.5517 % 3) a J48 algorithm resulted in 94.8276 % prediction

of each of the 2 classes of CpG, Hypermethylated in normal and Hypomethylated in

cancer or vice versa.

Figure 5 illustrates that the m13C (TCCAAGGGACACC) motif doesn’t occur in the

flanking DNA sequences of 50 out of 51 of the CpGs identified in class HyperCancer

and occurs in all 7 of the sequences surrounding CpGs identified in class

HypoCancer. This motif therefore is the most discriminative motif using the J48

algorithm to classify the CpGs into the 2 classes.

Discussion

In this study we have shown that it is possible to divide the CpG sites in the human

genome into 4 classes based on the methylation status in normal and cancer cells

across many forms of cancer using multiple data sets: sites that are hypomethylated

in normal and hypermethylated in cancer (class HyperCancer), hypermethylated in

normal and hypomethylated in cancer cells (class HypoCancer), sites that are

always hypermethylated in both normal and cancer cells and sites that are always

hypomethylated in both normal and cancer. Interestingly, the results show that by far

the largest number of CpG sites are unmethylated in both the cancerous and normal

cell states and that those CpG sites that are differentially methylated in cancer cells

are methylated suggesting that the transition to the tumourgenetic phenotype

involves the methylation of particular CpG sites, which may be the cause of aberrant

gene expression found in cancer cells. We suggest further from these results that the

sites in former two classes may be useful biomarkers for cancer cells when

undertaking methylation analysis. The data used in this study was all that was

available at the time and we acknowledge that as more data becomes available,

most notably in the TCAG data base further work to validate these results will be

required, using new software customised to analyse the data in these files which is in

a different format to those in GEO. These results however represent a statistical

analysis of an unbiased large sampling of the publicly available data and therefore

suggest that our results will hold true for the whole population of data.

The sites in the four classes were analysed for their distinguishing characteristics

and properties. Firstly their position in relation to CpG islands was deduced. Sites

that are never methylated are predominantly within CpG islands and sites that are

aberrantly hyper or hypomethylated in cancer cells, are not, perhaps suggesting that

islands afford protection against global methylation changes in cancer cells.

The proximity to microRNA coding regions showed a greater percentage of the

HyperCancer CpGs class are associated with one or more miRNAs coding

sequences than any other class, with the HypoCancer class having none. Further,

the number of times a particular miRNA coding region is associated with a class of

CpG shows that never methylated CpGs had a greater number of microRNA sites

associated with them per site, with some particular microRNAs identified repeatedly

(up to 15 times). Several studies have provided evidence that disregulated miRNA

expression contributes to the initiation and progression of human cancers [53, 54,

55, 56, 40]. Hypermethylation of micro RNAs has been shown to be present in many

cancer types and could be the cause of this dysregulation. Thus it follows that the

presence of miRNAs near CpGs could contribute to the hypermethylation of these

CpGs in cancer cells.

The genes within 1Kb of the Hypocancer or Hypercancer classes of CpG sites that

show a distinction in methylation status were identified and functionally

characterised. This analysis showed that these sites are associated with genes that

are involved in initiating or maintaining the cancerous state of cells, with those

associated with class HyperCancer enriched for their involvement in apoptosis.

Further, the transcription factors predicted to bind the genes associated with class

HyperCancer are enriched for those linked to apoptosis and tumourgenisis (including

E2F) indicating a possible mechanism by which the aberrant methylation may exert

an effect. This strongly suggests that the differential methylation seen in these sites

influences functionally pathogenic processes seen in cancerous cells probably

instigated through aberrant gene expression.

LINE and Alu repeats associated with the differentially methylated classes were

identified and the results showed that proportionally more LINE elements are

associated with the HypoCancer class of CpGs and more Alu repeats are associated

with the HyperCancer class of CpGs. Could LINE elements therefore protect against

de novo methylation and Alu repeats render CpGs more susceptible? Interestingly

hypomethylation of LINE-1 and Alu have been suggested to be the cause of global

hypomethylation and genomic instability in many malignancies and autoimmune

diseases [57, 58, 59, 60, 61, 62, 63, 64, 65, 66, 67, 68, 69, 70, 71, 72] however not

all Alu sequences are hypomethylated in human cancers [73]. Alu sequences

located upstream of the CDKN2A promoter were found to be hypermethylated in

cancer cell lines [74], and an Alu sequence located in intron 6 of TP53 showed

extensive methylation in normal and cancer cells [74] and [75].

In order to see if the DNA sequence surrounding a CpG site has any influence on its

methylation state MEME software was used to identify distinguishing motifs for each

of the CpG classes and there similarity to known binding motifs for DNA binding

proteins was determined. Of the motifs identified only one had similarity of note,

which was the motif labelled M3A that showed similarity to the OCT1 motif, which

has an involvement in cell division via STAT3 [76].

We were able to classify the distinguishing motifs that were identified to enable the

classes to be distinguished based on DNA sequence alone and thus identify DNA

sequences that could render CpG sites more prone to aberrant methylation in cancer

cells. We were able to distinguish the 4 classes successfully with an accuracy of

74% and an attained an accuracy of 98% in distinguishing between sites that are

hypo and hyper methylated in cancer cells. Thus we have shown that the sequence

surrounding the CpG site has an influence on whether a site is aberrantly methylated

in the oncogenic state and whether that aberrant methylation is hypo or hyper

methylation. The motif that best distinguished the HyperCancer class from the

HypoCancer class was the m13C motif, which contains the binding motif for the

EBF1 and the RME transcription factors which have been shown to act as a tumour

suppressor in multiple tumour types notably leukaemia’s and colon cancer [77,78].

The NR2F1 binding motif is also present in m13C, another transcription factor with

oestrogen response element binding which is down regulated in many tumour types

[79]. Also NR4A2 which is a nuclear orphan receptor involved in neoplasms and a

potential therapy target binds to this sequence [80]. This suggests that this motif is

highly susceptible to hypo methylation in the cancer cells as it is seen predominantly

in the HypoCancer class and the demethylation of this motif may be linked to tumour

suppression functionality response in these cells.

Thus in summary, this study has shown that CpG sites in the human genome can be

divided into four classes depending on their methylation status in diverse normal and

cancer cell types. The two classes which show differential methylation in the normal

and cancerous state show associations with genes and DNA features that are

commensurate with the cancerous state. We show that only a distinct subset of CpG

sites may need to be analysed for their methylation status to determine the

cancerous state. In common with other more limited studies we have identified that

there are DNA motifs surrounding a CpG that render them susceptible to methylation

in the cancerous state. Further we show that CpG sites can be classified using the

DNA sequence surrounding them into one of the four classes, showing that the

methylation state of any given CpG can be predicted with a high degree of accuracy.

Methods

Datasets Selection

As stated, most previous studies were focused on CpG islands but with the advance

of technology there is now data available for single CpG sites not necessarily

associated with islands using microarray technology. A widely used platform is

HumanMethylation450k because of maximal coverage (in terms of number of CpGs

analysed in the genome per chip) and data from samples and tissue types available.

Here, we selected 16 data series to study cancer cells and respective normal

controls using raw data (signal Intensities from GEO in tabular format) available for

CpG sites contained in the HumanMethylation450K microarray (Table 1). We

included one set of data that investigated only normal samples to ensure the number

of normal data points to be nearer equal for normal and cancerous cells. The data

series used for this work are listed in Table 1. They represent all the publicly

available peer reviewed data sets obtainable at the time of undertaking the study.

The platform soft files were downloaded from GEO and converted to table format

with a custom filtering program (which merely filters out the data in the code of the

file from other code and reformats it into a table format) consisting of 16 data series

of 535 tissue samples of which 301 were from cancer samples and 234 were from

normal samples. These consisted of 259,783,695 data points representing the

methylation status of each particular CpG in a particular sample within a data set.

We selected these 16 data series so as to examine the methylation across all cancer

types possible and compare them with the wide variety of normal tissues. The data is

from multiple individuals which allowed us to find common patterns between

individuals as well as different cancer types. The individual samples selected for our

analysis from each data set were either untreated tumour or untreated normal

samples i.e. not all the samples from any one data set was included, only those

appropriate to this study. We wished to identify which CpGs are methylated as part

of the pathology common to all types of cancers in a variety of tissues in many

individuals. No data is included from cell lines or treated cells, and all are from either

normal tissue not adjacent to the tumour or cancerous cells from the patient thus the

difference in the methylation that we see is not due to cell culture conditioning or

neighbouring cell contamination. Additional matched control tissues from other

studies were also included so as to make the number of control data sets the same

as the number of cancerous ones which is important for our numerical based

analyses. The data series were tissue matched, cancer with the same tissue control

as far as possible with no one tissue type representing more than 40% of the

samples thus 60% common methylation state at any one CpG was chosen as the

threshold for the analyses to mitigate as far as possible any bias in tissue or cell type

(publicly available data in diverse normal tissue types due to ethical considerations

being the limiting factor). All the data sets were from experiments carried out using

the same platform. i.e. HumanMethylation450k so that differences are due to the

sample and not to the platform used.

CpG sites identification

Samples from the datasets were stored in two files, which were read by a Java

program to identify CpG sites with specific defined criteria. Each of the files was read

line by line to produce vectors of beta values. Any vectors which satisfy the following

criteria were selected for further analysis: CpG sites for which all the samples’ beta

values were more than 0.8 were defined as Hypermethylated CpG sites and sites

which had beta values of less than 0.2 were defined as Hypomethylated as

described in [81] for variably methylated sites. In order to identify four classes of

CpG sites, four classes were defined:

1. Class HyperCancer were sites which are hypermethylated in 60% of cancer

samples and hypomethylated in 60% of normal samples

2. Class HypoCancer were sites which are hypomethylated in 60% of cancer

samples and 60% hypermethylated in normal samples

3. Class AM were sites that are always hypermethylated (where 99% percent of

the samples have beta-values more than 0.8) in both normal and cancer cells

4. Class NM were sites that are never methylated (where 99% of samples have

a beta-value less than 0.1) in both normal and cancer cells.

CpG sites in each class with more than 50% overlap were removed.

Motif Discovery

The MEME (Multiple EM for Motif Elicitation) software suite (http://meme.nbcr.net)

was used motifs discovery. We used default MEME settings with ZOOPS (zero or

one motif per sequence) parameter, for discovering motifs for each class of identified

CpG sites. Sixty bps of flanking sequence around each CpG site was used as input

for the MEME analysis for each class and five best motifs according to their E-value

as calculated in the MEME probability matrix were selected for further analysis with

custom designed Java program. 20 motifs (5 for each CpG class) were used as input

to the MAST tool to align these motifs against the 653 CpG DNA sequences in the

four classes. The MAST program removed 2 motifs which have more than 60%

overlap with others and so finally 18 motifs were selected by MAST used for further

analysis.

Using motifs for Classification

A Java program was developed to convert the MAST hit results to a feature matrix

and the results used in the Weka package (http://www.cs.waikato.ac.nz/~ml/weka/)

to evaluate the potential of using these motifs for classification of four classes of

CpG sites. Using three different machine learning methods and 10 fold cross

validation CpG sites were classified according to their motifs. The input matrix was

the CpG sites with their corresponding class, and the features are motifs which

appear in the flanking DNA. Similar methods have been used in previous studies [82,

83]. J48, logistic and support vector machines were used as a classification tools for

this purpose.

Acknowledgements

We acknowledge the support in kind of Brunel University and staff in the

Departments of Computer Science and Biosciences.

Figure Legends

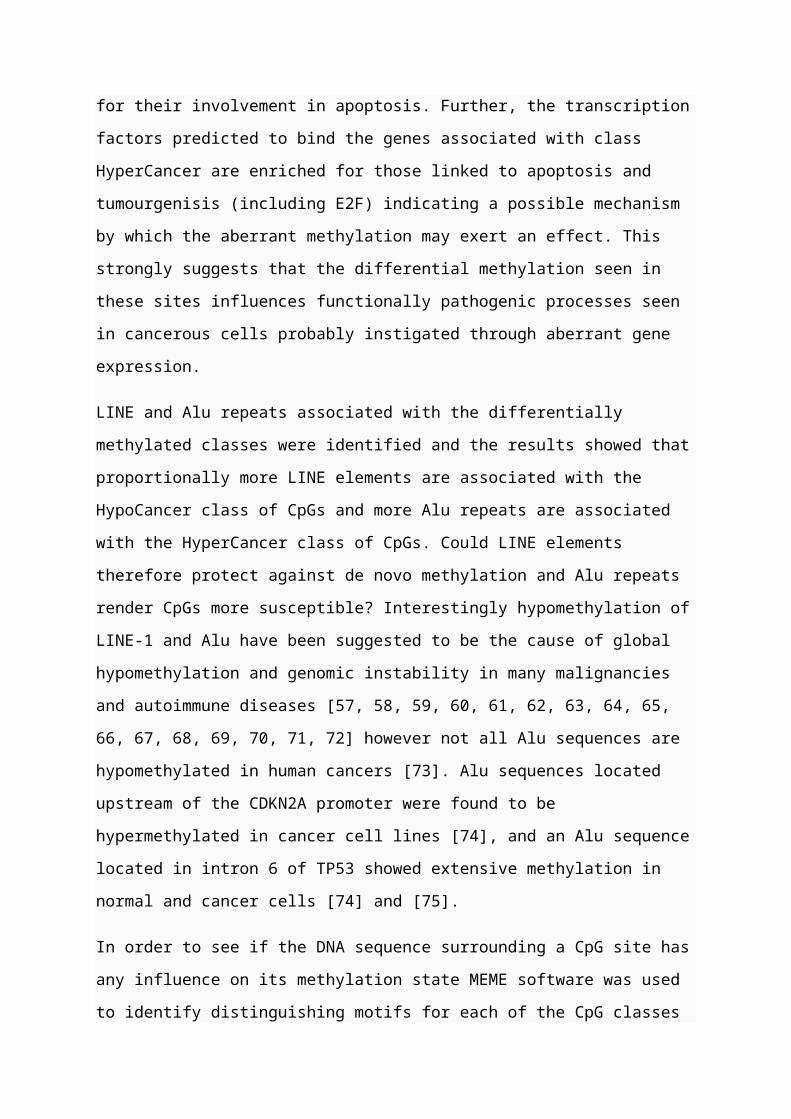
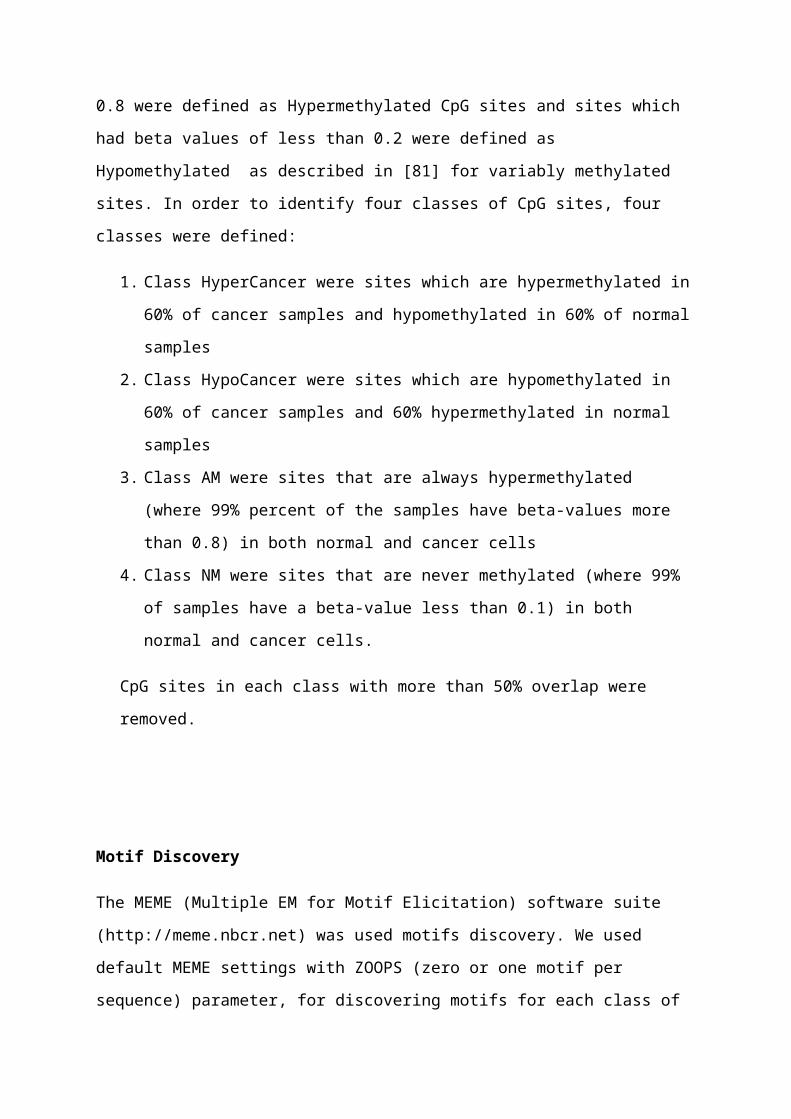
Figures 1 and 2 Graphs to show the number of CpG sites in each class and the positional relationships to CpG Islands. Figure 1 showing the number as a proportion of the total in each position relative to the CpG subdivided into classes. Figure 2 showing the number as a proportion of the total in each class, subdivided into positions relative to the CpG.

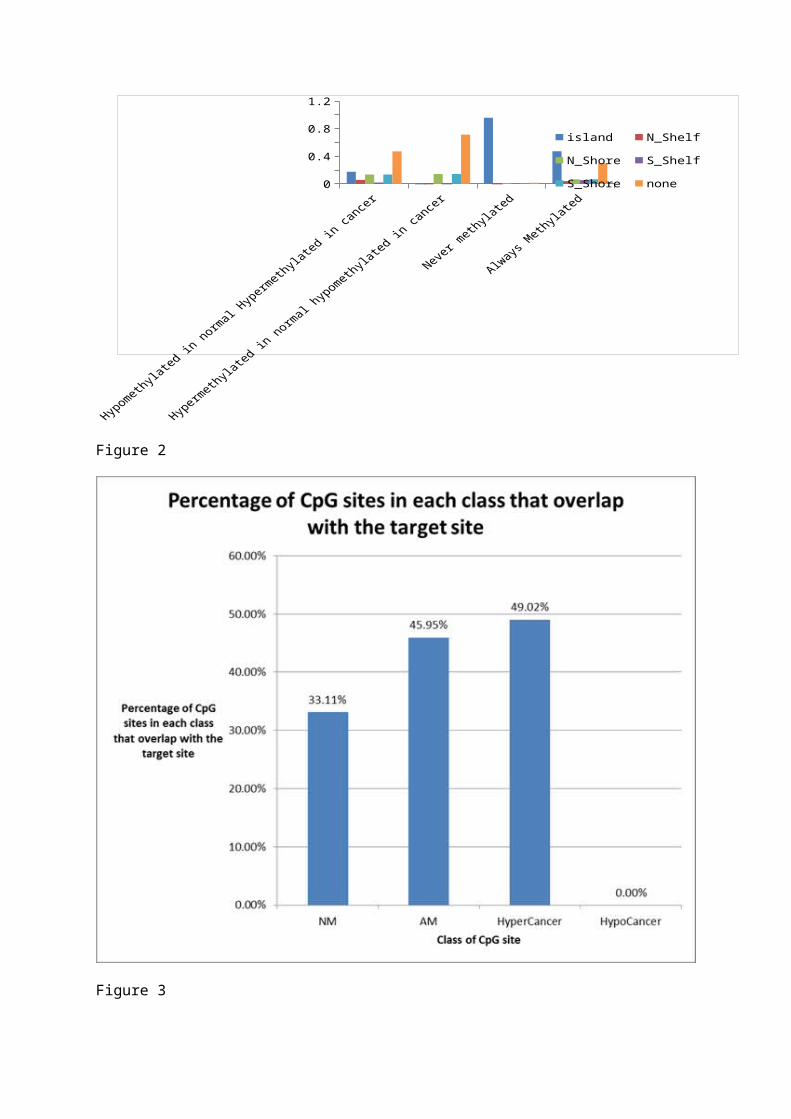
Figure 3 Graph to show the percentage of each class of CpG that are associated with a microRNA site.

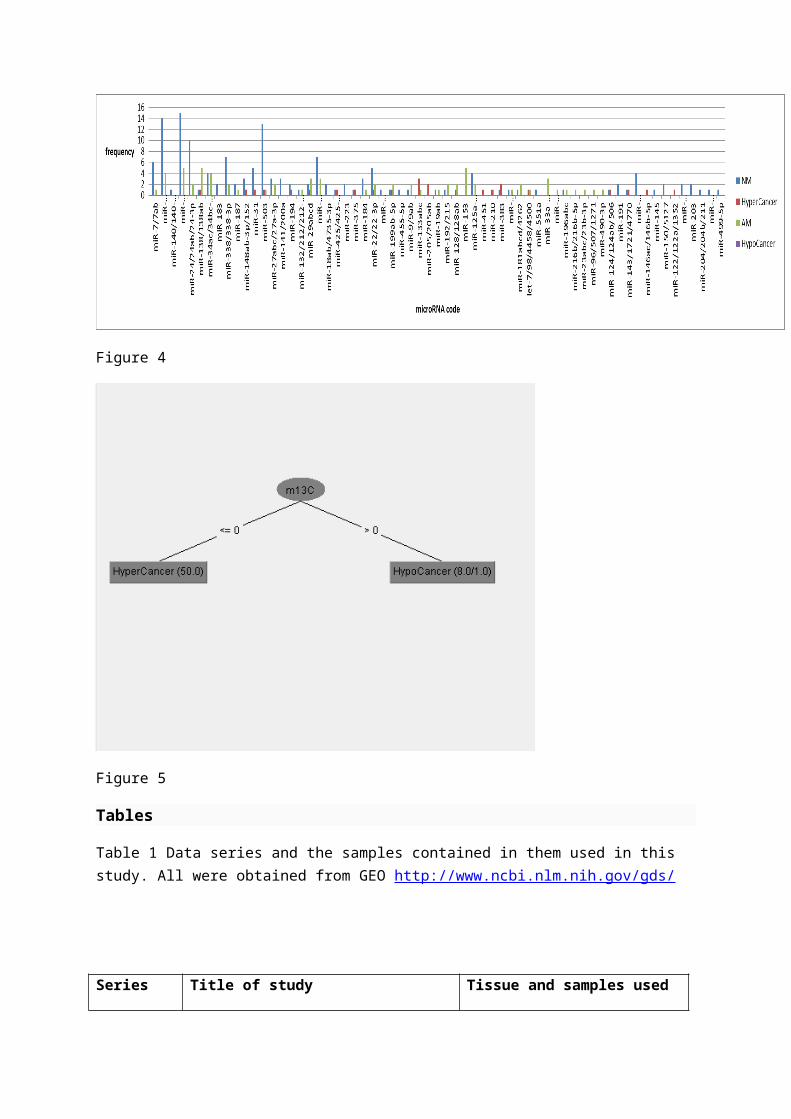
Figure 4 Graph to show the number of times a particular miRNA species coding sequence occurs in the DNA sequence in the different classes of CpGs identified in this study.

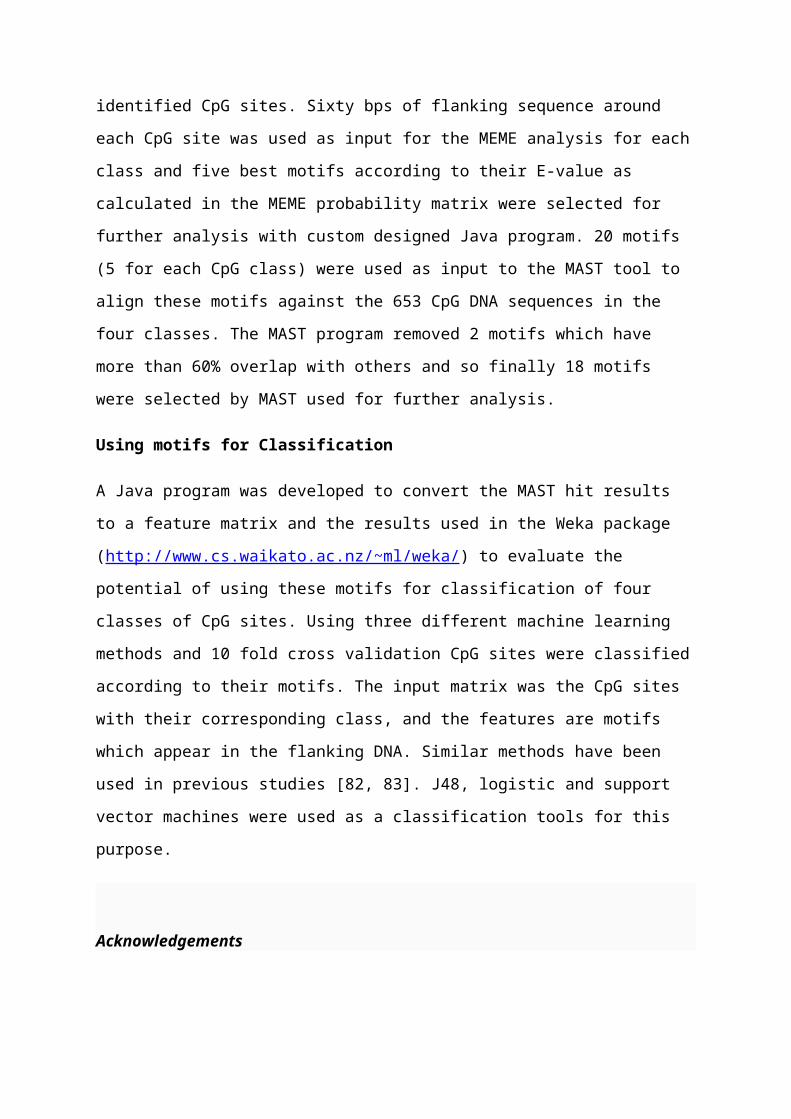
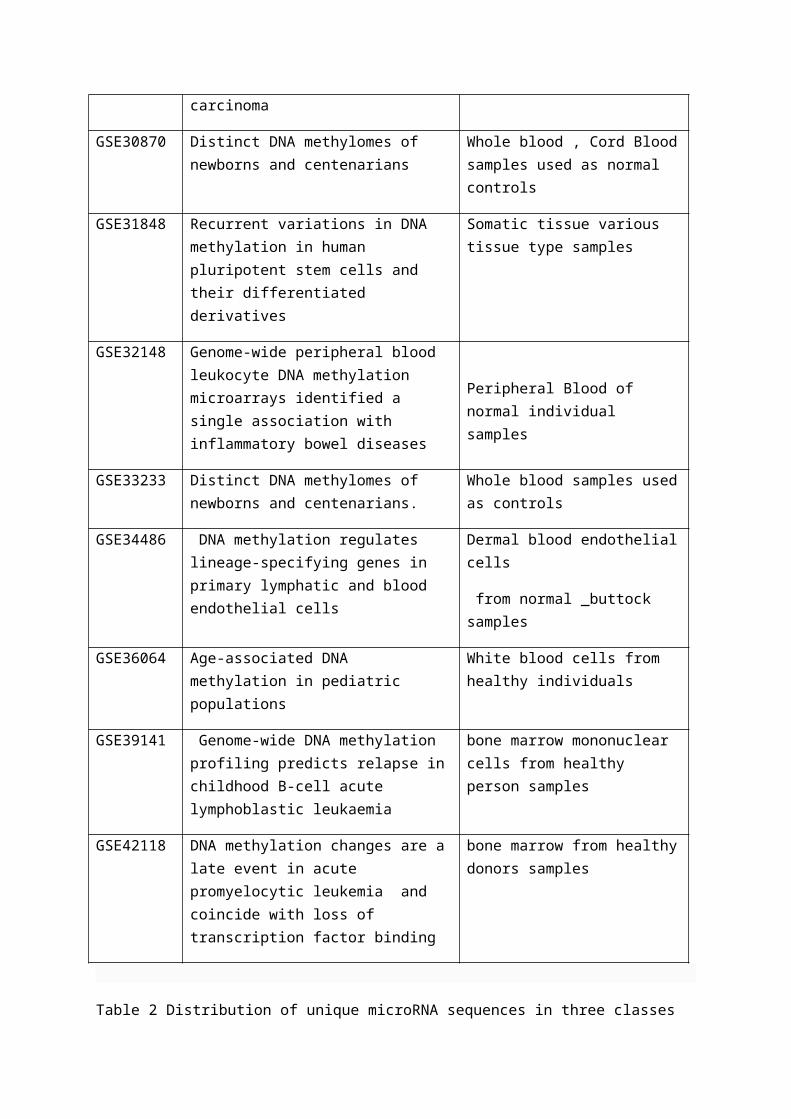
Figure 5 Weka result for the most discriminative motif using the J48 algorithm to classify the CpGs into the 2 classes.

island N_Shelf N_Shore S_Shelf S_Shore0

0.0005

0.001

0.0015

0.002

0.0025

0.003

0.0035

0.004

0.0045

Hypomethylated in normal Hypermethylated in cancer

Hypermethylated in normal hypomethylated in cancer

Never methylated

Always Methylated

Figure 1

00.20.40.60.8

11.2

island N_Shelf N_Shore

S_Shelf S_Shore none

Figure 2

Figure 3

Figure 4

Figure 5

Tables

Table 1 Data series and the samples contained in them used in this study. All were obtained from GEO http://www.ncbi.nlm.nih.gov/gds/

Series Title of study Tissue and samples used

GSE20945 Transient low doses of DNA-demethylating agents exert durable antitumor effects on hematological and epithelial tumor cells

Primary leukaemia untreated samples

GSE29290 Evaluation of the Infinium Methylation 450K technology

Normal breast and breast cancer tumour samples

GSE30338  IDH1 mutation is sufficient to establish the glioma hypermethylator phenotype

Glioma tumour samples

making sure only the tumour samples were included

GSE36278 Hotspot mutations in H3F3A and IDH1 define distinct epigenetic and biological subgroups of glioblastoma

Primary glioblastoma and non-neoplastic brain samples

fine

GSE37965  DNA methylation profiling in breast cancer discordant identical twins identifies DOK7 as novel epigenetic biomarker.

Whole blood

this is whole blood from cancer patients and normals not the tumours

GSE38240  DNA methylation alterations exhibit intraindividual stability and interindividual heterogeneity in prostate cancer metastases

Lymph node Kidney Soft tissueLiver SubduralBone AdrenalProstate SpleenBladder LungBlood

metastasis samples

GSE38266,GSE38268

 Identification and functional validation of HPV-mediated hypermethylation in head and neck squamous cell carcinoma

HPV- HNSCC tumour samples

GSE30870 Distinct DNA methylomes of newborns and centenarians

Whole blood , Cord Blood samples used as normal controls

GSE31848 Recurrent variations in DNA methylation in human pluripotent stem cells and their differentiated derivatives

Somatic tissue various tissue type samples

GSE32148 Genome-wide peripheral blood leukocyte DNA methylation microarrays identified a single association with inflammatory bowel diseases

Peripheral Blood of normal individual samples

GSE33233 Distinct DNA methylomes of newborns and centenarians.

Whole blood samples used as controls

GSE34486  DNA methylation regulates lineage-specifying genes in primary lymphatic and blood endothelial cells

Dermal blood endothelial cells

from normal _buttock samples

GSE36064 Age-associated DNA methylation in pediatric populations

White blood cells from healthy individuals

GSE39141  Genome-wide DNA methylation profiling predicts relapse in childhood B-cell acute lymphoblastic leukaemia

bone marrow mononuclear cells from healthy person samples

GSE42118 DNA methylation changes are a late event in acute promyelocytic leukemia

bone marrow from healthy

and coincide with loss of transcription factor binding

donors samples

Table 2 Distribution of unique microRNA sequences in three classes

number RNAcode NM number RNAcode AM number RNAcode HyperCancer number RNAcode HypoCancer

1miR-193/193b/193a-3p 4 1 miR-153 5 1

miR-205/205ab 2

2 miR-141/200a 3 2miR-33a-3p/365/365-3p 3 2 miR-451 1

3 miR-183 2 3

miR-130ac/301ab/301b/301b-3p/454/721/4295/3666 1 3

miR-146ac/146b-5p 1

4 miR-18ab/4735-3p 2 4 miR-216b/216b-5p 1 4

miR-122/122a/1352 1

5 miR-223 2 5 miR-23abc/23b-3p 16 miR-191 2 6 miR-96/507/1271 17 miR-150/5127 2 7 miR-490-3p 1

8

miR-93/93a/105/106a/291a-3p/294/295/302abcde/372/373/428/519a/520be/520acd-3p/1378/1420ac 2

9 miR-203 2

10miR-140/140-5p/876-3p/1244 1

11 miR-26ab/1297/4465 112 miR-455-5p 113 miR-551a 114 miR-145 115 miR-204/204b/211 116 miR-208ab/208ab-3p 117 miR-499-5p 1

Table 3 The genes neighbouring the CpGs found in Class HyperCancer are listed along with their function as identified by Cormine software

UCSC_RefGene_Name Function Cancer InvolvementPPFIA1 Cell motility, apoptosis. invasion

suppressor gene, cell division and chromosome partitioning, cell motility,

Amplified breast and head and neck cancers (cell trying to avoid invasion)

EXD3 gene silencing activity None knownPTPRCAP Protein tyrosine phosphatase receptor,

apoptosisHypermethylated in many cancers. Implicated in tumorigenesis

LOC100129637 Unknown UnknownTMC6 DNA repair Variants seen in Cervical

CancerBIN2 endocytosis Abrogated in

Myeloproliferative neoplasmsC17orf101 oxidoreductase activity None known

MAP1D aminopeptidase activity, phosphorylation

Over expressed in colon cancer

SORBS2 cytoskeletal protein, cell migration, apoptosis

Downregulated in pancreatic, thyroid and cervical cancer

ELMO1 endocytosis, phagocytosis, apoptosis cell migration

Promote cell invasion in ovary, colon and brain cancer

ERI3 exonuclease activity, cell division, signal transduction, DNA replication

Increased in breast cancer

LAG3 regulation of leukocyte activation, cell proliferation, apoptosis

Involved in many different cancers assisting in detection avoidance and resistance to apoptosis

PLCB2 phospholipase C activity, calcium ion binding, signal transduction apoptosis

Highly expressed in Breast cancer promoting mitosis and migration of tumour cells

SPN regulation of inflammatory response to antigenic stimulus, induction of apoptosis by extracellular signals

Significantly expressed in lymphomas

PARP10 NAD+ ADP-ribosyltransferase activity, cell proliferation, apoptosis

Inhibits transformation of cells, in KEGG small cell lung cancer

MYO1G myosin complex, cell division, DNA hypermethylation

Involved in survival leukaemia and breast cancer cell

CD6 Cell Adhesion Molecule (CAM), apoptosis cell proliferation

Aberrantly expressed in leukemia

RAPGEF1 intracellular signaling cascade, small GTPase mediated signal transduction, cell proliferation, apoptosis

Upregulation in breast, lung, gastrointestinal and gynaecological cancers

NCKAP1L Regulation of actin cytoskeleton, cell proliferation apoptosis

Down regulated in many cancers

TRAF5 MAPK signaling pathway, Apoptosis, RIG-I-like receptor signaling pathway, Adipocytokine signaling pathway,

Expressed in lymphomas and small cell lung cancer

C3orf21 regulation of protein amino acid phosphorylation

None known

CA6 carbonate dehydratase activity, zinc ion binding, cell proliferation, apoptosis

Expressed in ovarian and breast cancers

CCDC88C regulation of protein amino acid phosphorylation, cell migration

Involved in tumour invasion

TNRC18 DNA binding, lipid transporter activity None knownANO8 chloride channel activity, embryo

developmentOver expressed in many cancers

PTPN7 protein tyrosine phosphatase activity, cell proliferation, apoptosis

Implicated in blood cancers

TBC1D16 regulation of Ras protein signal transduction, gene expression

Involved in melanoma progression

STK16 protein amino acid phosphorylation, cell growth, apoptosis

Over expressed in tumour cells

RFFL zinc ion binding, RING type, apoptosis, DNA methylation

Involved in myeloma

SPN negative regulation of adaptive immune response, positive regulation of cell death, apoptosis

Supressed in many tumours

PC transcription repressor activity Upregulated in many tumours (renal, small cell lung, sarcoma)

MIR365-1 Not known Not knownRADIL cell adhesion, forkhead and RAS

associatedNone Known

FBXL16 proteolysis, macromolecule catabolic process, cell proliferation, cell cycle

Down regulated in many cancers

LMNB2 lamin filament, cytoskeleton, cell cycle, methylation, apoptosis

Down regulated in prostate, gastric, skin and leukaemia cancers

JAK3 positive regulation of leukocyte activation, apoptosis, signal transduction, phosphorylation

Upregulated in many cancers

KCNJ8 ATP-activated inward rectifier potassium channel activity, vasodilation, apoptosis, gene expression

Upregulated in nasopharyngeal carcinoma

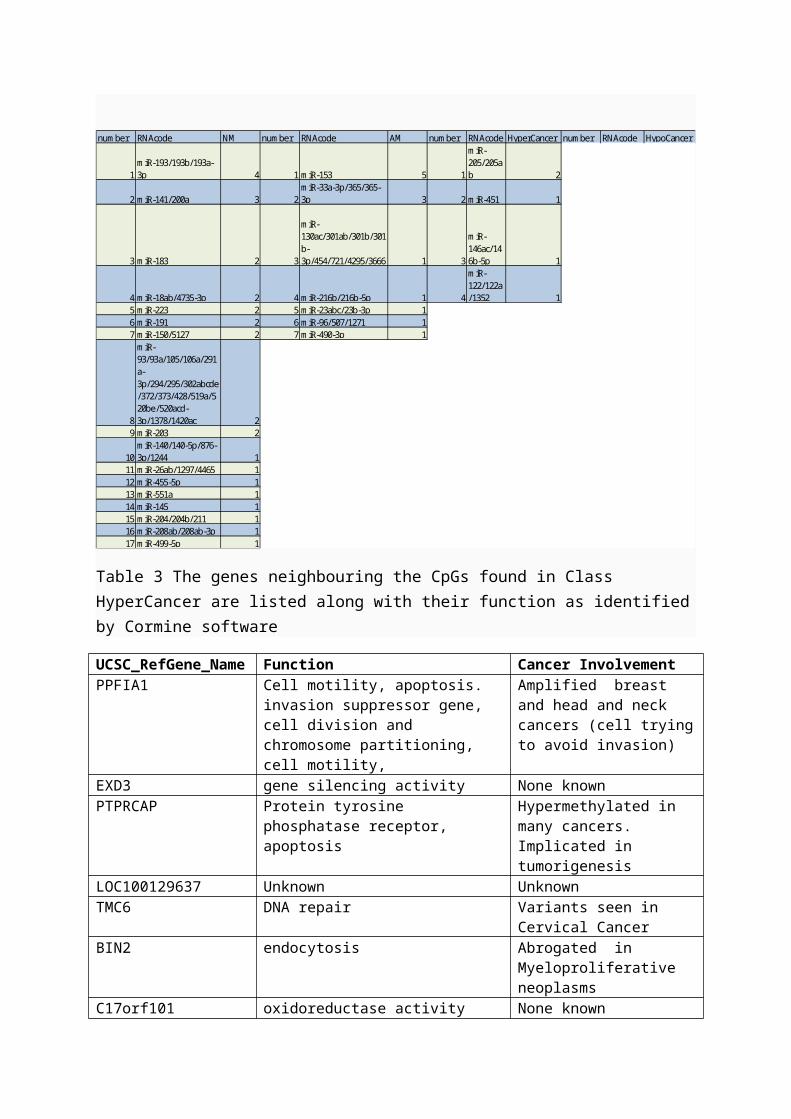
Table 4 The genes neighbouring the CpGs found in Class HypoCancer along with their function as described by Cormine software http://www.coremine.com/medical/.

UCSC RefGene Name Function Cancer InvolvementRPTOR Androgen receptor activity,

kinase activity, telomerase activity, kinase activity, cell growth, cell cycle, insulin signalling

Up regulated in multiple cancers

C22orf9 Not Known None KnownNOS1AP Signal transduction, gene

expression, cell migration, cell proliferation

Associated with breast cancer progression

RGS12 Signal transduction, cell cycle. RNA interference, apoptosis, SNAP receptor activity

Mutated in colorectal tumours

Table 5 The number and proportion of CpGs associated with LINE elements and Alu repeats.

Class No.CpGs in Class

Line Elements:Total in class(% of CpGs having one or more)

Alu repeats:Total in class(% of CpGs having one or more)

HyperCancer 52 26 (33%) 49 (44%)HypoCancer 7 12 (71%) 4 (29%)

Table 6 The top 5 motifs, based on p-value, which were found near the four classes of CpG site and their length and sequences, as determined by MEME.

id class Width proportion in the class motifm1A HyperCancer 11 0.652173913 AAGACAGGAAG

m2A HyperCancer 19 0.190751445 GGGGAGGGGGGGGCGGAGG

m3A HyperCancer 29 1 ATTATTGAGTATCACTTTGTATATCTTTT

m4A HyperCancer 11 0.578947368 CACACCGTCCT

m5A HyperCancer 15 0.333333333 AGCAGGAGAAGCAGG

m6AM AM 50 0.6875 TCCGCCCGCCTCGGCCTCCCAAAGTGCTGGGATTACAGGCGTGAGCCACC

m7AM AM 29 0.875 GCTTTTTAGAGACGGAGTCTCGCTCTGTT

m8AM AM 48 0.333333333 TGAGAGGCGCTTGCGGGCCAGCCGGAGTTCCCGGTGGGCATGGGCTTG

m9AM AM 41 0.405405405 GGTGACGAGGCGCGACAGGGTGACGAGGCGCGATTGGGTGA

m10AM AM 29 0.459459459 TGGGTGAGGAGGCGCGACTCGGTGATGAG

m11C HypoCancer 13 0.75 TTTAAATTCATTT

m12C HypoCancer 14 0.194444444 CTTCCAGGCTTGGT

m13C HypoCancer 13 0.666666667 TCCAAGGGACAGC

m14C HypoCancer 8 0.272727273 TGAGGAAT

m16NM NM 15 0.736842105 TTTCCTTTTTCTTGT

m17NM NM 15 0.95 AGTGCGCATGCGCAG

m19NM NM 10 0.952380952 CACTTCCGGT

m20NM NM 27 0.807692308 CGCGCGGCATGCCGGGACTTGTAGTTC

HyperCancer normal_hypomethylated_cancer_hypermethylatedHypoCancer normal_hypermethyl_cancer_hypomethylAM always methylatedNM never methylated

References

1. Bird, A.P. and Wolffe,A.P. (1999) Methylation-induced repression— belts, braces, and chromatin. Cell, 99: 451-454.

2. Baylin S.B. (2005) DNA methylation and gene silencing in cancer Nature Clinical Practice Oncology http://lists.bilkent.edu.tr/~science/MBG523/Lectures/Epigenetics%20articles/DNA%20Methy.%20and%20Gene%20silenc.%20in%20cancer.pdf accessed 21/02/2014.

3. Heyn, H., Carmona, F.J., Gomez, A., Ferreira, H.J., Bell, J.T., Sayols, S., Ward, K., Stefansson, O.A., Moran, S., Sandoval, J., Eyfjord, J.E., Spector, T.D. And Esteller, M. (2013) DNA methylation profiling in breast cancer discordant identical twins identifies DOK7 as novel epigenetic biomarker. Carcinogenesis, 34(1): 102-108.

4. Fukushige S, Horii A. (2013) DNA methylation in cancer: a gene silencing mechanism and the clinical potential of its biomarkers. Tohoku J Exp Med., 229(3):173-85.

5. Klose R.J. and Bird A.P. (2006) Genomic DNA methylation: The mark and its mediators. Trends Biochem. Sci. 31: 89-97.

6. Das PM and Singal R. (2004) DNA methylation and cancer. Journal of Clinical Oncology, 22: 4632-4642

7. Taberlay PC, PA Jones. (2011) DNA methylation and cancer Epigenetics and Disease, - Springer. http://www.springer.com/cda/content/document/cda_downloaddocument/9783764389888-c1.pdf?SGWID=0-0-45-1004851-p174022756 (accessed 17/02/14)

8. Shames, D. S., Girard, L., Gao, B., Sato, M., Lewis, C. M., et al. (2006) A genome-wide screen for promoter methylation in lung cancer identifies novel methylation markers for multiple malignancies. PLoS Medicine, 3: e486

9. Michaelson-Cohen R, Keshet I, Straussman R, Hecht M, Cedar H, Beller U. (2011) Genome-wide de novo methylation in epithelial ovarian cancer. Int J Gynecol Cancer. 21(2): 269-79.

10.Gama-Sosa,M.A., Slagel,V.A., Trewyn,R.W., Oxenhandler,R.,Kuo,K.C., Gehrke,C.W. and Ehrlich,M. (1983) The 5-methylcytosinecontent of DNA from human tumors. Nucleic Acids Res., 11: 6883–6894.

11.Feinberg,A.P. and Vogelstein,B. (1983) Hypomethylation distinguishes genes of some human cancers from their normal counterparts. Nature, 301: 89–92.

12.Feinberg, A.P., Gehrke,C.W., Kuo,K.C. and Ehrlich,M. (1988) Reducedgenomic 5-methylcytosine content in human colonic neoplasia. Cancer Res., 48: 1159–1161.

13.Cho,D.H., Thienes,C.P., Mahoney,S.E., Analau,E., Filippova,G.N. and Tapscott,S.J. (2005) Antisense transcription and heterochromatin at the DM1 CTG repeats are constrained by CTCF. Mol. Cell, 20: 483-489.

14.McKinnell,I.W., Ishibashi,J., Le Grand,F., Punch,V.G., Addicks,G.C., Greenblatt,J.F., Dilworth,F.J. and Rudnicki,M.A. (2008) Pax7 activates myogenic genes by recruitment of a histone methyltransferase complex. Nat. Cell Biol., 10: 77-84.

15.De Biase,I., Chutake,Y.K., Rindler,P.M. and Bidichandani,S.I. (2009) Epigenetic silencing in friedreich ataxia is associated with depletion of CTCF (CCCTC-binding factor) and antisense transcription. PLoS One, 4: e7914.

16.Gebhard C, Benner C, Ehrich M, Schwarzfische L (2010) General transcription factor binding at CpG islands in normal cells correlates with resistance to de novo DNA methylation in cancer cells. Cancer Res; 70(4): 1398–407.

17.An Integrated Encyclopedia of DNA Elements in the Human Genome The ENCODE Project Consortium. (2012) Nature doi: 10.1038/nature11247

18.Bock,C. and Lengauer,T. (2008) Computational epigenetics. Bioinformatics, 24: 1-10.

19.Yamada,Y. and Satou,K. (2008) Prediction of genomic methylation status on CpG islands using DNA sequence features. WSEAS Transactions on Biology and Biomedicine, 5: 153-162.

20.Ali,I. and Seker,H. (2010) A comparative study for characterisation and prediction of tissue-specific DNA methylation of CpG islands in chromosomes 6, 20 and 22. Conf. Proc. IEEE Eng. Med. Biol. Soc., 1832-1835.

21.Previti,C., Harari,O., Zwir,I. and del Val,C. (2009) Profile analysis and prediction of tissue-specific CpG island methylation classes. BMC Bioinformatics, 10: 116.

22.Glass JL1, Fazzari MJ, Ferguson-Smith AC, Greally JM. (2009) CG dinucleotide periodicities recognized by the Dnmt3a-Dnmt3L complex are distinctive at retroelements and imprinted domains. Mamm Genome. 20(9-10): 633-43.

23.Grewal, S.I.S. and Jia,S. (2007) Heterochromatin revisited. Nat. Rev. Genet., 8: 35-46.

24.Filippova,G.N., Thienes,C.P., Penn,B.H., Cho,D.H., Hu,Y.J., Moore,J.M., Klesert,T.R., Lobanenkov,V.V. and Tapscott,S.J. (2001) CTCF-binding sites flank CTG/CAG repeats and form a methylation-sensitive insulator at the DM1 locus. Nat. Genet., 28: 335-343.

25.Lienert F, Wirbelauer C, Som I, Dean A, Mohn F, Schübeler D. (2011) Identification of genetic elements that autonomously determine DNA methylation states. Nat Genet. 43(11):1091-7

26.Okitsu CY, Hsieh CL. (2007) DNA methylation dictates histone H3K4 methylation. Mol Cell Biol. 27(7):2746-57

27.Ooi SK, Qiu C, Bernstein E, Li K, Jia D, Yang Z, Erdjument-Bromage H, Tempst P, Lin SP, Allis CD, Cheng X, Bestor TH.: (2007) DNMT3L connects unmethylated lysine 4 of histone H3 to de novo methylation of DNA. Nature. 448(7154):714-7.

28.Stadler MB, Murr R, Burger L, Ivanek R, Lienert F, Schöler A, van Nimwegen E, Wirbelauer C, Oakeley EJ, Gaidatzis D, Tiwari VK, Schübeler D. (2011) DNA-binding factors shape the mouse methylome at distal regulatory regions. Nature. 480(7378):490-5.

29.Weber M, Hellmann I, Stadler MB, Ramos L, Pääbo S, Rebhan M, Schübeler D. (2007) Distribution, silencing potential and evolutionary impact of promoter DNA methylation in the human genome. Nat Genet. 39(4):457-66.

30.Yuan,G. (2011) Prediction of epigenetic target sites by using genomic DNA sequence. In Anonymous Handbook of Research on Computational and Systems Biology: Interdisciplinary Applications. IGI Global, pp. 187-201.

31.Feltus, F.A., Lee, E.K., Costello, J.F., Plass, C. And Vertino, P.M. (2006) DNA motifs associated with aberrant CpG island methylation. Genomics, 87(5): 572-579.

32.Lu,L., Lin,K., Qian,Z., Li,H., Cai,Y. and Li,Y. (2010) Predicting DNA methylation status using word composition. Journal of Biomedical Science and Engineering, 3: 672-676.

33.Ghorbani M, Taylor SJ, Pook MA, Payne A. (2013) Comparative (computational) analysis of the DNA methylation status of trinucleotide repeat expansion diseases. J Nucleic Acids.; 689798.

34.McCabe,M.T., Lee,E.K. and Vertino,P.M. (2009) A multifactorial signature of DNA sequence and polycomb binding predicts aberrant CpG island methylation. Cancer Res., 69: 282-291.

35.Hervouet,E., Vallette,F.M. and Cartron,P.F. (2009) Dnmt3/transcription factor interactions as crucial players in targeted DNA methylation. Epigenetics, 4: 487-499.

36.Leung DC, Dong KB, Maksakova IA, Goyal P, Appanah R, Lee S, Tachibana M, Shinkai Y, Lehnertz B, Mager DL, Rossi F, Lorincz MC. (2011) Lysine methyltransferase G9a is required for de novo DNA methylation and the establishment, but not the maintenance, of proviral silencing. Proc Natl Acad Sci U S A. 108(14):5718-23.

37.Ooi SK1, Wolf D, Hartung O, Agarwal S, Daley GQ, Goff SP, Bestor TH. (2010) Dynamic instability of genomic methylation patterns in pluripotent stem cells. Epigenetics Chromatin. 3(1):17.

38.Rowe HM, Friedli M, Offner S, Verp S, Mesnard D, Marquis J, Aktas T, Trono D. (2013) De novo DNA methylation of endogenous retroviruses is shaped by KRAB-ZFPs/KAP1 and ESET. Development. 140(3):519-29.

39. Iorio,M.V., Piovan,C. and Croce,C.M. (2010) Interplay between microRNAs and the epigenetic machinery: An intricate network. Biochimica Et Biophysica Acta (BBA) - Gene Regulatory Mechanisms, 1799, 694-701.

40.Vrba L, Muñoz-Rodríguez JL, Stampfer MR, Futscher BW. (2013) miRNA Gene Promoters Are Frequent Targets of Aberrant DNA Methylation in Human Breast Cancer. PLoS ONE 8(1): e54398.

41.Huang DW, Sherman BT, Lempicki RA. (2009a) Systematic and integrative analysis of large gene lists using DAVID Bioinformatics Resources. Nature Protoc.; 4(1):44-57.

42.Huang DW, Sherman BT, Lempicki RA. (2009b) Bioinformatics enrichment tools: paths toward the comprehensive functional analysis of large gene lists. Nucleic Acids Res.; 37(1):1-13.

43.Ho-Sui SJ, Mortimer J, Arenillas DJ, Brumm J, Walsh CJ, Kennedy BP and Wasserman WW. (2005) oPOSSUM: Identification of over-represented transcription factor binding sites in co-expressed genes. Nucleic Acids Res. 33(10):3154-64.

44. Inoue M1, Takahashi K, Niide O, Shibata M, Fukuzawa M, Ra C. (2005) LDOC1, a novel MZF-1-interacting protein, induces apoptosis. FEBS Lett. 579(3):604-8.

45.Hsieh YH, Wu TT, Huang CY, Hsieh YS, Liu JY. (2007) Suppression of tumorigenicity of human hepatocellular carcinoma cells by antisense

oligonucleotide MZF-1. Chin J Physiol. 50(1):9-1546.Rowland B D., Bernards R and Peeper D S. (2005) The KLF4 tumour

suppressor is a transcriptional repressor of p53 that acts as a context-dependent oncogene Nature Cell Biology 7: 1074 - 1082

47.Weisenberger D J., Campan M, Long T I., Kim M, Woods C. (2005) Analysis of repetitive element DNA methylation by MethyLight. Nucleic Acids Res. 33(21): 6823–6836

48.Walters RJ, Williamson EJ, English DR, Young JP, Rosty C, Clendenning M, Walsh MD, Parry S, Ahnen DJ, Baron JA, Win AK, Giles GG, Hopper JL, Jenkins MA, Buchanan DD. (2013) Association between hypermethylation of DNA repetitive elements in white blood cell DNA and early-onset colorectal cancer. Epigenetics. 8(7):748-55.

49.Kent WJ, Sugnet CW, Furey TS, Roskin KM, Pringle TH, Zahler AM, Haussler D. (2002) UCSC Genome Browser: The human genome browser at UCSC. Genome Res. 6:996-1006.

50.Bailey T. L. (2006) MEME:discovering and analysing DNA and protein sequence motifs. Nucleic Acids Res. 34

51.Lin R, Li X, Li J, Zhang L, Xu F, Chu Y, Li J. (2013) Long-term cisplatin exposure promotes methylation of the OCT1 gene in human esophageal cancer cells. Dig Dis Sci. 58(3):694-8.

52.Wang Z, Zhu S, Shen M, Liu J, Wang M, Li C, Wang Y, Deng A, Mei Q. (2013) STAT3 is involved in esophageal carcinogenesis through regulation of Oct-1. Carcinogenesis. 34(3):678-88.

53.Croce C.M. (2009) Causes and consequences of microRNA dysregulation in cancer Nat. Rev. Genet., 10: 704–714

54.Esquela-Kerscher, F.J. Slack. (2006) Oncomirs - microRNAs with a role in cancer. Nat. Rev. Cancer, 6: 259–269

55.Esteller M. (2011) Non-coding RNAs in human disease Nat. Rev. Genet.,.12: 861–874

56.Suzuki H, Maruyama R, Yamamoto E, Kai M. (2012) DNA methylation and microRNA dysregulation in cancer Molecular Oncology 6: 567–578

57.Chalitchagorn K, Shuangshoti S, Hourpai N, Kongruttanachok N, Tangkijvanich P, Thong-ngam D, et al. (2004) Distinctive pattern of LINE-1 methylation level in normal tissues and the association with carcinogenesis. Oncogene.; 23:8841-6.

58.Schulz WA. (2006) L1 retrotransposons in human cancers. J Biomed Biotechnol.:83672.

59.Estecio MR, Gharibyan V, Shen L, Ibrahim AE, Doshi K, He R, et al. (2007) LINE-1 hypomethylation in cancer is highly variable and inversely correlated with microsatellite instability. PLoS One.;2:e399.

60.Hsiung DT, Marsit CJ, Houseman EA, Eddy K, Furniss CS, McClean MD, et al. (2007) Global DNA methylation level in whole blood as a biomarker in head and neck squamous cell carcinoma. Cancer Epidemiol Biomarkers Prev.; 16:108-14.

61.Cho NY, Kim BH, Choi M, Yoo EJ, Moon KC, Cho YM, et al. (2007) Hypermethylation of CpG island loci and hypomethylation of LINE-1 and Alu repeats in prostate adenocarcinoma and their relationship to clinicopathological features. J Pathol. 211:269-77.

62.Matsuzaki K, Deng G, Tanaka H, Kakar S, Miura S, Kim YS. (2005) The relationship between global methylation level, loss of heterozygosity, and microsatellite instability in sporadic colorectal cancer. Clin Cancer Res.; 11:8564-9.

63.Perrin D1, Ballestar E, Fraga MF, Frappart L, Esteller M, Guerin JF, Dante R. (2007) Specific hypermethylation of LINE-1 elements during abnormal overgrowth and differentiation of human placenta. Oncogene. 26(17):2518-24.

64.Pattamadilok J, Huapai N, Rattanatanyong P, Vasurattana A, Perrin D, Ballestar E, Fraga MF, Frappart L, Esteller M, Guerin JF, et al.: (2007) Specific hypermethylation of LINE-1 elements during abnormal overgrowth and differentiation of human placenta. Oncogene. 26:2518-24.

65.Pattamadilok J, Huapai N, Rattanatanyong P, Vasurattana A, Triratanachat S, Tresukosol D, et al. (2008) LINE-1 hypomethylation level as a potential prognostic factor for epithelial ovarian cancer. Int J Gynecol Cancer 18:711–7.

66.Moore LE, Pfeiffer RM, Poscablo C, Real FX, Kogevinas M, Silverman D, et al. (2008) Genomic DNA hypomethylation as a biomarker for bladder cancer susceptibility in the Spanish Bladder Cancer Study: a case-control study. Lancet Oncol. 9:359-66.

67.Smith IM, Mydlarz WK, Mithani SK, Califano JA. (2007) DNA global hypomethylation in squamous cell head and neck cancer associated with smoking, alcohol consumption and stage. Int J Cancer. 121:1724-8.

68.Subbalekha K, Pimkhaokham A, Pavasant P, Chindavijak S, Phokaew C, Shuangshoti S, et al. (2009) Detection of LINE-1s hypomethylation in oral rinses of oral squamous cell carcinoma patients. Oral Oncol. 45:184-91.

69.Karouzakis E, Gay RE, Michel BA, Gay S, Neidhart M. (2009) DNA hypomethylation in rheumatoid arthritis synovial fibroblasts. Arthritis Rheum. 60:3613-22.

70.Choi IS, Estecio MR, Nagano Y, Kim do H, White JA, Yao JC, et al. (2007) Hypomethylation of LINE-1 and Alu in well-differentiated neuroendocrine tumors (pancreatic endocrine tumors and carcinoid tumors). Mod Pathol. 20:802-10.

71.Roman-Gomez J, Jimenez-Velasco A, Agirre X, Castillejo JA, Navarro G, San Jose-Eneriz E, et al. (2008) Repetitive DNA hypomethylation in the advanced phase of chronic myeloid leukemia. Leuk Res. 32:487-90.

72.Lee HS, Kim BH, Cho NY, Yoo EJ, Choi M, Shin SH, et al. (2009) Prognostic implications of and relationship between CpG island hypermethylation

and repetitive DNA hypomethylation in hepatocellular carcinoma. Clin Cancer Res. 15:812-20

73.Fiala E, Ehrlich M and. Laird P W: (2005) Association between hypermethylation of DNA repetitive elements in white blood cell DNA and early-onset colorectal cancer. Nucleic Acids Research, 33, 21: 6823–6836

74.Weisenberger, D.J., Velicescu, M., Cheng, J.C., Gonzales, F.A., Liang, G., Jones, P.A. (2004) Role of the DNA methyltransferase variant DNMT3b3 in DNA methylation Mol. Cancer Res. 262–72

75.Magewu, A.N. and Jones, P.A. (1994) Ubiquitous and tenacious methylation of the CpG site in codon 248 of the p53 gene may explain its frequent appearance as a mutational hot spot in human cancer Mol. Cell. Biol. 14: 4225–4232

76. Zhipeng Wang,Shaojun Zhu,Min Shen,Juanjuan Liu, Meng Wang, Chen Li, Yukun Wang, Anmei Deng and Qibing Mei (2013) STAT3 is involved in esophageal carcinogenesis through regulation of Oct-1 Carcinogenesis 34 (3): 678-688.

77.Liao D (2009) Emerging roles of the EBF family of transcription factors in tumor suppression. Mol Cancer Res. 7(12):1893-901

78.Chen F, Song J, Di J, Zhang Q, Tian H, Zheng J. (2012) IRF1 suppresses Ki-67 promoter activity through interfering with Sp1 activation. Tumour Biol. 33(6):2217-25

79.Thompson VC. Day TK, Bianco-Miotto T, Selth LA, Han G, Thomas M, Buchanan G, Scher HI, Nelson CC; Australian Prostate Cancer BioResource, Greenberg NM, Butler LM, Tilley WD. (2012) A gene signature identified using a mouse model of androgen receptor-dependent prostate cancer predicts biochemical relapse in human disease. Int J Cancer. 131(3):662-72

80.Deutsch AJ., Angerer H, Fuchs TE, Neumeister P. (2012) The Nuclear Orphan Receptors NR4A as Therapeutic Target in Cancer Therapy. Anticancer Agents Med Chem. 12(9):1001-14

81.Du P, Zhang X, Huang C-C, Jafari N, Kibbe W A, Hou L, and Lin S M (2010) Comparison of Beta-value and M-value methods for quantifying methylation levels by microarray analysis. BMC Bioinformatics. 11: 587.

82.Bock, C., Walter, J., Paulsen, M. and Lengauer, T. (2007) CpG Island Mapping by Epigenome Prediction, PLoS Comput Biol vol. 3, no. 6, pp. E110

83.Wrzodek, C., Büchel, F., Hinselmann, G., Eichner, J., Mittag, F. and Zell, A. (2012) Linking the Epigenome to the Genome: Correlation of Different Features to DNA Methylation of CpG Islands, PLoS ONE , vol. 7, no. 4, pp. e35327


Recommended