21
Coming Attraction: The Investment Appeal of Entertainment Production Facilities OCTOBER 2020 VIEWPOINT

Coming Attraction: The Investment Appeal of Entertainment Production Facilities
OCTOBER 2020
VIEWPOINT

OCTOBER 2020 CBRE Research © 2020 CBRE, Inc. | 2
U.S. VIEWPOINT
Contents
Executive Summary ...........................................................................................................3
Introduction ......................................................................................................................4
Production Space In An Evolving Content Landscape ........................................................5
Entertainment Employment Growth ..................................................................................7
Covid-19 Impacts ............................................................................................................11
Explosive Growth Of Video Streaming ............................................................................12
Incentives & The Global Production Ecosystem ................................................................13
Adaptive Re-Use Accelerates ..........................................................................................14
Case Study: Siren Studios, Hollywood .............................................................................15
Georgia ...........................................................................................................................16
New York ........................................................................................................................17
British Columbia ........................................................................................................ 18
Ontario ..................................................................................................................... 19
Louisiana .................................................................................................................. 20

OCTOBER 2020 CBRE Research © 2020 CBRE, Inc. | 3
U.S. VIEWPOINT
EXECUTIVE SUMMARY
• Asthemedia&entertainmentindustryentersaneraofaccelerateddemand,productionfacilitiesareanincreasinglyattractivecommercialrealestateinvestment.
• Mostofthe11millionsq.ft.ofsoundstagespaceinNorthAmericaisconcentratedinfilminghubslikeLosAngelesandGeorgia.LosAngelesaloneaccountsforhalfofthisinventory.
• Institutionalinvestorshavebeenincreasinglyattractedtothesoundstagesectoroverthepastdecade,creatingaburgeoningnewassetclasswithincommercialrealestate.
• Theentertainmentindustryisamajorspaceoccupierandemploysmorethan3millionpeopleintheU.S.COVID-19restrictionsthathavelimitedentertainmentproductioncausedatemporarydecreaseinindustryemploymentbutdemandforproductionspacehasbeengrowingrapidly,largelyduetoapandemic-related74%year-over-yearincreaseinstreamingvideodemand.
• Filmproductionlocationsareincreasinglyfar-flung,astaxincentiveprogramshavehelpedstateslikeGeorgiaandLouisianabecomemajorproductioncenters.However,traditionalentertainmenthubslikeLosAngelesandNewYorkremainprimesourcesofindustrytalent.
Eric WillettResearch Director, PSW Thought Leadership
Dan HunkerResearch Analyst, PSW Thought Leadership
Lewis HornePresident,PSW

OCTOBER 2020 CBRE Research © 2020 CBRE, Inc. | 4
U.S. VIEWPOINT
INTRODUCTION
TheentertainmentindustryhaslongbeensynonymouswithLosAngeles—thehomeofHollywood,moviestarsandmajorstudios.Itis,afterall,wherethemovieindustrybeganandithasremainedtheepicenterofglobalentertainmentoutputforwelloveracentury.Butasmovieproductionbecomesmoreexpensive,contentproductionbecomesubiquitousandindoorproductionspacegrowsscarcer,themagicofTinseltownisexpandingtootherU.S.markets.
ThisCBREViewpointdetailsthebreadthofproductionspace(commonlyknownassoundstages)acrossNorthAmericaandcomplementsCBRE’srecentreportontheLosAngelesproductionscene.Soundstageshaveoftenbeenoverlookedasattractivecommercialrealestateassetsduetotherelativelysmallsizeofthesector’sfootprint,butthedynamismofcontentcreationandtheexpandingreachofinstitutionalcapitalischangingthis.Indeed,soundstageshavebecomeaburgeoningassetclassamonginstitutionalinvestorsoverthepastdecade.

OCTOBER 2020 CBRE Research © 2020 CBRE, Inc. | 5
U.S. VIEWPOINT
Source: “Casting Call: Los Angeles’s Starring Role in the Evolving Production Landscape,” CBRE Research, Q3 2020 1. “Sound stages” or “production space” is defined as a structure dedicated to filming movies, television, music videos, streaming content, and more. Standing sets, back lots, on-site locations, ranches, office complexes, production mills, post-production space, and sound mixing labs were excluded.
PRODUCTION SPACE IN AN EVOLVING CONTENT LANDSCAPE
1.2MSFBritish Columbia
5.5MSFLos Angeles
0.7MSFLouisiana
1.8MSFAtlanta
1.5MSFNew York
0.8MSFOntario
Figure 1. Major North American Markets By Production Space Footprint
Aproductionspace,1alsoknownasasoundstage,generallyisafacilityforfilmingmoviesandtelevisionprograms.SoundstagespaceacrossNorthAmericatotalsmorethan11millionsq.ft.,mostofitinfilminghubslikeLosAngelesandGeorgia.LosAngelesaloneaccountsforhalfofthistotalwith441soundstagesoperatedby64filmandtelevisionstudios.
Theseproductionspaceshavelongbeenoverlookedasinvestmentassetsduetotheirownershipstructure,limitedinventoryandintensiveoperatingmodel.However,institutionalinvestorshavebeenincreasinglyattractedtothesoundstagesectoroverthepastdecade,catalyzingtheirrapidevolutionasanassetclass.
Theadventofstreamingvideohascreatedseeminglyinsatiabledemandforcontentthatpresentsuniqueopportunitiesforrealestateinvestors.Thetopfivestreamingcompaniesinvestedastaggering$25billioninnewproductionsin2019alone,resultinginintensecompetitionforanyavailablefilmingspacease-commerceandlogisticscompaniesoperatorsjostleforthesameindustrialfacilitiesbyfilmandtelevision
OCTOBER 2020 CBRE Research © 2020 CBRE, Inc. | 6
U.S. VIEWPOINT
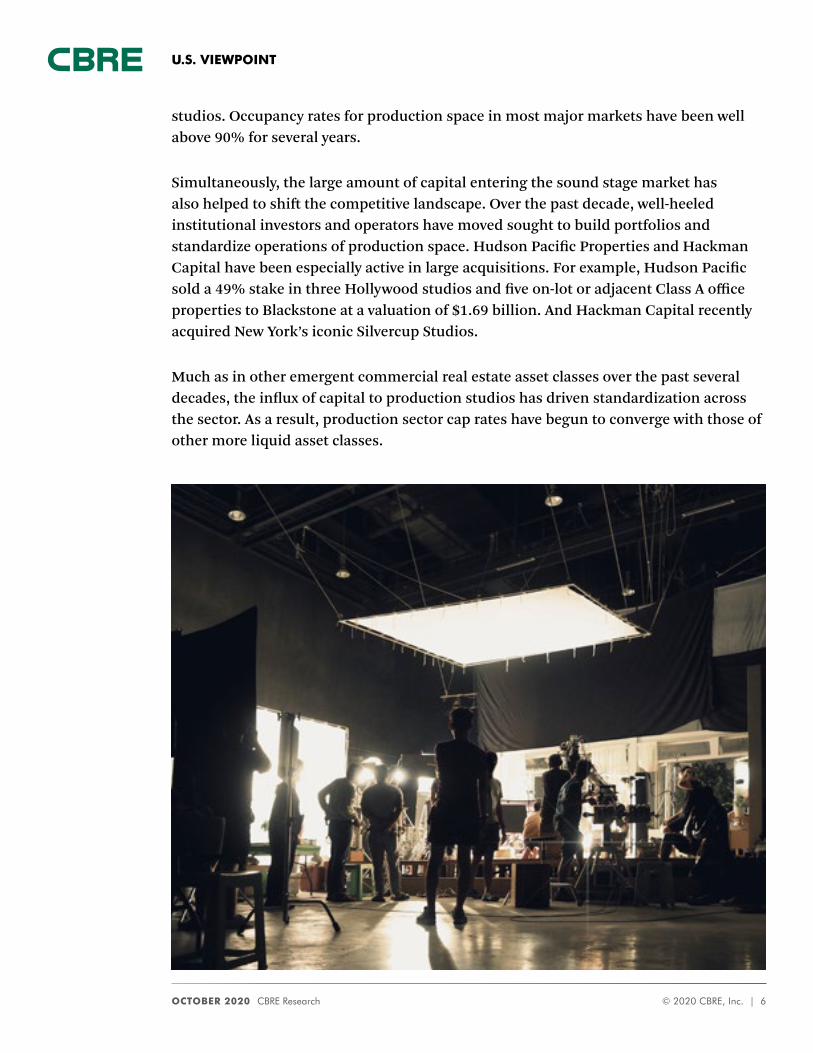
studios.Occupancyratesforproductionspaceinmostmajormarketshavebeenwellabove90%forseveralyears.
Simultaneously,thelargeamountofcapitalenteringthesoundstagemarkethasalsohelpedtoshiftthecompetitivelandscape.Overthepastdecade,well-heeledinstitutionalinvestorsandoperatorshavemovedsoughttobuildportfoliosandstandardizeoperationsofproductionspace.HudsonPacificPropertiesandHackmanCapitalhavebeenespeciallyactiveinlargeacquisitions.Forexample,HudsonPacificsolda49%stakeinthreeHollywoodstudiosandfiveon-lotoradjacentClassAofficepropertiestoBlackstoneatavaluationof$1.69billion.AndHackmanCapitalrecentlyacquiredNewYork’siconicSilvercupStudios.
Muchasinotheremergentcommercialrealestateassetclassesoverthepastseveraldecades,theinfluxofcapitaltoproductionstudioshasdrivenstandardizationacrossthesector.Asaresult,productionsectorcaprateshavebeguntoconvergewiththoseofothermoreliquidassetclasses.

OCTOBER 2020 CBRE Research © 2020 CBRE, Inc. | 7
U.S. VIEWPOINT
Figure 2: Entertainment Industry Employment Density By State
ENTERTAINMENT EMPLOYMENT GROWTH
TheU.S.istheworldleaderinmediacreation.In2018,morethan3.4millionpeoplewereemployedintheU.S.entertainmentindustry,2representingapproximately2.3%ofthenation’stotalworkforce.Overthepastdecade,theevolutionoftheentertainmentindustry—especiallytheriseofstreamingvideoondemand(SVOD)andconsumerdemandformorecontent—hasledtobroad-basedemploymentgrowth.From2010to2018,U.S.entertainmentsectoremploymentgrewby20%ornearly670,000jobs.
1 “Production space” is defined as a structure dedicated to filming movies, television, music videos, streaming content and more. Standing sets, back lots, on-site locations, ranches, office complexes, production mills, post-production space and sound mixing labs were excluded. 2 The “entertainment industry” includes the following NAICS Association industry codes: 512 — Motion Picture and Sound Recording, 515 — Broadcasting (excluding internet) and 711 — Performing Arts and Spectator Sports. Source: LAEDC, California Employment Development Department (CA EDD), Q3 2020. Source: U.S. Department of Commerce – Bureau of Economic Analysis (BEA), CBRE Research, Q3 2020.

OCTOBER 2020 CBRE Research © 2020 CBRE, Inc. | 8
U.S. VIEWPOINT
AsthehomeofHollywoodandmanyofthemostprominentmediabrands,Californiahasthelargestentertainmentemploymentbasetotalingmorethan628,000(upby97,000between2010and2018).NewYorkisthesecondlargestentertainmentmarket,employingnearly360,000people(upbymorethan48,000between2010and2018).Inrecentyears,otherstateshaveemergedasrichsourcesofentertainmenttalent.Texas,forexample,hadthesecondhighestamountofentertainmentjobsaddedsince2010(53,011)andhasquicklyrisentothethirdlargestmarketforentertainment-relatedprofessions.
Rank StateTotal
Employment
1 California 628,003
2 New York 358,120
3 Texas 216,548
4 Florida 192,666
5 Illinois 112,150
6 Georgia 109,858
7 Pennsylvania 105,005
8 Oregon 99,922
9 Massachusetts 86,460
10 North Carolina 86,358
Rank StateTotal
Employment
1 California 96,817
2 Texas 53,011
3 New York 48,854
4 Florida 47,101
5 Georgia 37,936
6 Oregon 23,628
7 North Carolina 22,200
8 Tennessee 20,772
9 Massachusetts 20,508
10 Pennsylvania 19,765
Figure 3: State Rankings By Total Entertainment Employment & Employment Growth
Source: U.S. Department of Commerce – Bureau of Economic Analysis (BEA), CBRE Research, Q3 2020.
Marketswitharelativelyhighsupplyofindoorfilmingspacehave,inturn,reportedincreasesinentertainmentindustryemployment.

OCTOBER 2020 CBRE Research © 2020 CBRE, Inc. | 9
U.S. VIEWPOINT
Despitetheexplosionoffilminginotherlocales,CaliforniaandNewYorkremaintheundisputedleadersinentertainmentemploymentandthepreferredhomeofbothon-andoff-screentalent.Accordingly,entertainmentproducerswanttobecloseby.
Theuseoftaxincentiveshasjump-startedgrowthoffilminginothermarketslikeGeorgia,whichhasbecomeahubforfeature-lengthfilmsthatrequireentertainmenttalenttotemporarilyrelocate.Asaresult,Georgia’smovieandsoundproductionemploymentbasehasgrownby161%or14,275jobsbetween2010and2018,comparedwithNewYork’s14%gainof9,034jobsoverthesameperiod.
Empl
oym
ent (
Thou
sand
s)
700
600
500
400
300
200
100
0
2010 2011 2012 2013 2014 2015 2016 2017 2018
California New York Georgia Louisana
+27%
+53%
+16%
+18%
Figure 4: Entertainment Employment Growth In Biggest U.S. Filming Hubs
Source: U.S. Department of Commerce – Bureau of Economic Analysis (BEA), CBRE Research, Q3 2020.

OCTOBER 2020 CBRE Research © 2020 CBRE, Inc. | 10
U.S. VIEWPOINT
Overallentertainmenttalent—actors,writers,directorsandproducers—hasgrownacrossallregions.Californiaaddedmorethan92,000performingjobsbetween2010and2018,anincreaseof30%.NewYorkandGeorgiaalsoaddedanimpressiveamountofentertainmenttalentaswell,increasingtheirperformingartslaborpoolsby44,724jobsand23,049respectively.
Figure 5: Entertainment Employment Growth By Major Filming Hubs & Industry Category, 2010–2018
Source: U.S. Department of Commerce – Bureau of Economic Analysis (BEA), CBRE Research, Q3 2020.
Louisiana
Motion Picture & Sound Recording
Broadcasting (except Internet)
Performing Arts, Spectator Sports, and Related Industries
Empl
oym
ent (
Thou
sand
s)100
80
60
40
20
0
(20)
California New York Georgia
92
45
23
914

OCTOBER 2020 CBRE Research © 2020 CBRE, Inc. | 11
U.S. VIEWPOINT
COVID-19 IMPACTS
Televisionandmovieproductionabruptlystoppedbeginninginmid-MarchduetoCOVID-19restrictions,causingasharpdeclineinentertainmentemployment.
Source: U.S. Bureau of Labor Statistics (BLS), CBRE Research, Q3 2020.
Peak to Trough (Jan to May)
Jobs Recovered
Peak to Current (Jan to Aug)
-600 -500 -400 -300 -200 -100 0
42
-259
-241
-247
-229
-24
-19
Motion Picture & Sound Recording
Broadcasting (except Internet)
Performing Arts, Spectator Sports, and Related Industries
Figure 6: Covid-19 Impact On U.S. Entertainment Industry Employment
Thesejoblosseslikelyaretemporarygivenpentupdemand,andmanystalledproductionshavesinceresumed.Inmid-July,NewYorkallowedproductioncrewsnolargerthan50peopletoresumework.PinewoodAtlanta,thelargeststudioinGeorgia,planstoreopenthisfallwithstringentsafetyguidelinesforitsproductioncrews.
OCTOBER 2020 CBRE Research © 2020 CBRE, Inc. | 12
U.S. VIEWPOINT
EXPLOSIVE GROWTH OF VIDEO STREAMING
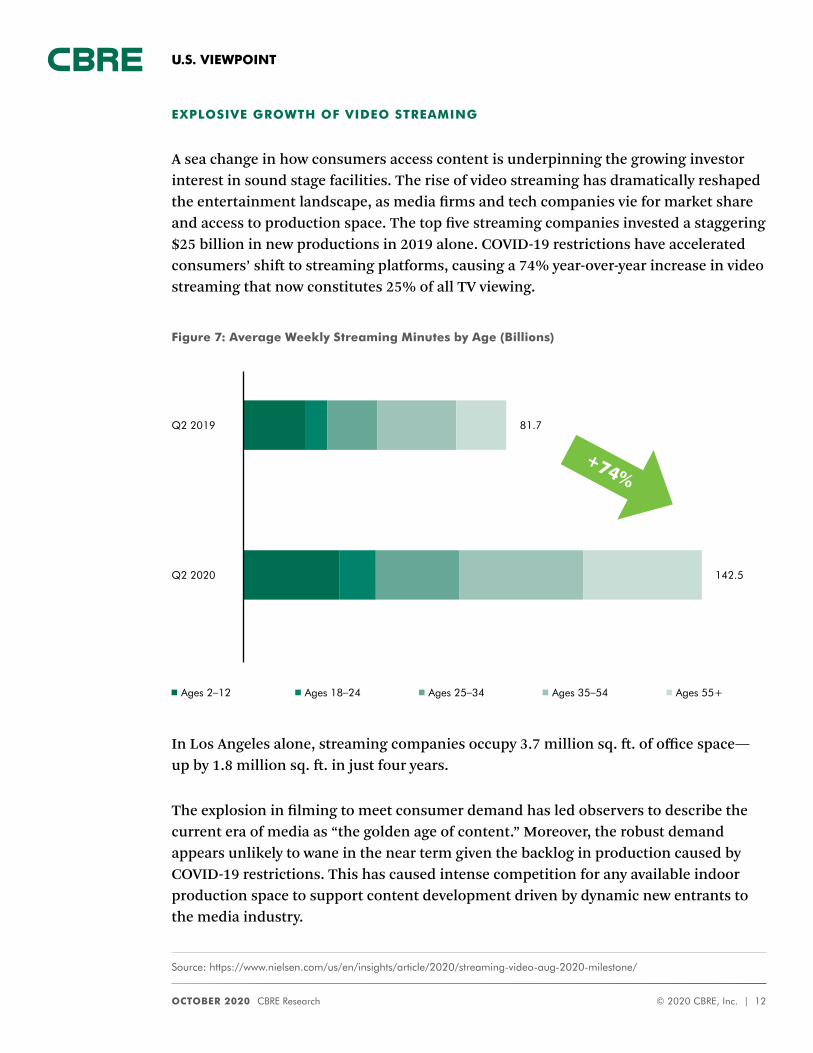
Aseachangeinhowconsumersaccesscontentisunderpinningthegrowinginvestorinterestinsoundstagefacilities.Theriseofvideostreaminghasdramaticallyreshapedtheentertainmentlandscape,asmediafirmsandtechcompaniesvieformarketshareandaccesstoproductionspace.Thetopfivestreamingcompaniesinvestedastaggering$25billioninnewproductionsin2019alone.COVID-19restrictionshaveacceleratedconsumers’shifttostreamingplatforms,causinga74%year-over-yearincreaseinvideostreamingthatnowconstitutes25%ofallTVviewing.
Source: https://www.nielsen.com/us/en/insights/article/2020/streaming-video-aug-2020-milestone/
Figure 7: Average Weekly Streaming Minutes by Age (Billions)
Q2 2019 81.7
Q2 2020 142.5
Ages 2–12 Ages 18–24 Ages 25–34 Ages 35–54 Ages 55+
InLosAngelesalone,streamingcompaniesoccupy3.7millionsq.ft.ofofficespace—upby1.8millionsq.ft.injustfouryears.
Theexplosioninfilmingtomeetconsumerdemandhasledobserverstodescribethecurrenteraofmediaas“thegoldenageofcontent.”Moreover,therobustdemandappearsunlikelytowaneintheneartermgiventhebackloginproductioncausedbyCOVID-19restrictions.Thishascausedintensecompetitionforanyavailableindoorproductionspacetosupportcontentdevelopmentdrivenbydynamicnewentrantstothemediaindustry.
+74%

OCTOBER 2020 CBRE Research © 2020 CBRE, Inc. | 13
U.S. VIEWPOINT
INCENTIVES & THE GLOBAL PRODUCTION ECOSYSTEM
Majorfilmproductionsincreasinglyaretakingplaceinfar-flunglocations,buttraditionalmarketslikeLosAngelesandNewYorkCityremainthecentralhubsformediaandentertainment.EmergingfilmlocaleslikeGeorgiaandLouisianahaveheavilyleveragedtaxincentiveprogramstocatalyzetheirnascentmediaandentertainmentsectors.
Source: CBRE Research, Q3 2020.
Figure 8: Summary Of Tax Incentives By Major Filming Market
Thelion’sshareoffilmbudgetsisforpost-productionand“above-the-line”costs(on-andoff-cameracreativetalent)thatproductionstudiosfrequentlyfinddifficultorimpossibletorenegotiate.“Below-the-line”costsofhourlylaborandfilmingareeasiertoreduce.Andthemosteffectivewaytodothisisbymovingtheproductionoutofhigh-costmarketstothosewithlowerlaborrates,cheaperrentsandfavorabletaxpolicies.Despitetheeconomicadvantagestolow-costmarkets,talentismoreapttofilmout-of-stateforafeaturefilmasopposedtoatelevisionshoot,asmoviefilmingtypicallylastsbetween1–2months.
California Georgia New YorkBritish Columbia
Ontario Louisiana
Theatrical Features
62 36 57 16 4 6
Streaming Features
11 3 13 3 2 2
Total Features 73 39 70 19 6 8
Sound Stage SF
5.5 MSF 1.8 MSF 1.5 MSF 1.2 MSF 0.8 MSF 0.7 MSF
Tax Credit Amount (For Features)
20% (non-indie); 25% indie
20% 30% 28% 21.5% 25%
Credit Type
Non-transferable (non-indie); Transferable (indie)
Transferable Refundable Refundable Refundable Refundable
Sunset Date 2025 None 2022 None None None
Annual Cap (US$)
$330 Million
None$420 Million
None None$150 Million
Tax
Cre
dit C
hara
cter
istic
sFe
atu
re F
ilms

OCTOBER 2020 CBRE Research © 2020 CBRE, Inc. | 14
U.S. VIEWPOINT
Inyearsahead,theNorthAmericanfilmindustryshouldbecomemoreinterconnectedascontentproduction,post-productionandmanagementbecomemoreglobalized.Amidthisevolution,thekeyentertainmenthubsareaddingmoreprofessionalservicesinsupportoftheglobalentertainmentecosystem.Forexample,LosAngeles’sexplosiveemploymentgrowthofpromoters,agentsandmanagers(up140%since2010)hasoutpacedits35%increaseinperformersoverthesametime,reflectingthecity’scentralroleinprovidingtotalfilmproductioninfrastructure.
ADAPTIVE RE-USE ACCELERATES
Thesurgeincontentproductionandproliferationofstreamingplatformshasdrivenintensedemandforregionalproductionspace.Withsoundstagevacancyratesconsistentlyinthelowsingle-digitsandsteadilyclimbingrentalratesinthemostin-demandlocations,productioncompanieshaveincreasinglysoughtalternativefilminglocations.
Atitsmostbasic,thephysicalrequirementsforeffectivesoundstagespace(e.g.,highceilingsandlargeunobstructedfloorplates)closelyresemblethoseoftheaverageindustrialbuilding.Certainbuildingcharacteristicsareuniquetosoundstages,particularlysoundproofingandsuspendedweightloads.Forlessdemandingproductions,traditionalindustrialspaceoftenwillsuffice.Asaresult,manyindustrialpropertiesareofinteresttoproductioncompaniesandinvestors.
InpredominantlyinfillmarketslikeLosAngelesandNewYork,conversionsofindustrialpropertiestoproductionfacilitiesareincreasinglycommon.
Amid this evolution, the key entertainment hubs are adding more professional services in support of the global entertainment ecosystem.

OCTOBER 2020 CBRE Research © 2020 CBRE, Inc. | 15
U.S. VIEWPOINT
7Stages
5,419 SF Average Stage Size
37,930 SF Total Production Space
CASE STUDY: SIREN STUDIOS, HOLLYWOOD
SirenStudios,locatedintheheartofHollywood,exemplifiestheadaptivereuseofnon-studiospace.Itssevenstagesincludebothformerindustrialspaceandnewpurpose-builtconstruction.Withover$50millioninvestedinupgradingthespaces,thestudioispopularforsmallershootsthatarebestsuitedfortheitssmallfloorplates,includingfashionphotographyandadvertisements.

OCTOBER 2020 CBRE Research © 2020 CBRE, Inc. | 16
U.S. VIEWPOINT
GEORGIA
•GeorgiaisthesecondlargestfilmingmarketintheU.S.bytotalsoundstagesquarefeet.
•Entertainmentemploymentgrewbynearly38,000jobsfrom2010to2018—anincreaseof53%—asproductioncompaniesincreasinglyusedthestateasasiteforfeaturefilms.
•Mid-tolarge-sizedstagespaceisfarmorecommoninGeorgiathanin
California,dueinlargeparttotherelativeyouthofthefilmingmarket.
•High-ceilingstagesaboundinGeorgia,meaningthemarketcaneasilyaccommodatelarge-scaleandintricatesets.
•UnlikeCalifornia,Georgia’staxincentiveprogramisunhamperedbyannualcapsorexpirationdates,makingtheprocessofsecuringtaxcreditslesschallenging.
STUDIO SPOTLIGHT: PINEWOOD ATLANTA
Locatedjust30minutesfromdowntownAtlanta,PinewoodAtlantaStudioshasquicklybecomeoneofGeorgia’smostsought-afterfilminglocations.Sittingonmorethan700acres,thestudioencompasses18soundstagestotalingover360,000sq.ft.offilmableindoorspace—thelargestsoundstagefootprintinthestate.Sinceopeningin2014,thestudiohashostedsomeofthebiggestboxofficedrawsinthepastdecade,includingMarvel’s“Ant-ManandtheWasp”and“Avengers:Endgame.”
SOUND STAGE BREAK DOWN BY SIZE SEGMENT
65stages with
<5K SF
0 10 20 30 40 50 60 70
<5,000
5,000–9,999
10,000–14,999
15,000–19,999
20,000–29,999
30,000–39,999
>40,000
65
62
21
29
6
1
SOUND STAGE BREAKDOWN BY HEIGHT SEGMENT
<10 Ft.
10–19 Ft.
20–29 Ft.
30–39 Ft.
40–49 Ft.
>50 Ft.
Unknown
0 10 20 30 40 50 60 70 80 90
83stages with
ceiling height 10–19 FT
83
4
46
42
4
5
QUICK FACTS:

OCTOBER 2020 CBRE Research © 2020 CBRE, Inc. | 17
U.S. VIEWPOINT
NEW YORK
•Despitebeingthethirdlargestfilmmarketbysoundstagesquarefeet,NewYork’sfilmindustryistheoldestinthenation,beginningin1896.
•NewYork’entertainmentsectoremploymentgrewby49,000jobsfrom2010to2018—anincreaseof16%.
•Duetothedensityofthemarket,smalltomid-sizedstagesaremorecommonthanlargerones.
•Low-ceilingsproductionfacilitiesarecommon,makingthembest-suitedsmallerscaleproductionsliketelevisionseries.
•LikeCalifornia,NewYork’sfilmtaxincentiveprogramhasanannualcap.Totalstatewideincentivescurrentlymaxoutat$420million(comparedwithCalifornia’s$330million).
STUDIO SPOTLIGHT: BROADWAY STAGES
Startingin1983asasinglesoundstageconvertedfromanoldmovietheaterinAstoria,Queens,BroadwayStageshasbecomethelargestfilmstudioinNewYorkCity.WithlocationsspreadacrossQueens,StatenIslandandBrooklyn,thestudiooperatesnearly40stagestotalingmorethan400,000sq.ft.ofindoorsoundstagespace.Recentnotableproductionsincludetelevision’s“SaturdayNightLive,”“Marvel’sDaredevil,”“Mr.Robot”and“TheMarvelousMrs.Maisel.”
SOUND STAGE BREAK DOWN BY SIZE SEGMENT
65stages with
<5K SF
0 10 20 30 40 50 60 70
<5,000
5,000–9,999
10,000–14,999
15,000–19,999
20,000–29,999
30,000–39,999
>40,000
65
62
21
29
6
1
SOUND STAGE BREAKDOWN BY HEIGHT SEGMENT
<10 Ft.
10–19 Ft.
20–29 Ft.
30–39 Ft.
40–49 Ft.
>50 Ft.
Unknown
0 10 20 30 40 50 60 70 80 90
83stages with
ceiling height 10–19 FT
83
4
46
42
4
5
QUICK FACTS:

OCTOBER 2020 CBRE Research © 2020 CBRE, Inc. | 18
U.S. VIEWPOINT
BRITISH COLUMBIA QUICK FACTS:
•ThefourthlargestfilmingmarketinNorthAmerica,BritishColumbiawasoneofthefirstplacestoadopttaxincentivesformovieandtelevisionproductions.
•Mid-tolarge-sizedstagesaremostcommon.
•High-ceilingstagesareplentifulandcanaccommodatelarge-scaleproductions.
STUDIO SPOTLIGHT: MAMMOTH STUDIOS
LocatedinBurnaby,MammothStudioslivesuptoitsnameasthelargestfilmstudioinBritishColumbiawithmorethan250,000sq.ft.ofindoorfilmingspace.MammothStudiosisalsohometothelargestsoundstageinNorthAmericaat123,883sq.ft.and40feettall.Severalbigbudgetfilmshavebeenmadehere,including“SonictheHedgehog,”“ThePredator,”“TheRevenant”and“Deadpool2.”
SOUND STAGE BREAK DOWN BY SIZE SEGMENT
23stages with 15K–19K SF
0 5 10 15 20 25
<5,000
5,000–9,999
10,000–14,999
15,000–19,999
20,000–29,999
30,000–39,999
>40,000
16
1623
13
32
SOUND STAGE BREAKDOWN BY HEIGHT SEGMENT
<10 Ft.
10–19 Ft.
20–29 Ft.
30–39 Ft.
40–49 Ft.
>50 Ft.
Unknown
0 5 10 15 20 25 30 35
32stages with
ceiling height 40–49FT
1
13
15
32
3

OCTOBER 2020 CBRE Research © 2020 CBRE, Inc. | 19
U.S. VIEWPOINT
ONTARIO QUICK FACTS:
•Ontariohasanumberofvaryingstagesizes,thoughsmalltomid-sizedstagesaremostcommon.
•Standardheightstagesarethenorm.
STUDIO SPOTLIGHT: PINEWOOD STUDIOS TORONTO
Onlyafewminutes’drivefromtheStudioDistrict,PinewoodStudios’Torontolocationistheprimarypurpose-builtfacilityinthecity.Thestudiohas12soundstages,includinganearly46,000-sq.-ft.megastage,foratotalofmorethan208,000sq.ft.ofindoorfilmingspace.PinewoodTorontohashostedanumberofgenremovieandtelevisionproductionsovertheyears,including“IT:ChapterTwo,”“SHAZAM!,”“StarTrek:Discovery”and“TheExpanse.”
SOUND STAGE BREAK DOWN BY SIZE SEGMENT
15stages with 10K–14K SF
0 2 4 6 8 10 12 14 16
<5,000
5,000–9,999
10,000–14,999
15,000–19,999
20,000–29,999
30,000–39,999
>40,000
10
615
10
8
22
SOUND STAGE BREAKDOWN BY HEIGHT SEGMENT
<10 Ft.
10–19 Ft.
20–29 Ft.
30–39 Ft.
40–49 Ft.
>50 Ft.
Unknown
0 2 4 6 8 10 12 14 16 18
16stages with
ceiling height 20–29 FT
7
16
15
7
4
3
1

OCTOBER 2020 CBRE Research © 2020 CBRE, Inc. | 20
U.S. VIEWPOINT
LOUISIANA QUICK FACTS:
•Whilesmallcomparedtootherfilmingmarkets,Louisianahasbecomeatop-tierfilminglocationamongmajorstudios.
•Louisiana’sentertainmentsectoremploymentgrewbynearly8,000jobsfrom2010to2018—anincreaseof27%.
•Themarkethasarangeofstagesizesthatcanaccommodateawidearrayofproductionneeds.
•Mid-tohigh-ceilingspaceiscommon.
•Thestateoffersafilmtaxincentiveprogramcappedat$150millionperyear.
SOUND STAGE BREAK DOWN BY SIZE SEGMENT
11stages with 20K–29K SF
0 2 4 6 8 10 12
<5,000
5,000–9,999
10,000–14,999
15,000–19,999
20,000–29,999
30,000–39,999
>40,000
38
75
116
SOUND STAGE BREAKDOWN BY HEIGHT SEGMENT
<10 Ft.
10–19 Ft.
20–29 Ft.
30–39 Ft.
40–49 Ft.
>50 Ft.
Unknown
0 5 10 15 20 25 30 35
53stages with
ceiling height 40–49FT
4
4
21
7
5
STUDIO SPOTLIGHT: CELTIC STUDIOS
CelticStudios(alsoknownastheCelticMediaCentre)isthelargestfilmproductionstudioinLouisiana.Establishedin2008,itincludessevensoundstagestotalingnearly150,000sq.ft.ofindoorfilmingspace.Thestudiobillsitselfasaone-stopshopforfilming,offeringalmost100,000sq.ft.ofofficespaceforproductionneeds.RecentproductionsfilmedatCelticStudiosinclude“FantasticFour,”“Oblivion”and“Greyhound.”

© Copyright 2020 All rights reserved. Information contained herein, including projections, has been obtained from sources believed to be reliable, but has not been verified for accuracy or completeness. CBRE, Inc. makes no guarantee, warranty or representation about it. Any reliance on such information is solely at your own risk. This information is exclusively for use by CBRE clients and professionals and may not be reproduced without the prior written permission of CBRE’s Global Chief Economist.
To learn more about CBRE Research, or to access additional research reports, please visit Research and Reports.
U.S. VIEWPOINT
Richard Barkham, PhD, MRICSGlobal Chief Economist & Head of Americas Research CBRE+ 617 912 [email protected]
Spencer G. LevyChairman & Senior Economic Advisor CBRE | Americas Research+ 617 912 [email protected]
Julie WhelanHead of Occupier ResearchCBRE | Americas Research+1 617 912 [email protected]
Eric WillettResearch Director, PSW Thought Leadership +1 213 613 [email protected]
Dan HunkerResearch Analyst, PSW Thought Leadership +1 909 418 [email protected]
Whitley CollinsGlobal President, Advisory & Transaction Services | Occupier+1 310 363 [email protected]
Lew HornePresident, PSW +1 213 613 [email protected]
FOR MORE INFORMATION ABOUT CBRE RESEARCH, PLEASE CONTACT:
FOR MORE INFORMATION ABOUT THIS REPORT, PLEASE CONTACT:
FOR MORE INFORMATION ABOUT OCCUPIER SERVICES AND THE PRODUCTION LANDSCAPE, PLEASE CONTACT:


