Advice. Life. Investments. Superannuation and Retirement. Edition 1, 2019 The dangers of over-reliance on dividends for income Why your bucket list needs a Plan B How Australia’s Medical Research Future Fund will transform healthcare China reforms set to attract a flood of offshore investors Year ends on a subdued note as market volatility strikes
Transcript
Advice. Life. Investments. Superannuation and Retirement. Edition 1, 2019
The dangers of over-reliance on dividends for income
Why your bucket list needs a Plan B
How Australia’s Medical Research Future Fund will transform healthcare
China reforms set to attract a flood of offshore investors
Year ends on a subdued note as market volatility strikes
Australian blue-chip shares are known for their high dividends but how reliable are they?
Retirees rely heavily on income to support their lifestyle and if cashflow is king, then dividends have a prime position in the royal court.
It’s a strategy that has generally paid off.
Australian companies pay out a significant amount of profit as dividends, ranking among the highest in the world. Australia’s franking regime removes the double taxation of company profits (and retirees who don’t pay tax can claim a refund) providing another incentive. Meanwhile, historic low interest rates have made traditional income-producing assets unattractive.
However, while regular company dividends can play an important role for retirees, they shouldn’t be compared directly with other more reliable forms of income such as bonds or term deposits.
Dividends – even those generated by blue-chip household names – can be highly variable, which can have a significant impact on retirees who have already banked that income.
International dividend payout ratios - Average over 2005 to 2015
Australia 67United Kingdom 60Japan 57Europe 55Canada 52United States 48
Sources: Bloomberg; Morningstar; RBA
Retirees need growth but risk is a concern Retirement is a major milestone for Australians, ranking alongside entering the workforce or buying a first home. While it may mark a new enjoyable phase of life, the shift from accumulating super to drawing it down in retirement also introduces different risks.
The sequence of return risk describes the greater impact that a market downturn can have on soon-to-be or recently retired Australians. Younger investors can wait for a market rebound and continue to make contributions while assets are cheaper.
By way of contrast, older investors are often already drawing on their assets to fund their lifestyle. For them, a downturn means the assets they’ve already bought are worth less than before, eating into their nest egg.
Yet growth assets such as equities are often necessary to generate the long-term growth needed to fund an expected two decades or more in retirement.
Typical allocated pensions still have significant equity exposure of around 24% according to Mercer.
This newsletter is made available by
ClearView Life Nominees Pty Ltd, ClearView
Life Assurance Limited and ClearView
Financial Management Limited (ClearView)
and intended to provide general information
only. The information has been prepared
without taking into account any particular
person’s objectives, financial situation or
needs. Before acting on such information, you
should consider the appropriateness of the
information having regard to your personal
objectives, financial situation or needs.
ClearView recommends that you obtain
personal financial advice and read the relevant
Product Disclosure Statement before making
any decision about a product. This information
does not in any way constitute tax or legal
advice and before relying on this information,
you should seek independent expert advice.
While we have taken all care to ensure the
information in this newsletter is accurate and
reliable, to the extent the law permits we will
not assume liability to any person for any error
or omission in the newsletter however caused.
Call (02) 8095 1494 for editorial enquiries.
The dangers of over-reliance on dividends for income
The dangers of over-reliance on dividends for income 2Why your bucket list needs a Plan B 4How Australia’s Medical Research Future Fund will transform healthcare 6China reforms set to attract a flood of offshore investors 8Year ends on a subdued note as market volatility strikes 12
2 • Viewpoint Edition 1 2019
Viewpoint Edition 1 2019 • 3
Self-managed superannuation investors (SMSF), with more ability to manage their individual tax position, often hold an even higher proportion of dividend-generating direct shares.
An analysis of 2600 SMSF investor portfolios by administrator SuperConcepts estimated that about 12% was allocated to the top 10 largest ASX-listed securities and a further 24% in other Australian shares.
This places strong reliance on share dividends, even though dividends are highly susceptible to the state of the economy and company profitability.
Dividends and profits - All listed companies, financial year%
80
70
60
$b90
60
30
$b90
60
30
$b90
60
30
0
$b90
60
30
0
%
80
70
60
Payout ratio
Dividends
Underlying profit
Resources boom GFC Post-crisis
1999 2003 2007 2011 2015
Banks Non-bank financials Other Resources
Sources: Morningstar; RBA
The changing nature of dividendsDividend-paying companies appear to generally smooth their dividend payments and show a deep reluctance to cut them, according to a 2016 Reserve Bank of Australia study, The Rise in Dividend Payments.
“When earnings fall (not including when a loss was recorded), a majority of companies still seek to increase dividends or keep them unchanged from the previous period,” according to the study.
While such a strategy may keep shareholders happy, it is unsustainable. A number of companies cut dividends in the wake of the 2007-08 global financial crisis. Among the top ten largest ASX stocks, ANZ, BHP Billiton, Rio Tinto, Wesfarmers, Woolworths, and CSL have all announced at least one dividend cut since 2016.
Many of these recent cuts were small although, Telstra slashed its dividend by about one-third. While the Australian economy remains in solid shape, the high dividend-paying bank sector is under particular pressure from a Royal Commission that has prompted hundreds of millions of dollars in remediation payments.
Meanwhile, legislative risk looms as another recent danger for a small minority of dividend-focused investors.
The Labor Party has proposed ending cash refunds for dividend imputation credits, although more than 300,000 full and part-pensioners, people on government allowances, and about 13,000 SMSF funds with at least one pensioner or allowance recipient would be excluded.
An estimated 8% of Australian taxpayers received cash refunds for excess imputation credits in their 2014-15 tax return, according to the Parliamentary Budget Office.
Diversification and risk management is the key
High yield shares still play a valuable role in many portfolios. However, by their nature, they differ from bonds and term deposits, which deliver more consistent and reliable income.
Other popular asset classes, which often require a professional fund manager to access, can also help diversify against risk including commercial property, alternative assets, and international shares.
If, for example, Australian shares suffer a downturn and several companies cut their dividend payments, an investor can still rely on income generated by bonds or other sources.
This is one reason for the popularity of so-called bucketing strategies. These involve placing different assets in ‘buckets’ for different purposes. One bucket may hold assets such as bonds and term deposits to generate enough income for 3-5 years while another bucket may hold growth assets such as shares to generate more longer-term capital growth. This can dampen the impact of a market downturn.
Speak to your ClearView financial adviser about building a diversified portfolio that can help you meet your retirement goals. Call us on 132 977 or visit www.clearview.com.au
4 • Viewpoint Edition 1 2019
Even if you’re just starting out, life insurance matters more than you might expect.
Insurance is how we protect what matters. Our homes, our cars, even our collection of B-side thrash metal albums or our bright red stand mixer.
But increasingly, we’re discovering that experiences are more important to us than material possessions. Research has found it also leads to greater happiness and personal fulfilment.
It’s a trend that spans the generations. For millennials, who came of age in the shadow of the global financial crisis, it resonates especially strongly, paired with a greater aversion to risk.
Two-thirds of millennials are focused on protecting what’s important to them, according to Telstra’s Millennials, Mobiles & Money report. That puts it on par with reducing and managing debt (66%) and owning a home (65%). Only saving for the future ranks higher, at a whopping 82%. Meanwhile, less than half that number (39%), prioritise spending to live in the moment, putting it last on the list.
The heightened focus on the quality of our lives rather than the quantity of our stuff means that life insurance is more important than ever.
How life insurance can make your life better
1. It protects your lifestyle as well as your loved ones
Soaring property prices, stints of living overseas or travelling, and completing further education are just some of the reasons millennials are more likely to delay many major life decisions. These include living with their families for longer, buying their first home later, as well as marrying and becoming parents compared to previous generations.
Whether you’re spending your salary, funding your next adventure or investing for the more distant future, life insurance isn’t just for people with kids and mortgages. It can help you navigate an unexpected setback such as serious illness or injury without wiping out your hard-earned savings or being saddled with a mountain of debt. That improves your ability to get back on track after recovery.
2. It gives you greater independence
Our working lives are changing shape, becoming more flexible and sometimes more uncertain. We’re increasingly likely to change career paths multiple times.
Why your bucket list needs a Plan B
Close to half (43%) of younger workers expect to leave their current job within two years, according to the 2018 Deloitte Millennial Survey. The growing ‘gig economy’ is one lure for those seeking a change. Growing numbers of millennials are exploring short-term contracts or freelance work, largely lured by fewer restrictions and more money.
A clear majority of millennials (57%) would consider gig working as an alternative to full-time employment, the Deloitte survey found.
Being your own boss means taking greater responsibility for the future such as superannuation and basic life insurance cover.
3. It’s cheaper than you think
The best time to get great rates on life insurance is when you’re young and healthy. You’re less likely to have pre-existing medical conditions that may be subject to limitations or exclusions, meaning taking out cover at an earlier age can make it more comprehensive down the track.
Viewpoint Edition 1 2019 • 5
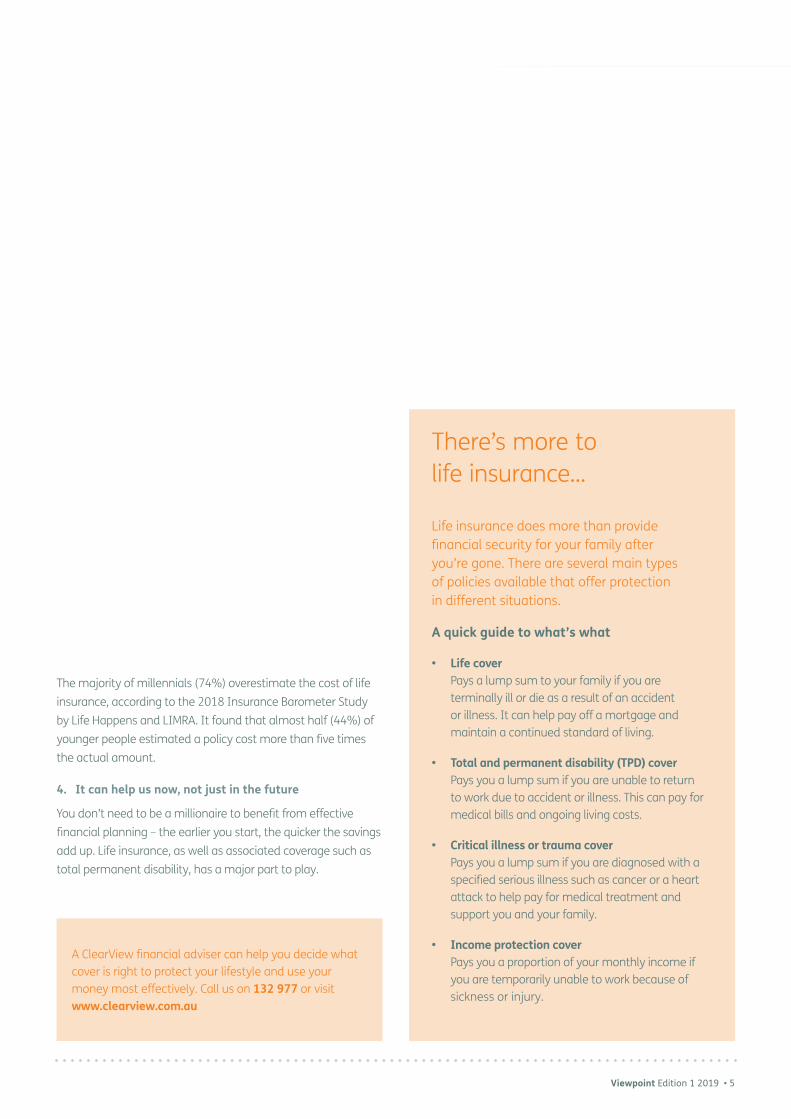
There’s more to life insurance...
Life insurance does more than provide financial security for your family after you’re gone. There are several main types of policies available that offer protection in different situations.
A quick guide to what’s what
• Life cover Pays a lump sum to your family if you are terminally ill or die as a result of an accident or illness. It can help pay off a mortgage and maintain a continued standard of living.
• Total and permanent disability (TPD) cover Pays you a lump sum if you are unable to return to work due to accident or illness. This can pay for medical bills and ongoing living costs.
• Critical illness or trauma cover Pays you a lump sum if you are diagnosed with a specified serious illness such as cancer or a heart attack to help pay for medical treatment and support you and your family.
• Income protection cover Pays you a proportion of your monthly income if you are temporarily unable to work because of sickness or injury.
The majority of millennials (74%) overestimate the cost of life insurance, according to the 2018 Insurance Barometer Study by Life Happens and LIMRA. It found that almost half (44%) of younger people estimated a policy cost more than five times the actual amount.
4. It can help us now, not just in the future
You don’t need to be a millionaire to benefit from effective financial planning – the earlier you start, the quicker the savings add up. Life insurance, as well as associated coverage such as total permanent disability, has a major part to play.
A ClearView financial adviser can help you decide what cover is right to protect your lifestyle and use your money most effectively. Call us on 132 977 or visit www.clearview.com.au
6 • Viewpoint Edition 1 2019
Life changing medical research is set to be turbocharged as a new fund injects billions of dollars into the sector.
Good health provides the foundation for an enjoyable retirement.
Yet almost one-third (30%) of Australians aged 65-74 years and slightly more than one-third (35%) of those aged at least 75 years describe their health as either fair or poor, according to the ABS 2010 General Social Survey.
General ailments tend to increase with age alongside more serious conditions such as dementia, cancer, osteoporosis, heart disease, and arthritis. Developing new treatments and cures to tackle those and other diseases is crucial.
Enter the government’s Medical Research Future Fund (MRFF).
Established in 2015 to support, transform and drive cutting-edge medical research and innovation, the MRFF will eventually become one of the largest medical endowment funds in the world with $20 billion in assets by 2020-21.
“It’s a huge injection of funds into the sector on top of the funding that we had before,” the University of Melbourne Director of MRFF Initiatives, Dr Heather St John, said at a speech in late 2018 to the Victorian Comprehensive Cancer Centre.
“In the last Budget we had about another $1.7 billion committed [over the next decade] to translational medical research – there’s a whole range of new schemes coming out.”
The MRFF’s aim is to substantially boost research funding towards Australians’ greatest unmet clinical needs and, with a rapidly ageing population, research into diseases that typically strike later in life is expected to increase.
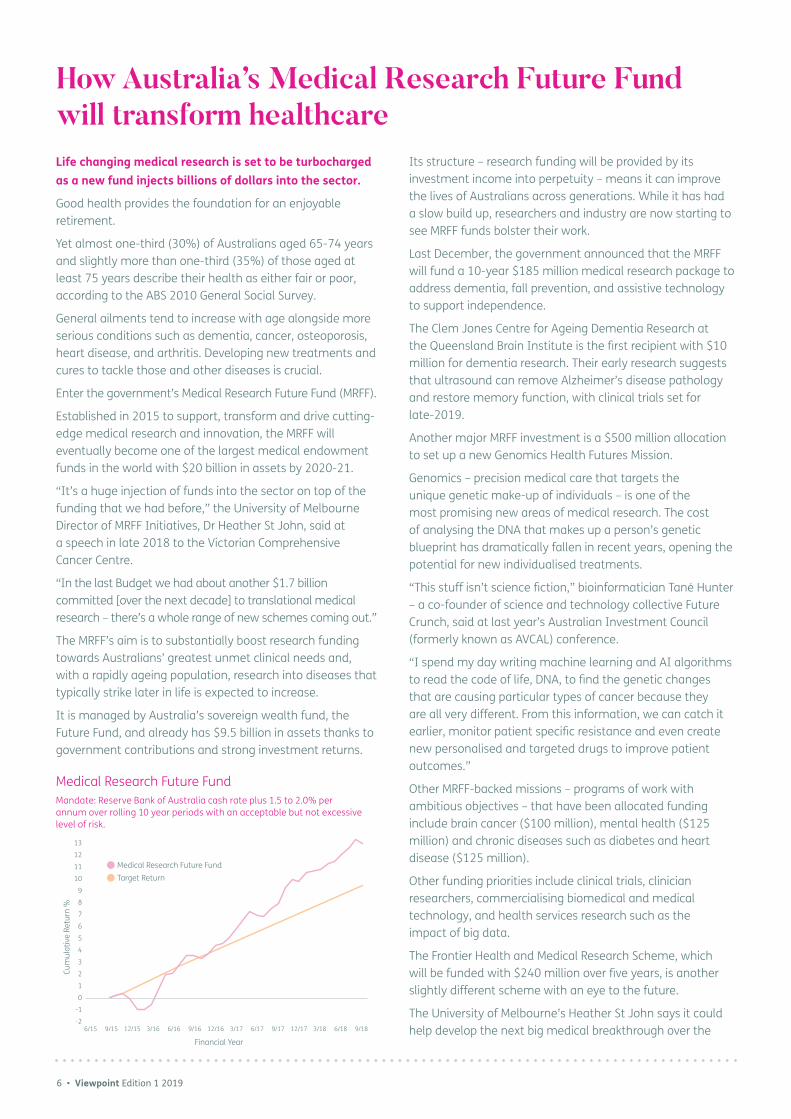
It is managed by Australia’s sovereign wealth fund, the Future Fund, and already has $9.5 billion in assets thanks to government contributions and strong investment returns.
Medical Research Future FundMandate: Reserve Bank of Australia cash rate plus 1.5 to 2.0% per annum over rolling 10 year periods with an acceptable but not excessive level of risk.
Its structure – research funding will be provided by its investment income into perpetuity – means it can improve the lives of Australians across generations. While it has had a slow build up, researchers and industry are now starting to see MRFF funds bolster their work.
Last December, the government announced that the MRFF will fund a 10-year $185 million medical research package to address dementia, fall prevention, and assistive technology to support independence.
The Clem Jones Centre for Ageing Dementia Research at the Queensland Brain Institute is the first recipient with $10 million for dementia research. Their early research suggests that ultrasound can remove Alzheimer’s disease pathology and restore memory function, with clinical trials set for late-2019.
Another major MRFF investment is a $500 million allocation to set up a new Genomics Health Futures Mission.
Genomics – precision medical care that targets the unique genetic make-up of individuals – is one of the most promising new areas of medical research. The cost of analysing the DNA that makes up a person’s genetic blueprint has dramatically fallen in recent years, opening the potential for new individualised treatments.
“This stuff isn’t science fiction,” bioinformatician Tané Hunter – a co-founder of science and technology collective Future Crunch, said at last year’s Australian Investment Council (formerly known as AVCAL) conference.
“I spend my day writing machine learning and AI algorithms to read the code of life, DNA, to find the genetic changes that are causing particular types of cancer because they are all very different. From this information, we can catch it earlier, monitor patient specific resistance and even create new personalised and targeted drugs to improve patient outcomes.”
Other MRFF-backed missions – programs of work with ambitious objectives – that have been allocated funding include brain cancer ($100 million), mental health ($125 million) and chronic diseases such as diabetes and heart disease ($125 million).
Other funding priorities include clinical trials, clinician researchers, commercialising biomedical and medical technology, and health services research such as the impact of big data.
The Frontier Health and Medical Research Scheme, which will be funded with $240 million over five years, is another slightly different scheme with an eye to the future.
The University of Melbourne’s Heather St John says it could help develop the next big medical breakthrough over the
How Australia’s Medical Research Future Fund will transform healthcare
Viewpoint Edition 1 2019 • 7
next decade – the type of technologies that helped propel companies such as CSL and Cochlear onto the global stage.
“Frontier is looking at what are the big breakthroughs that are happening in emerging technologies that could completely transform the way we deliver health care maybe five or ten years out from now,” she said.
“That might be things like stem cell research, artificial intelligence in medicine, nanobots, bio-medical engineering discoveries… all types of things so it’s quite inter-disciplinary.”
Good health is something that nobody can take for granted but Australians can now count on the MRFF to accelerate these type of life-changing medical treatments. That’s a real investment for the future.
Speak to your ClearView financial adviser about how specific industries can play a part in your investment portfolio. Call us on 132 977 or visit www.clearview.com.au
8 • Viewpoint Edition 1 2019
The second largest economy in the world is about to get even bigger as China continues to open its mainland equity and bond markets to foreign investors.
China is an enigma: its influence on the world is colossal and yet its borders have been largely closed to foreign investors.
However, a series of capital market reforms over the past two decades have finally reached a tipping point, which is likely to prompt a flood of new investment over the coming years.
MSCI, S&P Dow Jones, FTSE Russell and Bloomberg are the largest index providers in the world. They dictate the selection and weighting of assets, most commonly by class or region, providing a benchmark for investors.
And as China has slowly made it easier for foreign investors to buy mainland shares (known as A shares) and bonds, index providers are increasing the proportion of those assets across key benchmarks.
In May 2018, MSCI began a phased addition of 226 organisations’ China A shares to its Emerging Markets Index. Rivals FTSE Russell will begin a similar process in June 2019 and S&P Dow Jones in September 2019. Meanwhile, Bloomberg will begin adding China mainland bonds to its Global Aggregate Index from April 2019.
The reason is access – it is now far simpler for foreign investors to invest in mainland China assets. The breakthrough occurred in December 2016 when the Stock Connect program, which allows international and mainland Chinese investors to simply trade securities in each others’ markets, was expanded to include Shenzhen-traded shares.
While the initial index changes are moderate, the longer-term impact is likely to be seismic. The A shares market is one of the biggest in the world, with more than 3,000 stocks across Chinese
stock exchanges, such as the Shenzhen and Shanghai Stock Exchanges. However, until now foreign investors have largely been restricted to trading H shares: a smaller subset of Chinese stocks which are also listed on the Hong Kong Stock Exchange.
While H shares currently comprise about one-third of the MSCI emerging markets index, the inclusion of A shares could boost that total by a further 16%, bringing China’s weighting to about 42%.
China’s potential impact on the MSCI Emerging Markets Index
MSCI EM Index with 5% China A Shares
MSCI EM Index with 100% China A Shares
Source: MSCI based on data used for MSCI’s May 2018 Semi-Annual Index Review. All figures are approximate.
The promise of growth but with a volatile ride The Australian economy’s fortunes are closely tied with China, which represents our largest export market. China is the second largest economy in the world and posted impressive growth of 6.9% in 2018. However,
its government expects growth to slow this year to 6.5% as it faces major challenges including slowing domestic demand and rising US tariffs on exports.
The performance of mainland A shares has also been a wild ride for investors in recent years. The Shanghai Stock Exchange A Share Index and the Shenzhen Stock Exchange Composite Index lost about one-quarter and one-third respectively over the year to January 7, 2019.
Both indices were trading at less than half the value they achieved in mid-2015 as small, retail investors speculated heavily on the market, which came crashing back down by the end of that year.
However, the addition of China to key indices is likely to bring large, institutional investors to the mainland market which may help dampen volatility. The H shares market, for example, which has historically counted far more institutional investors, has been less volatile.
However, an estimated two-thirds of the approximate US$10 billion China equity market is listed onshore (A shares), with the remainder listed in Hong Kong (H shares) and the US.
Smaller individual investors are still likely to rely on large institutions and professional fund managers to gain access to China. While China provides the potential for higher growth it also comes with substantial risk, which should be allayed as part of a diversified portfolio.
China reforms set to attract a flood of offshore investors
Others 34.3%
China 30.5%
A Shares 0.8%
Korea 15.0%
India 8.3%
Taiwan 11.1%
Others 28.9%
China 25.8%
A Shares 16.2%
Korea 12.7%
India 7.0%
Taiwan 9.4%
8 • Viewpoint Edition 4 2018
Viewpoint Edition 1 2019 • 9
Asset allocation (by %) Products Total performance returns Annualised 5 year 3 year 2 year 1 year
CLEARVIEW PENSION PLAN 2.71% 1.95% 1.17% -0.76%
CLEARVIEW SUPERANNUATION AND ROLL-OVERS 2.20% 1.39% 0.78% -1.18%
CLEARVIEW SUPERANNUATION AND ROLL-OVERS 4.79% 3.87% 2.30% -2.49%
Assertive
10%
42.5%
30.5%
4% 4%3%
3%3%
5%
7%
5%
5%
8.5%
6.5%
25%
5%5%
40%
5%
35%
15%
5%10%
10%
10%15%
5%
10%
25%
20%
22.5%
17.5%
15%
5%
25%
17.5%
12.5%
15%
10%
International EquitiesAustralian EquitiesListed PropertyInternational Fixed InterestAustralian Fixed InterestListed InfrastructureEmerging MarketsCash and Short Term Securities
Asset AllocationPerformance information as at 31 December 2018. Past performance is not an indication of future performance. The value of an investment may rise and fall. ClearView Pension Plan previously known as ClearView Allocated Pension. The asset allocations shown are the target allocations for each fund. Due to market movement and timing of rebalances the actual allocation at any point in time may be up to 2% above or below those displayed.
* Closed to additional/new investments and inward switches.
** Closed to additional/new investments.
^ ClearView Life Assurance Limited guarantees that the price of Guaranteed Cash Units will not fall.
Fund returns December 2018
10 • Viewpoint Edition 1 2019
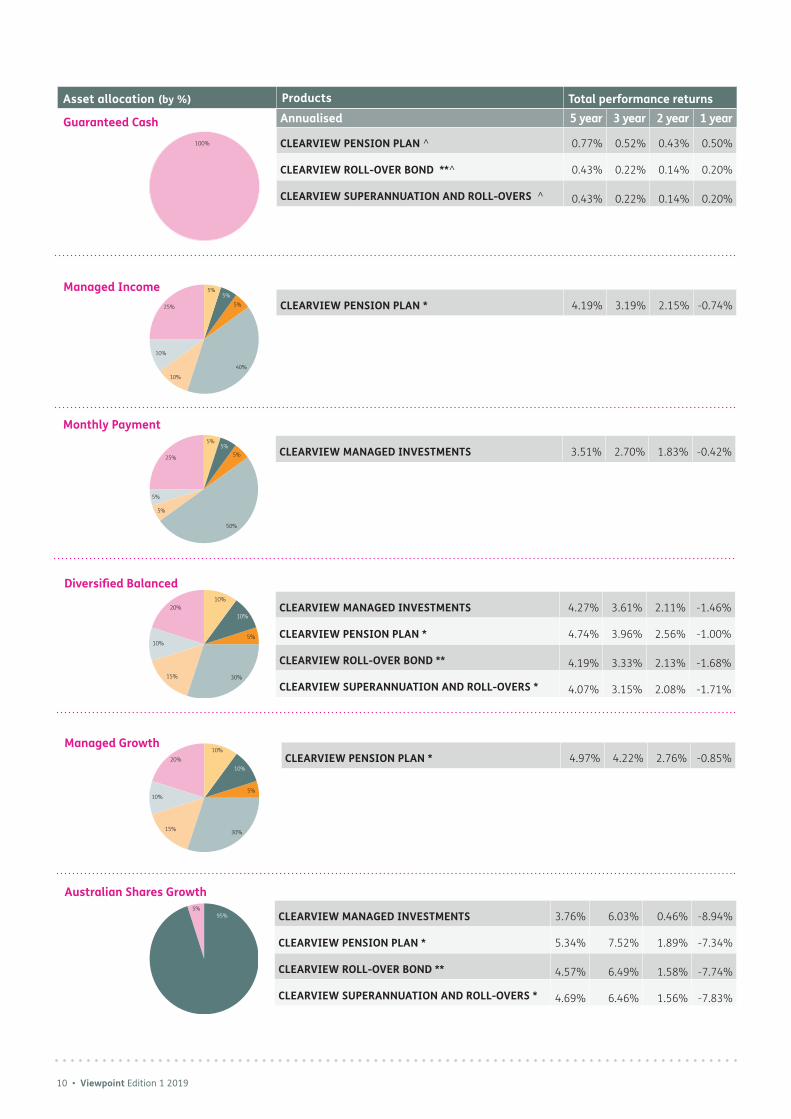
Asset allocation (by %) Products Total performance returns Annualised 5 year 3 year 2 year 1 year
CLEARVIEW PENSION PLAN ^ 0.77% 0.52% 0.43% 0.50%
CLEARVIEW ROLL-OVER BOND **^ 0.43% 0.22% 0.14% 0.20%
CLEARVIEW SUPERANNUATION AND ROLL-OVERS ^ 0.43% 0.22% 0.14% 0.20%
CLEARVIEW ROLL-OVER BOND ** 4.57% 6.49% 1.58% -7.74%
CLEARVIEW SUPERANNUATION AND ROLL-OVERS * 4.69% 6.46% 1.56% -7.83%
CLEARVIEW PENSION PLAN * 4.19% 3.19% 2.15% -0.74%
Managed Income5%
40%
10%
10%
5%5%
25%
50%
5%
5%
25%
5%5%
5%
10%5%
15% 30%
10%
10%20%
5%95%
Managed GrowthCLEARVIEW PENSION PLAN * 4.97% 4.22% 2.76% -0.85%
10%5%
15% 30%
10%
10%20%
100%
Viewpoint Edition 1 2019 • 11
Investors please note: Past performance is not a basis for assessing future performance. Future performance is not guaranteed by the Responsible Entity, Manager or the Trustee, as applicable. The unit prices used for determining performance calculations are based on exit prices. Performance figures are net of ongoing management fees and applicable government taxes or duties, and do not include entry or exit fees. Performance figures for the ClearView Managed Investments assume the reinvestment of distributions. Unit prices do not take into account any entry or exit fees applicable to the product. Unit prices are dependent on economic conditions, investment management, future taxation and management charges. ClearView Life Assurance Limited, trading as ClearView Life, guarantees that the price of Guaranteed Cash units will not fall. The value of other types of units may rise and fall. ClearView Superannuation and Roll-overs and ClearView Pension Plans are issued by ClearView Life Nominees Pty Limited as Trustee of the ClearView Retirement Plan. ClearView Managed Investments are issued by ClearView Financial Management Limited as the responsible entity. Full details for the above products and their terms and conditions are described in the relevant Product Disclosure Statements (PDS). You should consider the relevant PDS in making a decision whether to buy or continue to hold the product. You can obtain a PDS for a product by calling ClearView on 132 977. The ClearView Savings Bond and ClearView Roll-over Bond are closed to further investment and are issued by ClearView Life Assurance Limited trading as ClearView Life. ClearView Financial Management Limited ABN 99 067 544 549 AFS Licence No. 227677. ClearView Life Nominees Pty Limited ABN 37 003 682 175 AFS Licence No. 227683 RSE Licence No. L0000802. ClearView Life Assurance Limited ABN 12 000 021 581 AFS Licence No. 227682, which also trades as ClearView Life.
Asset allocation (by %) Products Total performance returns Annualised 5 year 3 year 2 year 1 year
CLEARVIEW SAVINGS BOND **^ 0.08% 0.00% 0.00% 0.00%
International EquitiesAustralian EquitiesListed PropertyInternational Fixed InterestAustralian Fixed InterestListed InfrastructureEmerging MarketsCash and Short Term Securities
Asset AllocationPerformance information as at 31 December 2018. Past performance is not an indication of future performance. The value of an investment may rise and fall. ClearView Pension Plan previously known as ClearView Allocated Pension. The asset allocations shown are the target allocations for each fund. Due to market movement and timing of rebalances the actual allocation at any point in time may be up to 2% above or below those displayed.
* Closed to additional/new investments and inward switches.
** Closed to additional/new investments.
^ ClearView Life Assurance Limited guarantees that the price of Guaranteed Cash Units will not fall.
CLEARVIEW ROLL-OVER BOND ** 4.68% 3.72% 2.62% -1.16%
CLEARVIEW SAVINGS BOND ** 2.95% 2.26% 1.15% -1.71%
CLEARVIEW SUPERANNUATION AND ROLL-OVERS * 4.68% 3.81% 2.60% -1.20%
CLEARVIEW ROLL-OVER BOND ** 3.44% 2.42% 1.59% -0.85%
CLEARVIEW SUPERANNUATION AND ROLL-OVERS * 3.39% 2.26% 1.50% -1.49%
Guaranteed
Managed Units
10%5%
15%
30%
10%
10%20%
30%
5%
5%
20%
5%
25%
15%
15%
15%
5%
5%
40%10%
10%
5%5%
25%
100%
12 • Viewpoint Edition 1 2019
After a strong opening to the year, markets ended 2018 on a weak note as concerns about global trade weighed down investor sentiment.
Investors endured stormy weather across global markets in the final quarter of 2018, but the new year has opened with some rays of light.
The MSCI World (ex-Australia) Index was down 11.1% over the December quarter amid fears that the ongoing trade stoush between China and the US may put the brakes on strong global economic growth.
The US Federal Reserve’s ongoing slow rate hiking process in response to strong growth also added to concerns. The S&P 500 total return index was down 13.52% in the final quarter of 2018 as once high-flying technology giants such as Facebook, Apple, Amazon, Netflix and Google ran out of steam, falling by more than 20% from their highs.
However, by January 11, 2019, the S&P 500 had climbed by more than 10% from the 20-month low it touched around Christmas as investor hopes for a US-Chinese trade deal rose again and the US Federal Reserve softened expectations for future rate hikes.
Global concerns also dampened local markets with the S&P/ASX 200 total return index losing 8.24% over the December quarter, although it also posted some positive gains in early January.
While equity markets proved volatile during the December quarter, historically defensive assets such as cash and bonds remained in positive territory, once again proving the value of diversification. The Bloomberg AusBond Composite 0+Y TR AUD Index delivered a gain of 2.24% in the December quarter.
Medium-term returns for growth assets also remain strong. The S&P/ASX 200’s average yearly return over the three years ended December 2018 was 6.69% while the S&P 500 total return index posted an average 9.26% annualised return over the same period.
While there is some uncertainty ahead, Australian economic growth remains solid and unemployment is low at 5% although the ongoing end to the recent housing boom may weaken consumer spending.
Australian residential property prices fell 4.8% through 2018 partly
due to tighter lending conditions and a regulatory clampdown on interest only loans. The downturn was again led by weakness in Sydney and Melbourne, where the average dwelling declined 3.9% and 3.2% respectively in the December quarter.
The Reserve Bank of Australia again kept official interest rates on hold at a historic low of 1.5% as wages growth remains weak and inflation low. On the positive side, consumer spending is also likely to be boosted by a 40% fall in oil prices since their October highs.
In periods of market volatility, investors should maintain an eye on the long-term, ensure that their investment portfolios are well diversified, and structured to achieve their personal goals.