76
Report Completed 01.24.13 by Leigh Ann Hislop, INTEL
| Date post: | 22-May-2018 |
| Category: |
Documents |
| Upload: | truongtuyen |
| View: | 216 times |
| Download: | 1 times |
Report Completed 01.24.13 by Leigh Ann Hislop, INTEL
Area of Responsibility 2
Dispatch Personnel 3
Fire Suppression Resources 5
Fire Activity Historical Comparisons 6
Fire Activity Statistics by Agency 7
Fire Activity Boise District BLM 8
Fire Activity Boise National Forest 9
Fire Activity Idaho Department of Lands Southwest 10
Fire Activity Significant Acreage 11
Logistical Activity 13
Local Resources Activity - Crews 14
Local Resources Activity – Engines 15
Local Resources Activity – Aircraft 16
Local Resources Activity – Tanker Base 18
Fuels Management 20
Boise BLM Mitigation. Prevention. Investigation 21
Range Fire Protection Districts 24
Boise National Forest Prevention 25
Mobilization Center 28
Fire Danger Rating Areas and Map 29
Remote Automated Weather Stations 30
Fire Danger Rating Seasonal Outputs 31
Weather Summary 33
Seasonal Weather and Severity – SNOTEL Information 35
Lightning Summary 38
Fuel Moisture 38
Live Fuel Moisture 42
1
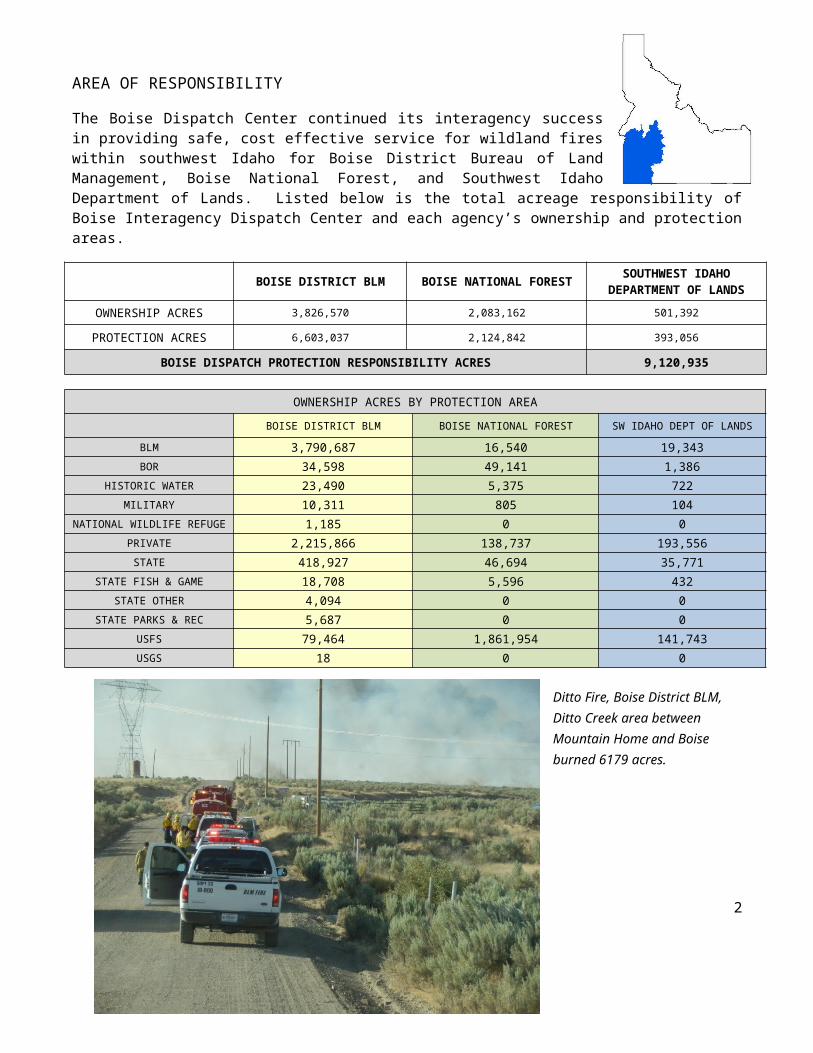
AREA OF RESPONSIBILITY
The Boise Dispatch Center continued its interagency success in providing safe, cost effective service for wildland fires within southwest Idaho for Boise District Bureau of Land Management, Boise National Forest, and Southwest Idaho Department of Lands. Listed below is the total acreage responsibility of Boise Interagency Dispatch Center and each agency’s ownership and protection areas.
BOISE DISTRICT BLM BOISE NATIONAL FOREST SOUTHWEST IDAHO DEPARTMENT OF LANDS
OWNERSHIP ACRES 3,826,570 2,083,162 501,392
PROTECTION ACRES 6,603,037 2,124,842 393,056
BOISE DISPATCH PROTECTION RESPONSIBILITY ACRES 9,120,935
OWNERSHIP ACRES BY PROTECTION AREA
BOISE DISTRICT BLM BOISE NATIONAL FOREST SW IDAHO DEPT OF LANDS
BLM 3,790,687 16,540 19,343BOR 34,598 49,141 1,386
HISTORIC WATER 23,490 5,375 722MILITARY 10,311 805 104
NATIONAL WILDLIFE REFUGE 1,185 0 0PRIVATE 2,215,866 138,737 193,556STATE 418,927 46,694 35,771
STATE FISH & GAME 18,708 5,596 432STATE OTHER 4,094 0 0
STATE PARKS & REC 5,687 0 0USFS 79,464 1,861,954 141,743USGS 18 0 0
Ditto Fire, Boise District BLM, Ditto Creek area between Mountain Home and Boise burned 6179 acres.
2
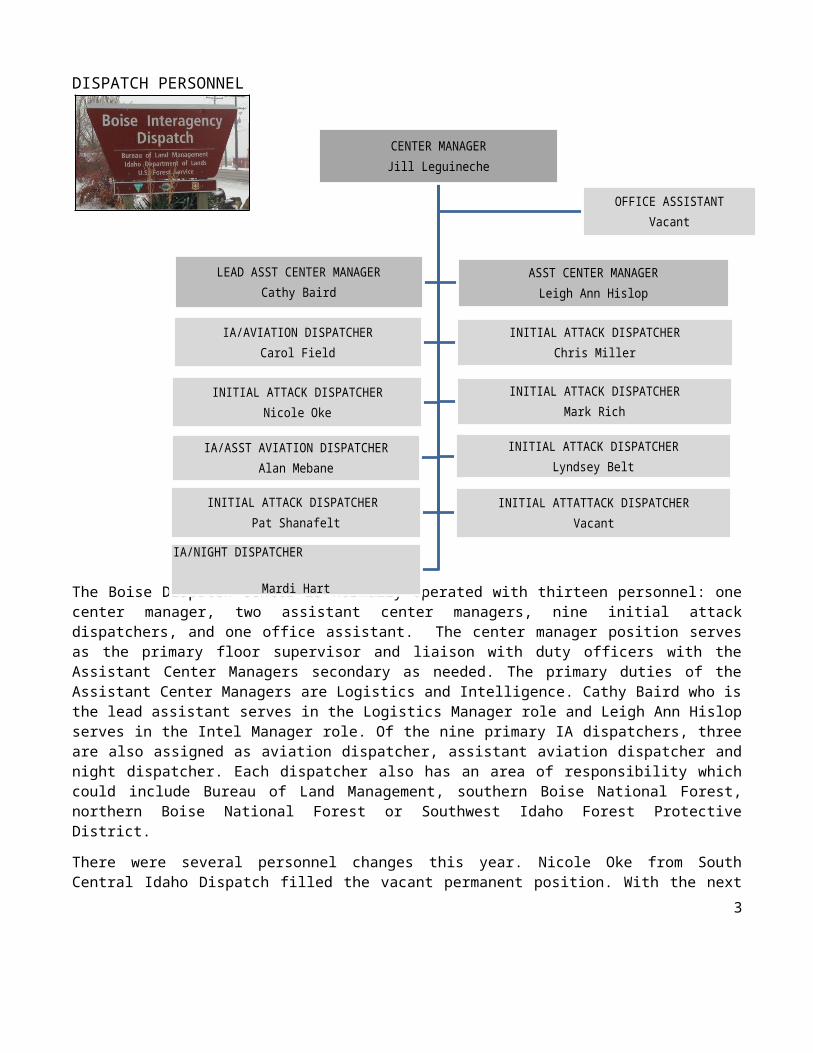
DISPATCH PERSONNEL
The Boise Dispatch Center is normally operated with thirteen personnel: one center manager, two assistant center managers, nine initial attack dispatchers, and one office assistant. The center manager position serves as the primary floor supervisor and liaison with duty officers with the Assistant Center Managers secondary as needed. The primary duties of the Assistant Center Managers are Logistics and Intelligence. Cathy Baird who is the lead assistant serves in the Logistics Manager role and Leigh Ann Hislop serves in the Intel Manager role. Of the nine primary IA dispatchers, three are also assigned as aviation dispatcher, assistant aviation dispatcher and night dispatcher. Each dispatcher also has an area of responsibility which could include Bureau of Land Management, southern Boise National Forest, northern Boise National Forest or Southwest Idaho Forest Protective District.
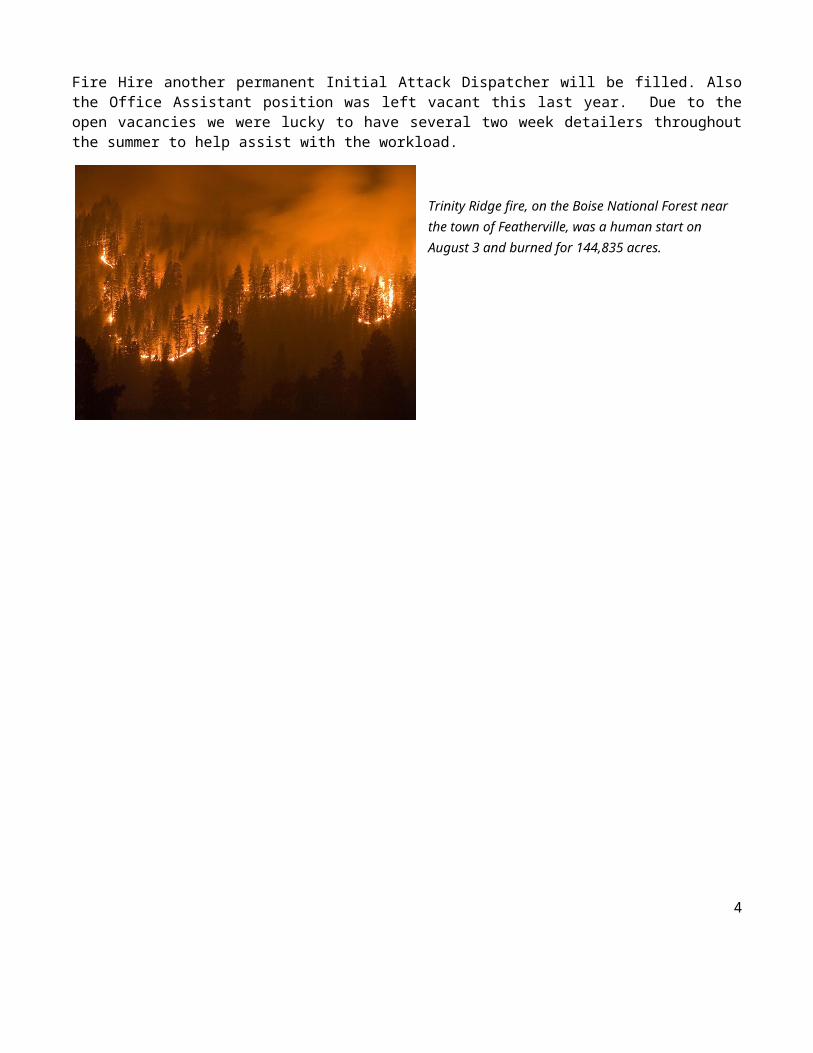
There were several personnel changes this year. Nicole Oke from South Central Idaho Dispatch filled the vacant permanent position. With the next Fire Hire another permanent Initial Attack Dispatcher will be filled. Also the Office Assistant position was left vacant this last year. Due to the open vacancies we were lucky to have several two week detailers throughout the summer to help assist with the workload.
Trinity Ridge fire, on the Boise National Forest near the town of Featherville, was a human start on August 3 and burned for 144,835 acres.
3
CENTER MANAGERJill Leguineche
LEAD ASST CENTER MANAGERCathy Baird
OFFICE ASSISTANTVacant
ASST CENTER MANAGERLeigh Ann Hislop
INITIAL ATTACK DISPATCHERChris Miller
IA/ASST AVIATION DISPATCHERAlan Mebane
INITIAL ATTACK DISPATCHERLyndsey Belt
IA/AVIATION DISPATCHERCarol Field
INITIAL ATTACK DISPATCHERMark Rich
INITIAL ATTACK DISPATCHERNicole Oke
INITIAL ATTATTACK DISPATCHERVacant
INITIAL ATTACK DISPATCHER Pat Shanafelt
IA/NIGHT DISPATCHER Mardi Hart
Besides normal dispatch duties, the staff also completed other assignments which included: Jill Leguineche: Great Basin Incident Business Committee Dispatch Representative. Fire assignment
to Wyoming Cathy Baird: EDSP fire assignment Arizona, Primary Expanded Dispatch Supervisor locally from July 1
through the middle of October, FireStat Coordinator, WildCAD representative, Member of the Forest Safety Committee, Member of the Dispatch Steering Committee
Leigh Ann Hislop: 209/SitRpt Test Group. RAWS Coordinator. An IQCS Account Manager. Lead Instructor for IQCS. Instructor for WIMS. DI-1202 Report Coordinator.
Nicole Oke: Lead Instructor for D110. Instructor for D312. Fire assignment to Colorado. Carol Field: Lead Instructor for D312. Instructor for Helicopter Manager Course. Alan Mebane: Fire assignment to Arizona. Fall/Winter detail to the BLM Great Basin Seed Warehouse.
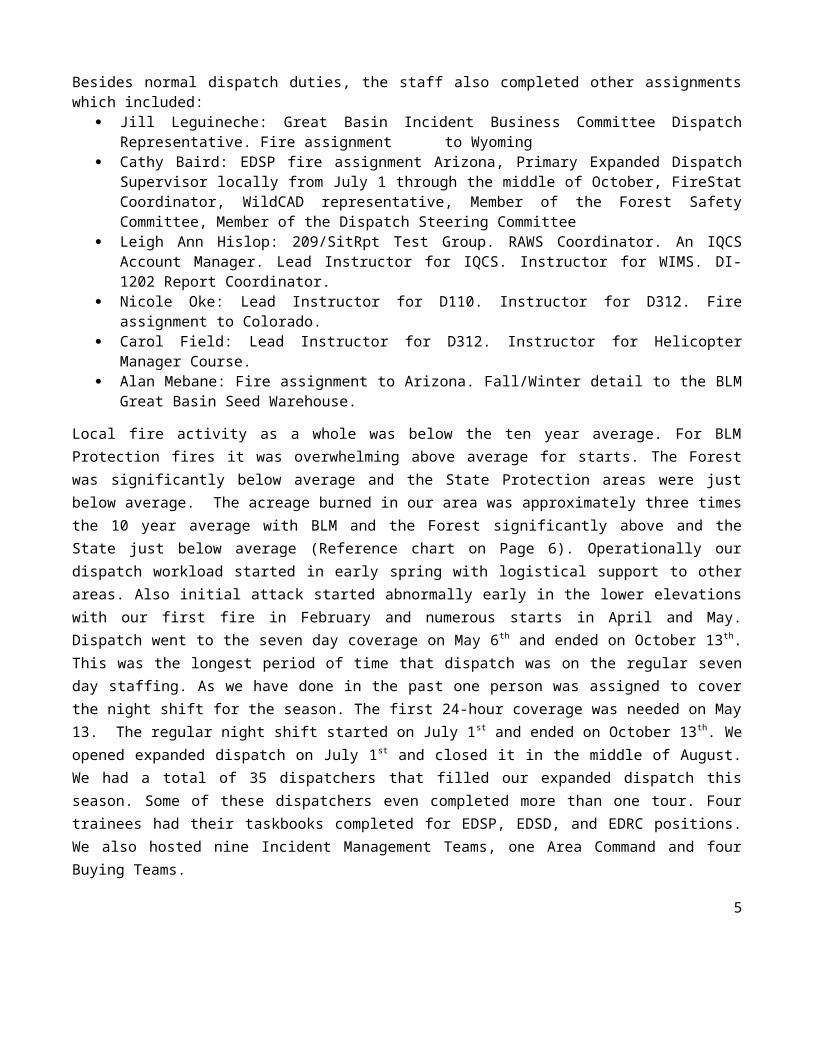
Local fire activity as a whole was below the ten year average. For BLM Protection fires it was overwhelming above average for starts. The Forest was significantly below average and the State Protection areas were just below average. The acreage burned in our area was approximately three times the 10 year average with BLM and the Forest significantly above and the State just below average (Reference chart on Page 6). Operationally our dispatch workload started in early spring with logistical support to other areas. Also initial attack started abnormally early in the lower elevations with our first fire in February and numerous starts in April and May. Dispatch went to the seven day coverage on May 6 th and ended on October 13th. This was the longest period of time that dispatch was on the regular seven day staffing. As we have done in the past one person was assigned to cover the night shift for the season. The first 24-hour coverage was needed on May 13. The regular night shift started on July 1st and ended on October 13th. We opened expanded dispatch on July 1st and closed it in the middle of August. We had a total of 35 dispatchers that filled our expanded dispatch this season. Some of these dispatchers even completed more than one tour. Four trainees had their taskbooks completed for EDSP, EDSD, and EDRC positions. We also hosted nine Incident Management Teams, one Area Command and four Buying Teams.
INCIDENT IMT TYPE IMT NAME TEAM HOME UNITTRINITY RIDGE TYPE 1 LUND EAST BASINTRINITY RIDGE TYPE 1 HARVEY EAST BASINTRINITY RIDGE TYPE 2 SUWYN EAST BASINTRINITY RIDGE BUYING HUETHER ROCKY MOUNTAINTRINITY RIDGE BUYING PAUL NORTHWEST
TRINITY RIDGE WEST TYPE 1 KURTH ALASKATRINITY RIDGE WEST TYPE 1 QUESINBERRY SOUTHERNTRINITY RIDGE WEST BUYING SCHILZ NORTHERN ROCKIES
KARNEY TYPE 2 WILDE WEST BASINKARNEY BUYING OWEN NORTHWEST
ISO 2012 SUPPORT TYPE 2 LEITCH NORTHWESTSPRINGS TYPE 1 HAHNENBERG ROCKY MOUNTAINAVELENE TYPE 1 LUND EAST BASIN
EGB PREPOSITION AREA COMMAND WHITNEY NATIONAL
Due to our dispatch location being in close proximity to the National Interagency Fire Center, we were honored to have numerous tours from many different offices and countries that included: Morocco, Russia, Australia, New Zealand, Norway, Interior Under-Secretary Office, ROSS Group, IRWIN Group, and BLM-CIO.FIRE SUPPRESSION RESOURCES
4
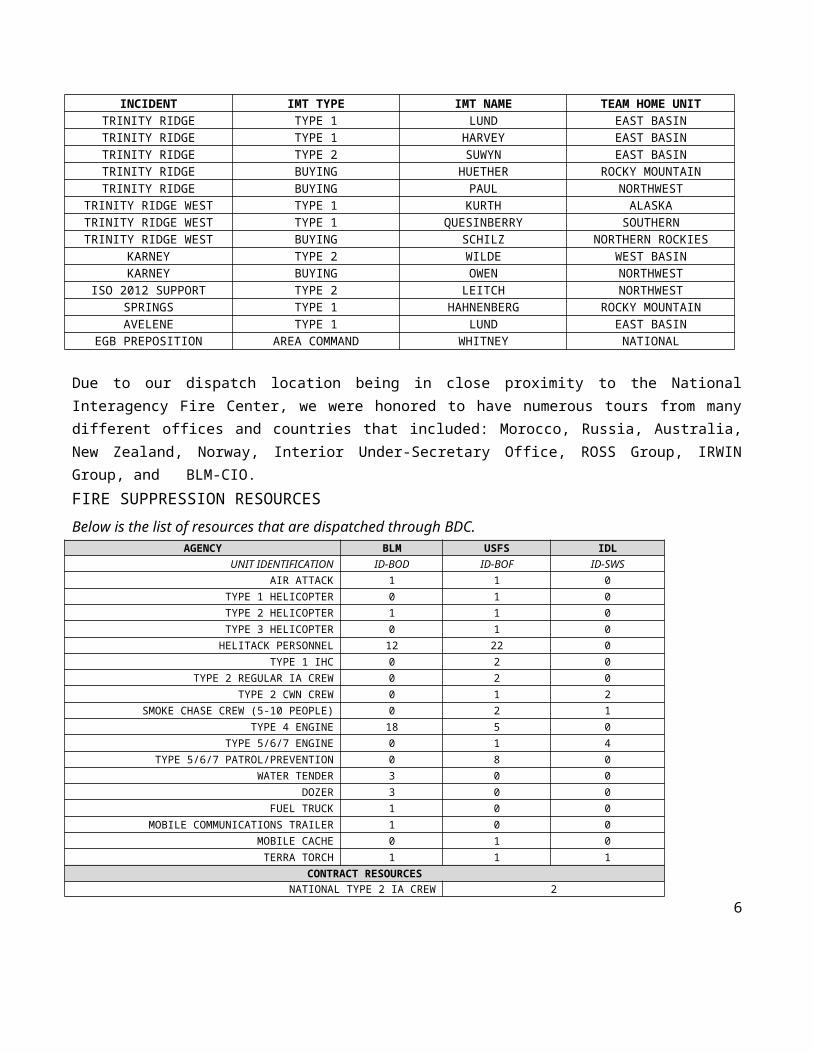
Below is the list of resources that are dispatched through BDC.AGENCY BLM USFS IDL
UNIT IDENTIFICATION ID-BOD ID-BOF ID-SWSAIR ATTACK 1 1 0
TYPE 1 HELICOPTER 0 1 0TYPE 2 HELICOPTER 1 1 0TYPE 3 HELICOPTER 0 1 0
HELITACK PERSONNEL 12 22 0TYPE 1 IHC 0 2 0
TYPE 2 REGULAR IA CREW 0 2 0TYPE 2 CWN CREW 0 1 2
SMOKE CHASE CREW (5-10 PEOPLE) 0 2 1TYPE 4 ENGINE 18 5 0
TYPE 5/6/7 ENGINE 0 1 4TYPE 5/6/7 PATROL/PREVENTION 0 8 0
WATER TENDER 3 0 0DOZER 3 0 0
FUEL TRUCK 1 0 0MOBILE COMMUNICATIONS TRAILER 1 0 0
MOBILE CACHE 0 1 0TERRA TORCH 1 1 1
CONTRACT RESOURCESNATIONAL TYPE 2 IA CREW 2
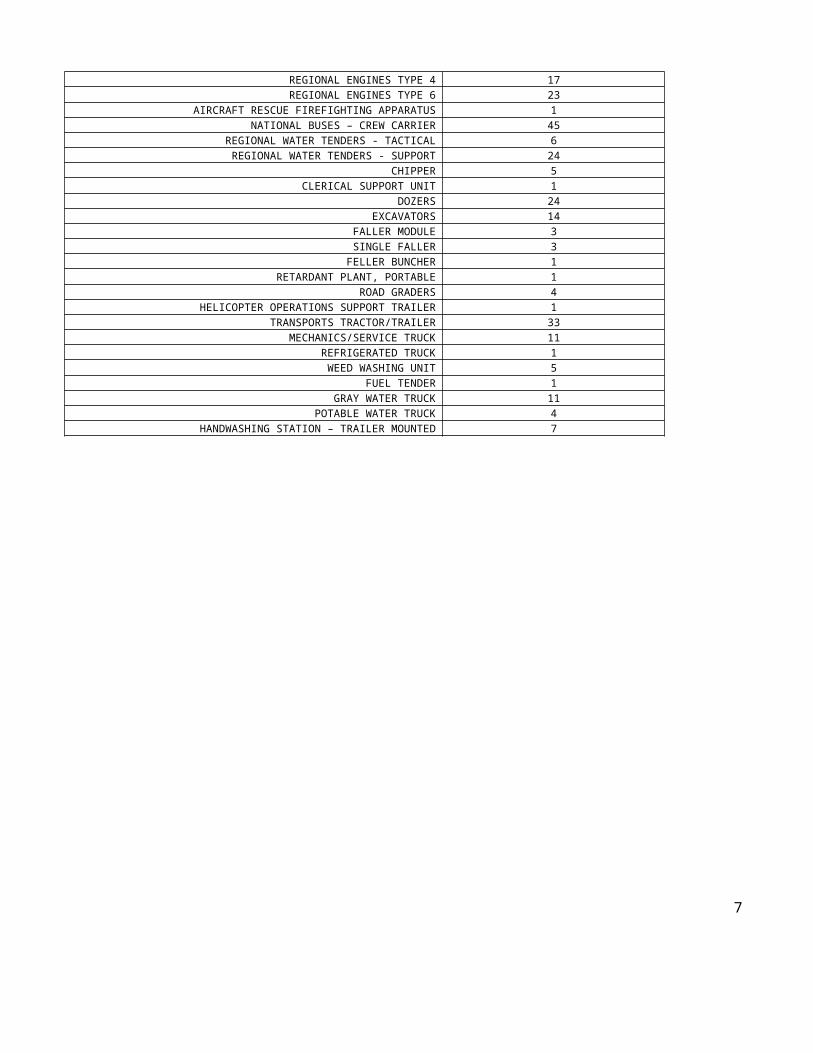
REGIONAL ENGINES TYPE 4 17REGIONAL ENGINES TYPE 6 23
AIRCRAFT RESCUE FIREFIGHTING APPARATUS 1NATIONAL BUSES – CREW CARRIER 45
REGIONAL WATER TENDERS - TACTICAL 6REGIONAL WATER TENDERS - SUPPORT 24
CHIPPER 5CLERICAL SUPPORT UNIT 1
DOZERS 24EXCAVATORS 14
FALLER MODULE 3SINGLE FALLER 3
FELLER BUNCHER 1RETARDANT PLANT, PORTABLE 1
ROAD GRADERS 4HELICOPTER OPERATIONS SUPPORT TRAILER 1
TRANSPORTS TRACTOR/TRAILER 33MECHANICS/SERVICE TRUCK 11
REFRIGERATED TRUCK 1WEED WASHING UNIT 5
FUEL TENDER 1GRAY WATER TRUCK 11
POTABLE WATER TRUCK 4HANDWASHING STATION – TRAILER MOUNTED 7
5
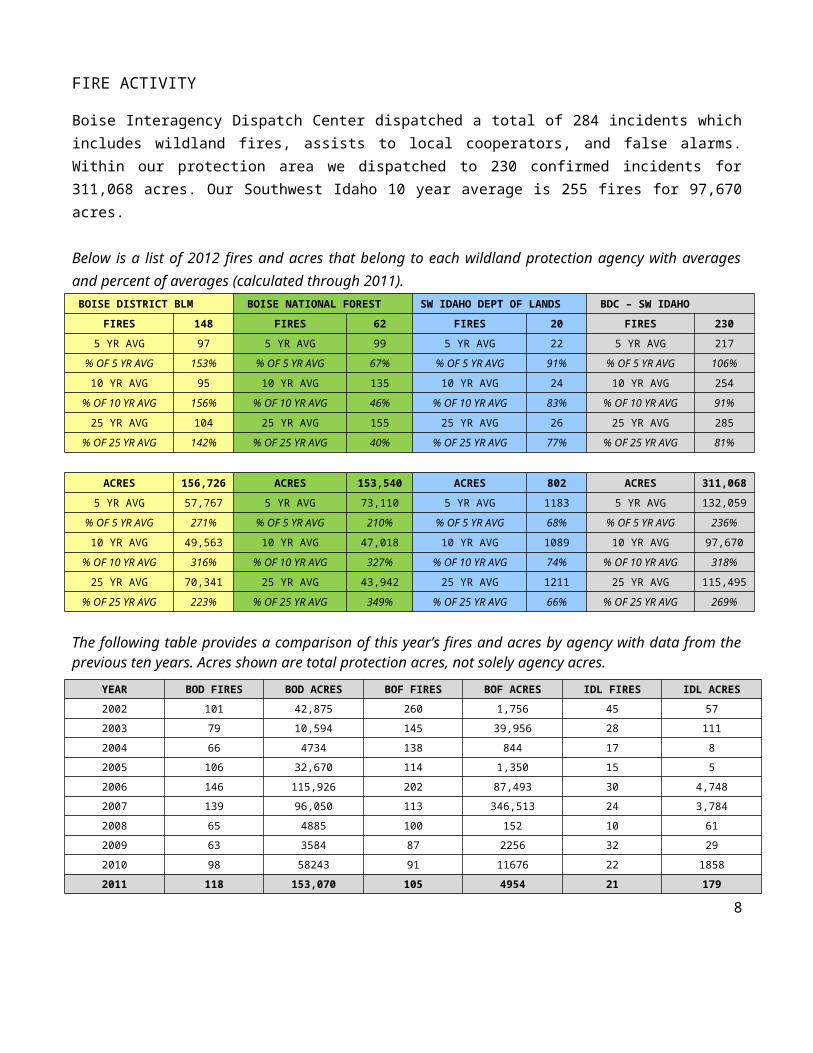
FIRE ACTIVITY
Boise Interagency Dispatch Center dispatched a total of 284 incidents which includes wildland fires, assists to local cooperators, and false alarms. Within our protection area we dispatched to 230 confirmed incidents for 311,068 acres. Our Southwest Idaho 10 year average is 255 fires for 97,670 acres.
Below is a list of 2012 fires and acres that belong to each wildland protection agency with averages and percent of averages (calculated through 2011). BOISE DISTRICT BLM BOISE NATIONAL FOREST SW IDAHO DEPT OF LANDS BDC – SW IDAHO
FIRES 148 FIRES 62 FIRES 20 FIRES 230
5 YR AVG 97 5 YR AVG 99 5 YR AVG 22 5 YR AVG 217
% OF 5 YR AVG 153% % OF 5 YR AVG 67% % OF 5 YR AVG 91% % OF 5 YR AVG 106%
10 YR AVG 95 10 YR AVG 135 10 YR AVG 24 10 YR AVG 254
% OF 10 YR AVG 156% % OF 10 YR AVG 46% % OF 10 YR AVG 83% % OF 10 YR AVG 91%
25 YR AVG 104 25 YR AVG 155 25 YR AVG 26 25 YR AVG 285
% OF 25 YR AVG 142% % OF 25 YR AVG 40% % OF 25 YR AVG 77% % OF 25 YR AVG 81%
ACRES 156,726 ACRES 153,540 ACRES 802 ACRES 311,068
5 YR AVG 57,767 5 YR AVG 73,110 5 YR AVG 1183 5 YR AVG 132,059
% OF 5 YR AVG 271% % OF 5 YR AVG 210% % OF 5 YR AVG 68% % OF 5 YR AVG 236%
10 YR AVG 49,563 10 YR AVG 47,018 10 YR AVG 1089 10 YR AVG 97,670
% OF 10 YR AVG 316% % OF 10 YR AVG 327% % OF 10 YR AVG 74% % OF 10 YR AVG 318%
25 YR AVG 70,341 25 YR AVG 43,942 25 YR AVG 1211 25 YR AVG 115,495
% OF 25 YR AVG 223% % OF 25 YR AVG 349% % OF 25 YR AVG 66% % OF 25 YR AVG 269%
The following table provides a comparison of this year’s fires and acres by agency with data from the previous ten years. Acres shown are total protection acres, not solely agency acres.
YEAR BOD FIRES BOD ACRES BOF FIRES BOF ACRES IDL FIRES IDL ACRES
2002 101 42,875 260 1,756 45 57
2003 79 10,594 145 39,956 28 111
2004 66 4734 138 844 17 8
2005 106 32,670 114 1,350 15 5
2006 146 115,926 202 87,493 30 4,748
2007 139 96,050 113 346,513 24 3,784
2008 65 4885 100 152 10 61
2009 63 3584 87 2256 32 29
2010 98 58243 91 11676 22 1858
2011 118 153,070 105 4954 21 179
10 YR AVG2002-2011 96 49,563 135 47,018 24 1089
6
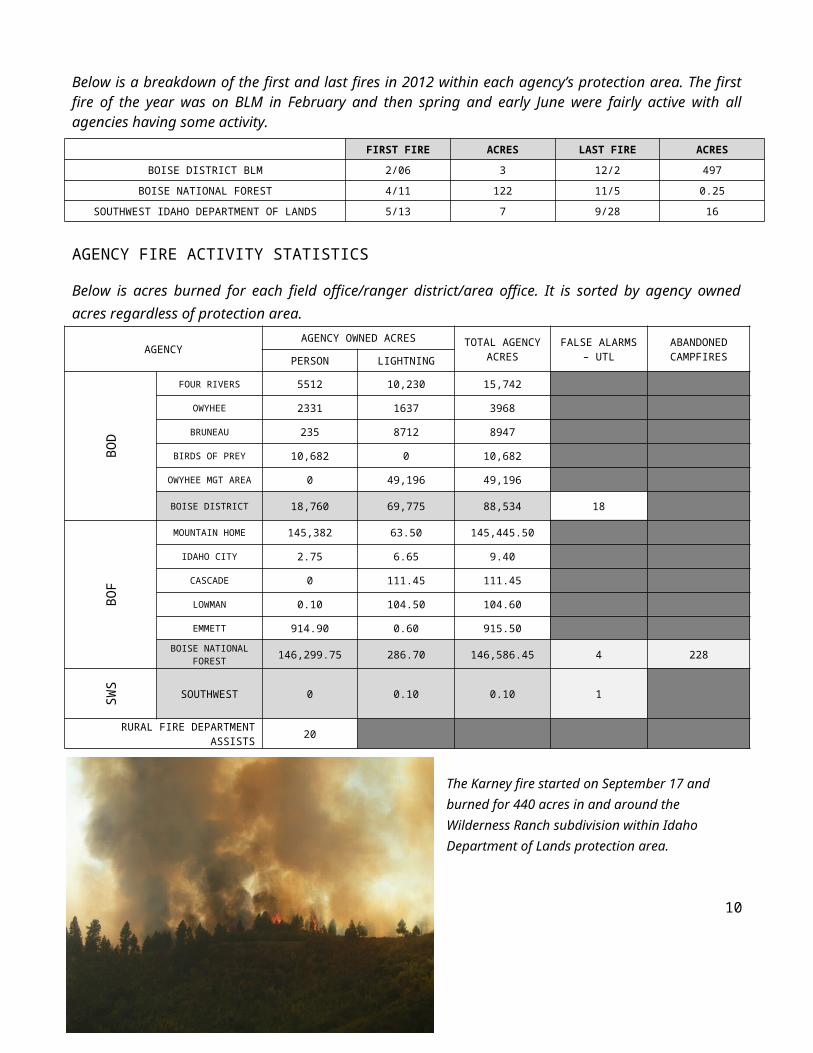
Below is a breakdown of the first and last fires in 2012 within each agency’s protection area. The first fire of the year was on BLM in February and then spring and early June were fairly active with all agencies having some activity.
FIRST FIRE ACRES LAST FIRE ACRES
BOISE DISTRICT BLM 2/06 3 12/2 497
BOISE NATIONAL FOREST 4/11 122 11/5 0.25
SOUTHWEST IDAHO DEPARTMENT OF LANDS 5/13 7 9/28 16
AGENCY FIRE ACTIVITY STATISTICS
Below is acres burned for each field office/ranger district/area office. It is sorted by agency owned acres regardless of protection area.
AGENCYAGENCY OWNED ACRES TOTAL
AGENCY ACRES
FALSE ALARMS – UTL
ABANDONED CAMPFIRESPERSON LIGHTNING
BO
D
FOUR RIVERS 5512 10,230 15,742
OWYHEE 2331 1637 3968
BRUNEAU 235 8712 8947
BIRDS OF PREY 10,682 0 10,682
OWYHEE MGT AREA 0 49,196 49,196
BOISE DISTRICT 18,760 69,775 88,534 18
BO
F
MOUNTAIN HOME 145,382 63.50 145,445.50
IDAHO CITY 2.75 6.65 9.40
CASCADE 0 111.45 111.45
LOWMAN 0.10 104.50 104.60
EMMETT 914.90 0.60 915.50
BOISE NATIONAL FOREST 146,299.75 286.70 146,586.45 4 228
SW
S
SOUTHWEST 0 0.10 0.10 1
RURAL FIRE DEPARTMENT ASSISTS 20
The Karney fire started on September 17 and burned for 440 acres in and around the Wilderness Ranch subdivision within Idaho Department of Lands protection area.
7
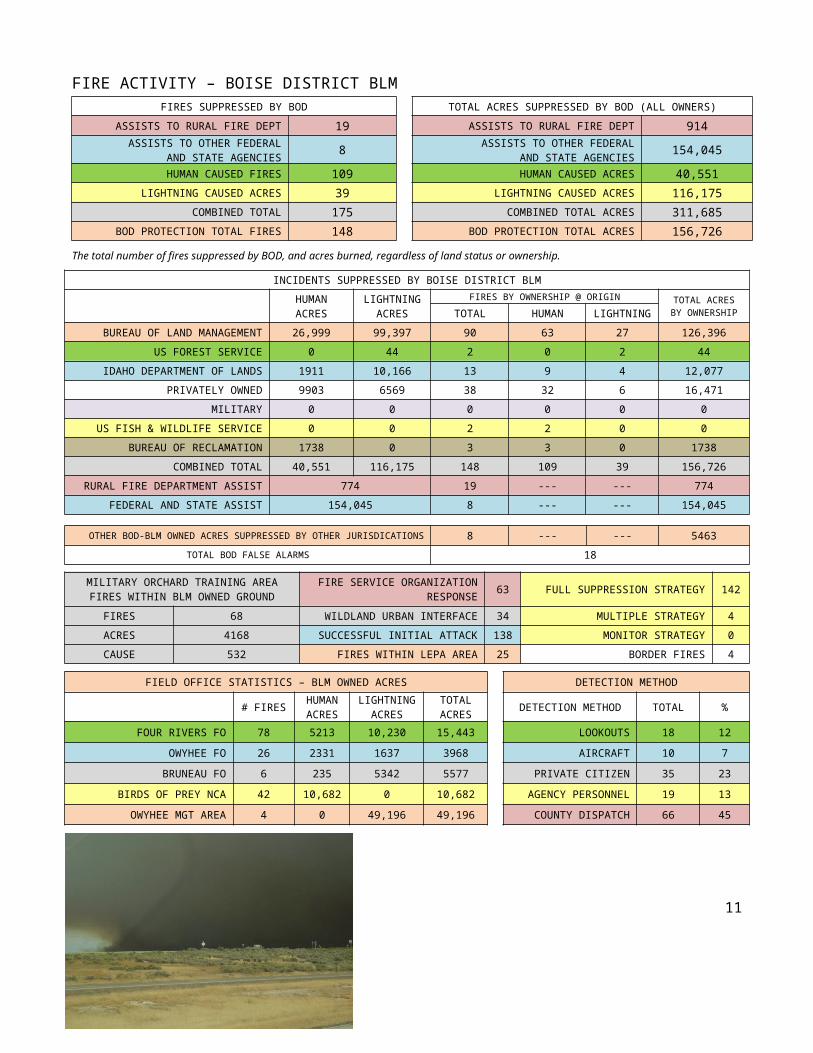
FIRE ACTIVITY – BOISE DISTRICT BLMFIRES SUPPRESSED BY BOD TOTAL ACRES SUPPRESSED BY BOD (ALL OWNERS)
ASSISTS TO RURAL FIRE DEPT 19 ASSISTS TO RURAL FIRE DEPT 914ASSISTS TO OTHER FEDERAL
AND STATE AGENCIES 8 ASSISTS TO OTHER FEDERAL AND STATE AGENCIES 154,045
HUMAN CAUSED FIRES 109 HUMAN CAUSED ACRES 40,551LIGHTNING CAUSED ACRES 39 LIGHTNING CAUSED ACRES 116,175
COMBINED TOTAL 175 COMBINED TOTAL ACRES 311,685BOD PROTECTION TOTAL FIRES 148 BOD PROTECTION TOTAL ACRES 156,726
The total number of fires suppressed by BOD, and acres burned, regardless of land status or ownership.
INCIDENTS SUPPRESSED BY BOISE DISTRICT BLM
HUMAN ACRES
LIGHTNING ACRES
FIRES BY OWNERSHIP @ ORIGIN TOTAL ACRES BY OWNERSHIPTOTAL HUMAN LIGHTNING
BUREAU OF LAND MANAGEMENT 26,999 99,397 90 63 27 126,396
US FOREST SERVICE 0 44 2 0 2 44
IDAHO DEPARTMENT OF LANDS 1911 10,166 13 9 4 12,077
PRIVATELY OWNED 9903 6569 38 32 6 16,471
MILITARY 0 0 0 0 0 0
US FISH & WILDLIFE SERVICE 0 0 2 2 0 0
BUREAU OF RECLAMATION 1738 0 3 3 0 1738
COMBINED TOTAL 40,551 116,175 148 109 39 156,726
RURAL FIRE DEPARTMENT ASSIST 774 19 --- --- 774
FEDERAL AND STATE ASSIST 154,045 8 --- --- 154,045
OTHER BOD-BLM OWNED ACRES SUPPRESSED BY OTHER JURISDICATIONS 8 --- --- 5463
TOTAL BOD FALSE ALARMS 18
MILITARY ORCHARD TRAINING AREA FIRES WITHIN BLM OWNED GROUND
FIRE SERVICE ORGANIZATION RESPONSE 63 FULL SUPPRESSION STRATEGY 142
FIRES 68 WILDLAND URBAN INTERFACE 34 MULTIPLE STRATEGY 4
ACRES 4168 SUCCESSFUL INITIAL ATTACK 138 MONITOR STRATEGY 0
CAUSE 532 FIRES WITHIN LEPA AREA 25 BORDER FIRES 4
FIELD OFFICE STATISTICS – BLM OWNED ACRES DETECTION METHOD
# FIRES HUMAN ACRES
LIGHTNING ACRES
TOTAL ACRES DETECTION METHOD TOTAL %
FOUR RIVERS FO 78 5213 10,230 15,443 LOOKOUTS 18 12
OWYHEE FO 26 2331 1637 3968 AIRCRAFT 10 7
BRUNEAU FO 6 235 5342 5577 PRIVATE CITIZEN 35 23
BIRDS OF PREY NCA 42 10,682 0 10,682 AGENCY PERSONNEL 19 13
OWYHEE MGT AREA 4 0 49,196 49,196 COUNTY DISPATCH 66 45
Resources driving to the Benwalk fire that occurred on July 9 and burned for 29,100 acres and threatened numerous structures in Mountain Home
8

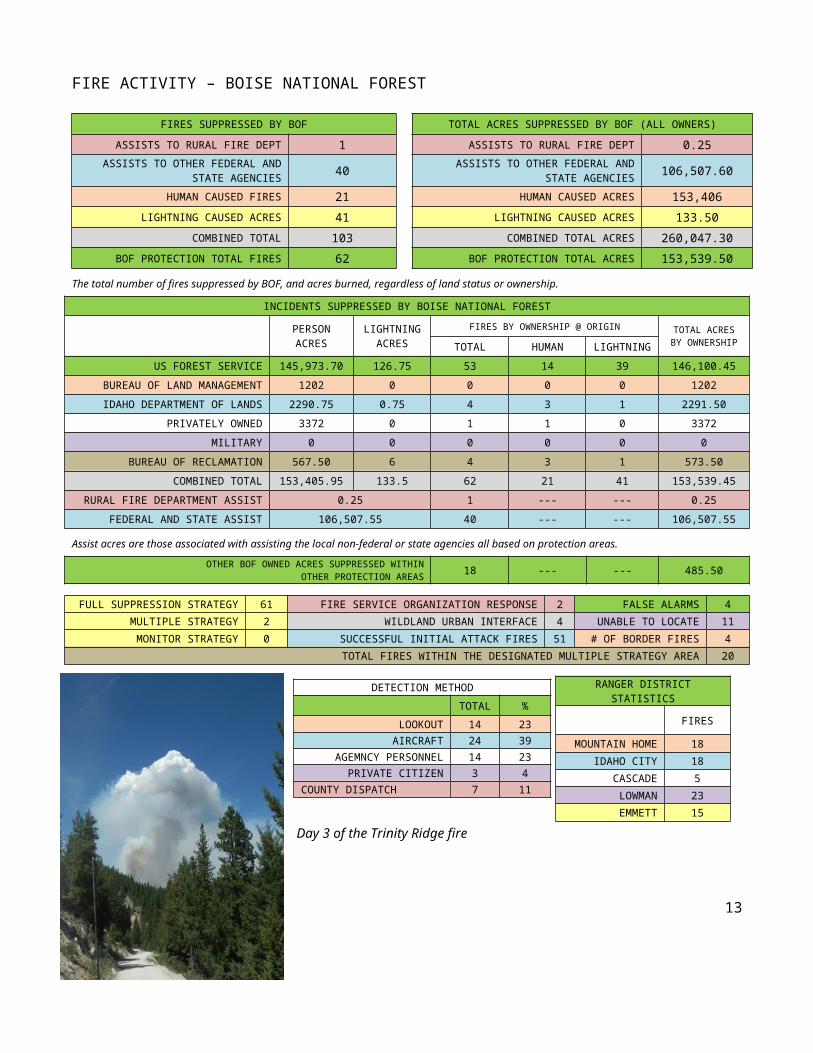
FIRE ACTIVITY – BOISE NATIONAL FOREST
FIRES SUPPRESSED BY BOF TOTAL ACRES SUPPRESSED BY BOF (ALL OWNERS)
ASSISTS TO RURAL FIRE DEPT 1 ASSISTS TO RURAL FIRE DEPT 0.25ASSISTS TO OTHER FEDERAL AND
STATE AGENCIES 40 ASSISTS TO OTHER FEDERAL AND STATE AGENCIES 106,507.60
HUMAN CAUSED FIRES 21 HUMAN CAUSED ACRES 153,406LIGHTNING CAUSED ACRES 41 LIGHTNING CAUSED ACRES 133.50
COMBINED TOTAL 103 COMBINED TOTAL ACRES 260,047.30BOF PROTECTION TOTAL FIRES 62 BOF PROTECTION TOTAL ACRES 153,539.50
The total number of fires suppressed by BOF, and acres burned, regardless of land status or ownership.
INCIDENTS SUPPRESSED BY BOISE NATIONAL FOREST
PERSON ACRES
LIGHTNING ACRES
FIRES BY OWNERSHIP @ ORIGIN TOTAL ACRES BY OWNERSHIPTOTAL HUMAN LIGHTNING
US FOREST SERVICE 145,973.70 126.75 53 14 39 146,100.45
BUREAU OF LAND MANAGEMENT 1202 0 0 0 0 1202
IDAHO DEPARTMENT OF LANDS 2290.75 0.75 4 3 1 2291.50
PRIVATELY OWNED 3372 0 1 1 0 3372
MILITARY 0 0 0 0 0 0
BUREAU OF RECLAMATION 567.50 6 4 3 1 573.50
COMBINED TOTAL 153,405.95 133.5 62 21 41 153,539.45
RURAL FIRE DEPARTMENT ASSIST 0.25 1 --- --- 0.25
FEDERAL AND STATE ASSIST 106,507.55 40 --- --- 106,507.55
Assist acres are those associated with assisting the local non-federal or state agencies all based on protection areas.
OTHER BOF OWNED ACRES SUPPRESSED WITHIN OTHER PROTECTION AREAS 18 --- --- 485.50
FULL SUPPRESSION STRATEGY 61 FIRE SERVICE ORGANIZATION RESPONSE 2 FALSE ALARMS 4
MULTIPLE STRATEGY 2 WILDLAND URBAN INTERFACE 4 UNABLE TO LOCATE 11
MONITOR STRATEGY 0 SUCCESSFUL INITIAL ATTACK FIRES 51 # OF BORDER FIRES 4
TOTAL FIRES WITHIN THE DESIGNATED MULTIPLE STRATEGY AREA 20
Day 3 of the Trinity Ridge fire
9
RANGER DISTRICT STATISTICS
FIRES
MOUNTAIN HOME 18
IDAHO CITY 18
CASCADE 5
LOWMAN 23
EMMETT 15
DETECTION METHODTOTAL %
LOOKOUT 14 23AIRCRAFT 24 39
AGEMNCY PERSONNEL 14 23PRIVATE CITIZEN 3 4
COUNTY DISPATCH 7 11
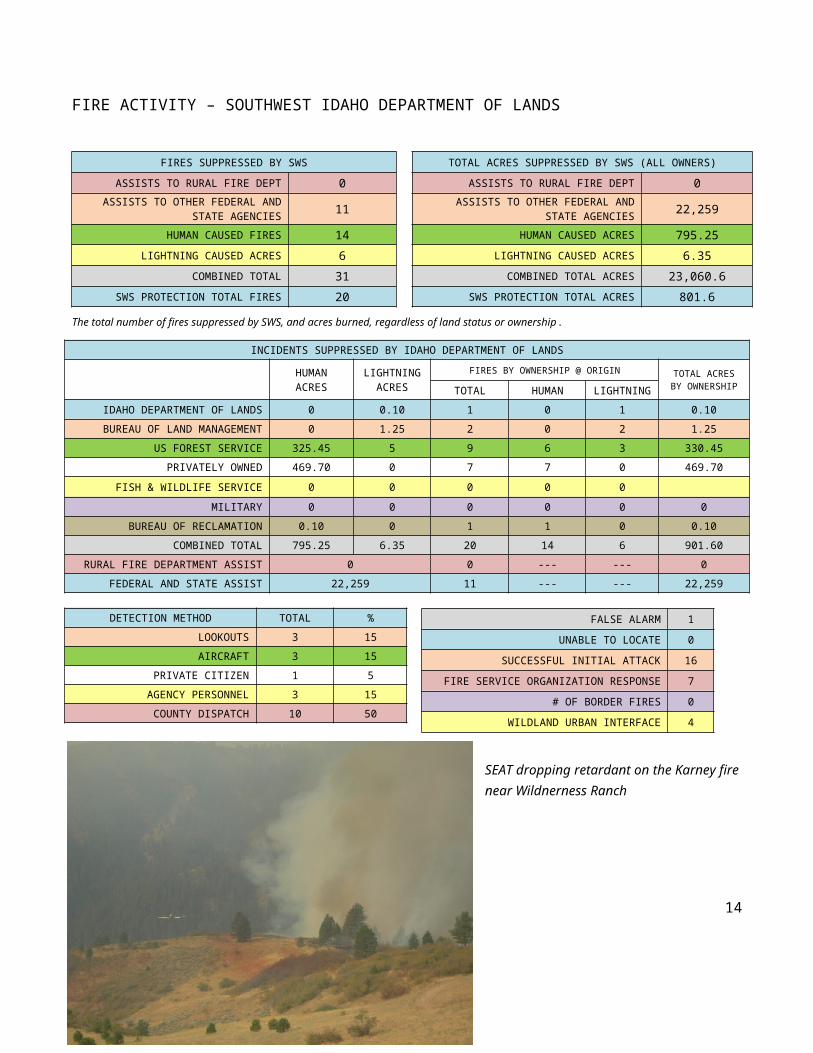
FIRE ACTIVITY – SOUTHWEST IDAHO DEPARTMENT OF LANDS
FIRES SUPPRESSED BY SWS TOTAL ACRES SUPPRESSED BY SWS (ALL OWNERS)
ASSISTS TO RURAL FIRE DEPT 0 ASSISTS TO RURAL FIRE DEPT 0ASSISTS TO OTHER FEDERAL AND
STATE AGENCIES 11 ASSISTS TO OTHER FEDERAL AND STATE AGENCIES 22,259
HUMAN CAUSED FIRES 14 HUMAN CAUSED ACRES 795.25LIGHTNING CAUSED ACRES 6 LIGHTNING CAUSED ACRES 6.35
COMBINED TOTAL 31 COMBINED TOTAL ACRES 23,060.6SWS PROTECTION TOTAL FIRES 20 SWS PROTECTION TOTAL ACRES 801.6
The total number of fires suppressed by SWS, and acres burned, regardless of land status or ownership.
INCIDENTS SUPPRESSED BY IDAHO DEPARTMENT OF LANDS
HUMAN ACRES
LIGHTNING ACRES
FIRES BY OWNERSHIP @ ORIGIN TOTAL ACRES BY OWNERSHIPTOTAL HUMAN LIGHTNING
IDAHO DEPARTMENT OF LANDS 0 0.10 1 0 1 0.10
BUREAU OF LAND MANAGEMENT 0 1.25 2 0 2 1.25
US FOREST SERVICE 325.45 5 9 6 3 330.45
PRIVATELY OWNED 469.70 0 7 7 0 469.70
FISH & WILDLIFE SERVICE 0 0 0 0 0
MILITARY 0 0 0 0 0 0
BUREAU OF RECLAMATION 0.10 0 1 1 0 0.10
COMBINED TOTAL 795.25 6.35 20 14 6 901.60
RURAL FIRE DEPARTMENT ASSIST 0 0 --- --- 0
FEDERAL AND STATE ASSIST 22,259 11 --- --- 22,259
DETECTION METHOD TOTAL %
LOOKOUTS 3 15
AIRCRAFT 3 15
PRIVATE CITIZEN 1 5
AGENCY PERSONNEL 3 15
COUNTY DISPATCH 10 50
SEAT dropping retardant on the Karney fire near Wildnerness Ranch
10
FALSE ALARM 1
UNABLE TO LOCATE 0
SUCCESSFUL INITIAL ATTACK 16
FIRE SERVICE ORGANIZATION RESPONSE 7
# OF BORDER FIRES 0
WILDLAND URBAN INTERFACE 4
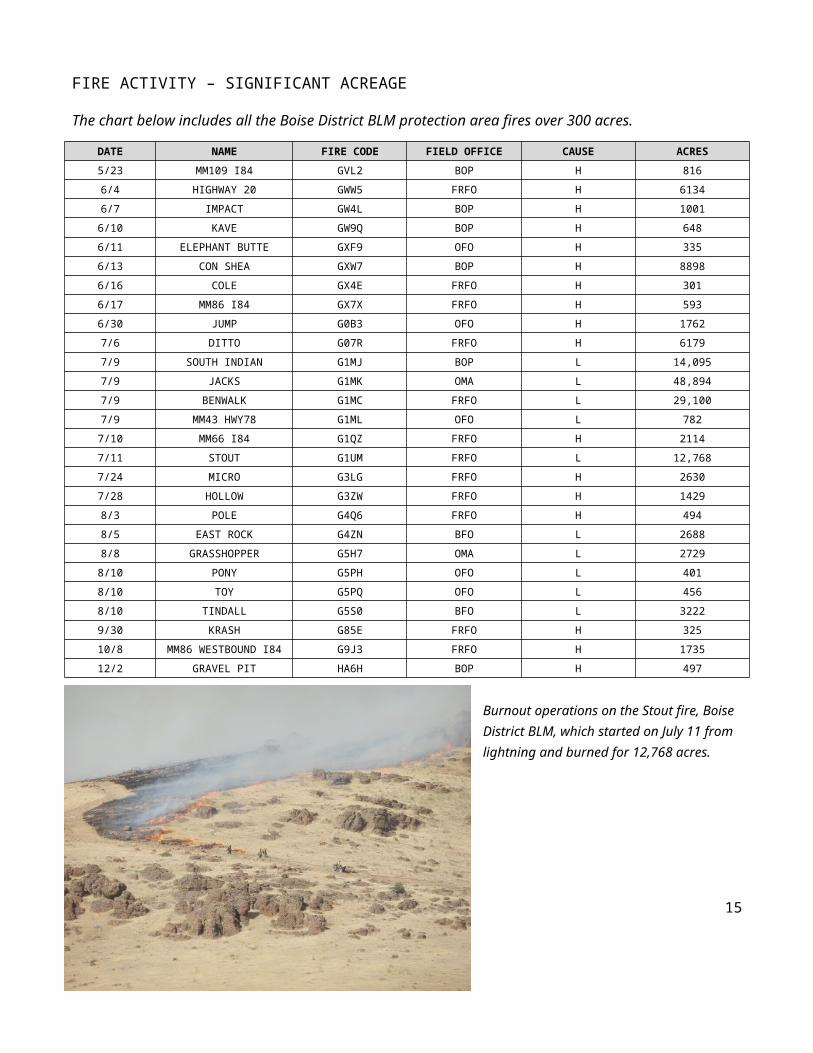
FIRE ACTIVITY – SIGNIFICANT ACREAGE
The chart below includes all the Boise District BLM protection area fires over 300 acres.
DATE NAME FIRE CODE FIELD OFFICE CAUSE ACRES
5/23 MM109 I84 GVL2 BOP H 816
6/4 HIGHWAY 20 GWW5 FRFO H 6134
6/7 IMPACT GW4L BOP H 1001
6/10 KAVE GW9Q BOP H 648
6/11 ELEPHANT BUTTE GXF9 OFO H 335
6/13 CON SHEA GXW7 BOP H 8898
6/16 COLE GX4E FRFO H 301
6/17 MM86 I84 GX7X FRFO H 593
6/30 JUMP G0B3 OFO H 1762
7/6 DITTO G07R FRFO H 6179
7/9 SOUTH INDIAN G1MJ BOP L 14,095
7/9 JACKS G1MK OMA L 48,894
7/9 BENWALK G1MC FRFO L 29,100
7/9 MM43 HWY78 G1ML OFO L 782
7/10 MM66 I84 G1QZ FRFO H 2114
7/11 STOUT G1UM FRFO L 12,768
7/24 MICRO G3LG FRFO H 2630
7/28 HOLLOW G3ZW FRFO H 1429
8/3 POLE G4Q6 FRFO H 494
8/5 EAST ROCK G4ZN BFO L 2688
8/8 GRASSHOPPER G5H7 OMA L 2729
8/10 PONY G5PH OFO L 401
8/10 TOY G5PQ OFO L 456
8/10 TINDALL G5S0 BFO L 3222
9/30 KRASH G85E FRFO H 325
10/8 MM86 WESTBOUND I84 G9J3 FRFO H 1735
12/2 GRAVEL PIT HA6H BOP H 497
Burnout operations on the Stout fire, Boise District BLM, which started on July 11 from lightning and burned for 12,768 acres.
11

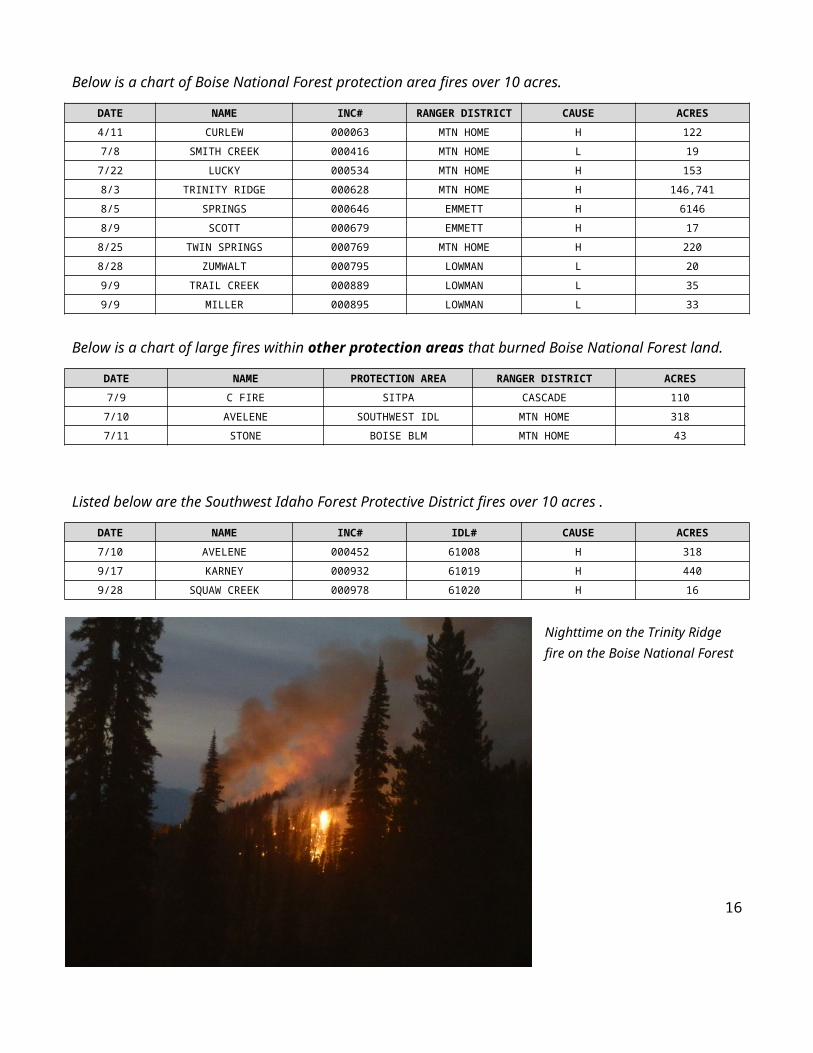
Below is a chart of Boise National Forest protection area fires over 10 acres.
DATE NAME INC# RANGER DISTRICT CAUSE ACRES
4/11 CURLEW 000063 MTN HOME H 122
7/8 SMITH CREEK 000416 MTN HOME L 19
7/22 LUCKY 000534 MTN HOME H 153
8/3 TRINITY RIDGE 000628 MTN HOME H 146,741
8/5 SPRINGS 000646 EMMETT H 6146
8/9 SCOTT 000679 EMMETT H 17
8/25 TWIN SPRINGS 000769 MTN HOME H 220
8/28 ZUMWALT 000795 LOWMAN L 20
9/9 TRAIL CREEK 000889 LOWMAN L 35
9/9 MILLER 000895 LOWMAN L 33
Below is a chart of large fires within other protection areas that burned Boise National Forest land.
DATE NAME PROTECTION AREA RANGER DISTRICT ACRES
7/9 C FIRE SITPA CASCADE 110
7/10 AVELENE SOUTHWEST IDL MTN HOME 318
7/11 STONE BOISE BLM MTN HOME 43
Listed below are the Southwest Idaho Forest Protective District fires over 10 acres.
DATE NAME INC# IDL# CAUSE ACRES
7/10 AVELENE 000452 61008 H 318
9/17 KARNEY 000932 61019 H 440
9/28 SQUAW CREEK 000978 61020 H 16
Nighttime on the Trinity Ridge fire on the Boise National Forest
12
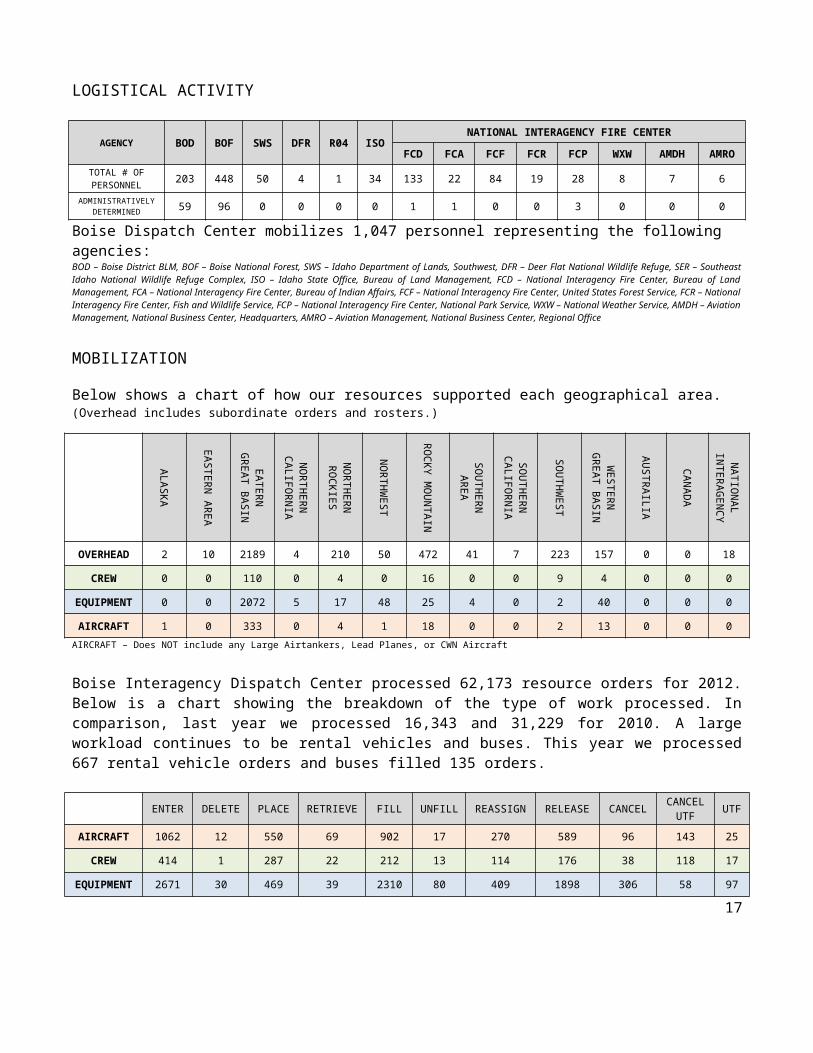
LOGISTICAL ACTIVITY
AGENCY BOD BOF SWS DFR R04 ISONATIONAL INTERAGENCY FIRE CENTER
FCD FCA FCF FCR FCP WXW AMDH AMRO
TOTAL # OF PERSONNEL 203 448 50 4 1 34 133 22 84 19 28 8 7 6
ADMINISTRATIVELY DETERMINED 59 96 0 0 0 0 1 1 0 0 3 0 0 0
Boise Dispatch Center mobilizes 1,047 personnel representing the following agencies:BOD – Boise District BLM, BOF – Boise National Forest, SWS – Idaho Department of Lands, Southwest, DFR – Deer Flat National Wildlife Refuge, SER – Southeast Idaho National Wildlife Refuge Complex, ISO – Idaho State Office, Bureau of Land Management, FCD – National Interagency Fire Center, Bureau of Land Management, FCA – National Interagency Fire Center, Bureau of Indian Affairs, FCF – National Interagency Fire Center, United States Forest Service, FCR – National Interagency Fire Center, Fish and Wildlife Service, FCP – National Interagency Fire Center, National Park Service, WXW – National Weather Service, AMDH – Aviation Management, National Business Center, Headquarters, AMRO – Aviation Management, National Business Center, Regional Office
MOBILIZATION
Below shows a chart of how our resources supported each geographical area. (Overhead includes subordinate orders and rosters.)
ALA
SK
A
EA
STE
RN
AR
EA
EA
TER
NG
RE
AT B
AS
IN
NO
RTH
ER
N
CA
LIFOR
NIA
NO
RTH
ER
N
RO
CK
IES
NO
RTH
WE
ST
RO
CK
Y
MO
UN
TAIN
SO
UTH
ER
NA
RE
A
SO
UTH
ER
N
CA
LIFOR
NIA
SO
UTH
WE
ST
WE
STE
RN
GR
EA
T BA
SIN
AU
STR
AILIA
CA
NA
DA
NA
TION
AL
INTE
RA
GE
NC
Y
CO
OR
DIN
ATIO
N
OVERHEAD 2 10 2189 4 210 50 472 41 7 223 157 0 0 18
CREW 0 0 110 0 4 0 16 0 0 9 4 0 0 0
EQUIPMENT 0 0 2072 5 17 48 25 4 0 2 40 0 0 0
AIRCRAFT 1 0 333 0 4 1 18 0 0 2 13 0 0 0
AIRCRAFT – Does NOT include any Large Airtankers, Lead Planes, or CWN Aircraft
Boise Interagency Dispatch Center processed 62,173 resource orders for 2012. Below is a chart showing the breakdown of the type of work processed. In comparison, last year we processed 16,343 and 31,229 for 2010. A large workload continues to be rental vehicles and buses. This year we processed 667 rental vehicle orders and buses filled 135 orders.
ENTER DELETE PLACE RETRIEVE FILL UNFILL REASSIGN RELEASE CANCEL CANCEL UTF UTF
AIRCRAFT 1062 12 550 69 902 17 270 589 96 143 25
CREW 414 1 287 22 212 13 114 176 38 118 17
EQUIPMENT 2671 30 469 39 2310 80 409 1898 306 58 97
OVERHEAD 7338 49 4910 341 5244 202 3029 1539 168 280 721
SUPPLY 10,425 330 3803 114 6010 3 46 505 502 100 0
TOTAL 21,910 422 10,019 585 14,678 315 3868 7707 1110 699 860
13
CREWS
The Boise National Forest Interagency Hotshot Crews started the season in May with off Forest Assignments. The crews stayed busy and hit fires in Arizona, Colorado, Idaho, Utah, Nebraska, Nevada, New Mexico, and Wyoming.
Below is a list of their accomplishments and statistics.
DA
TE O
F FIRS
T A
SS
IGN
ME
NT
DA
TE O
FLAS
T A
SS
IGN
ME
NT
DA
YS
CR
EW
A
SS
EM
BLE
D
DA
YS
IN
TRA
VE
L S
TATU
S
DA
YS
ON
P
RO
JEC
T W
OR
K
DA
YS
– C
OM
MITTE
D
DA
YS
UN
PA
ID
14 DA
Y TO
UR
S
LAR
GE
FIRE
A
SS
IGN
ME
NTS
IA FIR
E
AS
SIG
NM
EN
TS
MILE
S
TRA
VE
LED
TRA
INE
E
AS
SIG
NM
EN
TS
BOISE IHC 5/27 10/7 149 13 10 125 11 7 14 4 45,380 15
IDAHO CITY IHC 5/13 9/19 145 10 14 118 6 4 15 2 47,241 22
The Type 2 Crews in our area are an essential part of our fire organization. Our area has three agency type 2 initial attack crews: Crew 3 out of Idaho City, Crew 5 off the Lowman Ranger District, and Crew 8 which is a combined effort of Boise National Forest and Job Corp. We also dispatch two national contract IA crews from Patrick Environmental. Crew 39 from the Southern Idaho Correction Institute sponsored by Idaho Department of Lands is also a type 2 crew that is available. These crews are critical to our success in initial attack on the local level. They also had off-unit assignments to Colorado, Idaho, Nevada, New Mexico, Utah and Wyoming.
CREW 3 CREW 5 CREW 8 CREW 39 CREW 13A CREW 13B
AGENCYBOISE
NATIONAL FOREST
BOISE NATIONAL FOREST
BOFJOB CORP
SOUTHERN IDAHO CORRECTION
INSTITUTE
PATRICK ENVIRONMENTAL
INC
PATRICK ENVIRONMENTAL
INC
DATE FIRSTASSIGNMENT 6/2 6/9 6/5 5/15 3/27 5/15
OFF-UNIT FIRE ASSIGNMENTS 5 5 3 3 13 7
Idaho City Interagency Hot Shot Crew
14
ENGINES
Below shows the activity the engine crews received off-unit which includes traveling to Colorado, Nevada, Oregon, Utah, and Wyoming. These also include assisting neighbors such as Elko, Payette, Salmon-Challis, Sawtooth, Twin Falls, and Vale. The BLM Idaho Strike Team was activated twice this season, to Utah and Payette NF.
BLM USFS IDL CONTRACT
TOTAL TYPE 4 ENGINES 19 5 0 17
TOTAL TYPE 6 ENGINES 0 1 4 23
TOTAL NUMBER OF ASSIGNMENTS 490 76 50 174
TOTAL NUMBER OF OFF-UNIT INCIDENT ASSIGNMENTS 27 19 9 128
DATE OF FIRST OFF-UNIT ASSIGNMENT 6/6 6/5 6/7 6/7
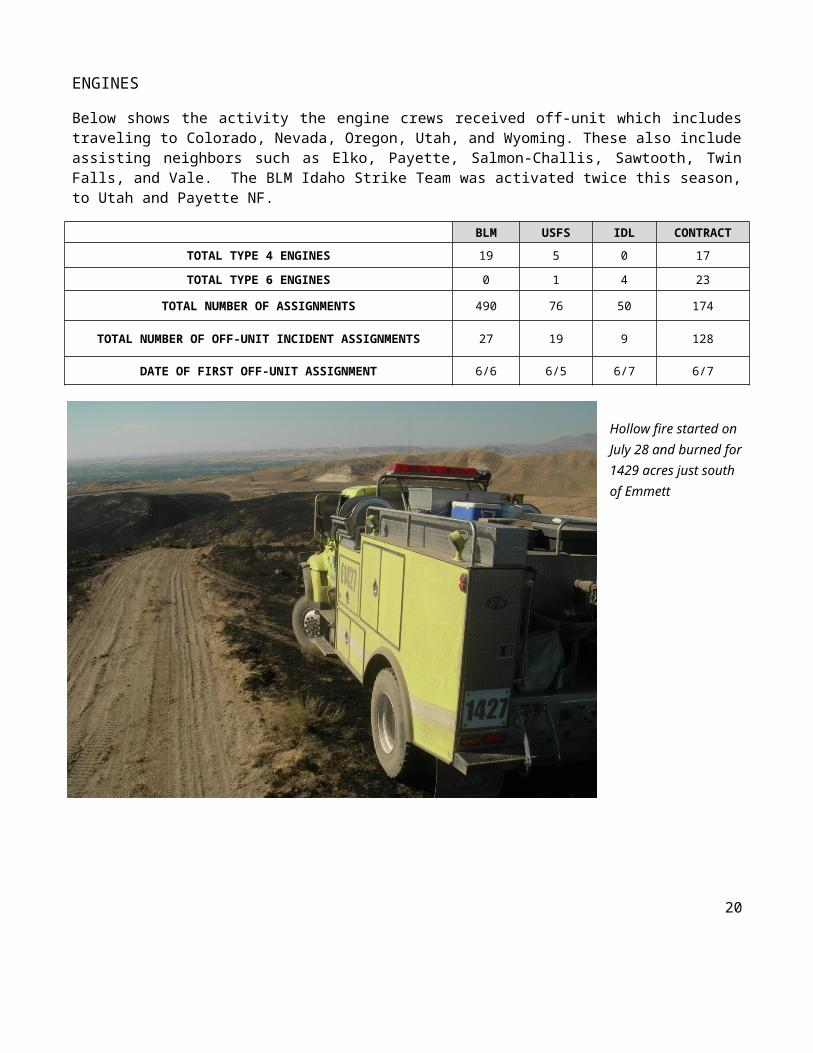
Hollow fire started on July 28 and burned for 1429 acres just south of Emmett
15
AIRCRAFT
Listed are the helicopters assigned to the Boise Dispatch area with their capabilities and accomplishments for the 2012 season.
AGENCY BLM USFS USFS USFS
IDENTIFICATION NUMBER N765H N864H N73HJ N526MW
TYPE OF AIRCRAFT BELL 205A1++ BELL 407 BELL 212HP KAMAN 1200 K-MAX
CATEGORY TYPE 2 3 2 1
TOTAL DAYS UNDER CONTRACT 115 133 140 120
BASE LOCATION BOISE GARDEN VALLEY LUCKY PEAK LUCKY PEAK
CREW SIZE 12 10 12 1
TOTAL FLIGHT HOURS 289.2 287.6 390.9 328.2
FIRE MANAGEMENT HOURS 289.2 280.9 390.9 327.7
OTHER HOURS 20 6.7 0 0.5
INITIAL ATTACK INCIDENTS 41 67 35 8
EXTENDED ATTACK INCIDENTS 17 22 20 12
% IA SUPPORTED WITH BUCKET 65% 65% 97% 100%
GALLONS OF WATER 452,454 135,350 687,166 1,685,700
GALLONS OF RETARDANT 0 0 0 14,125
PERSONNEL TRANSPORTED 1020 1017 1613 0
OPERATIONAL RAPPELS 0 0 0 0
FIRES STAFFED BY RAPPELLERS 0 0 0 0
POUNDS OF INTERNAL CARGO 102,898 64,235 146,795 0
POUNDS OF EXTERNAL CARGO 54,160 78,230 42,835 31,551
AERIAL IGNITION HOURS 0 12.6 0 0
HELITACK VEHICLE MILEAGE 30,000 NR NR NR
DETAILER TOTAL DAYS 241 280 NR NR
TOTAL OPERATIONAL COST $1,112,593 $732,330 $1,547,261 $1,952,082
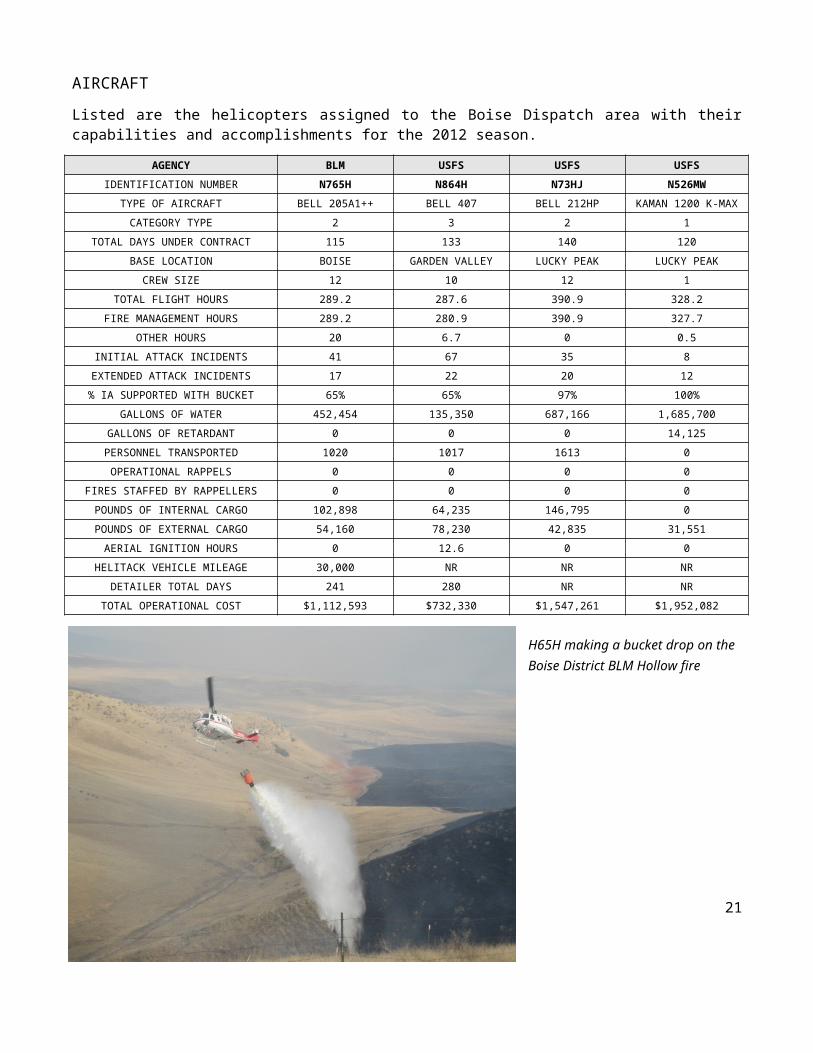
H65H making a bucket drop on the Boise District BLM Hollow fire
16
The two air attacks we have in our area have been an essential part in firefighting operations and detection.
AGNECY BLM USFS
IDENTIFICATION NUMBER N536SA N531SA
TYPE OF AIRCRAFT AERO COMMANDER 500 AERO COMMANDER 500S
DAYS UNDER CONTRACT 118 93
BASE LOCATION BOISE AIRPORT BOISE AIRPORT
INITIAL ATTACK INCIDENTS NR 12
EXTENDED ATTACK INCIDENTS NR 4
NUMBER OF TRAINEES 6 4
TOTAL FLIGHT HOURS 255.20 254.1
ON-ZONE HOURS NR 231.5
OFF-ZONE HOURS NR 22.6
TOTAL COST $237,531 $223,698
MOUNTAIN HOME SEAT BASE
SEATS (Single Engine Air Tankers) are such an asset to our fire fighting force. Mountain Home SEAT Base serviced five different SEATS this season and pumped approximately 135,000 gallons of retardant.
Below is information from the primary SEATS used out of Mountain Home SEAT Base.IDENTIFICATION NUMBER T-878 T-879 T-885
TYPE OF AIRCRAFT AT-802 AT-802 AT-802
CONTRACTING AGENCY BLM BLM IDL
TOTAL FLIGHT HOURS 119.69 173.33 64.59
DAYS USED 67 96 29
OPERATIONAL COST $583,295 $731,701 $277,483
SEAT making a retardant drop on the BLM Jump fire on June 30
17
BOISE TANKER BASE
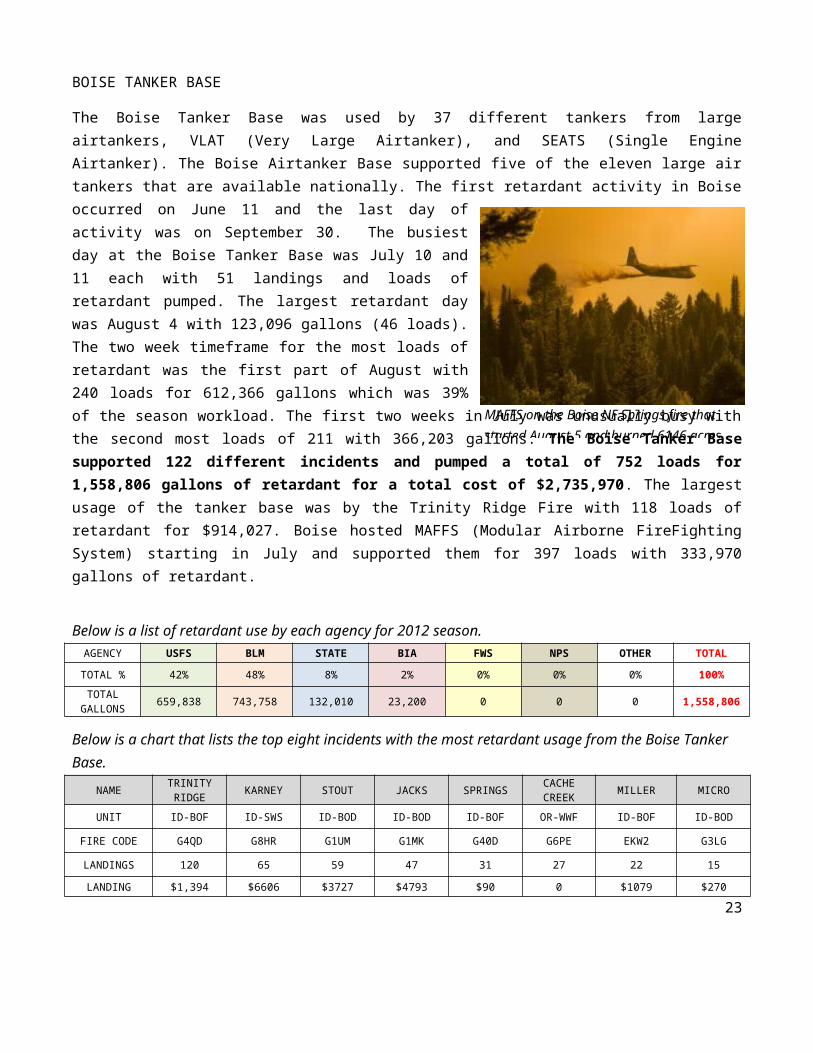
The Boise Tanker Base was used by 37 different tankers from large airtankers, VLAT (Very Large Airtanker), and SEATS (Single Engine Airtanker). The Boise Airtanker Base supported five of the eleven large air tankers that are available nationally. The first retardant activity in Boise occurred on June 11 and the last day of activity was on September 30. The busiest day at the Boise Tanker Base was July 10 and 11 each with 51 landings and loads of retardant pumped. The largest retardant day was August 4 with 123,096 gallons (46 loads). The two week timeframe for the most loads of retardant was the first part of August with 240 loads for 612,366 gallons which was 39% of the season workload. The first two weeks in July was unusually busy with the second most loads of 211 with 366,203 gallons. The Boise Tanker Base supported 122 different incidents and pumped a total of 752 loads for 1,558,806 gallons of retardant for a total cost of $2,735,970. The largest usage of the tanker base was by the Trinity Ridge Fire with 118 loads of retardant for $914,027. Boise hosted MAFFS (Modular Airborne FireFighting System) starting in July and supported them for 397 loads with 333,970 gallons of retardant.
Below is a list of retardant use by each agency for 2012 season.AGENCY USFS BLM STATE BIA FWS NPS OTHER TOTAL
TOTAL % 42% 48% 8% 2% 0% 0% 0% 100%
TOTAL GALLONS 659,838 743,758 132,010 23,200 0 0 0 1,558,806
Below is a chart that lists the top eight incidents with the most retardant usage from the Boise Tanker Base.
NAME TRINITY RIDGE KARNEY STOUT JACKS SPRINGS CACHE
CREEK MILLER MICRO
UNIT ID-BOF ID-SWS ID-BOD ID-BOD ID-BOF OR-WWF ID-BOF ID-BOD
FIRE CODE G4QD G8HR G1UM G1MK G40D G6PE EKW2 G3LG
LANDINGS 120 65 59 47 31 27 22 15
LANDING COSTS $1,394 $6606 $3727 $4793 $90 0 $1079 $270
LOADS 118 61 59 47 32 27 19 15
RETARDANT GALLONS 275,516 65,045 128,949 103,138 95,927 75,798 14,452 30,325
RETARDANT COSTS $468,377 $110,577 $177,381 $157,797 $163,076 $128,857 $24,568 $51,553
FLIGHT TIME 77.78 31.86 41.69 40.68 19.14 40.27 21.11 5.87
FLIGHT COSTS $439,250 $102,609 $254,619 $243,370 $125,169 $275,729 $60,113 $30,173
OTHER COSTS $887 $1839 $2004 $2620 0 0 $617 $964
RETARDANT CREW COST $4120 $640 $1520 $1360 $2160 1440 $400 $720
TOTAL COST $914,027 $222,270 $439,251 $409,940 $290,495 $406,025 $86,777 $83,679
18
MAFFS on the Boise NF Springs fire that started August 5 and burned 6146 acres
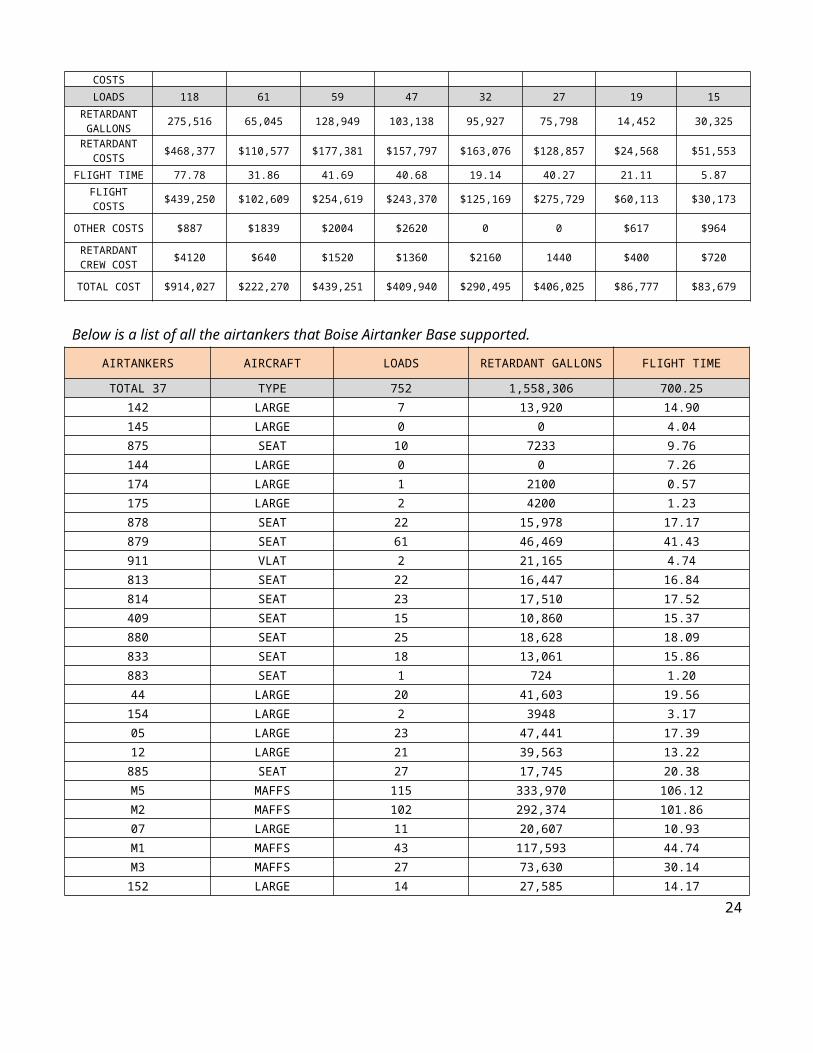
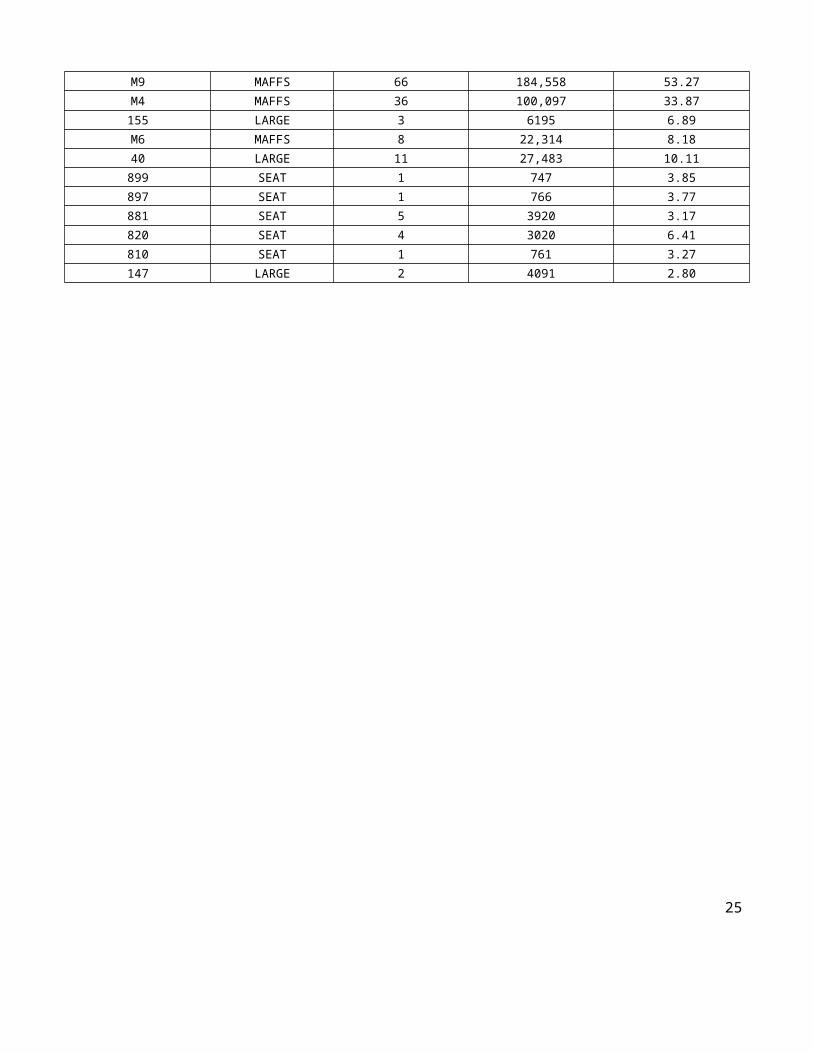
Below is a list of all the airtankers that Boise Airtanker Base supported.
AIRTANKERS AIRCRAFT LOADS RETARDANT GALLONS FLIGHT TIME
TOTAL 37 TYPE 752 1,558,306 700.25142 LARGE 7 13,920 14.90145 LARGE 0 0 4.04875 SEAT 10 7233 9.76144 LARGE 0 0 7.26174 LARGE 1 2100 0.57175 LARGE 2 4200 1.23878 SEAT 22 15,978 17.17879 SEAT 61 46,469 41.43911 VLAT 2 21,165 4.74813 SEAT 22 16,447 16.84814 SEAT 23 17,510 17.52409 SEAT 15 10,860 15.37880 SEAT 25 18,628 18.09833 SEAT 18 13,061 15.86883 SEAT 1 724 1.2044 LARGE 20 41,603 19.56
154 LARGE 2 3948 3.1705 LARGE 23 47,441 17.3912 LARGE 21 39,563 13.22
885 SEAT 27 17,745 20.38M5 MAFFS 115 333,970 106.12M2 MAFFS 102 292,374 101.8607 LARGE 11 20,607 10.93M1 MAFFS 43 117,593 44.74M3 MAFFS 27 73,630 30.14152 LARGE 14 27,585 14.17M9 MAFFS 66 184,558 53.27M4 MAFFS 36 100,097 33.87155 LARGE 3 6195 6.89M6 MAFFS 8 22,314 8.1840 LARGE 11 27,483 10.11
899 SEAT 1 747 3.85897 SEAT 1 766 3.77881 SEAT 5 3920 3.17820 SEAT 4 3020 6.41810 SEAT 1 761 3.27147 LARGE 2 4091 2.80
19
FUELS MANAGEMENT – Hazardous Fuels Acre Accomplishments
Boise District BLMTYPE OF PROJECT ACRES
PRESCRIBED BURNING 850
MECHANICAL TREATMENT 7455
OTHER FUEL REDUCTION CONTROL 4600
TOTAL 13,205
Boise National Forest
NON-WUI WUI TOTAL
PRESCRIBED BURN MECHANICAL PRESCRIBED
BURN MECHANICAL PRESCRIBED BURN MECHANICAL
MOUNTAIN HOMERANGER DISTRICT 69 446 115 33 184 479
IDAHO CITYRANGER DISTRICT 0 0 1786 2446 1786 2446
CASCADERANGER DISTRICT 0 738 30 124 30 862
LOWMANRANGER DISTRICT 25 313 1104 1125 1129 1438
EMMETTRANGER DISTRICT 1391 319 1769 0 3160 319
TOTAL 1485 1816 4804 3728 6289 5544
These numbers reflect both core (main HZ fuels objectives) and integrated (other target along with HZ fuels objectives) targets.
Southwest Idaho Department of LandsPRESCRIBED FIRE
PROJECTS PILE BURNING ACRES
SOUTHWEST AREA 6 1571
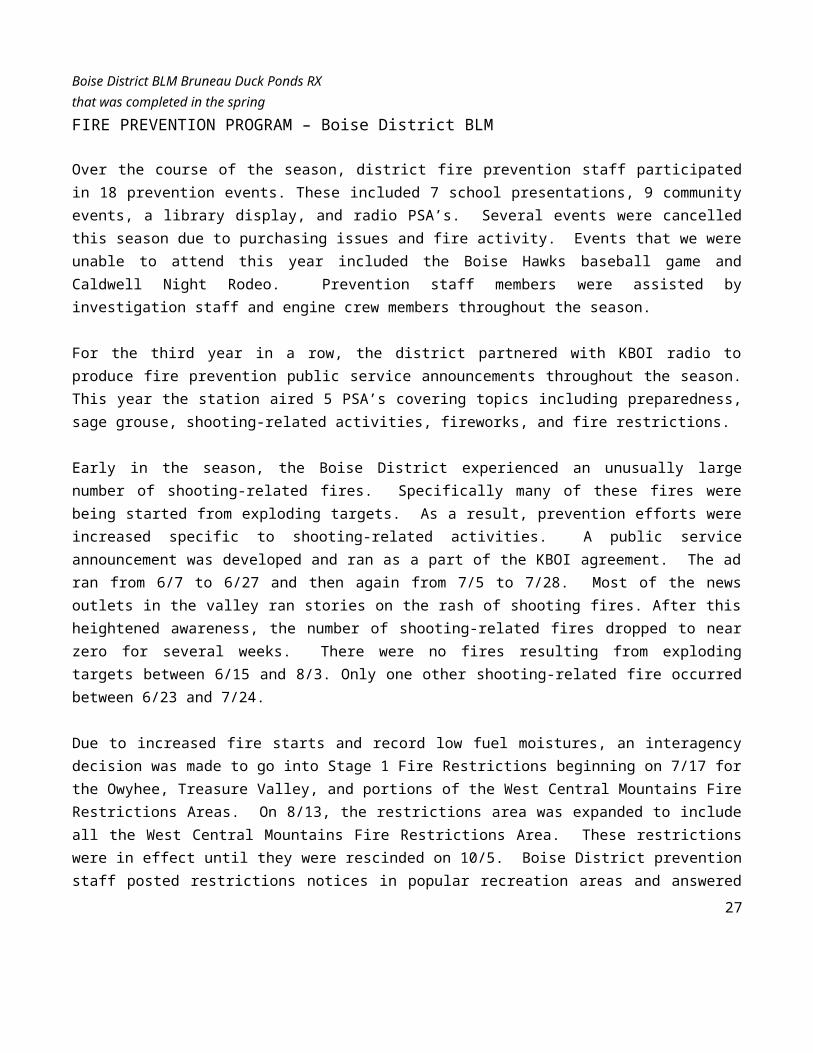
Boise District BLM Bruneau Duck Ponds RX
20
that was completed in the springFIRE PREVENTION PROGRAM – Boise District BLM
Over the course of the season, district fire prevention staff participated in 18 prevention events. These included 7 school presentations, 9 community events, a library display, and radio PSA’s. Several events were cancelled this season due to purchasing issues and fire activity. Events that we were unable to attend this year included the Boise Hawks baseball game and Caldwell Night Rodeo. Prevention staff members were assisted by investigation staff and engine crew members throughout the season.
For the third year in a row, the district partnered with KBOI radio to produce fire prevention public service announcements throughout the season. This year the station aired 5 PSA’s covering topics including preparedness, sage grouse, shooting-related activities, fireworks, and fire restrictions.
Early in the season, the Boise District experienced an unusually large number of shooting-related fires. Specifically many of these fires were being started from exploding targets. As a result, prevention efforts were increased specific to shooting-related activities. A public service announcement was developed and ran as a part of the KBOI agreement. The ad ran from 6/7 to 6/27 and then again from 7/5 to 7/28. Most of the news outlets in the valley ran stories on the rash of shooting fires. After this heightened awareness, the number of shooting-related fires dropped to near zero for several weeks. There were no fires resulting from exploding targets between 6/15 and 8/3. Only one other shooting-related fire occurred between 6/23 and 7/24.
Due to increased fire starts and record low fuel moistures, an interagency decision was made to go into Stage 1 Fire Restrictions beginning on 7/17 for the Owyhee, Treasure Valley, and portions of the West Central Mountains Fire Restrictions Areas. On 8/13, the restrictions area was expanded to include all the West Central Mountains Fire Restrictions Area. These restrictions were in effect until they were rescinded on 10/5. Boise District prevention staff posted restrictions notices in popular recreation areas and answered numerous phone calls from the public regarding fire restrictions. Additionally, a PSA was created and ran on KBOI beginning 7/28.
Mitigation efforts included three property assessments and presence at one neighborhood association meeting. District prevention staff continues to work with partners such as Boise City on completing home and community assessments across the district.
Additionally, several prevention staff members served as fire information officers both on and off district throughout the fire season. On district, fire information officers responded to incidents receiving media interest. Off district, information officers responded to large incidents as part of Great Basin Incident Management Teams.
21
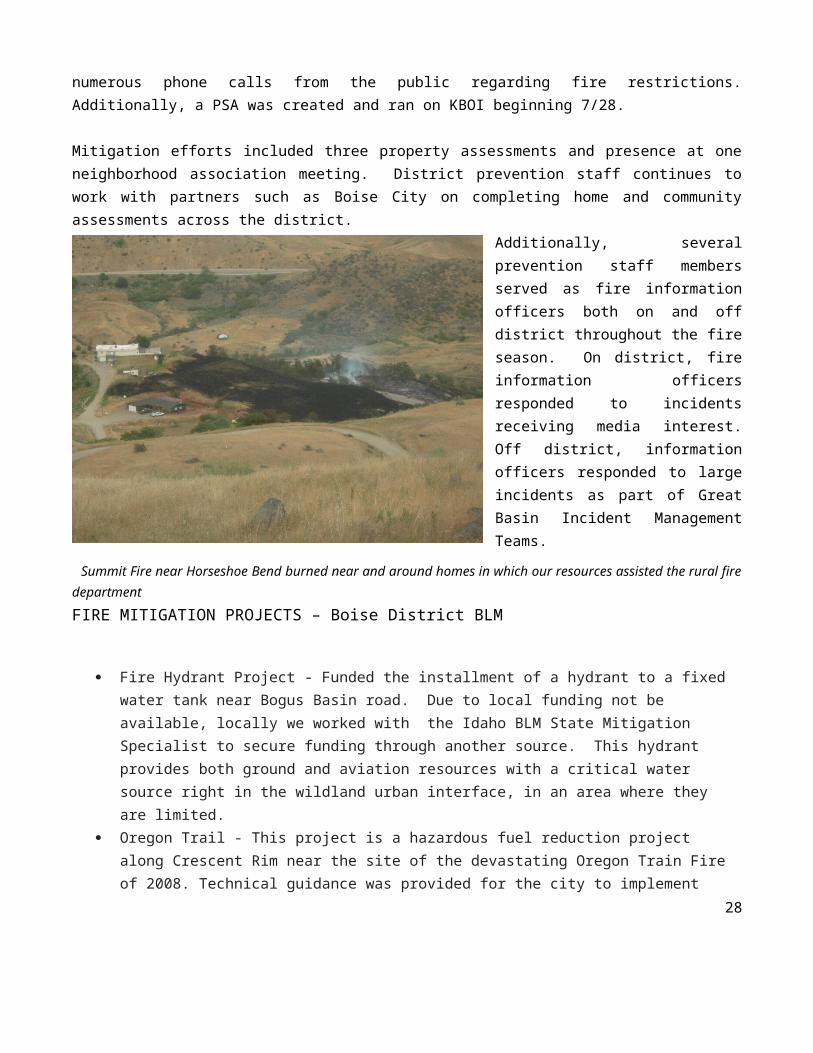
Summit Fire near Horseshoe Bend burned near and around homes in which our resources assisted the rural fire departmentFIRE MITIGATION PROJECTS – Boise District BLM
Fire Hydrant Project - Funded the installment of a hydrant to a fixed water tank near Bogus Basin road. Due to local funding not be available, locally we worked with the Idaho BLM State Mitigation Specialist to secure funding through another source. This hydrant provides both ground and aviation resources with a critical water source right in the wildland urban interface, in an area where they are limited.
Oregon Trail - This project is a hazardous fuel reduction project along Crescent Rim near the site of the devastating Oregon Train Fire of 2008. Technical guidance was provided for the city to implement this project using a contract crew to thin the brush concentration along the rim, still providing wildlife habitat.
Chipper - This project was one that Boise City offered to the public to help raise their awareness of the dangers of fire in the wildand urban interface. They offered a chipping service to a number of different neighborhood associations throughout the foothills. These services were available every weekend for a month for people to remove the excess fuels from around their property and have it take away for no cost. There was such a high level of interest and participation in this project that they repeated it in the fall.
Military Reserve -This is a project that has been in the planning phase for a number of years but keeps running into roadblocks. With the amount of interest and the surge of momentum, we were able to work with the city and county to actually get this project off the ground. They utilized crew with weed-trimmers and goats to provide key fuel breaks in the Military Reserve recreation area. The results in one area that our fuels program monitoring crew came up with were very eye-opening. Pre-treatment, the fuel loading was 1132 lbs/acre of Grass. After the treatment the fuel loading dropped to 206 lbs/acre of Grass. Again, we did have an ignition during the fire season in the treatment area and the fire behavior was so minimal that is was easily extinguished, whereas if there had not of been a fuels treatment, we could have had another devastating fire in the urban interface.
Quail Ridge -This was another project that utilized goat grazing around the perimeter of a development with very high-priced homes and little to no access.
Warm Springs Mesa II – This was another follow-up project to the previous year’s Plateau application and seeding. It was funded through the RC&D to remove old, overgrown trees in the drainages that were a hazardous fuels build-up. Additionally, goats were brought in to graze areas around private property that were not included in the Plateau application. Once again proof, as a squirrel and a transformer caused a fire that a single individual was able to extinguish with a garden hose.
Morningside Heights -This was a project for a community in the foothills that was looking to prevent hat happened during the Oregon Trail fire of 2008. They were looking to remove the amount of trees in common areas and around the perimeter of the community to prevent a fire from entering and then moving from house to house.
Clean Water for Horses - This was funded for a non-profit organization to create a FireWise-type brochure in the interests of the equine community. This purpose of this project was to develop educational materials for horse and livestock owners, as it pertains to wildfire and evacuations.
22
FIRE INVESTIGATION AND TRESPASS – Boise District BLM
Boise District Fire Investigators responded to 104 human-caused fires and four lightning caused fires on BLM managed and protected lands. Investigators also assisted other jurisdictions on 19 fires including Boise National Forest, Payette National Forest, Idaho Department of Lands, Ada County, Gem County, Boise City Fire Department, Mountain Home RFD, Horseshoe Bend RFD, and Oasis RFD.
Of the 104 human causes fires investigated: 20 occurred on private property in which no cost collection will be pursued by the BLM: 15 were recommended for fire trespass proceedings to pursue costs through the BLM administrative trespass process; one fire is being referred to the US Attorney’s Office for civil litigation; 21 others are being reviewed for possible trespass pending negligence; and nine have been identified as having possible criminal intent and have been referred to an Idaho BLM Special Agent for further review. For the remaining fire cases that occurred on BLM land either the responsible parties could not be located; negligence could not be determined; or the cause was undetermined.
This year the Boise District experienced an increase of shooting related fires accounting for close to one-third of the total number of human caused fires. There were 30 fires determined to be caused by shooting related activities and ten of those were caused by exploding targets.
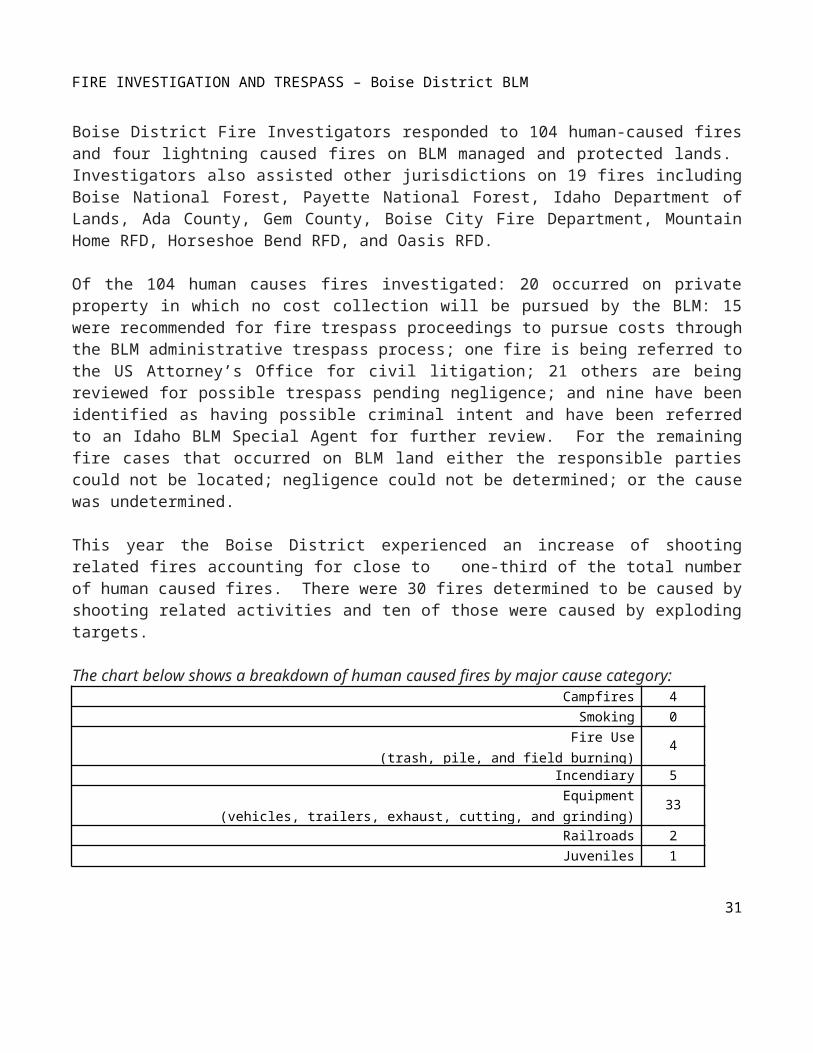
The chart below shows a breakdown of human caused fires by major cause category:Campfires 4
Smoking 0Fire Use
(trash, pile, and field burning)4
Incendiary 5
Equipment(vehicles, trailers, exhaust, cutting, and grinding)
33
Railroads 2Juveniles 1
Miscellaneous(fireworks, powerlines, shooting, exploding targets, structures, and undetermined causes)
55
23
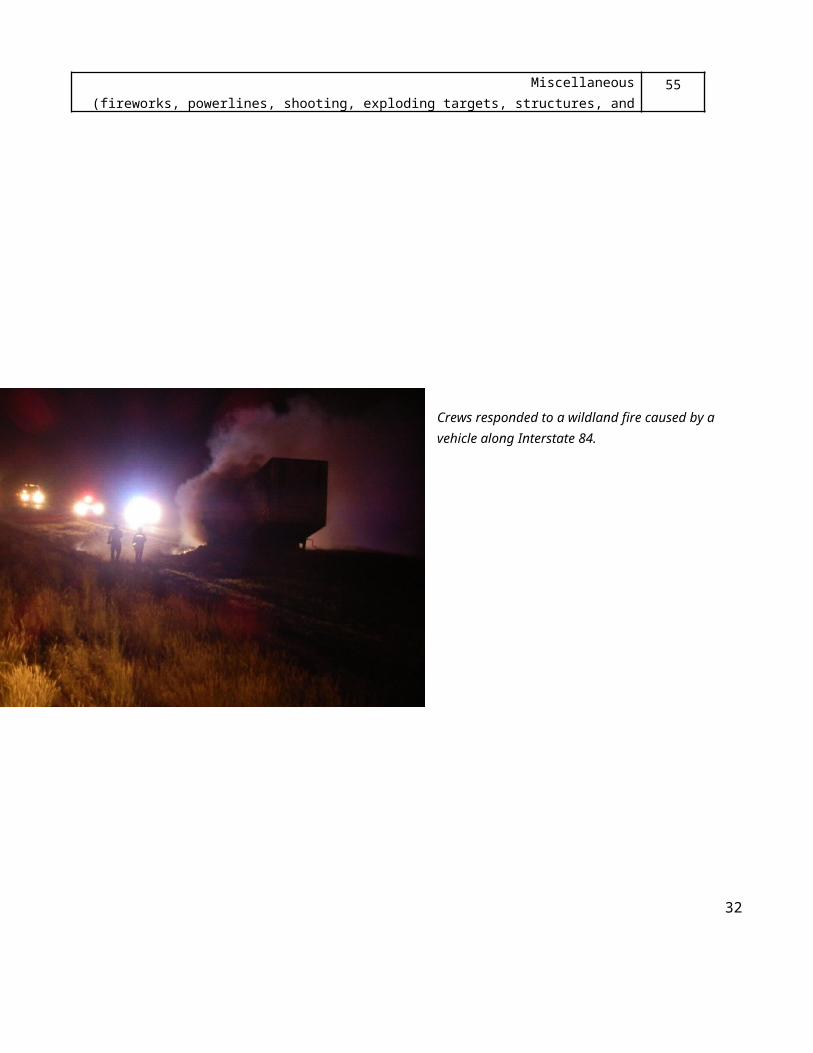
Crews responded to a wildland fire caused by a vehicle along Interstate 84.
24
RANGE FIRE PROTECTION DISTRICTS – Boise District BLM
A new level of teamwork has developed between the BLM and local ranchers with the formation of a Range Fire Protection Association outside of Mountain Home Idaho. On July 10, the Idaho Department of Lands (IDL) formally recognized the first Rangeland Fire Protection Association (RFPA) in Idaho. Over the last year, a group of private landowners in Elmore County have worked closely with IDL and Boise District BLM representatives to create this association. An RFPA is a nonprofit organization established to prevent and suppress range fires. It is governed by the members and funded by fees set by a local board, grant dollars, and equipment provided through IDL.
Boise District’s Fire Management, in partnership with IDL, provided the association members with basic fire training in the spring of 2012. 18 members of the association were trained on the basic principles of fighting wildland fire. These trainings opened the door for a positive working relationship for all parties involved. Prior to forming the RFPA, local ranchers had no way to help the BLM fight fires on public rangelands. They lacked the training, personal protective equipment, and radios for communication. It created an unsafe environment with ranchers taking independent, uncoordinated action. As an organized fire organization, they work with BLM fire crews to reach common objectives while enhancing safety and firefighting efficiency.
In southern Idaho there are currently 2.2 million acres that lack any formal fire protection. The RFPA helps fill part of this gap since ranchers are often first on scene and can help until the BLM arrives to form a coordinated effort. “We do make a living off this land," says Charlie Lyons, a Mountain Home rancher. Mountain Home rancher John McGrew agrees. "If we can keep that range productive, it's good for us and it's good for the game animals. That's my primary concern. It's such a waste of resources to watch it go up in smoke."
The agreement between the RFPA and the BLM was put to use for the first time on the Stout Fire near Mountain Home in July when ranchers were able to help battle the lightning caused blaze. "This was the first fire we interacted on and incorporated the Rangeland Fire Protection Association into suppression operations, and it went very well," says Steve Acarregui, Fire Operations Manager BLM Boise District. "Some of the actual firefighting resources they provided were dozers, water tenders and engines, they did a lot of line construction, and it was very beneficial." The training and coordination on fires has drastically changed the working relationships between ranchers and the BLM.
Other groups have noticed the success of this organization and have expressed interest in forming similar associations in SW Idaho.
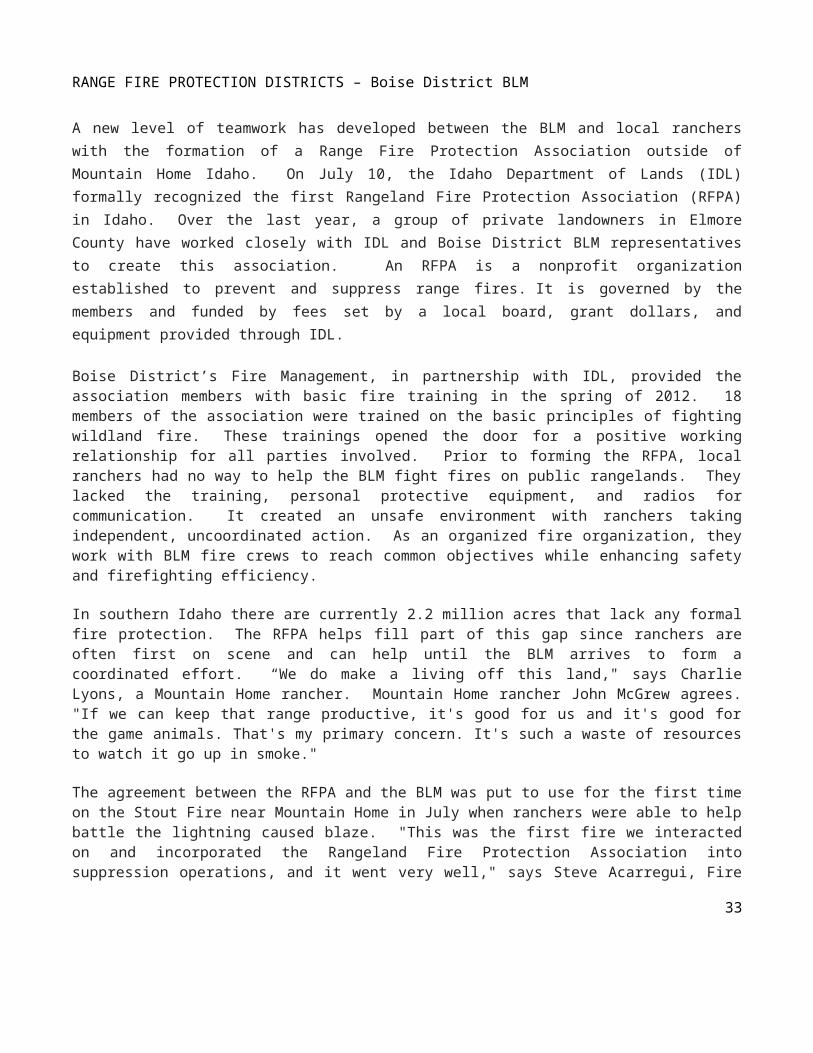
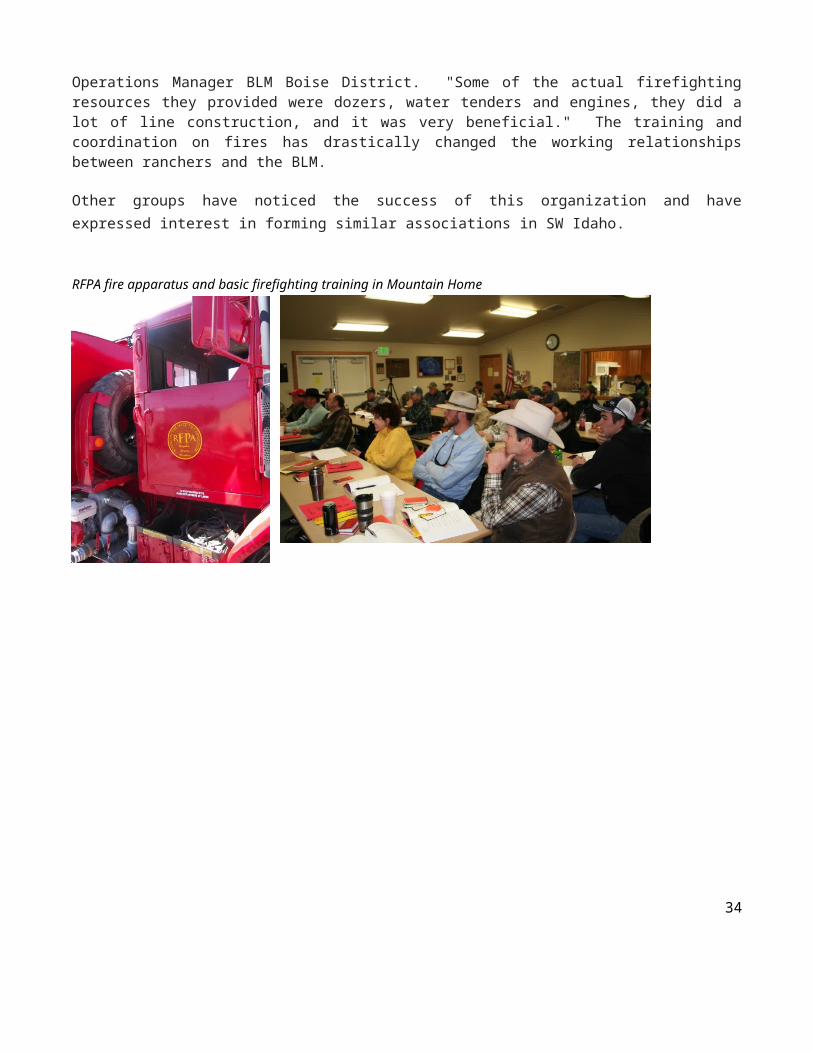
RFPA fire apparatus and basic firefighting training in Mountain Home
25
FIRE PREVENTION PROGRAM – Boise National Forest
STATISTICSAbandoned Campfires: 228Violation Notices & Warnings: 29Wildland Fire Investigations: 11
The 2012 fire season started slowly, due to the lingering wet spring and cooler temperatures. District prevention personnel were busy with training and preparation for the upcoming season. By July, forest fuels were dried out; both extremely dry fuels and a lack of rainfall were contributing factors to a year of large fires throughout Idaho. The Mountain Home District with its cured-out low elevation grass and brush went into Stage I Fire Restrictions July 17, limiting the use of campfires on public lands. Fire restrictions create an increased need for added signage as well as more patrols for enforcement. The 2012 summer was very active for the Mountain Home District with the Trinity Ridge Fire starting the first week of August and involving local fire resources until late October. The rest of the Boise began implementing extended staffing for fire danger, and by late July human and lightning caused fires were resulting in highway closures and some community evacuations. By mid-August all of the districts on the Boise were in Stage I restrictions, due to extreme fire danger, limited fire suppression resources, and abundant fire activity. Active fires as well as restrictions in place kept the district prevention personnel extremely busy, with signing for restrictions fire updates, road and area closures, as well as fire assignments both on and off forest. The fire activity combined with normal patrols resulted in hundreds of forest visitor contacts per district, with information about campfire safety, OHV travel, spark arrestor checks and firewood cutting permits.
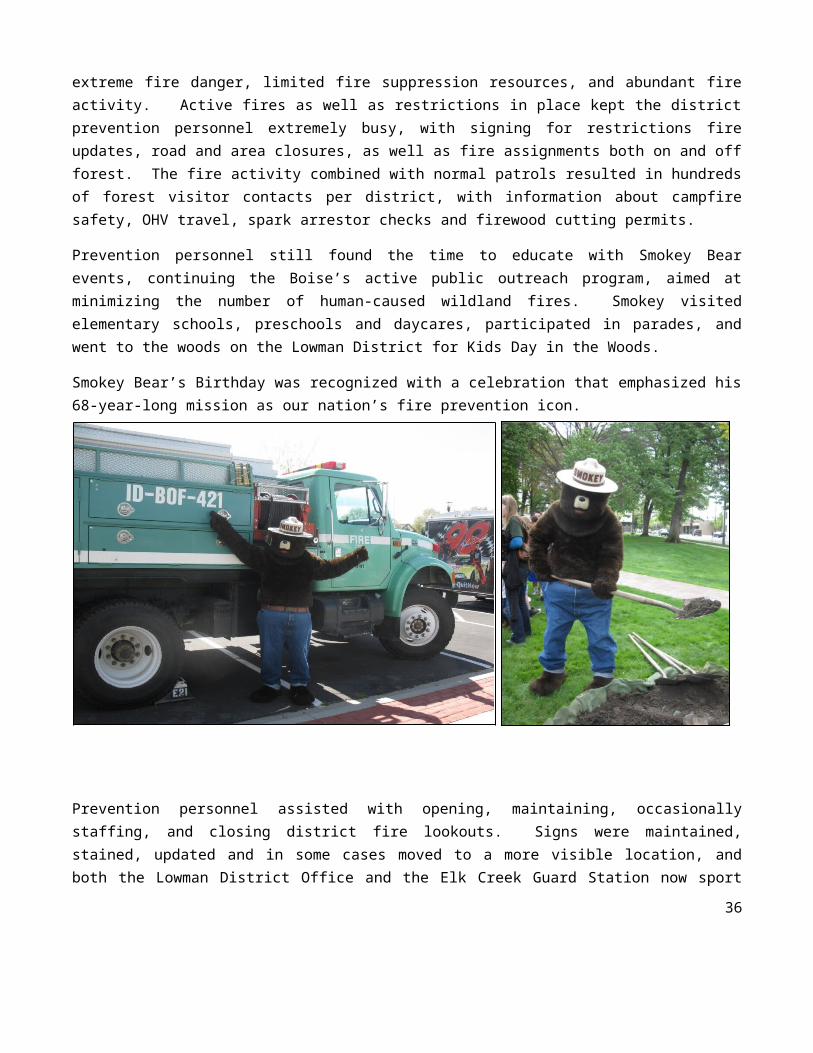
Prevention personnel still found the time to educate with Smokey Bear events, continuing the Boise’s active public outreach program, aimed at minimizing the number of human-caused wildland fires. Smokey visited elementary schools, preschools and daycares, participated in parades, and went to the woods on the Lowman District for Kids Day in the Woods.
Smokey Bear’s Birthday was recognized with a celebration that emphasized his 68-year-long mission as our nation’s fire prevention icon.
26
PERSONNELBoise, Prevention Program Ellen Dunlap-Mountain Home District Lester Creek GS Terry Carrico, Prevention 11
Rachel Parsons, Patrol 12Lucky Peak GS Jason Sandusky, Patrol 21
Della Hawkins, Patrol 22-Idaho City District Mick Yardley, Patrol 31-Cascade District Kim Drake, Patrol 41
Tyler Andrew, Prevention 42-Lowman District Penny Myers, Patrol 51
Carissa Silvis, Prevention 52-Emmett DistrictGarden Valley GS Larry Bolen, Patrol 61
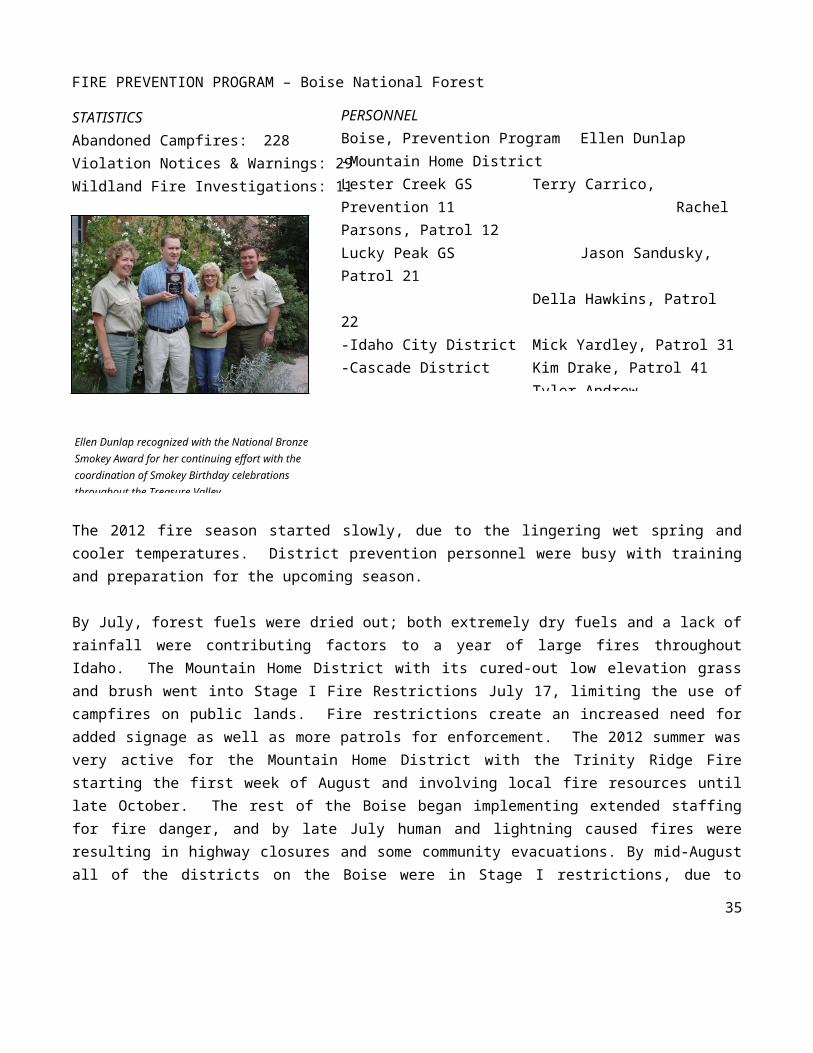
Francis White, Prevention 62Ellen Dunlap recognized with the National Bronze Smokey Award for her continuing effort with the coordination of Smokey Birthday celebrations throughout the Treasure Valley
Prevention personnel assisted with opening, maintaining, occasionally staffing, and closing district fire lookouts. Signs were maintained, stained, updated and in some cases moved to a more visible location, and both the Lowman District Office and the Elk Creek Guard Station now sport new fire information display cases. In Idaho City personnel assisted with facilities maintenance throughout the winter, as well as the maintenance of rest room facilities. District personnel continued “Operation Bucket Drop”, visiting campsites and handing out the plastic Smokey buckets complete with instructions on the proper extinguishing of campfires. All districts distributed the Motor Vehicle Use maps free to visitors.
Cascade District Prevention 42 spent 34 days with the Boise regulars; both Patrol 12 and Patrol 52 spent time with local fire crews, gaining valuable experience with initial attack and large fires. Patrol 62 out of Garden Valley apprenticed Prevention 51 on a fire investigation.
Combined totals for incident reports violation notices and warnings for all the districts but Idaho City added up to 352. There were 11 wildland fire investigations by prevention personnel and over 227 abandoned campfires documented. The Lowman District reports tremendous assistance this season from the recreation staff and their camp hosts.
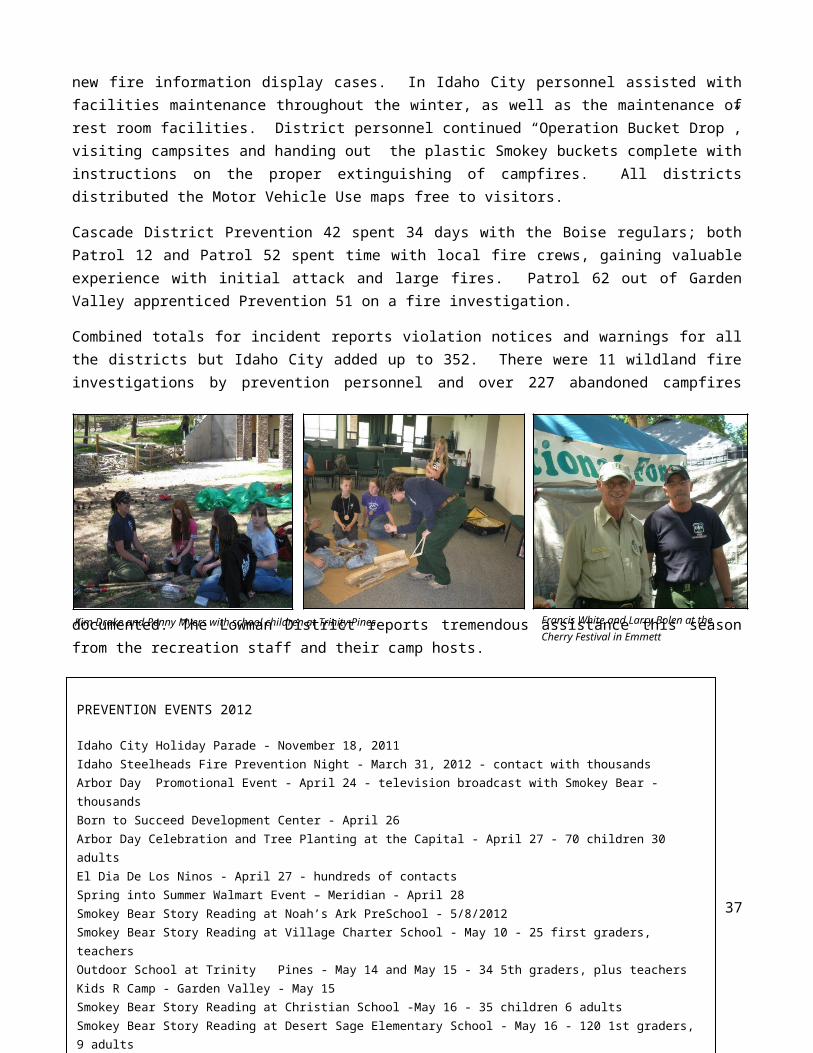
27Kim Drake and Penny Myers with school children at Trinity Pines Francis White and Larry Bolen at the
Cherry Festival in Emmett
28
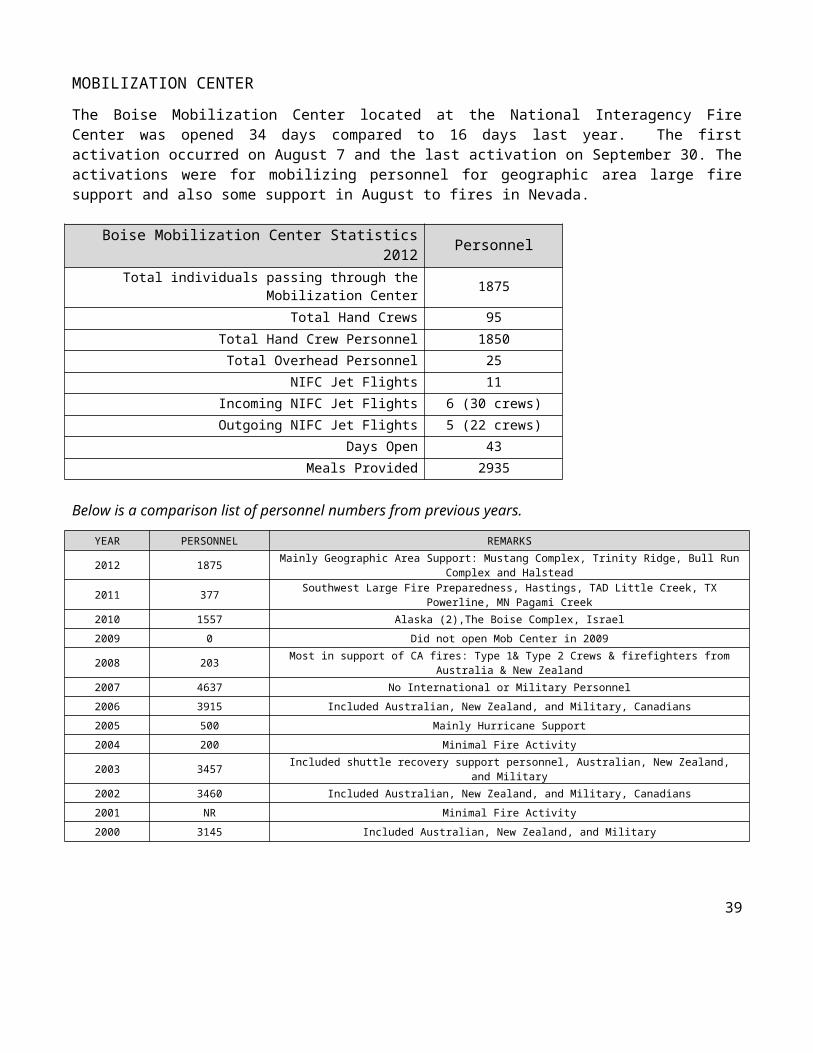
MOBILIZATION CENTER
The Boise Mobilization Center located at the National Interagency Fire Center was opened 34 days compared to 16 days last year. The first activation occurred on August 7 and the last activation on September 30. The activations were for mobilizing personnel for geographic area large fire support and also some support in August to fires in Nevada.
Boise Mobilization Center Statistics 2012 PersonnelTotal individuals passing through the Mobilization Center 1875
Total Hand Crews 95Total Hand Crew Personnel 1850
Total Overhead Personnel 25NIFC Jet Flights 11
Incoming NIFC Jet Flights 6 (30 crews)Outgoing NIFC Jet Flights 5 (22 crews)
Days Open 43Meals Provided 2935
Below is a comparison list of personnel numbers from previous years.
YEAR PERSONNEL REMARKS
2012 1875 Mainly Geographic Area Support: Mustang Complex, Trinity Ridge, Bull Run Complex and Halstead
2011 377 Southwest Large Fire Preparedness, Hastings, TAD Little Creek, TX Powerline, MN Pagami Creek
2010 1557 Alaska (2),The Boise Complex, Israel
2009 0 Did not open Mob Center in 2009
2008 203 Most in support of CA fires: Type 1& Type 2 Crews & firefighters from Australia & New Zealand
2007 4637 No International or Military Personnel
2006 3915 Included Australian, New Zealand, and Military, Canadians
2005 500 Mainly Hurricane Support
2004 200 Minimal Fire Activity
2003 3457 Included shuttle recovery support personnel, Australian, New Zealand, and Military
2002 3460 Included Australian, New Zealand, and Military, Canadians
2001 NR Minimal Fire Activity
2000 3145 Included Australian, New Zealand, and Military
29
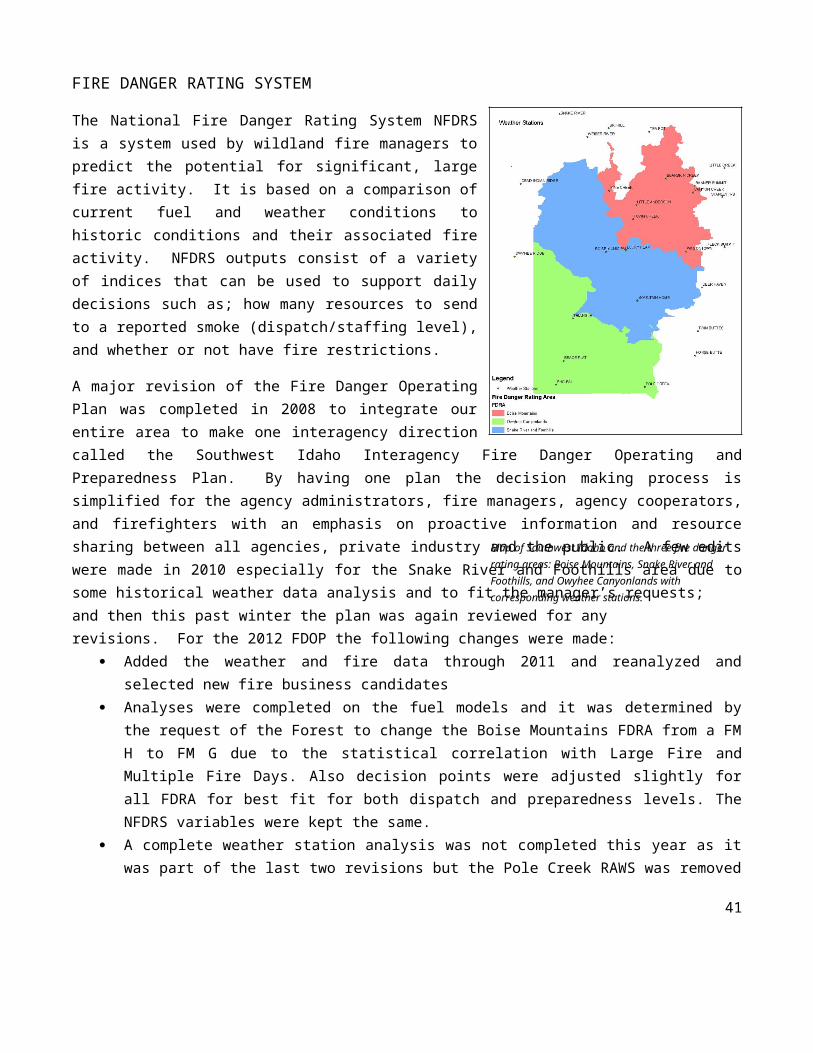
FIRE DANGER RATING SYSTEM
The National Fire Danger Rating System NFDRS is a system used by wildland fire managers to predict the potential for significant, large fire activity. It is based on a comparison of current fuel and weather conditions to historic conditions and their associated fire activity. NFDRS outputs consist of a variety of indices that can be used to support daily decisions such as; how many resources to send to a reported smoke (dispatch/staffing level), and whether or not have fire restrictions.
A major revision of the Fire Danger Operating Plan was completed in 2008 to integrate our entire area to make one interagency direction called the Southwest Idaho Interagency Fire Danger Operating and Preparedness Plan. By having one plan the decision making process is simplified for the agency administrators, fire managers, agency cooperators, and firefighters with an emphasis on proactive information and resource sharing between all agencies, private industry and the public. A few edits were made in 2010 especially for the Snake River and Foothills area due to some historical weather data analysis and to fit the manager’s requests; and then this past winter the plan was again reviewed for any revisions. For the 2012 FDOP the following changes were made:
Added the weather and fire data through 2011 and reanalyzed and selected new fire business candidates Analyses were completed on the fuel models and it was determined by the request of the Forest to
change the Boise Mountains FDRA from a FM H to FM G due to the statistical correlation with Large Fire and Multiple Fire Days. Also decision points were adjusted slightly for all FDRA for best fit for both dispatch and preparedness levels. The NFDRS variables were kept the same.
A complete weather station analysis was not completed this year as it was part of the last two revisions but the Pole Creek RAWS was removed from the Owyhee Canyonlands FDRA as it is supposed to be removed from service in FY13.
Individual weather station observations were reviewed for quality control and edited as needed for the entire analysis period. This was completed due to the poor file management that Fire Family Plus offers, different personnel working on the FDOP, and unsure on what data we did have.
The Fire History data was reviewed and cleaned within each FDRA. Also duplicate fires from agency to agency were deleted as needed. Again this was completed this year due to the poor file management that Fire Family Plus offers and different personnel working on the FDOP so not sure on the data that we had.
The Pocket Card was updated with current information. The format of the card was unchanged. Added Appendices on what was done to update Fire History and Fire Business Candidates with Fire
Family Plus.
30
Map of Southwest Idaho and the three fire danger rating areas: Boise Mountains, Snake River and Foothills, and Owyhee Canyonlands with corresponding weather stations.
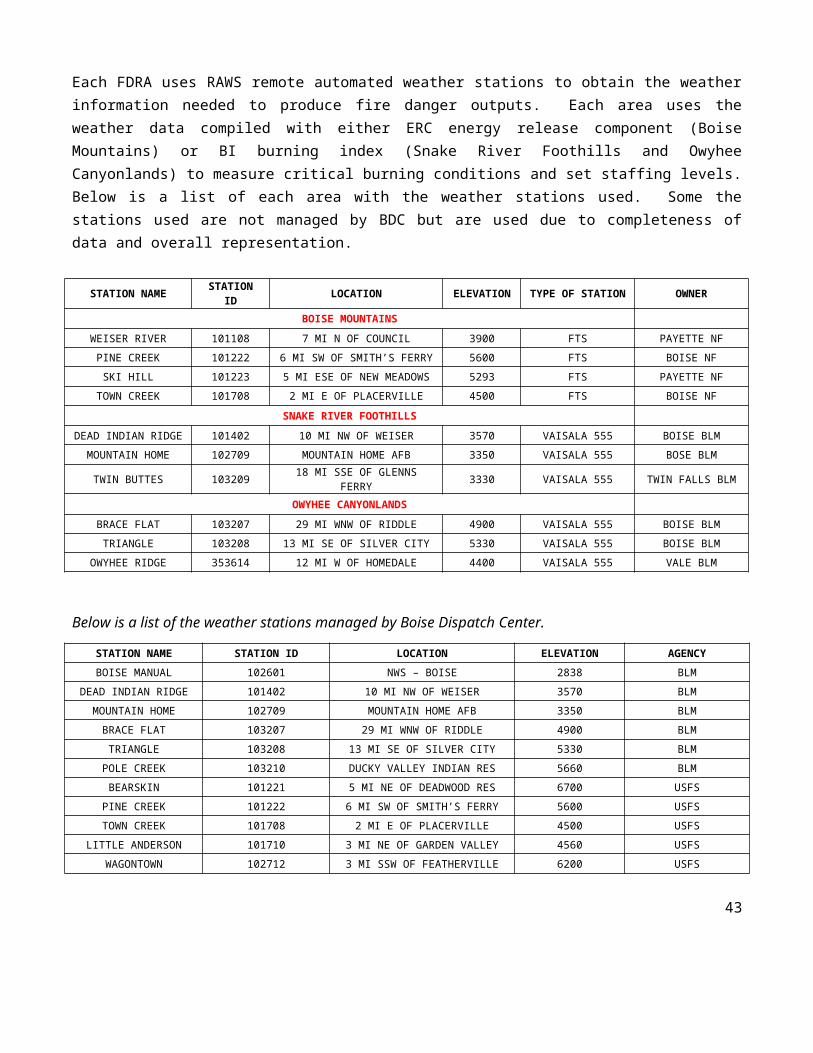
Each FDRA uses RAWS remote automated weather stations to obtain the weather information needed to produce fire danger outputs. Each area uses the weather data compiled with either ERC energy release component (Boise Mountains) or BI burning index (Snake River Foothills and Owyhee Canyonlands) to measure critical burning conditions and set staffing levels. Below is a list of each area with the weather stations used. Some the stations used are not managed by BDC but are used due to completeness of data and overall representation.
STATION NAME STATION ID LOCATION ELEVATION TYPE OF STATION OWNER
BOISE MOUNTAINS
WEISER RIVER 101108 7 MI N OF COUNCIL 3900 FTS PAYETTE NF
PINE CREEK 101222 6 MI SW OF SMITH’S FERRY 5600 FTS BOISE NF
SKI HILL 101223 5 MI ESE OF NEW MEADOWS 5293 FTS PAYETTE NF
TOWN CREEK 101708 2 MI E OF PLACERVILLE 4500 FTS BOISE NF
SNAKE RIVER FOOTHILLS
DEAD INDIAN RIDGE 101402 10 MI NW OF WEISER 3570 VAISALA 555 BOISE BLM
MOUNTAIN HOME 102709 MOUNTAIN HOME AFB 3350 VAISALA 555 BOSE BLM
TWIN BUTTES 103209 18 MI SSE OF GLENNS FERRY 3330 VAISALA 555 TWIN FALLS BLM
OWYHEE CANYONLANDS
BRACE FLAT 103207 29 MI WNW OF RIDDLE 4900 VAISALA 555 BOISE BLM
TRIANGLE 103208 13 MI SE OF SILVER CITY 5330 VAISALA 555 BOISE BLM
OWYHEE RIDGE 353614 12 MI W OF HOMEDALE 4400 VAISALA 555 VALE BLM
Below is a list of the weather stations managed by Boise Dispatch Center.
STATION NAME STATION ID LOCATION ELEVATION AGENCY
BOISE MANUAL 102601 NWS – BOISE 2838 BLM
DEAD INDIAN RIDGE 101402 10 MI NW OF WEISER 3570 BLM
MOUNTAIN HOME 102709 MOUNTAIN HOME AFB 3350 BLM
BRACE FLAT 103207 29 MI WNW OF RIDDLE 4900 BLM
TRIANGLE 103208 13 MI SE OF SILVER CITY 5330 BLM
POLE CREEK 103210 DUCKY VALLEY INDIAN RES 5660 BLM
BEARSKIN 101221 5 MI NE OF DEADWOOD RES 6700 USFS
PINE CREEK 101222 6 MI SW OF SMITH’S FERRY 5600 USFS
TOWN CREEK 101708 2 MI E OF PLACERVILLE 4500 USFS
LITTLE ANDERSON 101710 3 MI NE OF GARDEN VALLEY 4560 USFS
WAGONTOWN 102712 3 MI SSW OF FEATHERVILLE 6200 USFS
31
SOUTHWEST IDAHO PREPAREDNESS LEVEL
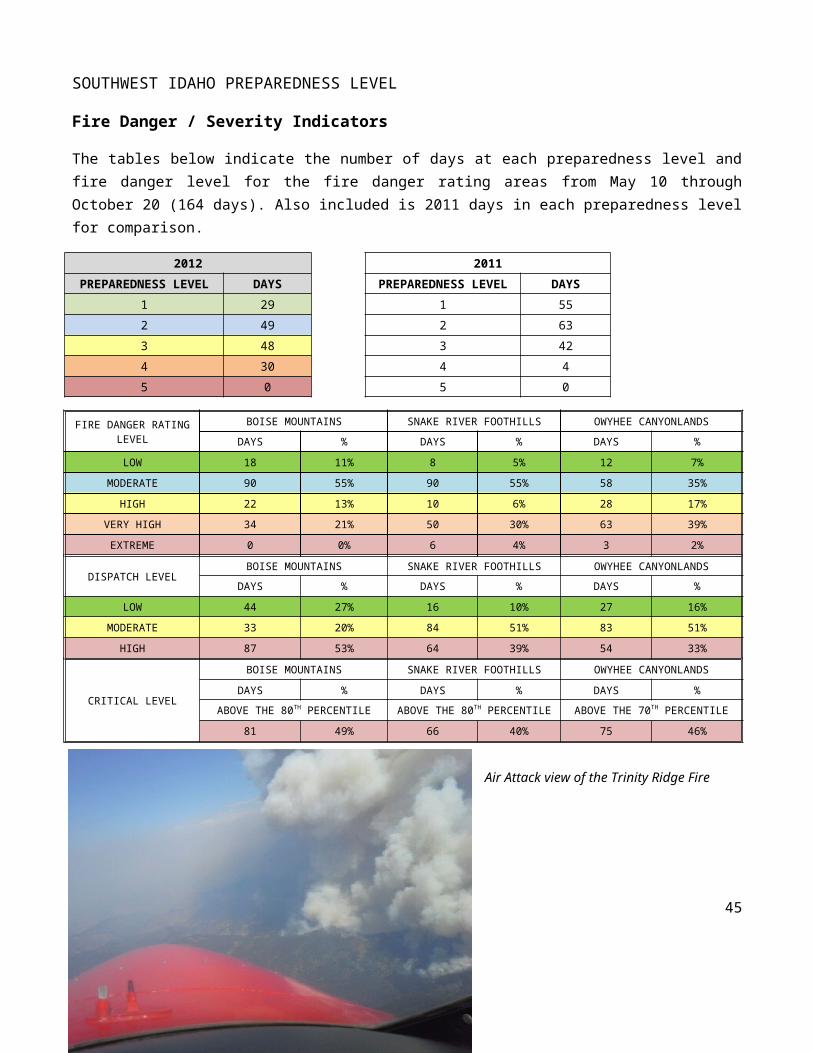
Fire Danger / Severity Indicators
The tables below indicate the number of days at each preparedness level and fire danger level for the fire danger rating areas from May 10 through October 20 (164 days). Also included is 2011 days in each preparedness level for comparison.
2012 2011PREPAREDNESS LEVEL DAYS PREPAREDNESS LEVEL DAYS
1 29 1 552 49 2 633 48 3 424 30 4 45 0 5 0
FIRE DANGER RATINGLEVEL
BOISE MOUNTAINS SNAKE RIVER FOOTHILLS OWYHEE CANYONLANDS
DAYS % DAYS % DAYS %
LOW 18 11% 8 5% 12 7%
MODERATE 90 55% 90 55% 58 35%
HIGH 22 13% 10 6% 28 17%
VERY HIGH 34 21% 50 30% 63 39%
EXTREME 0 0% 6 4% 3 2%
DISPATCH LEVELBOISE MOUNTAINS SNAKE RIVER FOOTHILLS OWYHEE CANYONLANDS
DAYS % DAYS % DAYS %
LOW 44 27% 16 10% 27 16%
MODERATE 33 20% 84 51% 83 51%
HIGH 87 53% 64 39% 54 33%
CRITICAL LEVEL
BOISE MOUNTAINS SNAKE RIVER FOOTHILLS OWYHEE CANYONLANDS
DAYS % DAYS % DAYS %
ABOVE THE 80TH PERCENTILE ABOVE THE 80TH PERCENTILE ABOVE THE 70TH PERCENTILE
81 49% 66 40% 75 46%
Air Attack view of the Trinity Ridge Fire
32
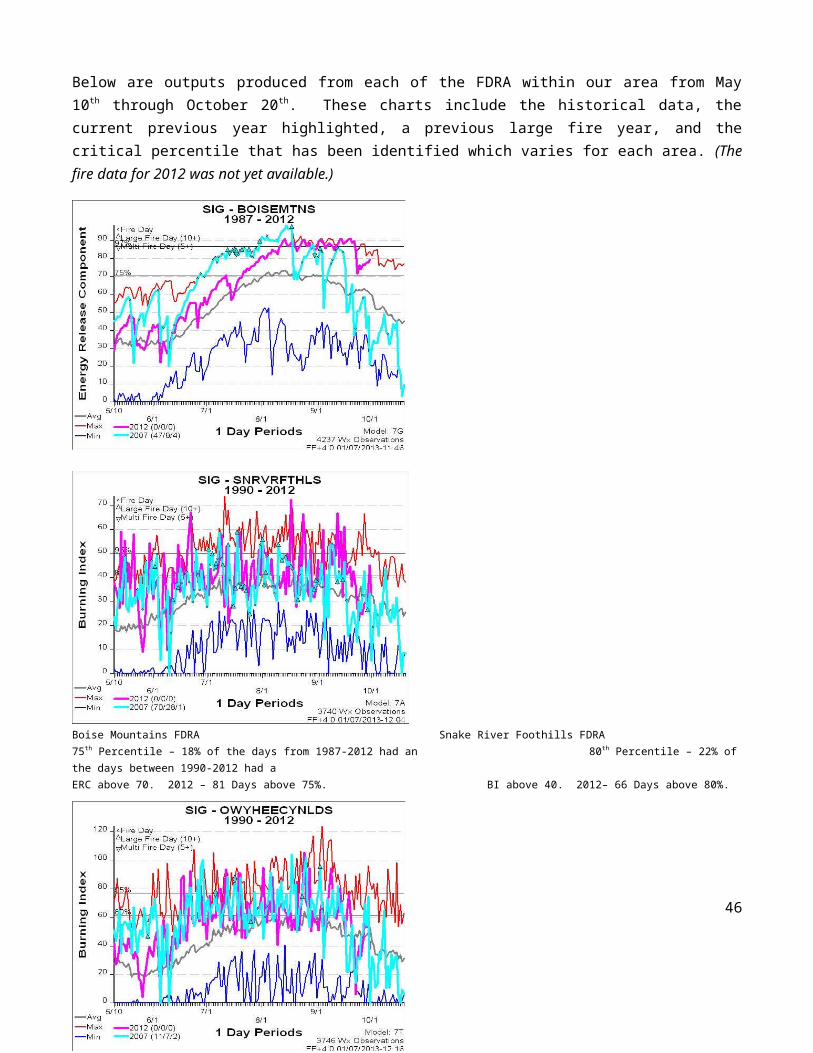
Below are outputs produced from each of the FDRA within our area from May 10 th through October 20th. These charts include the historical data, the current previous year highlighted, a previous large fire year, and the critical percentile that has been identified which varies for each area. (The fire data for 2012 was not yet available.)
Boise Mountains FDRA Snake River Foothills FDRA75th Percentile – 18% of the days from 1987-2012 had an 80th Percentile – 22% of the days between 1990-2012 had aERC above 70. 2012 – 81 Days above 75%. BI above 40. 2012– 66 Days above 80%.
33
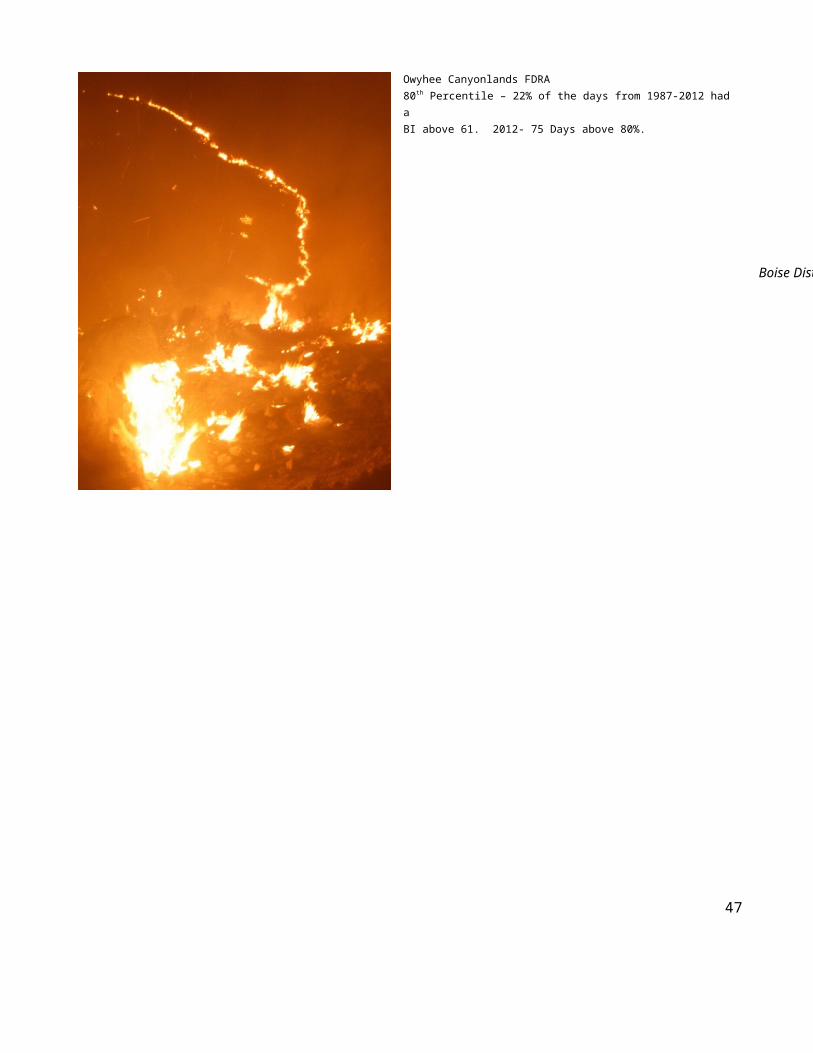
Owyhee Canyonlands FDRA80th Percentile – 22% of the days from 1987-2012 had aBI above 61. 2012- 75 Days above 80%.
34
Boise District BLM Jump Fire
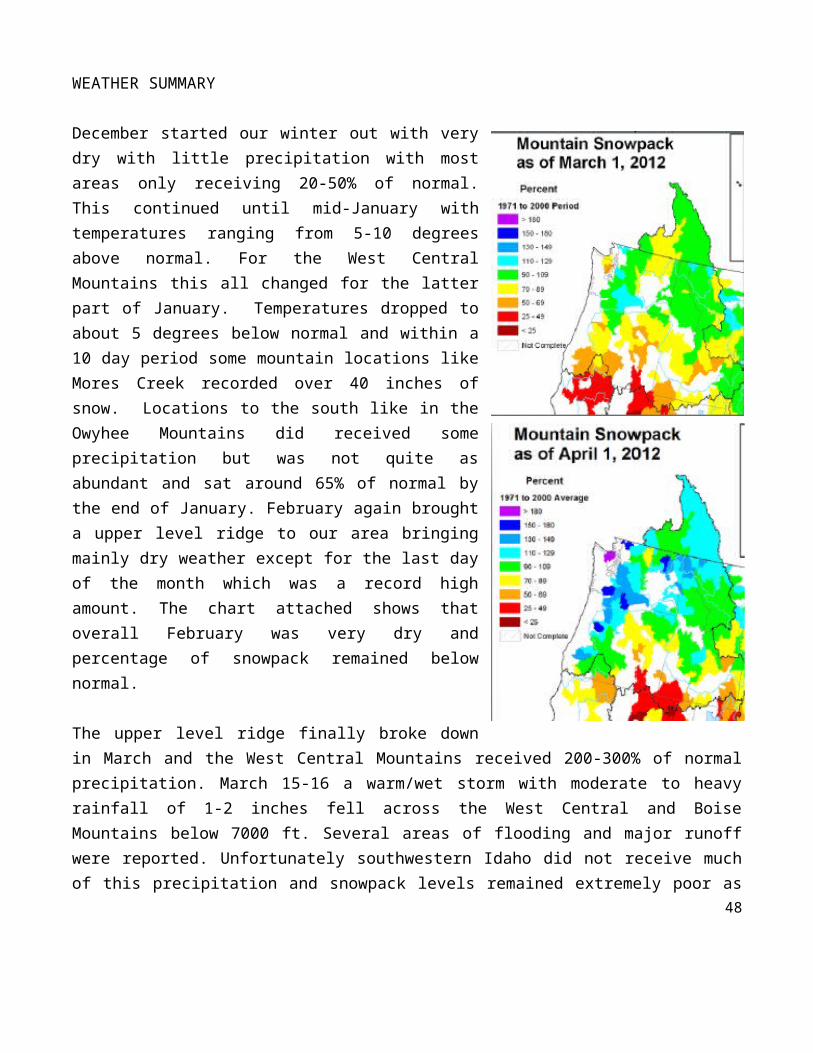
WEATHER SUMMARY
December started our winter out with very dry with little precipitation with most areas only receiving 20-50% of normal. This continued until mid-January with temperatures ranging from 5-10 degrees above normal. For the West Central Mountains this all changed for the latter part of January. Temperatures dropped to about 5 degrees below normal and within a 10 day period some mountain locations like Mores Creek recorded over 40 inches of snow. Locations to the south like in the Owyhee Mountains did received some precipitation but was not quite as abundant and sat around 65% of normal by the end of January. February again brought a upper level ridge to our area bringing mainly dry weather except for the last day of the month which was a record high amount. The chart attached shows that overall February was very dry and percentage of snowpack remained below normal.
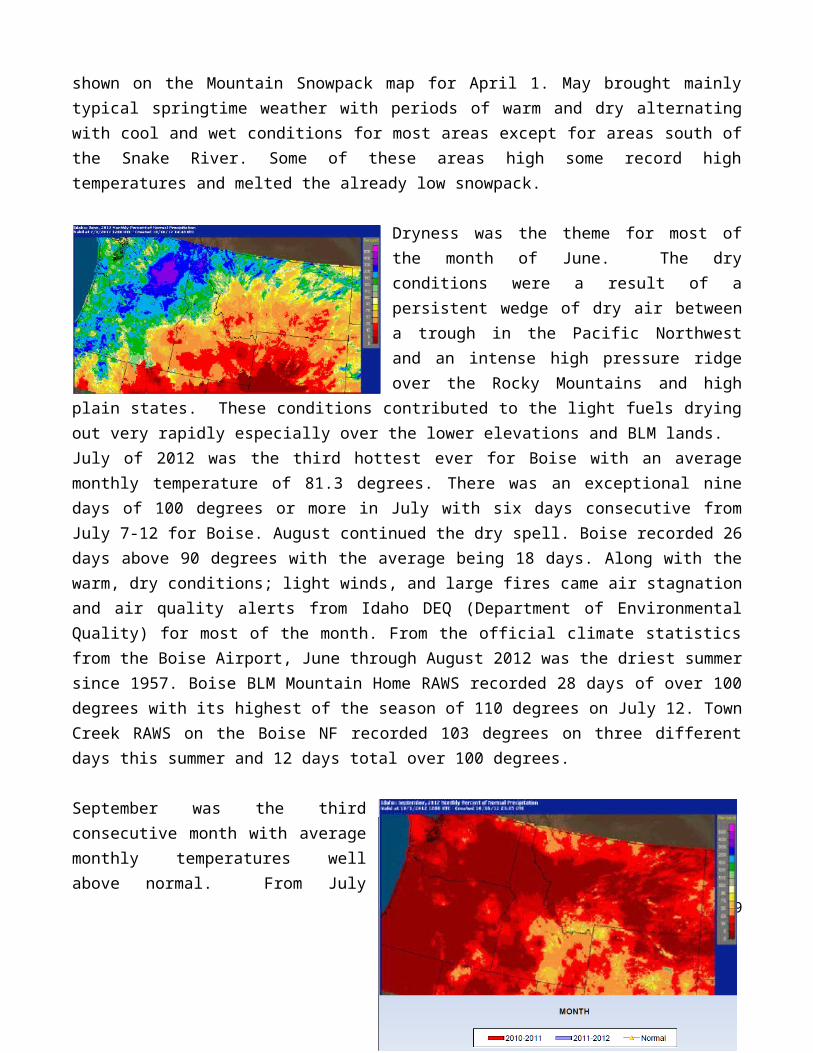
The upper level ridge finally broke down in March and the West Central Mountains received 200-300% of normal precipitation. March 15-16 a warm/wet storm with moderate to heavy rainfall of 1-2 inches fell across the West Central and Boise Mountains below 7000 ft. Several areas of flooding and major runoff were reported. Unfortunately southwestern Idaho did not receive much of this precipitation and snowpack levels remained extremely poor as shown on the Mountain Snowpack map for April 1. May brought mainly typical springtime weather with periods of warm and dry alternating with cool and wet conditions for most areas except for areas south of the Snake River. Some of these areas high some record high temperatures and melted the already low snowpack.
Dryness was the theme for most of the month of June. The dry conditions were a result of a persistent wedge of dry air between a trough in the Pacific Northwest and an intense high pressure ridge over the Rocky Mountains and high plain states. These conditions contributed to the light fuels drying out very rapidly especially over the lower elevations and BLM lands.
35
July of 2012 was the third hottest ever for Boise with an average monthly temperature of 81.3 degrees. There was an exceptional nine days of 100 degrees or more in July with six days consecutive from July 7-12 for Boise. August continued the dry spell. Boise recorded 26 days above 90 degrees with the average being 18 days. Along with the warm, dry conditions; light winds, and large fires came air stagnation and air quality alerts from Idaho DEQ (Department of Environmental Quality) for most of the month. From the official climate statistics from the Boise Airport, June through August 2012 was the driest summer since 1957. Boise BLM Mountain Home RAWS recorded 28 days of over 100 degrees with its highest of the season of 110 degrees on July 12. Town Creek RAWS on the Boise NF recorded 103 degrees on three different days this summer and 12 days total over 100 degrees.
September was the third consecutive month with average monthly temperatures well above normal. From July through September, Boise, as shown on the chart, only recorded 0.12” of precipitation which was one of the driest on record. Again with the stagnant air, hot and dry conditions; and large fires came poor and hazardous air quality throughout the area. On at least 15 days in September for Boise the smoke was the prevailing weather and visibility was reduced to 2-3 miles for the Treasure Valley area. DEQ also issued several air quality alerts. Finally during the last couple days of the month, stronger winds aloft allowing smoke to clear and improving the air quality.
October started off dry but the first significant rainfall came on the 15th and 16th. A weather system raced across the area producing the most widespread precipitation for the entire area it had seen in several months. Along with the precipitation came high winds, thunderstorms and cooler conditions. Flash flood watches and warnings were issued for many of the mountain areas. The areas affected by wildfires this past summer did see some rock and mudslides.
36
SEASONAL WEATHER & SEVERITY
Below is the percent of average for snow water equivalent (SWE) and precipitation statistics by SNOTEL stations within our area.
END OF THE MONTH
PCT OF AVG
DEADWOOD SUMMIT
ATLANTA SUMMIT
JACKSON PEAK
MORES CREEK SUMMIT
TRINITY MOUNTAIN
MUD FLAT
SOUTH MOUNTAIN
WILSON CREEK
OCTOBERSWE* 0 0 0 NR 57 NR NR NR
PRECIP 124 196 173 175 197 178 168 169
NOVEMBERSWE 88 102 120 105 86 86 82 90
PRECIP 93 121 125 100 114 96 88 114
DECEMBERSWE 69 82 82 68 76 27 36 51
PRECIP 75 92 95 85 88 59 60 78
JANUARYSWE 92 99 97 95 93 78 74 52
PRECIP 87 105 106 103 102 91 84 74
FEBRUARYSWE 84 97 94 93 85 69 71 58
PRECIP 80 99 100 105 95 82 83 77
MARCHSWE 123 125 119 103 108 0 78 42
PRECIP 103 120 121 119 114 90 98 79
APRILSWE 133 116 104 91 99 NR 0 0
PRECIP 106 121 118 119 115 89 97 71
MAYSWE 150 61 71 NR 99 NR NR NR
PRECIP 107 119 115 117 112 84 92 69
JUNESWE NR NR NR NR 201 NR NR NR
PRECIP 106 117 112 113 109 78 91 65
NR = DATA MAY NOT PROVIDE A VALID MEASURE OF CONDITIONS
The water year runs from October 1 to September 30. Precipitation data totals for 2012 are compared to the historical annual average (1971-2000).
SNOTEL SITE ELEVATION 2011 WATER YEAR TOTAL INCHES
ANNUAL AVERAGE TOTAL INCHES % OF AVERAGE
DEADWOOD SUMMIT 6860 57.0 61.2 93
ATLANTA SUMMIT 7580 48.5 45.7 106
JACKSON PEAK 7070 47.8 45.7 105
MORES CREEK SUMMIT 6100 48.7 49.0 99
TRINITY MOUNTAIN 7770 53.9 53.6 101
MUD FLAT 5730 12.3 17.6 70
SOUTH MOUNTAIN 6500 29.6 33.4 89
WILSON CREEK 7120 19.0 27.2 70
37

The graphs depict the snow water equivalent and precipitation for the 2012 Water Year.
Atlanta SummitLocated: Mountain Home RD, Boise NF
Elevation: 7580 ftLatitude: 43 45’
Longitude: 115 14’
Deadwood SummitLocated: Mountain Home RD, Boise NF
Elevation: 7580 ftLatitude: 43 45’
Longitude: 115 14’
Jackson PeakLocated: Lowman RD, Boise NF
Elevation: 7070 ftLatitude: 43 03’
Longitude: 115 26’
Trinity MountainLocated: Mountain Home RD, Boise NF
Elevation: 7770 ftLatitude: 43 37’
Longitutde: 115 26’38
Mores Creek SummitLocated: Idaho City RD, Boise NF
Elevation: 6100 ftLatitude: 43 55’
Longitude: 115 39’
Mud FlatLocated: Bruneau FO, Boise BLM
Elevation: 5730 ftLatitude: 42 36’
Longitude: 116 33’
South MountainLocated: Owyhee FO, Boise BLM
Elevation: 6500 ftLatitude: 42 45”
Longitude: 116 54’
Wilson CreekLocated: Jarbidge FO, Twin Falls BLM
Elevation: 7120 ftLatitude: 42 00’
Longitude: 115 00’
LIGHTNING SUMMARY
39

Boise District BLM
The first lightning fire called Slackart, occurred on April 22 within the Boise BLM protection area and burned for 1/2 acre. The first multiple lightning cause fire day was June 2 with two starts for a total of 495 acres. The largest lightning bust occurred July 7-9 with 12 starts for a total of 93,193 acres. Throughout the season the range lands had 39 lightning fires with the largest being the Jacks fire for 48,894 acres. The last lightning caused fire was Northbonn which burned one acre on September 9. The ten year average (2002-2011) is 33 for lightning ignited fires within Boise District BLM.
Boise National Forest
The first lightning fire occurred on July 8 on the Mountain Home RD and burned for 0.25 acre. The largest lightning bust didn’t occur until September 9-10 with 13 starts for a total of 74 acres. The largest lightning caused fire started on September 9 which was the Trail Creek Fire that burned for 35 acres. The last lightning caused fire occurred on September 29 for 0.10 acre. The forest only had a total of 39 lightning starts this year compared to the ten year average (2002-2011) of 109 within Boise National Forest protection area.
Idaho Department of Lands
The first lightning fire occurred on July 8 called Town Creek and burned for 1 acre. Southwest Idaho had a total of 6 lightning caused fires that burned just over 6 acres. The biggest lightning start day occurred July 8-9 for three fires for just over 5 acres. The largest lightning ignited incident was the Old Centerville fire on July 8 for 4 acres. The last lightning fire was on September 9 for 0.25 acre. The ten year average (2002-2011) is 17 lightning ignited fires within Southwest Idaho Department of Lands protection area.
FUEL MOISTURE
Snake River & Foothills and Owyhee Canyonlands Areas
The Boise District BLM Fuels program collects the live fuel moisture data at five different locations throughout the district. Blackstone is a new fuel moisture site this year and its readings were very low in comparison to other sites on the district. The following is a chart of their readings which are color coded by expected fire behavior. From the Guidelines for Fire Behavior and Tactics Based on Live Fuel Moisture Values in the Great Basin Fuel Project as described below: Fuel moistures from 101-125% will exhibit high fire behavior with frontal attack with engines and/or dozers will be nearly impossible on large fires. This year the live fuel moistures hit this level at the end of June and beginning of July which was usually early for this area.
40
4/15 5/1 5/15 6/1 6/15 7/1 7/15 8/1 8/15 9/1 9/15 10/1 10/15 11/1
HAMMETT NR NR 172 135 115 90 96 80 79 83 88 78 78 81HAMMETT
AVG 245 222 189 180 151 116 107 94 88 80 82 77 85 76
KUNA 209 NR 206 160 140 116 115 84 82 76 74 67 80 89KUNAAVG 217 210 186 165 147 106 96 84 77 80 73 67 79 64
WILD WEST NR NR 192 123 111 78 86 62 63 51 59 61 66 104WILD WEST
AVG 219 215 195 158 138 113 92 82 77 77 73 76 85 81
TRIANGLE 139 NR 182 171 161 129 97 93 77 91 82 93 82 83TRIANGLE
AVG NR 141 NR 240 230 170 154 135 124 110 91 95 101 NR
BLACKSTONE NR NR NR NR NR 68 48 40 55 54 55 57 66 56GREEN: Very Low and Low Fire Behavior. BLUE: Moderate Fire Behavior. YELLOW: High Fire Behavior. ORANGE: Extreme Fire Behavior. RED: Advanced Fire Behavior.
FIRE BEHAVIOR AND TACTICSLive Fuel Moisture
181% & Above - Fires will exhibit VERY LOW BEHAVIOR with difficulty burning. Residual fine fuels from the previous year may carry the fire. Foliage will remain on the stems following the burn. Fires can generally be attacked at the head or flanks by persons using hand tools. Hand line should hold fire without any problems. Fires will normally go out as soon as wind dies down.
151%-180% - Fires will exhibit LOW FIRE BEHAVIOR with fire beginning to be carried in the live fuels. Both foliage and stem material up to 1/4 inch in diameter will be consumed by the fire. Burns will be generally patchy with many unburned islands. Engines may be necessary to catch fires at the head and handling will be more difficult to construct, but should hold at the head and the flanks.
126%-150% - Fires will exhibit MODERATE FIRE BEHAVIOR with a fast continuous rate of spread that will consume stem material up to 2 inches in diameter. These fires may be attacked at the head with engines but may require support of dozers and retardant aircraft. Handline will become ineffective at the fire head, but should still hold at the flanks. Under high winds and low humidity, indirect line should be given considerations.
101%-125% - Fires will exhibit HIGH FIRE BEHAVIOR leaving no material unburned. Head attack with fire engines and dozers will be nearly impossible on large fires, but may still be possible on smaller, developing fires. Retardant aircraft will be necessary on all these fires. Flanking attack by engines and indirect attack ahead of the fire must be used. Spotting should be anticipated. Fires will begin to burn through the night, calming down several hours before sunrise.
75%-100% - Fires will exhibit EXTREME FIRE BEHAVIOR. Extreme rates of spread and moderate to long range spotting will occur. Engines and dozers may be best used to back up firing operations, and to protect structures. Indirect attack must be used to control these fires. Fires will burn actively through the night. Air turbulence caused by the fire will cause problems for air operations.
74% & Below - Fires will have ADVANCED FIRE BEHAVIOR with high potential to control their environment. Large acreage will be consumed in a very short time period. Backfiring from indirect line, roads, etc. must be considered. Aircraft will need to be cautious of hazardous turbulence around the fire.
41
Shown are graphs indicating the 10 hour and woody fuel moisture status for the Snake River and Foothills and Owyhee Canyonlands Areas from May 10 to October 20. They include the historical data, the current previous year highlighted, a previous large fire year and the 5th and 20th percentiles. (The fire data for 2012 is not yet available.)
42
Boise BLM engine crew on assignment in Colorado
Boise Mountains Area
The RAWS information below on the forest land depicts the near average snowpack in the mountains but also the warmer, drier spring with below average precipitation. Most of the forest RAWS greened up in May and the northern most RAWS Bearskin the forests northern most RAWS with the elevation of 6,700 feet greened up in June. At the beginning of May, Little Anderson RAWS (4500 ft) the fuels assessment showed the grass growth about 12 inches in height and then by the middle of June it had doubled and mostly cured. The 10,000 hour fuel moistures for this site showed 14-15% below average the beginning of August. The fuels at the Little Anderson site were drier this season than any personnel fuel moisture data collected for the past 12 years and this is also reflected below from the collaboration of RAWS within the Fire Danger Rating Area.
Shown are graphs indicating the 1000 hour and woody fuel moisture status for the Boise Mountains Area from May 10 to October 20. They include the historical data, the current previous year highlighted, a previous large fire year, and the 3rd and 20th percentiles. (The fire data for 2012 is not yet available.
43
Aerial view of the Trinity Ridge fire on the Boise National Forest

FUEL MOISTURE CHARTS
Below is fuel moisture information that is gathered by our local units and then inputted into the National Fuel Moisture Database. This database is used by predictive services to compare years, compile trends and to assist in predicting what type of fire season we might see. Boise District BLM has moistures back to 2002, Boise National Forest started this process in 2007 and Idaho Department of Lands joined in 2008. Over the years it will be a valuable resource.
Boise District BLMThere are five sites that are used to collect sagebrush fuel samples: Hammett to the East, Triangle in the southwest, Blackstone for the most southeastern portion, Kuna in the middle, and Wild West to the north. The following charts show the current year, historical average and the low for the timeframe.
01-01
01-15
02-01
02-15
03-01
03-15
04-01
04-15
05-01
05-15
06-01
06-15
07-01
07-15
08-01
08-15
09-01
09-15
10-01
10-15
11-01
11-15
12-01
12-15
2012 172 135 115 90 96 80 79 83 88 78 78 81 107
2011 258 219 222 192 166 137 118 116 104 96 89 116
2008 198 150 155 139 104 102 86 92 83 76
2007 105 99 96 45 90 85 79
Avg 214 245 222 189 180 151 116 107 94 88 80 82 77 85 76
Low 188 209 198 150 136 98 82 79 81 45 51 66 64 62 67
44
01-01
01-15
02-01
02-15
03-01
03-15
04-01
04-15
05-01
05-15
06-01
06-15
07-01
07-15
08-01
08-15
09-01
09-15
10-01
10-15
11-01
11-15
12-01
12-15
2012 209 206 160 140 116 115 84 82 76 74 67 80 89 99
2011 209 208 210 206 159 145 111 105 109 73 74 109
2008 213 200 143 148 125 97 80 98 65 96
2007 95 77 76 37 74 68 105
Avg 208 217 210 186 165 147 106 96 84 77 80 73 67 79 64
Low 188 209 154 157 118 76 58 48 60 37 64 59 41 40 46
01-01
01-15
02-01
02-15
03-01
03-15
04-01
04-15
05-01
05-15
06-01
06-15
07-01
07-15
08-01
08-15
09-01
09-15
10-01
10-15
11-01
11-15
12-01
12-15
2012 192 126 111 78 86 62 63 51 59 61 66 104 113
2011 228 235 206 174 143 123 104 92 87 75 68 92
2008 212 200 157 142 117 97 77 95 73 87
45
2007 85 109 83 78 44 79 86 92
Avg 200 219 215 195 158 138 113 92 82 77 77 73 76 85 81
Low 200 203 202 182 85 92 67 70 70 44 62 61 52 51 67
01-01
01-15
02-01
02-15
03-01
03-15
04-01
04-15
05-01
05-15
06-01
06-15
07-01
07-15
08-01
08-15
09-01
09-15
10-01
10-15
11-01
11-15
12-01
12-15
2012 139 182 171 161 129 97 93 77 91 82 93 82 83 87
2011 141 240 236 189 154 133 129 89 101
2010 224 170 119 110 112 94 92
2009 141 128 107 95
Avg 141 240 230 170 154 135 124 110 91 95 101
Low 141 240 224 170 119 110 112 94 89 95 101 Fuel Moisture data only available starting in 2009.
46
01-01
01-15
02-01
02-15
03-01
03-15
04-01
04-15
05-01
05-15
06-01
06-15
07-01
07-15
08-01
08-15
09-01
09-15
10-01
10-15
11-01
11-15
12-01
12-15
201 68 48 40 55 54 55 57 66 56 86AvgLow
Fuel Moisture data only available starting in 2012.
Boise National Forest
There are four sites that are used to collect fuel samples: Idaho City Ranger District for the southern part of the forest and Cascade, Lowman and Emmett Ranger Districts for the north. The following charts show the current year, historical average and the low for the timeframe.
01-01
01-15
02-01
02-15
03-01
03-15
04-01
04-15
05-01
05-15
06-01
06-15
07-01
07-15
08-01
08-15
09-01
09-15
10-01
10-15
11-01
11-15
12-01
12-15
2012 26 17 6 7 8
2011 85 28 4 6 6 11
2008 120 29 19 14 15 5 10
2007 10 85 24 11 5 7 14
Avg 120 57 19 50 38 13 5 11 9 10 14
Low 120 29 10 14 4 6 5 5 7 8 14
47
01-01
01-15
02-01
02-15
03-01
03-15
04-01
04-15
05-01
05-15
06-01
06-15
07-01
07-15
08-01
08-15
09-01
09-15
10-01
10-15
11-01
11-15
12-01
12-15
2012 211 105 132 132 110
2011 110 102 116 120 164 169
2008 104 92 101 97 123 112 114
2007 94 92 115 126 120 109 107
Avg 104 101 99 98 110 131 120 148 133 140 107
Low 104 92 94 92 101 120 120 112 109 114 107
01-01
01-15
02-01
02-15
03-01
03-15
04-01
04-15
05-01
05-15
06-01
06-15
07-01
07-15
08-01
08-15
09-01
09-15
10-01
10-15
11-01
11-15
12-01
12-15
2012 169 120 79 92
2011 115 211 174 161 102 108
2008 96 117 118 138 117 107 79
2007 157 148 133 102 94 80 87
Avg 96 116 162 143 164 132 94 109 92 95 87
Low 96 115 118 138 133 102 94 100 80 79 87
48
01-01
01-15
02-01
02-15
03-01
03-15
04-01
04-15
05-01
05-15
06-01
06-15
07-01
07-15
08-01
08-15
09-01
09-15
10-01
10-15
11-01
11-15
12-01
12-15
2012 29 13 10 9 7 9 8
2011 36 21 21 18 11 9 10
2008 34 14 6 8 12 12
2007 13 9 9 6 6
Avg 50 34 33 19 13 11 11 10 9 10
Low 50 34 29 13 6 8 9 6 6 8
01-01
01-15
02-01
02-15
03-01
03-15
04-01
04-15
05-01
05-15
06-01
06-15
07-01
07-15
08-01
08-15
09-01
09-15
10-01
10-15
11-01
11-15
12-01
12-15
2012 113 114 107 111 118 112 115
2011 123 170 121 120 112 112 112
2008 141 165 235 128 152 140
2007 300 150 117 113 190 127
Avg 145 141 167 146 159 117 132 138 122 116
49
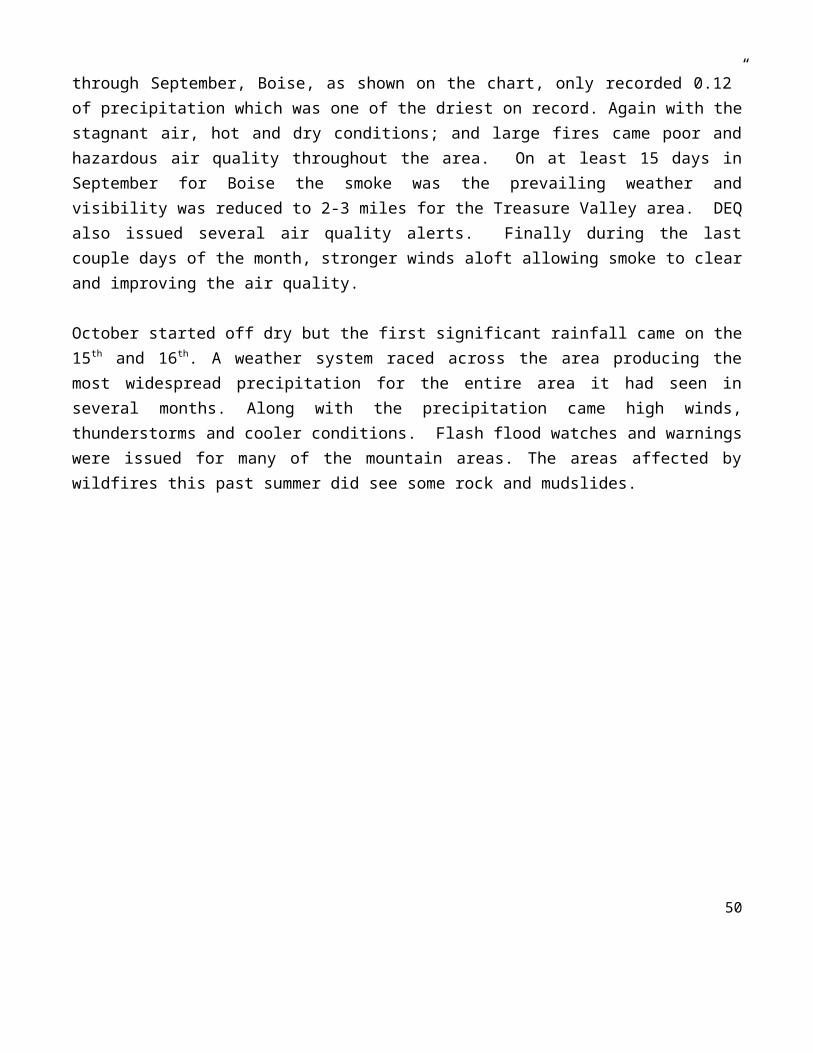
Low 145 141 113 98 114 107 111 112 112 112
01-01
01-15
02-01
02-15
03-01
03-15
04-01
04-15
05-01
05-15
06-01
06-15
07-01
07-15
08-01
08-15
09-01
09-15
10-01
10-15
11-01
11-15
12-01
12-15
2012 112 108 108 108 110 106 107
2011 116 142 109 117 108 107 109
2008 407 269 254 200 196 207
2007 300 202 206 238 104 89
Avg 407 213 222 199 166 152 145 115 109
Low 407 112 142 108 108 108 104 89 107
01-01
01-15
02-01
02-15
03-01
03-15
04-01
04-15
05-01
05-15
06-01
06-15
07-01
07-15
08-01
08-15
09-01
09-15
10-01
10-15
11-01
11-15
12-01
12-15
2012 23 23 29 14 20 9 4 9 6 8
50
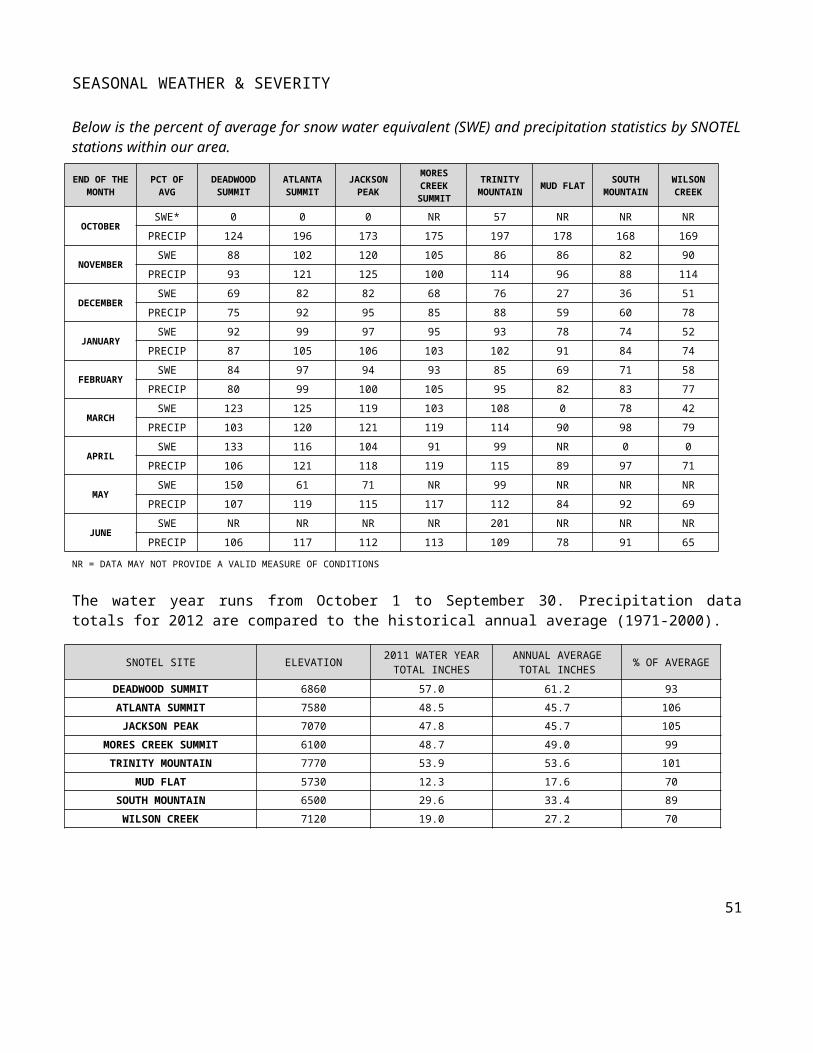
2011 53 8 9
2008 25 16 22 31 13 12 15 7
2007 28 16
Avg 29 23 23 35 20 15 10 10 16 8 8
Low 25 16 16 22 14 8 9 4 9 6 8
01-01
01-15
02-01
02-15
03-01
03-15
04-01
04-15
05-01
05-15
06-01
06-15
07-01
07-15
08-01
08-15
09-01
09-15
10-01
10-15
11-01
11-15
12-01
12-15
2012 95 91 93 251 139 140 121 107 117 113
2011 90 99 134
2009 114
2008 260 96 100 44
Avg 83 91 92 210 124 123 111 111 91 113
Low 70 91 90 120 99 96 100 107 44 113
51

01-01
01-15
02-01
02-15
03-01
03-15
04-01
04-15
05-01
05-15
06-01
06-15
07-01
07-15
08-01
08-15
09-01
09-15
10-01
10-15
11-01
11-15
12-01
12-15
2012 245 263 187 176 159 135 110 100 111 94
2011 272 154 137
2008 266 126 108 95
2007 195
Avg 300 245 229 230 210 161 133 109 115 101 94
Low 300 245 195 187 176 154 126 108 100 95 94
01-01
01-15
02-01
02-15
03-01
03-15
04-01
04-15
05-01
05-15
06-01
06-15
07-01
07-15
08-01
08-15
09-01
09-15
10-01
10-15
11-01
11-15
12-01
12-15
2012 24 18 7 7
2011 24 35 19 12
2008 20 16 9 8 5 16
2007 30 21 19 23 13 7 11
Avg 27 27 21 23 23 20 14 15 10 7 10 9 12 16
Low 24 23 21 19 16 13 9 7 8 7 5 7 12 16
52
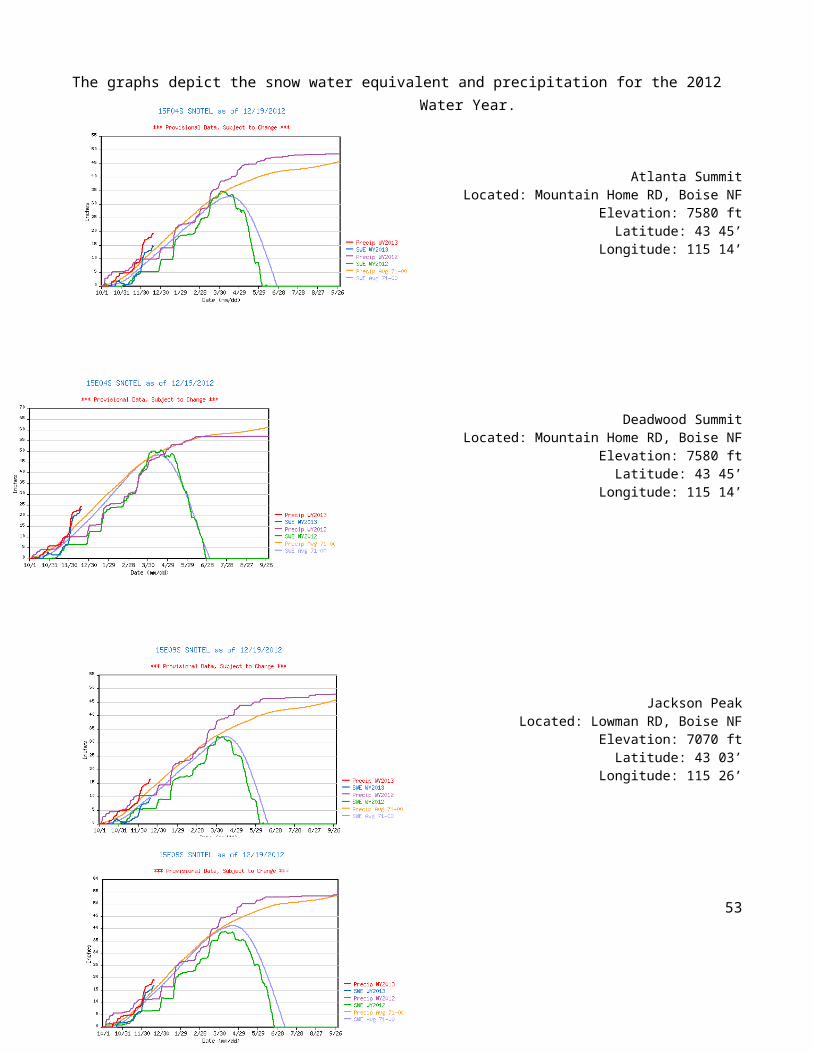
01-01
01-15
02-01
02-15
03-01
03-15
04-01
04-15
05-01
05-15
06-01
06-15
07-01
07-15
08-01
08-15
09-01
09-15
10-01
10-15
11-01
11-15
12-01
12-15
2012 280 120 100
2011 176 174 111
2008 185 185 166 100 79 79
2007 150 91 253 253 180 121 112
Avg 150 119 91 177 226 175 177 157 106 121 99 106 119 79
Low 150 119 91 93 175 170 165 120 100 121 79 100 119 79
01-01
01-15
02-01
02-15
03-01
03-15
04-01
04-15
05-01
05-15
06-01
06-15
07-01
07-15
08-01
08-15
09-01
09-15
10-01
10-15
11-01
11-15
12-01
12-15
2012 300 300 89 65
2011 289 157 122
2008 250 250 169 136 112
2007 300 264 262 262 215 89 103
Avg 300 300 264 275 281 193 199 129 129 89 117 84 112
Low 300 300 264 250 250 170 169 89 122 89 112 65 112
53
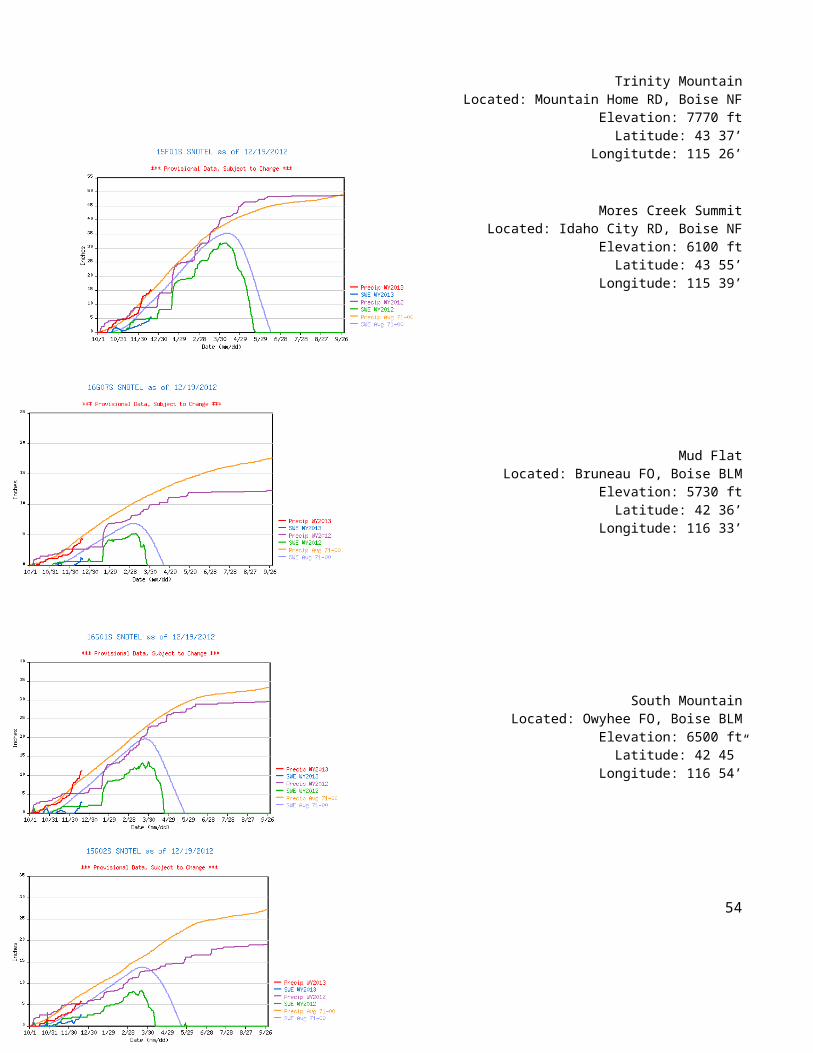
Idaho Department of Lands
Historically there are two sites that have been used to collect fuel samples: Boise Basin and Centerville. The following charts show only Centerville as it is the only one that has data for the past three years.
01-01
01-15
02-01
02-15
03-01
03-15
04-01
04-15
05-01
05-15
06-01
06-15
07-01
07-15
08-01
08-15
09-01
09-15
10-01
10-15
11-01
11-15
12-01
12-15
2012 23 9 16 9 1 6
2011 9 8 4
2010 40 36 40 17 15 21 7 4
2009 10 17 11
Avg 40 30 40 12 16 16 14 7 7 5 5 4
Low 40 23 40 9 15 9 7 1 3 3 1 4
01-01
01-15
02-01
02-15
03-01
03-15
04-01
04-15
05-01
05-15
06-01
06-15
07-01
07-15
08-01
08-15
09-01
09-15
10-01
10-15
11-01
11-15
12-01
12-15
2012 92 91 85 108 127 129
54
2011 103 125 116 112
2010 98 89 105 91 91 55 50 120
2009 92 91 100 120
Avg 98 91 105 94 89 88 77 120 116 117 115 116
Low 98 89 105 91 85 55 50 107 112 104 113 112
01-01
01-15
02-01
02-15
03-01
03-15
04-01
04-15
05-01
05-15
06-01
06-15
07-01
07-15
08-01
08-15
09-01
09-15
10-01
10-15
11-01
11-15
12-01
12-15
2012 127 169 168 138 111 101
2011 230 140 95 77
2010 105 120 221 191 250 69 67 76
2009 211 245 168 129
Avg 105 124 221 200 221 125 67 126 129 101 95 77
Low 105 120 221 169 168 69 67 111 129 101 95 76
55
01-01
01-15
02-01
02-15
03-01
03-15
04-01
04-15
05-01
05-15
06-01
06-15
07-01
07-15
08-01
08-15
09-01
09-15
10-01
10-15
11-01
11-15
12-01
12-15
2012 93 91 110 134 114 88
2011 131 113 100 91
2010 77 80 129 97 125 65 60 89
2009 95 123 132 108
Avg 77 87 129 104 119 110 60 114 108 88 100 90
Low 77 80 129 91 110 65 60 113 108 88 100 89
56


