32
Virgin Australia Holdings HY13 half year results 26 February 2013
Virgin Australia Holdings HY13 half year results26 February 2013

Introduction
1
• Delivered solid result despite market dynamics and economic environment
– Economic uncertainty
– Strong competitive capacity growth in the market
– Introduction of carbon tax
• Group yield1 outperformed the market
• International business maintained strong performance
• Strong cost control, even with major product and service enhancements
Delivery of consistent strategy to drive sustainable and resilient earnings
Note: 1 Group yield is based on passenger revenue, which includes earned revenue and ancillary revenue such as baggage and change fees

Significant progress on consistent strategy – next phase on track
2
• Transformation of the business with proposed strategic investments
– Received ACCC clearance for Skywest acquisition1
– Received shareholder approval for Tiger Australia joint venture2
• Successful implementation of Sabre system
• Singapore Airlines strategic investment completed – confidence in strategy
• Business efficiency program on track to deliver over $60m in FY13
• Velocity Frequent Flyer membership of 3.5m, up by around 500k on H1 FY12
• Interline and codeshare revenue increased 56.1% on H1 FY12
Note: 1 Subject to certain conditions, including approval by Skywest shareholders, the Foreign Investment Review Board and the Singapore High Court; 2 Subject to certain conditions, including approval by ACCC and the Foreign Investment Review Board

Financial highlights
3
• Statutory Profit After Tax of $23.0 million
• Underlying Profit Before Tax1 of $61.0 million
• Revenue growth of 5.4% on H1 FY12, building on 18.0% growth achieved on H1 FY11
• Outperformed the market on group yield2 growth
• Highest number of passengers in any half, up around 200k on H1 FY12 to over 10 million for the first time
• Strong cost control, even with major product and service enhancements – underlying CASK3 (excluding fuel) reduced by 1.5%
• Strengthened balance sheet with good liquidity, including existing debt pay-down of $151 million and free cash balance of $430 million
Note: 1 Underlying Profit / (Loss) Before Tax (PBT) is a non-statutory measure used by Management and VAH’s Board. Refer to page 4 for a reconciliation of statutory and underlying PBT; 2 Group yield is based on passenger revenue, which includes earned revenue and ancillary revenue such as baggage and change fees; 3 Underlying Cost per Available Seat Kilometre (CASK) is defined on page 30

Group Profit and Loss summary
4
• Note: 1 Hedging ineffectiveness is defined on page [x] 2 Underlying Profit / (Loss) Before Tax (PBT) is a non-statutory measure used by Management and VAH’s Board. Refer to slide [x] for a reconciliation of Statutory and underlying PBT.
Note: 1 Underlying Profit / (Loss) Before Tax (PBT) is a non-statutory measure used by Management and VAH’s Board; 2 Hedging ineffectiveness is a non-statutory measure and is defined on page 30
6 months ended 31 December 2012$m
2011$m
Revenue 2,106.0 1,997.4
Underlying Profit / (Loss) before Tax1 61.0 96.1
Business transformation (36.0) (10.5)
Hedging ineffectiveness2 3.2 (8.3)
Statutory Profit / (Loss) before Tax 28.2 77.3
Income tax (expense) / benefit (5.2) (25.5)
Statutory Profit / (Loss) after Tax 23.0 51.8

Domestic – EBIT summary
5
• 1. [Royston please use footnote from Jun-12 results]
Note: 1 Domestic EBIT is a non-statutory measure per note 6 of the Virgin Australia Holdings interim financial report for the half-year ended 31 December 2012 and reflects the allocation of ineffective cash flow hedges and non-designated derivatives to the segment
6 months ended 31 December 2012 $m
2011 $m
External revenues and other income 1,512.0 1,454.4
Domestic EBIT1 49.3 87.0
ASKs (m) 13,055 11,983
Passengers carried (m) 8.7 8.6

International – EBIT summary
6
• 1. [Royston please use footnote from Jun-12 results]
Note: 1 International EBIT is a non-statutory measure per note 6 of the Virgin Australia Holdings interim financial report for the half-year ended 31 December 2012 and reflects the allocation of ineffective cash flow hedges and non-designated derivatives to the segment
6 months ended 31 December 2012 $m
2011 $m
External revenues and other income 595.4 551.7
International EBIT1 35.4 32.2
ASKs (m) 8,148 7,960
Passengers carried (m) 1.4 1.3
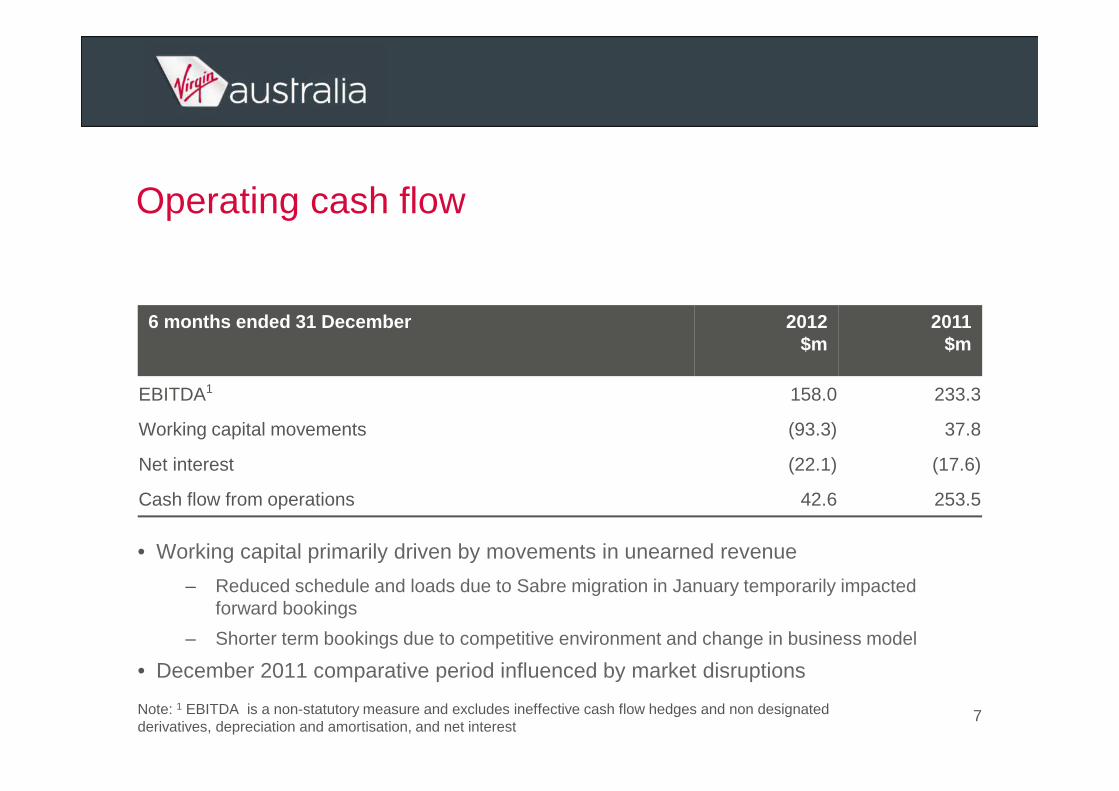
Operating cash flow
7
• Working capital primarily driven by movements in unearned revenue
– Reduced schedule and loads due to Sabre migration in January temporarily impacted forward bookings
– Shorter term bookings due to competitive environment and change in business model
• December 2011 comparative period influenced by market disruptions
Note: 1 EBITDA is a non-statutory measure and excludes ineffective cash flow hedges and non designated derivatives, depreciation and amortisation, and net interest
6 months ended 31 December 2012 $m
2011 $m
EBITDA1 158.0 233.3
Working capital movements (93.3) 37.8
Net interest (22.1) (17.6)
Cash flow from operations 42.6 253.5

Net cash flow
8
• Proceeds from share issue have been used to reduce debt and limit new borrowings
6 months ended 31 December 2012 $m
2011 $m
Cash flow from operations 42.6 253.5
Gross capital expenditure (including aircraft) (315.6) (406.8)
New capital expenditure funding 196.5 403.8
Debt reduction (151.4) (113.8)
Proceeds from share issue 105.3 -
Other items 4.0 (10.3)
Net cash inflow / (outflow) (118.6) 126.4

Balance sheet summary
9Note: 1 Net tangible asset backing per ordinary share
As at 31 Dec 2012 $m
30 Jun 2012 $m
Cash and cash equivalents 685.1 802.6
Property, plant & equipment, and intangible assets 3,047.7 2,870.0
Other assets 332.1 322.6
Total Assets 4,064.9 3,995.2
Interest bearing liabilities 1,707.1 1,674.1
Unearned revenue 624.0 691.9
Other liabilities 648.3 699.5
Total Liabilities 2,979.4 3,065.5
Net assets 1,085.5 929.7
NTA1 per share (AUD cents) 38.2 37.8
Reduction in gearing levels

Treasury & capital management
10
• Good liquidity profile and low refinancing risk as at 31 December 2012
– Cash balance of $685m with free cash of $430m
– No debt facilities require refinancing
– Credit approved financing for all 2013 aircraft deliveries
• Hedging policy provides short term certainty in a volatile environment
Note: 1 Figures as at 25 February 2013
Hedging summary Brent
Remainder of FY131
Operating requirements hedged 87%
Participation in favourable price movements 52%
Worst case hedged rate (inclusive of option premium) AUD 108/bbl

Domestic market capacity
11
• Highest total market capacity growth since the launch of Jetstar in 2004 – 10.8% in 1H FY13
• Virgin Australia capacity growth as planned based on strategic objectives
• Increased competitor capacity to maintain market share goal
– Market Sydney-Melbourne growth was 15.1%, comparatively Virgin Australia grew 2.8%
• Aggressive competitive pricing due to capacity growth above passenger demand growth
Source: Bureau of Infrastructure, Transport and Regional Economics (BITRE); Diio Mi
Sydney-Melbourne capacity growth by airline(1H FY13)Percent
57%
11%
3%
0
20
40
60
JetstarQantas Group
Virgin Australia

Domestic business – continuing to enhance guest experience
12
• Roll out of business class on E190 fleet complete
• Wireless IFE roll-out on domestic jet fleet – 80 aircraft by end of 2013
• New Cairns, and upgraded Melbourne and Sydney Lounges in 2013
• Opened new pier extension in Sydney domestic
• Opening new Canberra terminal in March
• Launching inclusive F&B on flights over 2:45 hrs from April
• Consideration for next domestic business trip up 7ppt1
Note: 1 Domestic airline consideration – next business trip, 12 monthly moving averageSource: Roy Morgan Research

Leading major brand for OTP
13Note: 1 Includes F100 operations; 2 Excludes JetstarSource: Bureau of Infrastructure, Transport and Regional Economics (BITRE)
6 months ended 31 December 2012 Departures Arrivals
‘Mainline’ operations
Virgin Australia1 83.8% 79.9%
Qantas 84.4% 81.8%
Regional operations
Virgin Australia – ATR turboprop operations 84.5% 81.9%
QantasLink 78.0% 74.6%
Total brand operations
Total Virgin Australia 83.9% 80.1%
Total Qantas2 81.4% 78.5%

Expanding the domestic footprint – entering monopoly markets
14
• Brisbane-Perth: double daily weekday A330 services from May
• Brisbane-Moranbah: 3 per weekday ATR services from April (current monopoly route)
• Brisbane-Bundaberg: daily ATR services from May (current monopoly route)
• Additional 11 ATR-72s delivered by end of FY15
• Proposed Skywest acquisition1 will add 20 aircraft to regional fleet
• H2 FY13 – domestic capacity growth of between 5-7%
Note: 1 Subject to certain conditions, including approval by Skywest shareholders, the Foreign Investment Review Board and the Singapore High Court
Growth plans on strategy – focus on yield and RASK improvements, not market share

International business – maintaining strong performance
15
• All strategic alliance partnerships online since start of FY13 – benefits flowing
• Strong interline and codeshare revenue growth of +56%
• Commenced codeshare to Europe via Singapore from Adelaide, Perth and Darwin –expanding to Sydney, Melbourne and Brisbane in Q3 FY13
• Enhanced food and beverage offer across all international services
• Access to global network of over 150 lounges
• Launched Round the World and Circle Pacific fares with Singapore Airlines – more to follow
– Round the World fares cover 85 destinations in 35 countries, and Circle Pacific fares cover 36 destinations in 13 countries

16Note: 1 Does not include all New Zealand domestic destinations; 2 Does not include all Delta destinations; 3 Some destinations subject to regulatory approval
Honolulu
Cincinnati
Atlanta
Tampa
Ottawa
Detroit
New Orleans
Raleigh
ColumbusIndianapolis
Kona
Lihue Kahului
Miami
Philadelphia
Houston
Memphis
Minneapolis
Salt Lake City
Sacramento
Cancun
GuadalajaraPuerto Vallarta
San Diego
Baltimore
Phoenix
Johannesburg
New York
Boston
San Francisco
Orlando
Fort Lauderdale
Washington
SeattleLondon
To / from LON
To / from USToronto
Las Vegas
DallasHong Kong
Portland
Singapore
Athens
Brussels
Paris
Moscow
Dublin
Frankfurt
Geneva
Munich
MilanIstanbul
Larnaca
London
ManchesterMinsk
Casablanca
Cairo
Abu Dhabi
Muscat
Tehran
Kuwait
Doha
RiyadhJeddah
BahrainDamman
AmmanBeirut
Damascus
Khartoum
Almaty
To / from AUH
To / from US
Astana
Karachi
Lahore
Islamabad
Peshawar
Chicago
Alexandria
Baghdad
Erbil
NairobiKuala Lumpur
LangkawiColombo
Kathmandu
Osaka
TokyoBeijing
HyderabadMumbai
Thiruvananthapuram
Penang
Kota KinabaluBrunei
Kuching
Phnom PenhSiem Reap
Balikpapan
Davao
Ho Chi Minh City
Lombok
Manado
MedanPekanbaru
Nagoya
Jakarta
PhuketYangon
Ahmedabad
Male
KochiCoimbatore
Bengaluru
Kolkata
Delhi
Chennai
Kunming XiamenTaipei
ChengduChongqing
Hong Kong
Fukuoka
Seoul
ManilaCebu
Shanghai
ShenzenGuangzhou
SurabayaSolo City
Palembang
BangkokChiang Mai
Dhaka
Da NangHanoi
Cape Town
Amsterdam
Copenhagen
Zurich
Barcelona Rome
Cairns
Gold Coast
Rotorua
Sunshine Coast
AucklandHamilton
Wellington
Christchurch
DunedinQueenstown
Melbourne
Brisbane
Los Angeles
Cairns
Port MoresbyDenpasar
Honiara Port Vila
Nadi
Rarotonga
Apia
Nuku’alofa
Perth
Adelaide
Abu Dhabi
Sydney
Darwin
Added 73 new codeshare destinations in H1 FY13
Plans for at least 24 further destinations3 in H2 FY13
16
Virgin Atlantic
Virgin America
Etihad
Air NZ1
Delta2
Singapore / Silk
Hawaiian
Virgin Australia

Partnerships continue to expand
17
412 operated and codeshare services across New Zealand per week1, connecting to 23 destinations across New Zealand
Note: As at December 2012; 1 Total Virgin Australia operated and partner codeshare services from all Australian ports
Full reciprocal frequent flyer earn & burn, and status recognition around the world
Air New Zealand
Delta
Etihad
21 operated and codeshare services to Los Angeles per week1, connecting to 179 destinations in North America
28 operated and codeshare services to Abu Dhabi per week1, connecting to 17 destinations in Asia and 42 across Europe, the Middle East and Africa
Singapore Airlines
112 codeshare services to Singapore per week1, connecting to 64 destinations throughout Asia and 14 across Europe and Africa

Fleet – 4.2 years average age at 30 June 2013
18Note: Figures up to end of December 2012 – firm deliveries only and excludes additional options and purchase rights
Dec 2012 Deliveries Retirement / lease return
Jun 2013 Jun 2015
Narrow body
B737-700 4 0 1 3 2
B737-800 68 1 1 68 76
E170 0 0 0 0 0
E190 18 0 0 18 18
Wide body
A330-200 5 1 0 6 8
B777-300ER 5 0 0 5 5
Turboprop
ATR-72 8 4 0 12 19

On track for delivery on a consistent strategy
19
Build a transformational loyalty business
Further enhance guest experience through innovation inflight and on-the-ground
Continue to develop our people and service excellence – our key differentiator
FY13 FY14 FY15
Implement business efficiency project
Increase access to global markets
% completed“Game On” phase

Implementing business efficiency project
20
• Early efficiency savings are being realised – on track for FY13 goals
• Focused on structural change as opposed to short term business as usual efforts
• Twelve key metrics have been identified to drive efficiencies and measure performance
– Achievement of KPI’s will drive cost outcomes
Business efficiency project run rate targets(FY13-FY15)
Annual run rate targets
FY13 $60+ m
FY14 $120m
FY15 $200m
Business efficiency project delivered gains of $25 million in H1 FY13, on track to deliver over $60 million for FY13

Building a transformational loyalty business
21
• Membership continues to grow – 3.5m as at December 2012, up ~500k members from December 2011
• Program of 400 global partners – new partners include Morgans Hotel Group and ASOS
• Rewards redemption continues to grow strongly – points redeemed growth of +48% on H1 FY12
• Full commencement of reciprocal earn and burn on international partner airlines
– 113% growth in points earned on airline alliance partners
Velocity membership base(Dec 10-Dec 12)Millions of members
2.5
3.5
3.0
Dec 12
3.5
3.0
0.0Dec 10 Dec 11
2.4
+600k
+500k

Interline and codeshare revenue
22
• Substantial growth in revenue supported by continued growth in passenger volumes and yield
• Interline and codeshare2 revenue growth of +56%
• Interline and codeshare2 passenger growth of +37%
• Alliance partner airlines key to growth performance
Strategic alliances1 revenue growth(H1 FY12-H1 FY13)Millions of dollars
Strategic alliances1 passenger growth (H1 FY12-H1 FY13)Thousands of passengers
H1 FY12 H1 FY13
+79%
+69%
Note: 1 Includes Air New Zealand, Delta, Etihad and Singapore Airlines; 2 Interline and codeshare on Virgin Australia domestic and short haul international services only, excludes Virgin Australia long haul international services
H1 FY12 H1 FY13

Sabre reservation system implemented Jan 2013
23
“This has been one of our most complex migrations. Transitioning to a ticketing environment , moving from two reservation systems to a third, retiring the DJ code AND
achieving it all in just over 12 months.”
Hugh Jones, President Sabre Airline Solutions
• Ongoing work to improve systems and introduce enhancements to occur over the next couple of months
• Access to global GDS – allows travel agencies worldwide to book on Virgin Australia
– Activation of Travelsky GDS in China on track for implementation by end of FY13
Note: GDS: Global Distribution System
Benefits already seen – proportion of bookings through GDS have increased five-foldBookings though GDS channels typically have a 10% yield premium to average

Proposed transactions update
24
• Received ACCC clearance
• Accelerated expansion and earnings growth in the fly-in-fly-out (FIFO) and regional markets
• Anticipated completion by end of April 2013
• Received Tiger Airways shareholder approval
• Will increase competition to the benefit of Australian consumers
• Proposed ACCC’s findings announcement –14 March 2013
Proposed Skywest acquisition1 Proposed Tiger Australia joint venture2
Will be the lowest cost operator in all market segments
Corporate / government & leisure
BudgetRegional& charter
Note: 1 Subject to certain conditions, including approval by Skywest shareholders, the Foreign Investment Review Board and the Singapore High Court; 2 Subject to certain conditions, including approval by ACCC and the Foreign Investment Review Board

A leader in customer service and satisfaction
Skytrax World Airline Awards
• ‘Best Airline’ in the Australia Pacific region
• ‘Best Staff Service’ in the Australia Pacific region – second consecutive year
CSIA Australian Service Excellence Awards
• National Division of a Large Business –Virgin Australia Lounge
• National Customer Service Team of the Year – Virgin Australia Cabin Crew
Domestic Airline of the Year –Roy Morgan Customer Satisfaction Awards
25

• Formulate Game Change strategic plan and commence implementation
Plan & implement
FY11
• Conclude roll out of Game Change strategic plan and begin benefits realisation from H2 FY12
Reposition
FY12
• Build upon strategic re-positioning on a strengthened domestic market position and commence Game On phase
Lead & leverage
FY13
Continuing consistent growth strategy and plan
26
• Drive future earnings growth through Game On phase
Growth
FY14
• Positioned to continue sustainable and resilient earnings growth
Sustainability
FY15
�
�

What will drive Virgin Australia forward?
27
• Fully formed global alliance network
• Sabre – expanded global distribution and reach
• Rapidly expanding loyalty program
• Innovative domestic product introduced
• Strong embedded cost disciplines
• Lowest cost operator in all market segments1
• Award winning customer service
Note: 1 Proposed Skywest acquisition and Tiger Australia joint venture subject to certain conditions as outlined on page 24
Strong shareholder base

Outlook
28
Consistent with the guidance provided at our Annual General Meeting on 20 November 2012, while we currently expect an improved underlying Profit Before Tax in Financial
Year 2013 compared to Financial Year 2012 (excluding the impact of the proposed Skywest Airlines acquisition and Tiger Australia joint venture), the uncertainty in
economic conditions and the competitive environment precludes us from providing a profit guidance for the year.

29

Definitions
30
Definitions:
Underlying Cost per Available Seat Kilometre (CASK): Total revenue less underlying Profit Before Tax and the following: fuel, carbon tax, hedging ineffectiveness, third party loyalty redemption costs and revenue relating to non-ticket or nil margin activities. This revenue is not included in the definition of yield.
Hedging ineffectiveness: H1 FY13 excludes the $10.8m benefit of time value ineffective hedges which is included in underlying profit / (loss) before tax. The time value for H1 FY12 was an expense of $13.5m which is excluded from the underlying profit / (loss) before tax.

ASIC guidance
31
ASIC guidance:
In December 2011 ASIC issued Regulatory Guide 230. In order to comply with this Guide, Virgin Australia is required to make a clear statement about whether information disclosed in documents other than the financial report has been audited or reviewed in accordance with Australian Auditing Standards. The following non-IFRS information has not been audited or reviewed by KPMG: underlying Profit Before Tax, domestic EBIT, international EBIT, segment EBIT and other items. This presentation has not been audited or reviewed by KPMG; however, IFRS data has been derived from the interim financial statements that have been reviewed by KPMG.


