Page 1
Ann Battle Macheras
Vice President, Regional Research and Economic Education
Research Department
Virginia Economic Outlook
VML-VACo Finance Forum
January 4, 2017
The views and opinions expressed herein are those of the author. They do not
represent an official position of the Federal Reserve Bank of Richmond or the
Federal Reserve System.
Page 2
Overview
• National Economic Trends– Gross Domestic Product
– Household Spending and Income
– Labor Market
– Inflation
• Virginia Economic Overview– Labor Market
• Metro Area Growth
• Unemployment Rate
• Industry Growth
– Housing
2
Page 3
National Economic Trends
3
Page 4
-10
-8
-6
-4
-2
0
2
4
6
2008 2009 2010 2011 2012 2013 2014 2015 2016 2017 2018 2019 2020
% Change, SAAR
Q3: 2016
US: 3.5%
U.S. Real Gross Domestic Product
Source: Bureau of Economic Analysis via Haver Analytics,
Federal Reserve Board of Governors
4
Page 5
Real Investment in Equipment
Source: Bureau of Economic Analysis via Haver Analytics
-50
-40
-30
-20
-10
0
10
20
30
40
2007 2008 2009 2010 2011 2012 2013 2014 2015 2016 2017 2018
% Change, SAAR
3Q: 2016-4.5%
5
Page 6
Real Investment in Nonresidential Structures
Source: Bureau of Economic Analysis via Haver Analytics
-40
-30
-20
-10
0
10
20
30
40
2007 2008 2009 2010 2011 2012 2013 2014 2015 2016 2017 2018
% Change, SAAR
3Q: 201612.0%
6
Page 7
Personal Income and Expenditures
Source: Bureau of Economic Analysis/Haver Analytics
-10
-8
-6
-4
-2
0
2
4
6
8
2007 2008 2009 2010 2011 2012 2013 2014 2015 2016 2017 2018
YoY % Chg Real Personal Consumption Expenditures
Real Personal Income
November 2016
RPCE: 2.8%RPI: 3.0%
7
Page 8
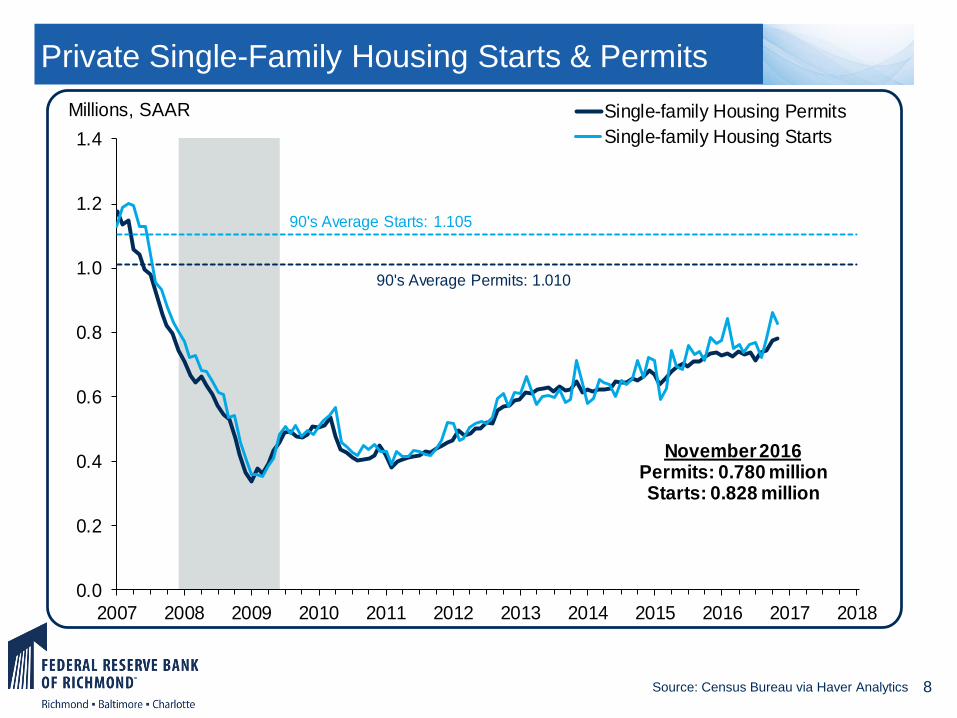
Private Single-Family Housing Starts & Permits
Source: Census Bureau via Haver Analytics
0.0
0.2
0.4
0.6
0.8
1.0
1.2
1.4
2007 2008 2009 2010 2011 2012 2013 2014 2015 2016 2017 2018
Millions, SAAR Single-family Housing Permits
Single-family Housing Starts
November 2016Permits: 0.780 millionStarts: 0.828 million
90's Average Permits: 1.010
90's Average Starts: 1.105
8
Page 9
Private Multi-Family Housing Starts & Permits
Source: Census Bureau via Haver Analytics
0.0
0.1
0.2
0.3
0.4
0.5
0.6
0.7
2007 2008 2009 2010 2011 2012 2013 2014 2015 2016 2017 2018
Millions, SAAR
Multi-family Housing Permits
Multi-family Housing Starts
November 2016Permits: .432 millionStarts: .262 million
90's Average Permits: 0.313
90's Average Starts: 0.268
9
Page 10
-800
-700
-600
-500
-400
-300
-200
-100
0
100
200
300
400
2006 2007 2008 2009 2010 2011 2012 2013 2014 2015 2016 2017
Average Monthly Change, Thous.
Total Employment Growth
Monthly Change
September: 208
October: 142
November: 178
Source: Bureau of Labor Statistics/Haver Analytics
10
Page 11
Unemployment Rate
Source: Bureau of Labor Statistics/Haver Analytics,
Federal Reserve Board of Governors
0
1
2
3
4
5
6
7
8
9
10
11
2008 2009 2010 2011 2012 2013 2014 2015 2016 2017 2018 2019 2020
Percent
November 2016
US: 4.6%
11
Page 12
Labor Force Participation
Source: Bureau of Labor Statistics via Haver Analytics
52
54
56
58
60
62
64
66
68
1952 1957 1962 1967 1972 1977 1982 1987 1992 1997 2002 2007 2012 2017
Percent of Population
November 2016
US: 62.7%
12
Page 13
Average Hourly Earnings
Source: Bureau of Labor Statistics via Haver Analytics
0.0
0.5
1.0
1.5
2.0
2.5
3.0
3.5
4.0
2008 2009 2010 2011 2012 2013 2014 2015 2016 2017 2018
YoY % Chg
November: 2.5%
13
Page 14
Consumer Price Index
Source: Bureau of Labor Statistics/Haver Analytics
-3
-2
-1
0
1
2
3
4
5
6
2006 2007 2008 2009 2010 2011 2012 2013 2014 2015 2016 2017 2018
YoY % Change All Items
Core CPI
November 2016
All Items: 1.7
Core CPI: 2.1
14
Page 15
Dec. 14th - FOMC Summary of Economic Projections
Source: Federal Reserve Board of Governors, SEP Dec. 14, 201615
Page 16
Money Market Rates
Source: Board of Governors via Haver Analytics, as of Dec. 30 2016
0.00
0.20
0.40
0.60
0.80
1.00
1.20
1.40
2010 2011 2012 2013 2014 2015 2016 2017 2018
Percent
Primary Credit Rate
3M LIBOR
Federal Funds Rate
16
Page 17
Capital Market Rates
Source: Board of Governors via Haver Analytics, as of Dec. 30 2016
0
1
2
3
4
5
6
7
8
9
10
11
2009 2010 2011 2012 2013 2014 2015 2016 2017 2018
Percent
10-Yr Treasury Bond Rate
Corporate BBB Bond Rate
30-year Fixed Mortgage Rate
Corporate AAA Bond Rate
17
Page 18
Virginia Economic Overview
18
Page 19
Virginia Payroll Employment
Source: Bureau of Labor Statistics/Haver Analytics
-6
-5
-4
-3
-2
-1
0
1
2
3
4
2006 2007 2008 2009 2010 2011 2012 2013 2014 2015 2016 2017
YoY % Chg (SA) U.S.
Virginia
November 2016
US: 1.6%
VA: 1.0%
19
Page 20
State Employment Growth
Source: Bureau of Labor Statistics
20
Page 21
MSA Payroll Employment Growth in Virginia
3.3
2.6
2.2
1.6
1.0
0.8
0.3
0.2
-0.2
-0.3
-0.7
-1 0 1 2 3 4
Charlottesville
Winchester
Northern Virginia
US
Virginia
Richmond
Roanoke
Harrisonburg
Virginia Beach
Blacksburg
Lynchburg
YoY Percent Change (SA)
November 2016
Source: Bureau of Labor Statistics/Haver Analytics
21
Page 22
Virginia Unemployment Rate
0
1
2
3
4
5
6
7
8
9
10
11
2006 2007 2008 2009 2010 2011 2012 2013 2014 2015 2016 2017
Percent U.S.
Virginia
November 2016
US: 4.6%
VA: 4.2%
22
Page 23
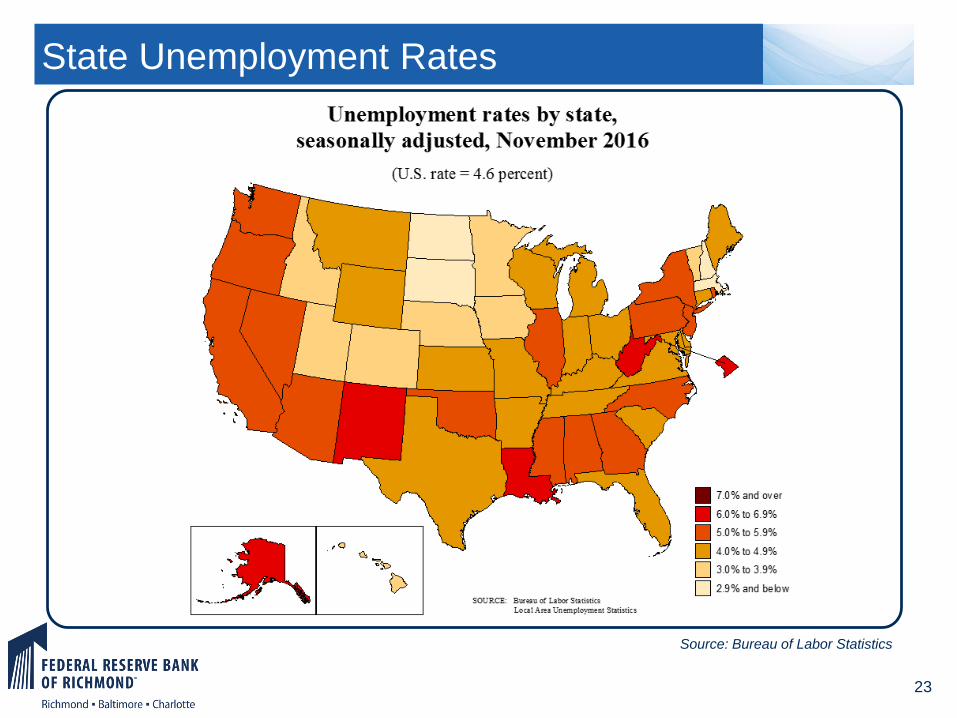
State Unemployment Rates
Source: Bureau of Labor Statistics
23
Page 24
Virginia Industry Composition - 2015
0.5%
4.9%
6.2%
17.3%
1.9%5.0%
18.7%
12.8%
10.3%
3.6%
0.3%
18.5%
Share of Total EmploymentNatural resources and mining
Construction
Manufacturing
Trade, transportation, andutilities
Information
Financial activities
Professional and businessservices
Education and healthservices
Leisure and hospitality
Other services
Unclassified
Government
24
Source: Bureau of Labor Statistics
Page 25
Virginia Industry Growth
1.6
-11.5
2.4
-0.4
1.2
0.5
1.9
2.9
2.6
1.9
1.3
1.0
1.0
-8.0
0.9
-2.5
0.9
-3.7
0.5
2.1
2.2
1.4
1.9
0.3
-14 -12 -10 -8 -6 -4 -2 0 2 4
Total
Natural Resources & Mining
Construction
Manufacturing
Trade, Transportation & Utilities
Information
Financial Activities
Professional & Business Services
Education & Health Services
Leisure & Hospitality
Other Services
Government
YoY % Chg (SA)
November 2016
U.S.
Virginia
25
Source: Bureau of Labor Statistics
Page 26
VA Industry Growth – Net Job Change
-0.9
2.6
-2.2
7.7
-0.6
2.3
13.4
13.6
13.9
3.5
7.3
-2.7
Natural resources and mining
Construction
Manufacturing
Trade, transportation, and utilities
Information
Financial activities
Professional and business services
Education and health services
Leisure and hospitality
Other services
Unclassified
Government
-6.0 -1.0 4.0 9.0 14.0 19.0
Thousands
Employment Growth (thousands) - June 2015 - June 2016
26
Source: Bureau of Labor Statistics
Page 27
Industry Comparison – Wages by Sector
$1,011
$813
$976
$1,065
$773
$1,750
$1,392
$1,515
$892
$368
$783
$893
$1,048
Total
Natural resources and mining
Construction
Manufacturing
Trade, transportation, and utilities
Information
Financial activities
Professional and business services
Education and health services
Leisure and hospitality
Other services
Unclassified
Government
$0 $500 $1,000 $1,500 $2,000
Average Weekly Wage - 2016, 2nd Quarter
27
Source: Bureau of Labor Statistics
Page 28
Industry Growth – Wages by Sector
-18.4
67.8
-157.2
186.4
36.1
158.3
326.3
368.8
118.0
63.2
93.2
153.9
Natural resources and mining
Construction
Manufacturing
Trade, transportation, and utilities
Information
Financial activities
Professional and business services
Education and health services
Leisure and hospitality
Other services
Unclassified
Government
-200.0 0.0 200.0 400.0
Millions
Growth in Total Wages (millions) - June 2015 - June 2016
28
Source: Bureau of Labor Statistics
Page 29
Industry Projections – Sec. of Finance
1.0
3.5
1.4
0.0
-1.6
2.3
1.3
1.1
0.5
1.5
4.6
1.2
1.3
-0.4
3.5
2.0
1.0
0.5
2.4
2.1
0.2
2.9
2.2
3.7
3.5
4.1
0.2
-2.0 -1.0 0.0 1.0 2.0 3.0 4.0 5.0
Total Nonagricultural Employment
Construction and Mining
Manufacturing
Trade, transportation, and utilities
Financial activities
Professional and business services
Education and health services
Leisure and hospitality
Government
Employment Growth by Industry - FY16 to FY18
FY18
FY17
FY16
29
Source: Presentation by Secretary of Finance to the Joint Money
Committees, Dec. 16, 2016 (projections from IHS Markit)
Page 30
Summary
• National economy is growing at a moderate pace that is
expected to continue
– Businesses seem less optimistic than the consumer, although
business investment is improving
– Labor market strong by most measures
– Inflation moderating back toward 2 percent goal
• Some uncertainty with change of administration; some
indications of fiscal expansion but many unknowns
• Virginia’s economy had been growing on par with U.S. but
may be slowing more recently; data subject to revision…
• Largest industry sectors in Virginia provide biggest boost to
jobs, but not necessarily to wages
30
Page 31
31
Access publications and other
information online at:
richmondfed.org/research/regional_economy
federalreserve.gov
FederalReserveHistory.org
Follow the Richmond Fed on:
twitter.com/richmondfed
youtube.com/richmondfed
facebook.com/federalreservebankofrichmond
Learn More
31